DOI:10.32604/cmc.2021.018023
| Computers, Materials & Continua DOI:10.32604/cmc.2021.018023 | |
| Article |
Competency Driven Resource Evaluation Method for Business Process Intelligence
1Department of Computer Science, COMSATS University Islamabad, Lahore, Pakistan
2Universiti Teknologi PETRONAS, Bandar Seri Iskandar, Tronoh Perak, Malaysia
3Department of Computer Science, University of Tabuk, Tabuk, Saudi Arabia
4Punjab University College of Information Technology, University of the Punjab, Lahore, Pakistan
*Corresponding Author: Abid Sohail. Email: abidbhutta@cuilahore.edu.pk
Received: 22 February 2021; Accepted: 03 April 2021
Abstract: Enterprises are continuously aiming at improving the execution of processes to achieve a competitive edge. One of the established ways of improving process performance is to assign the most appropriate resources to each task of the process. However, evaluations of business process improvement approaches have established that a method that can guide decision-makers to identify the most appropriate resources for a task of process improvement in a structured way, is missing. It is because the relationship between resources and tasks is less understood and advancement in business process intelligence is also ignored. To address this problem an integrated resource classification framework is presenting that identifies competence, suitability, and preference as the relationship of task with resources. But, only the competence relationship of human resources with a task is presented in this research as a resource competence model. Furthermore, the competency calculation method is presented as a user guider layer for business process intelligence-based resource competence evaluation. The computed capabilities serve as a basic input for choosing the most appropriate resources for each task of the process. Applicability of method is illustrated through a heathcare case study.
Keywords: Data sciences; artificial intelligence; business process management; business process improvement; process warehouse; data warehouse; resource competency; resource competency modeling; health care
While enterprises are focusing on achieving competitive advantages by delivering quality services, Business process management (BPM) has established itself as a vital instrument for enterprises to achieve competitive advantage. It is because BPM offers a structured, coherent, and consistent way of understanding, documenting, modeling, analyzing, simulating, executing, and measuring the business operations of an enterprise [1]. According to Zur Muehlen [2], processes are described in software called business process management system, followed by assignment of resources to activities. For execution, the assigned resources are responsible for the execution of the task.
Business process improvement is a continuous process for the optimization of organizational activities and processes. The improvement process consists of a series of systematic approaches. For this analysis and evaluation of process execution for optimal performance, benchmarks are required [3]. These benchmarks are set by organizational quality management departments to achieve efficiencies in process execution. Betterment is an alignment of process execution with business goals.
During the execution of a process, traces of executed events are maintained in log files, these log files serve as a useful source for posterior analysis of resources performance. These log files contain information, such as start time, end time, success, and failure of activities. However, these files are insufficient in the provision of useful information for analysis and evaluations due to their temporary storage and larger size. Hence, it is required to organize these data files in a structured way to ensure the availability of transactional data, as well as event trace data, due to the reason that only even log is not sufficient for analysis [4]. Therefore, previous studies have argued that Process Warehouse (PW) should be used as a primary source of information. PW maintains a separate repository, and it is populated with the integration of historical data of both event logs and transactional data. PW is very similar to a data warehouse, however, it captures data from event logs [5] and provides a multi-dimensional view of information for strategic and tactical decision making. A key limitation about the use of PW is that decision-makers require skill and experience. The process execution information is extracted from PW and it is used for decision making.
The aim of this research is to provide a user-guided layer between process warehouse and end-user dashboard to facilitate an inexperienced decision-maker. Zellner [6] argued that it requires an information model that depicts what information can exactly evaluate resource performance. Previous studies on resources management had established that both human resources and non-human resources collectively make the process execution optimal. For instance, in an example task of ‘in time delivery of pizza,’ both human resources and non-human resources are required to perform their effective role. Human beings are independent in their attitude [7] and show flexibility in different psychological and social intensions. It is due to human beings’ personality traits and different behaviors along with different working conditions [8]. On the other hand, non-human resources are fixed in their working behaviors. Therefore, it is argued that human resource expertise and behaviors can make the process executions optimal. But we cannot ignore the importance of non-human resources. Previous studies on resource evaluations and task assignments [9,10] only consider human resources while completely ignoring non-human resources. In other studies, non-human resources are included in analysis and evaluation [11,12] but operating them in a cohesive relationship with human resources. According to Heravizadeh et al. [13], the quality dimensions of human resources are different from non-human resources. It is already argued that different types of resources leave a different impact on process performance; therefore, similar criteria/parameters cannot be used for evaluation. Considering this as a motivation, in this study, we have presented a resource competence evaluation method that stems from the competence information model. The performance of all resources used in the execution of a task cannot be evaluated through the same evaluation criteria (i.e., only resource operational expertise competence). To identify evaluation criteria for each resource class, relationship with task is to determine and presented as an Integrated resource classification framework (IRCF). The presented IRCF is rooted in the resource management literature [2,8,13,14]. Russell et al. [15] provides data patterns for workflow data utilization. These patterns are equally important in performance evaluations. Russell et al. [15] has provided four patterns for performance evaluation. Identified patterns are very helpful in the differentiation of resources in the working environment. The proposed performance evaluation method is can only explore for patterns 1 and 2. Performance evaluation pattern three and four are not under consideration in this study.
According to the IRCF, there are three relationships between resources (human and non-human) and tasks. These are: a) the association between human resources and tasks should be measured in terms of the capability of human resources to perform a task, called competency, b) The association between non-human resource and the task should be measured in terms of the appropriateness of non-human resource for the task, called suitability, c) the association between human resources and non-human resources should be measured in terms of inclination of human resources to use non-human resources, called preference [11]. This study focuses on resource competence evaluation which is effective when the selection of appropriate human resources is among experienced ones. The presented resource competence model is linked with the theoretical work presented in Griffin et al. [14]. The resource competence evaluation method is used to extract information from PW and finally, the calculated competencies are shown on five-level ordinal scales. Reaming paper is organized as following, Section 2 presents an integrated resource classification framework; Section 3 presents the information model for resource competence evaluation, the resource competence calculation method is presented in Section 4. Finally, Section 5 presents an illustration of the proposed artifact through a healthcare case study.
2 Integrated Resource Classification Framework
Resources are categorized into human-agent and non-human resources. Both categories are coupled together in a strong working relationship for process execution. This makes process performance dependent on the performance of the involved resources. This study exemplifies it with a typical surgical procedure process that involves human resources (surgeons and nurses) and non-human resources (surgical instruments and medicines). The absence of surgeon (human agent) work proficiencies can be the one reason for unsuccessful surgery process, the other reason could be the inappropriate devices or medicine. For the identification of the exact reason, we have to explore it after considering all evaluation aspects. These are competence of surgeon and competence of supporting staff, resources suitability, and choice of non-human resources for the surgical process. This example concluded that resources are evaluated based on the combined performance of all the resources. Human agents show the variation of performance according to their attitude and choice [7] as the working behavior of humans is dependent on their mood. On the other hand, non-human resources are fixed with their behaviors
Organizations are continuously striving to improve their processes through the appropriate assignment of resources. Resources including performer (human agents) and devices (non-human resources) are coupled cohesively. Resources are considered to be crucial and integral for the optimal execution of processes [15]. It is argued by Sohail et al. [11,13]: “the two types of resources have a different impact on the performance of a process. Therefore, their performance should be evaluated differently i.e., the same criteria/parameters should not be used for the evaluation of both types of resources.” A resource classification framework is introduced by [13] and shown in Fig. 1. The IRCF is introduced to provide business process analysis for resource management and following resource relationships to task should be considered.
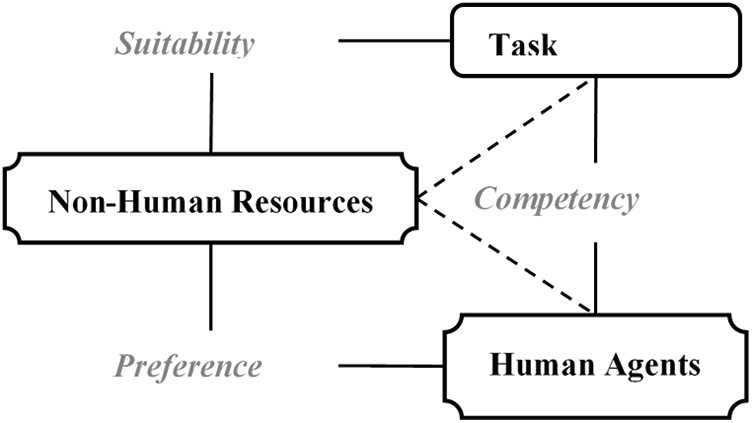
Figure 1: Integrated resources classification framework [13]
3 Resource Competency Modeling
This is the first-ever attempt to create the competency metamodel as we were unable to explore a model that considered all aspects related to working behaviors. of study but we were. The competency model was explored from the business process analysis domain. The Griffin’s model [14] was trimmed to suit the resource competency metamodel by following the techniques provided by [16,17]. The resultant resource competency metamodel (information model) then served as a performance evaluation guide for the PW-based methodology evaluation of competency.
Resources in the process environment are categorized into human and non-human and are cohesively linked with tasks during process executions. The performance of a process largely depends on the appropriate selection of resources and effective monitoring. Monitoring is defined as the observation of resource executions during task enactment of process activities where humans show a variety of differences in behavior and attitudes [8]. Behaviors consequent to interest in work and other attitudes can be observed as an accepted state of mind at a given time [7,18]. Human agent attitudes can be changed by motivation towards work and competencies for a given activity are not always a trademark because most of the time they are fully dependent on behavior and mood [14]. One human agent can perform the same task with the same set of non-human resources more efficiently than another assuming similar environmental conditions. From that, we conclude that non-human resources are fixed in functionality and cannot be further optimized. However, human resources are amenable to behavioral modification and their performances can improve with appropriate input. For instance, nurses-a and b have an assigned task of implementing an IV injection. Both use the same toolset under the same conditions, but we observe that one performs better due to experience and the acquired skill. From this difference in the skill, we cannot say nurse-a is more competent as we also contend that only one proficiency cannot determine one’s overall competence. The latter determination includes consideration of other facts, such as adaptivity to change and self-initiation when confronted by challenges. Therefore, we contend that a model is required that considers all facets of work behaviors that encompass every aspect of efforts exerted by human resources [14]. Presently, most available methods derive from the domain of workflow management systems and only consider proficiency.
Assessment of a worker’s performance and obtaining worker satisfaction on performance evaluation is always difficult. Workers do show concerns if the assessment process does not consider their overall effort. For example, an ICU doctor requires a skilled and duty-bound in the odd hours. The required skill set includes expertise in wound treatments, assisting physician, identification of critical situations of patients, ventilator monitoring, medication, diagnostic test, lifesaving situation response, and providing information to patient families. Some tasks are doctor’s technical competence and others are non-technical that are related to doctor’s behavior are also required. The giving of information to patient families cannot be measured from a proficiency perspective because the appropriate attitude better relates to one’s self-initiation, direction, and the doctor needs a fitting human resource to cope with uncertain conditions. As these self-oriented and inter-personal attitudes have no direct relation to proficiency, a skill (proficiency, technical) based evaluation system cannot evaluate them properly. Hence, it is strongly argued that a competency evaluation model is required that considers expertise, self-initiation, and adaptivity to change in resource competency evaluation. Previous research in competency measurement [8,9] had not considered these aspects of human behavior and simply argued that they may not have a direct relation with the core efficiency of work. However, according to the citizenship model of one’s creativity and self-initiation, such behaviors cannot be omitted. Therefore, it is opined that the consideration of these behaviors (self-initiation and change adoption) in resource competency evaluation will increase employee motivation and confidence in the assessment process. Hence, we adjusted Griffin et al. [14] work role performance evaluation model for this study.
According to Griffin et al. [14], a human agent’s performance is measured in terms of proficiency, adaptivity, and proactivity. Proficiency represents the level to which the job’s requirements are fulfilled by a human resource. Adaptivity represents the ability of human resources to alter their behavior to fit any work role or task. Proactivity is the self-direction and self-initiation exhibited by a human resource towards any change in the assigned job/task. So, it is concluded that an appraisal and reward system should consider proactivity and adaptivity along with proficiency.
Before Griffin et al. [14], adaptivity and proactivity were not systematically integrated with overall performance measurement but he believed that the inclusion of all three work behaviors would increase the confidence of human agents in the assessment process. Nevertheless, it is not certain that for all tasks a value for each identified work behavior exists, especially in cases of inapplicability where the value should be marked ‘zero’, and when considering the null value does not affect the overall evaluation.
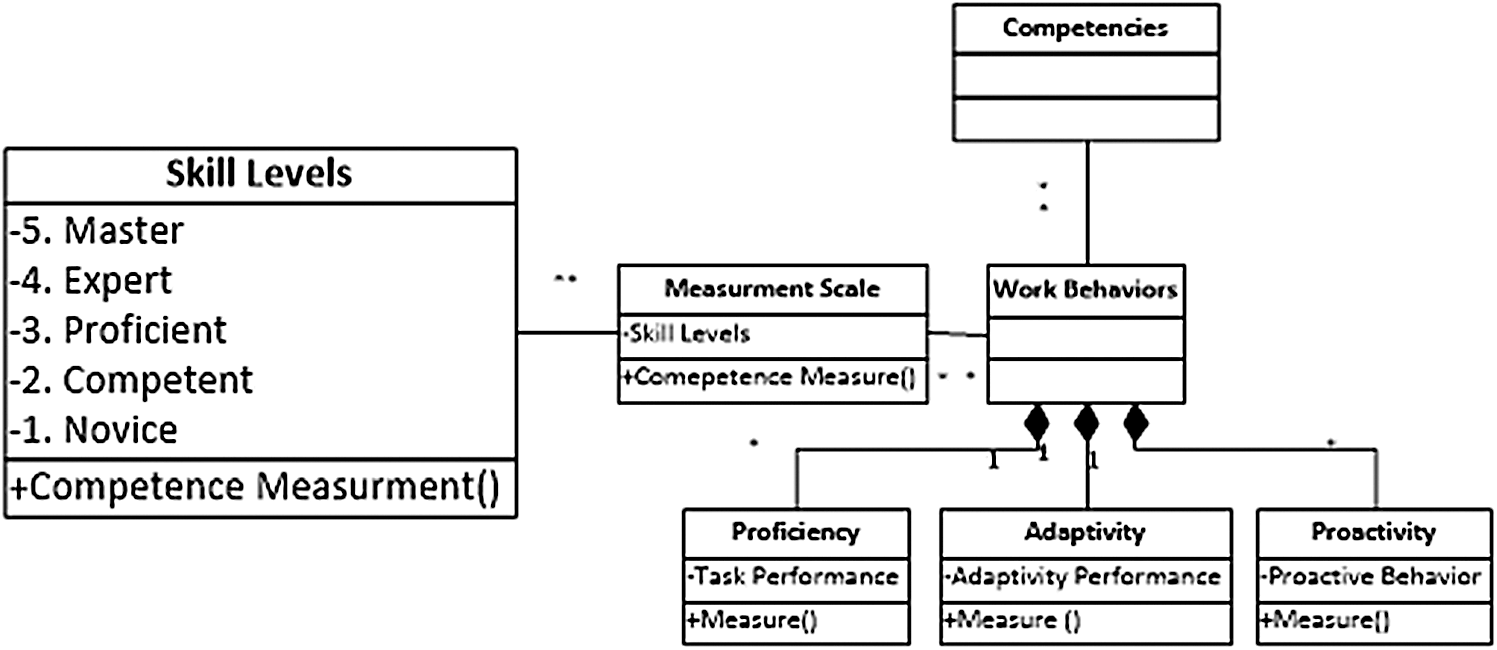
Figure 2: Resource competencies model
Gained competencies are shown with skill levels that are rooted in the five-stage model for skill acquisitions delineated by Dreyfus et al. [19]. According to this scale, competency is presented for five skill levels (ordinal scale). The metamodel (information model) for competency evaluation is presented in Fig. 2. The work behaviors of proficiency, adaptivity, and proactivity for the measurement of competency are taken together with an ordinal measurement scale (skill levels). The literature holds numerous methods for the measurement of competencies.
Work behaviors (Definition): Work behaviors are defined as nine dimensions to measure the work performance of resources. These nine dimensions are proficiency, adaptivity, and proactivity at the individual, team, and organizational levels.
• Proficiency: Defines as a level to which the job requirements are fulfilled by the role assigned to a human agent.
• Adaptivity: Adaptivity represents the ability of a human agent to change behavior to fit in the role.
• Proactivity: Defined as the self-direction and self-initiation to role behavior change.
4 Resource Competencies Evaluation Method
There are a lot of methods available for competencies measurement. Most methods are available from the work domain of workflow management systems. According to our best knowledge, no method is providing a user-guided way to measure it from of process warehouse. For measuring the competency measurement we identify four major cases are: i) an old human agent having experience of the same job, ii) an old human agent having experience of different job, iii) experience human agent having no record, iv) new human having no experience. Our method is only helpful for cases i) and ii).
Competency is measured or evaluated after summarizing proficiency, adaptivity, and proactivity (modeled as resource competency evaluation criteria) either from PW or event log data. However, it is a complex process to obtain exact values without using any measurement method for either event log data or PW because PW’s design inadequately allows information analysis due to its meager customization. On the other hand, PW richly avails the required data. Hence, instead of changing the complete design, we developed three algorithms (pseudo-codes) for the extraction and measurement of data solely related to our objectives.
According to Muehlen [2], resource assignment in the process execution environment is bound to the organizational structure which other studies [20,21] have termed ‘constraint-based resource assignment’. Constraints are related to authorizing access to execute certain tasks. Likewise, roles within an organization also limit a given human resource to task executions. Murfay and Jackon in the year 1999 defined ‘role’ as “the total set of performance responsibilities associated with one’s employment.” Muehlen [2] defined a simplified organizational hierarchy schema for the process-oriented environment. According to the present work, role defines the initial boundaries of a given human resource and further categorizes them according to the position. For example, a human agent, ‘Shafiqa,’ works in the hospital as a nurse and her current position is ‘Assistant Nurse.’ Organizations have pre-defined SOPs (Standard operating procedures) that contain a list of responsibilities and duties for every role and position. The developed method herein presented considered organizational predefined hierarchies as initial input for competency evaluation methods.
A three-step method for competencies evaluation is proposed below as shown in Fig. 3. These steps include: (i) the identification of human resources’ role histories; (ii) the creation of work performance sheets; (iii) calculations for competencies.
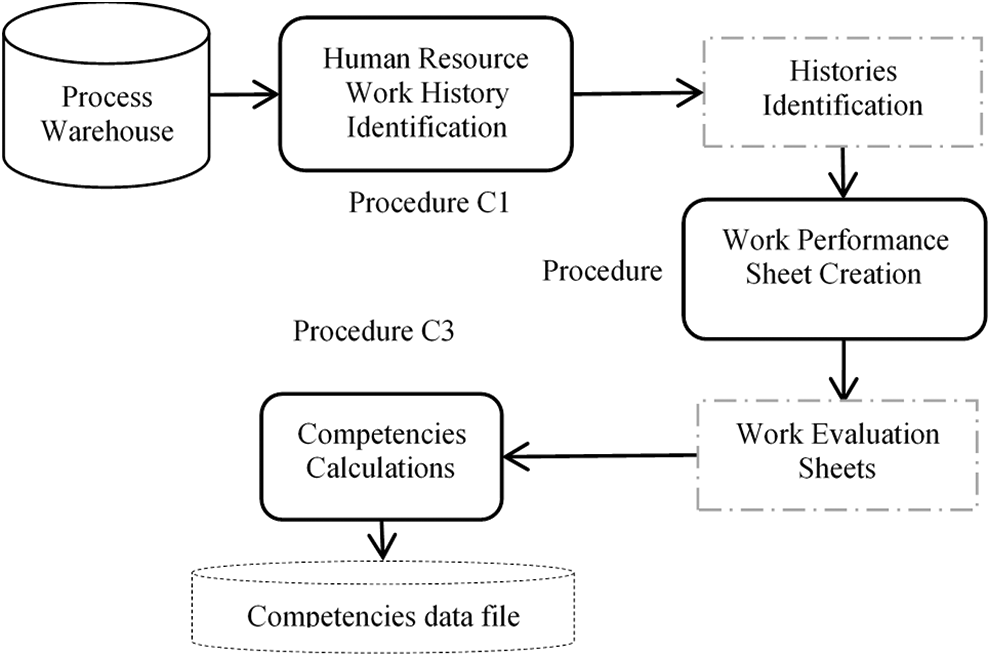
Figure 3: Competencies measurement method
4.1 The Identification of Human Resource Work Histories
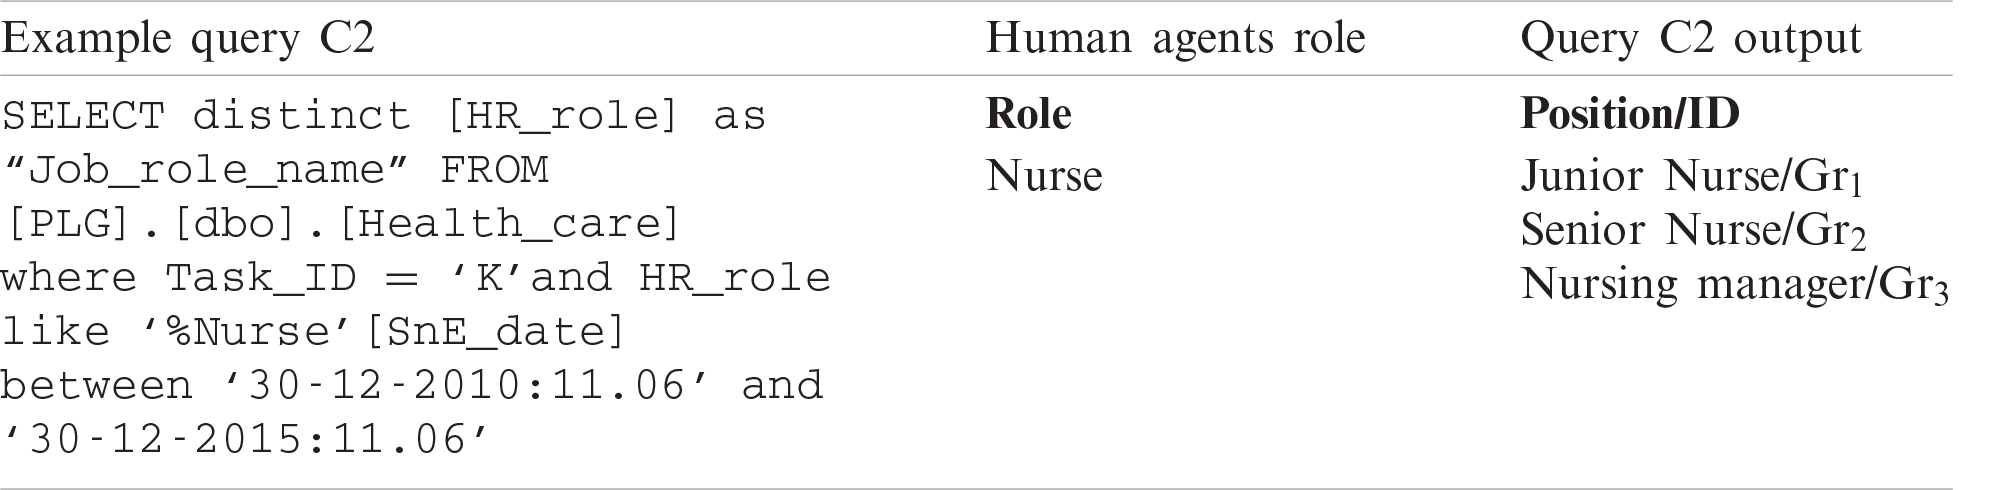
The first step of this method explored data concerning the historicity of human resource task performance. The human resources are bound to roles and roles are bound to positions (carrier path). Hence, this step involved the extraction of task history data according to role and role position; a process followed by two general algebraic queries: Queries C1 and C2, as shown in Tab. 1. Query C1 was used to explore a complete list of human resources for a given role, such as Nurse. Query C2 was used to explore a carrier path (or positions held previously) for a particular job, especially for a Nurse in the example query. Role and position were already defined.
Table 1: Extraction of human agent and role position lists (Queries-C1 & C2)
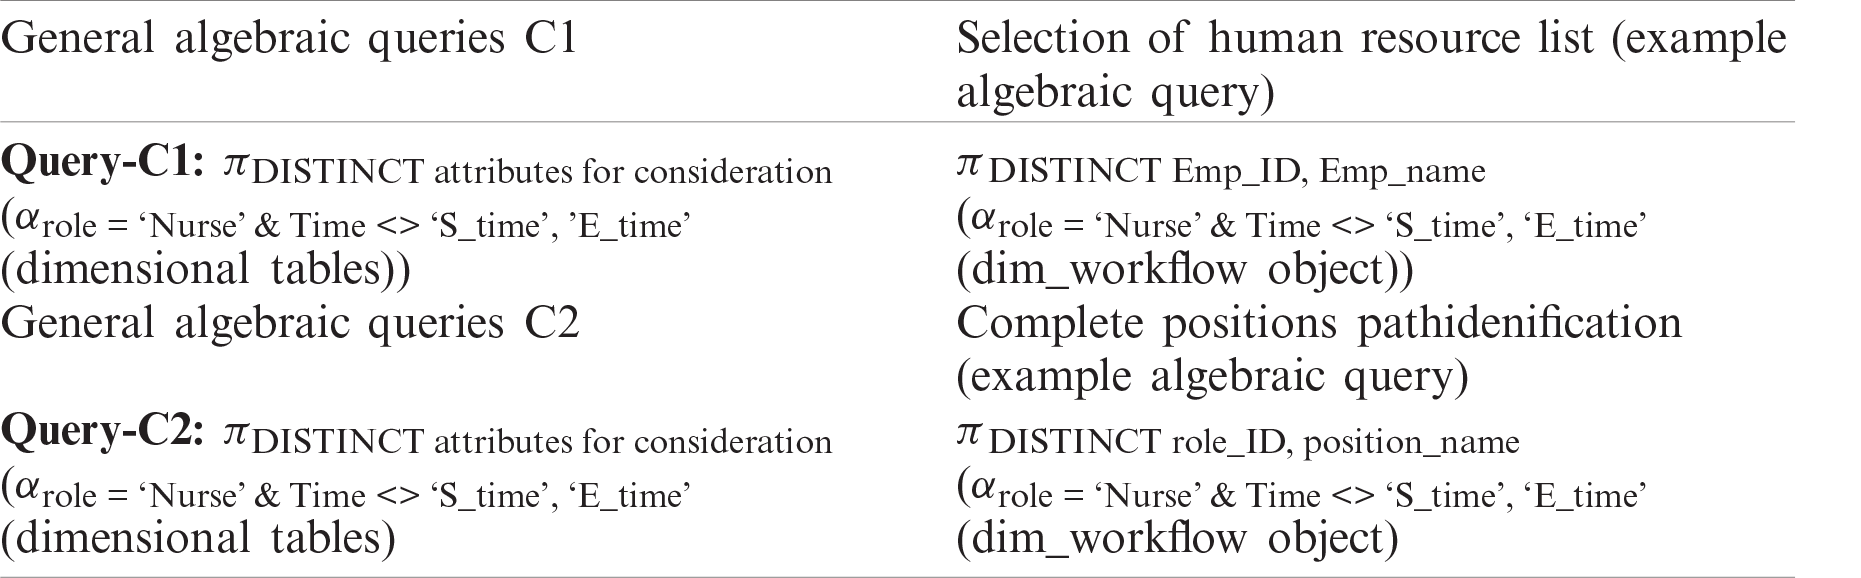
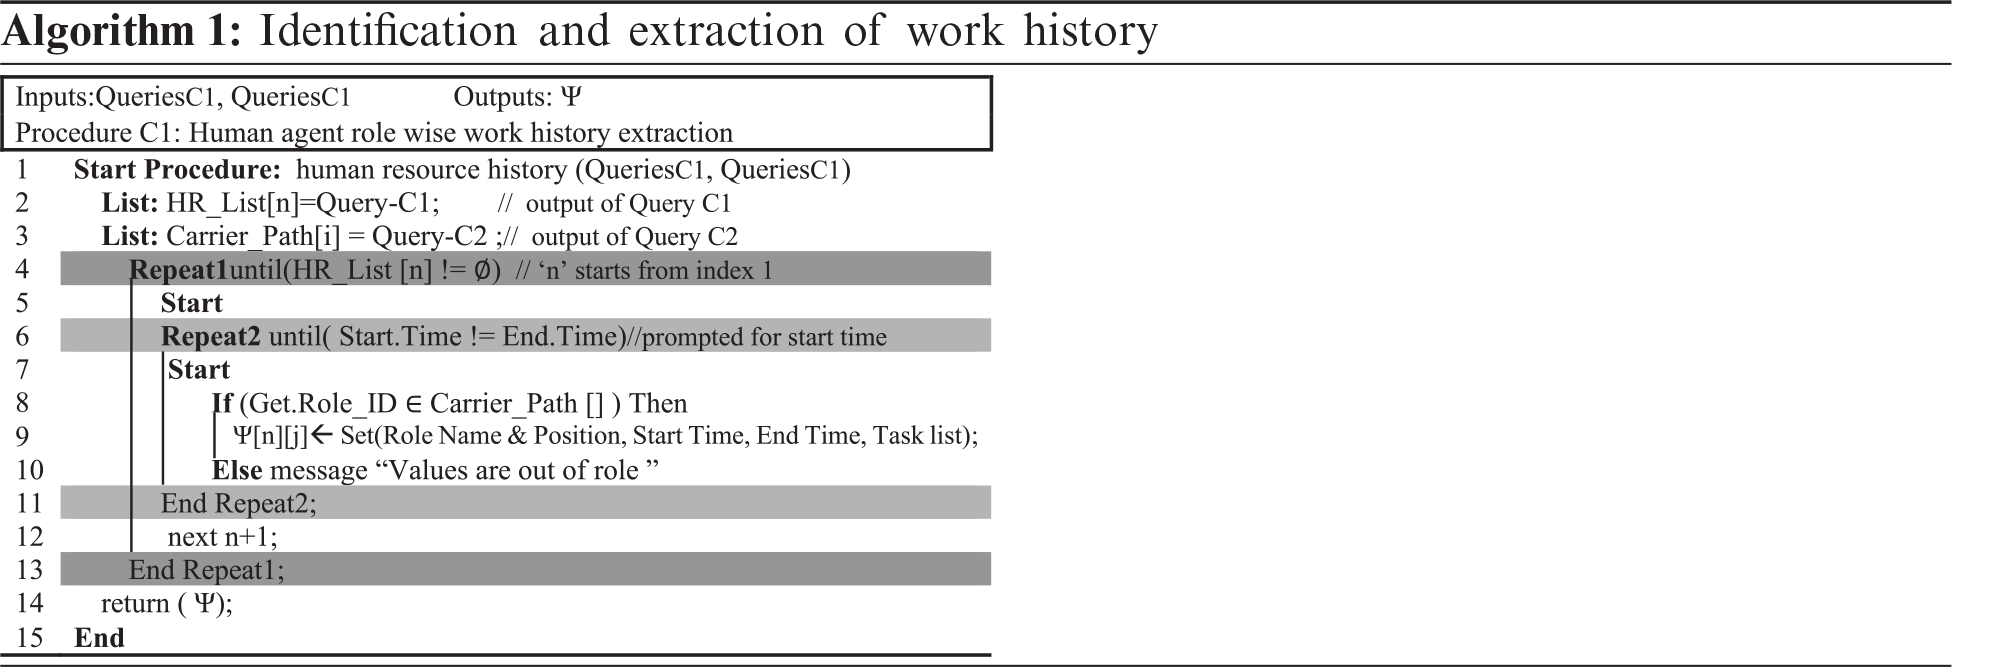
Using the output from queries C1 and C2, a pseudo code for a procedure (procedure C1) as shown in Algorithm 1, then generated a task list according to the human resource role and position with time. Another dimension was then added by exploring the data with granularity levels under control which were thus considered an initial step towards data navigation. Finally, this step returned a work history, designated ‘Ψ’.
4.2 The Creation of Work Performance Sheets
Once a human agent’s task history was identified, the second step of the method was to identify all executed task instances (from different case patterns) and then map the performance indicators (proficiency, adaptivity, and proactivity) for values. These performance value indicators were mapped and measured from either the facts or dimension tables. This step involved the exploration and measurement of information.
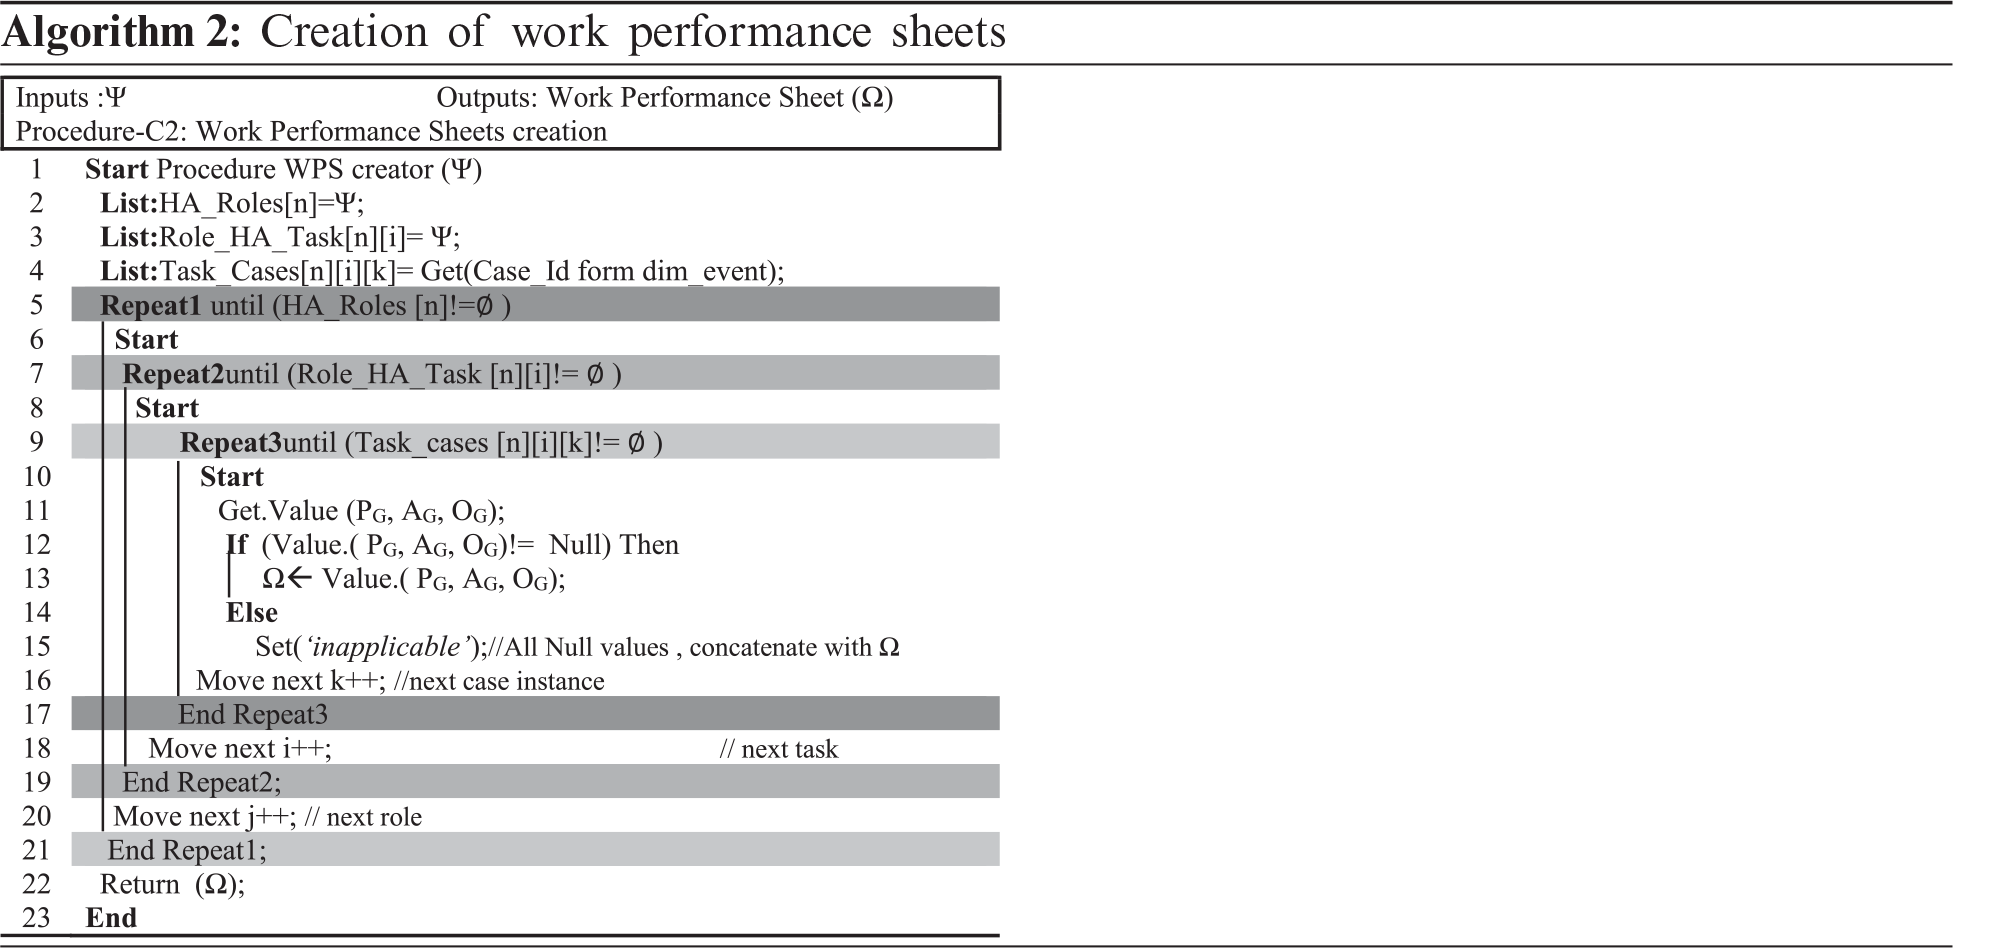
A pseudo-code (Procedure C2) was created as shown in Algorithm 2 to generate the Work Performance Sheet (WPS), so named because these sheets arrange work performance-related data and evaluation criteria on the same page, similar to a scorecard. Data in WPS are arranged according to executed instances of the task and the figure describes the metamodel (information model) used as an evaluation parameter. The information model provides basics for the creation of the WPS for a human resource on a worked task and is generated as an output during this step.
The functionality of a procedure starts with the creation of three lists: HA_Roles, Role_HA_Task, and Task_Cases. It has already been argued that proficiency, adaptivity, and proactivity are selected attributes (work behaviors) for the evaluation of competencies and that Eqs. (1)–(3) are used to determine/measure them, respectively. With this method, a value for each attribute was extracted as Fact attribute value. User interactions are required at this stage if a value is either not applicable or undetermined. Such cases can be marked ‘Not Applicable’ (N/A). Values were extracted for every executed task instance. All WPS sheets were stored in Ω and returned to the next algorithm for competency calculations.
Eq. (1) measures resource proficiency. As already discussed, proficiency defines the level to which job requirements are fulfilled by the task assigned to a human agent. Hence, this formulation may not be applicable for all tasks. This derives from the works of [8,21,22].
Adaptivity represents the ability of a human agent’s behavioral change to fit any task and their measurement criterion varies from the nature and task execution conditions. So, the measurement criteria cannot be the same. Eq. (2) describes the general formula for the measurement of resource adaptivity (AG). The measurement is calculated in percentages.
where OG represents the proactivity of human resources during task execution and TPro represents the proactively executed task instances. Eq. (3) describes the measurement of resource proactivity (OG) for a given task. Where, proactivity defines the behaviors, self-direction, and self-initiative, of a human agent for a given task. The TPro is measured after considering the established criteria that are based on self-initiation and proactivity task execution.
4.3 Calculations for Competencies
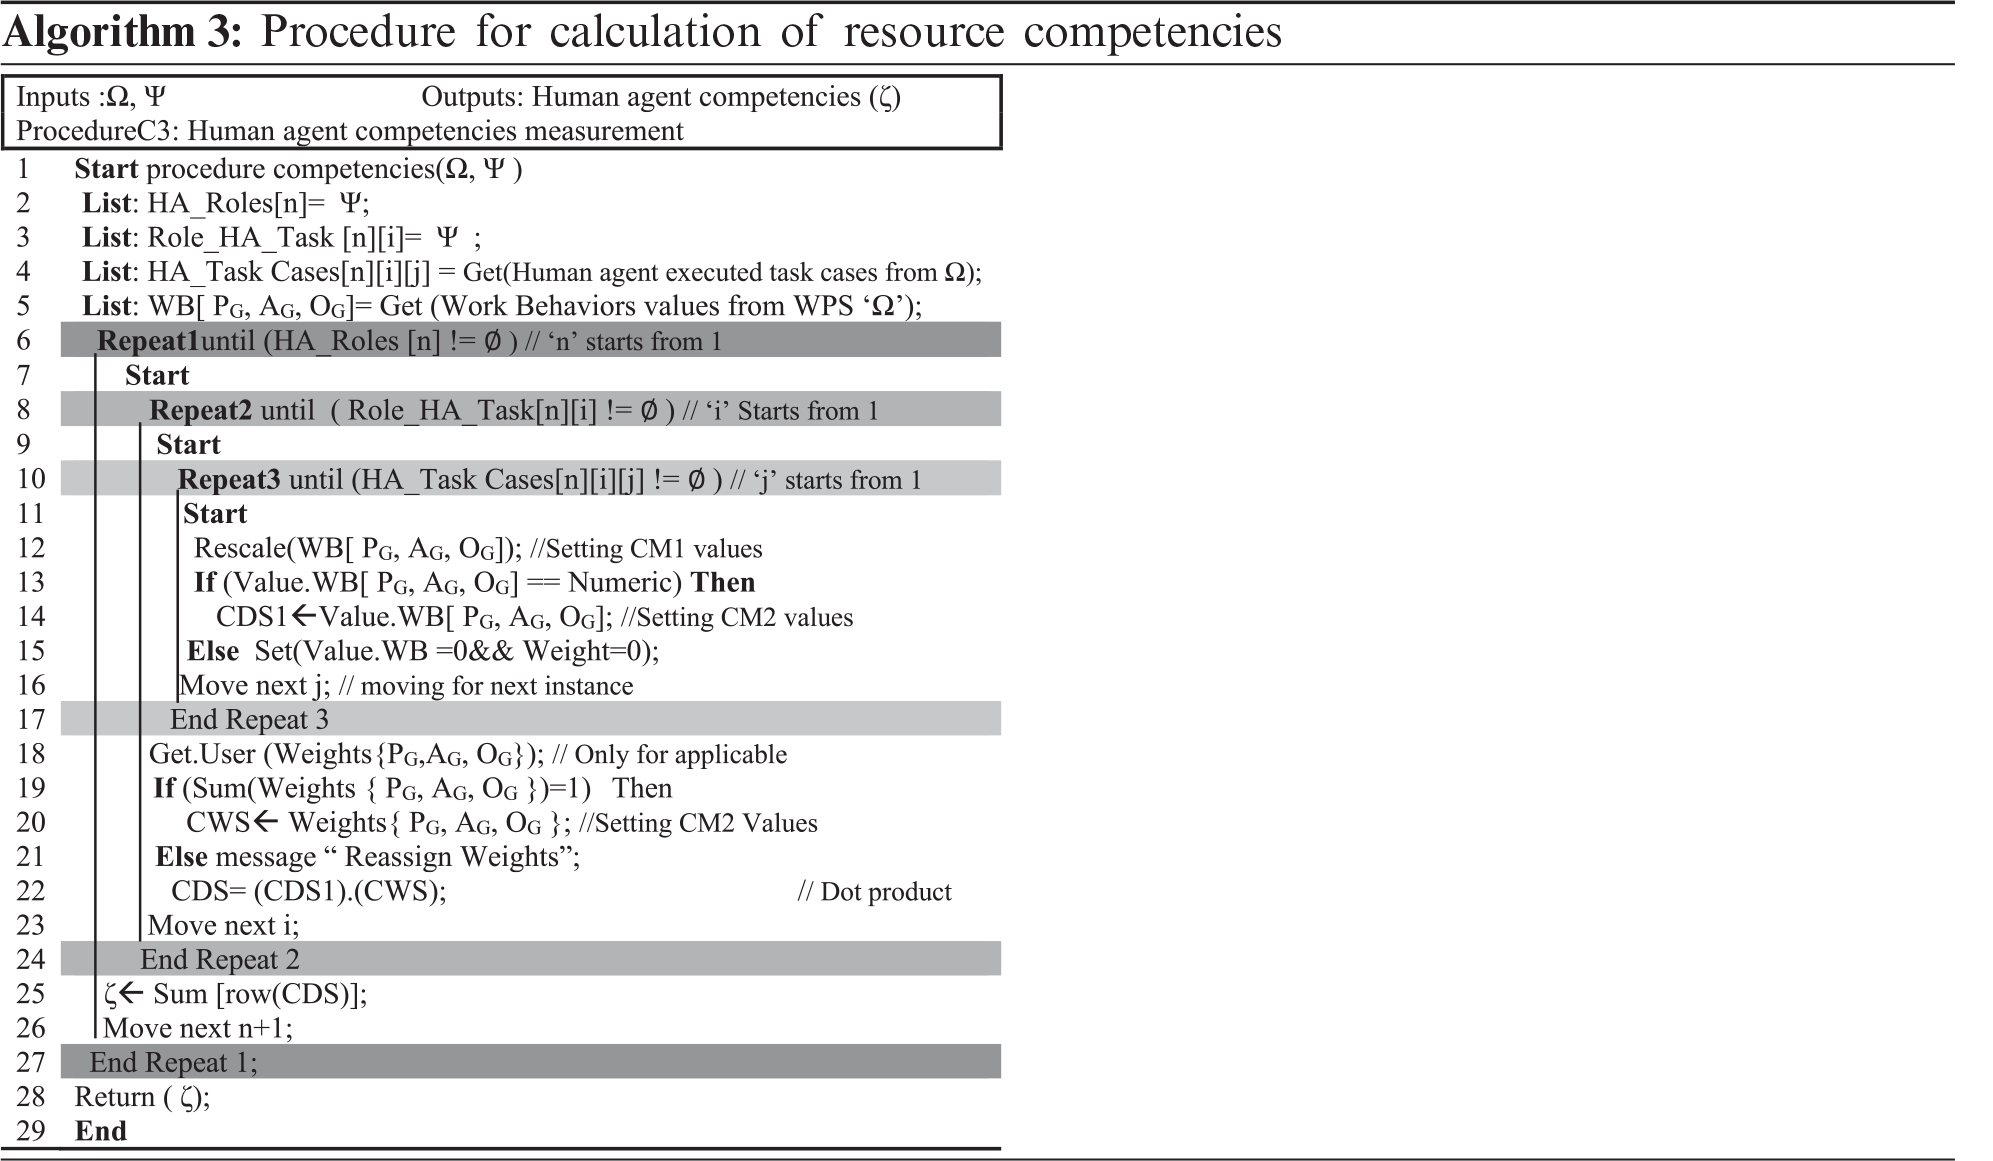
This step of the method was designed to calculate competencies. A pseudo-code (Procedure C3) is presented in Algorithm 3 to demonstrate the overall functionality. This procedure uses work performance sheets generated by Procedure C2. Worker performance sheets hold the measured values of competency performance variables for all instances of a given performed task from which we derive a single value as the measure of human resource task competence.
The processing of the method begins by taking WPS as input along with Procedures C1 and C2 as outputs. The major function of this procedure is to summarize WPS with user-provided weights and subsequently calculate a competency value. These values are further rescaled to a range of 1–5 for easier comprehension by an ordinary decision-maker.
Rescaling and summarization of one complete WPS cycle generate a ‘CDS1’ Dataset with each column holding values for proficiency, adaptivity, and proactivity with each row representing a human agent’s role and position. Dataset ‘CDS2’ is created after prompting weights from decision-makers. The weight assignment process is carried out after following a set of predefined rules. A CDS Dataset is produced after taking dot products from both Datasets (CDS1 and CWS). Finally, a single value for task competency is achieved for a performed role and stored in (ζ) (the competency data file).
Rules for Weight Assignments, following are rules for assigning the weights to calculate competency.
1. Weights for competency behaviors (proficiency, adaptivity, and proactivity) remain between 0 & 1.
2. The sum of weights cannot be less than or greater than 1.0.
3. In the case of an unidentified value, work behavior weights are considered zero (assuming that a zero weight will not affect the overall calculation).
The mapped values from WPS are rescaled through a rescale function. For any human resource role position, ‘r’—which has a human resource, G1, G2, G3,…, Gn—the competency of task can be calculated via Eq. (4),
where
For the nth roles of human resources, each row in dataset CDS1 represents competency and (PG AG OG) represents one row in dataset CDS1. Weights are assigned as a CWS dataset and (WP WA WO) represent one row in CWS.
The dot product of two datasets generates the CDS dataset whereas (·) represents the dot product of two datasets:
Each row in CDS represents the competency of a human resource for a given role, in terms of proficiency, adaptivity, and proactivity. Summarization of each row produces a single value for competency as described in Eq. (5). Finally, the competency of a human resource is generated for dimensions of time, role, role position, and task. Hence, the dimensional information required for competency evaluation is well controlled by the method as presented.
5 Illustration of the Competency Evaluation Method
The method includes three steps: task history identification, creation of competency work performance sheets, and competency calculations. Three procedures, Procedures C1–C3 were presented in Section 4 to describe functionality for each step. The PW was populated by PLG v1.0 [18] for the case study of the ‘Regular Maternity Visit’ business process model. The populated PW was the product of an integration of event log data with workflow and business transactional data. The PLG v1.0 was simulated from business transactional data and log data PW data were made available in both MS Excel files(CSV) and SQL Server 2008 database formats.
5.1 Task Histories Identification
Task history identification is the first step in resource competency evaluation and involves extracting lists of human resource executed tasks. Identified task histories are listed along with human resources roles defined by role positions.
To illustrate the task, ‘injection insulin’ (represented as Instance_CP4_ case_id_K), as selected from the Regular Maternity Visit business model, the role of ‘nurse’ is the selected task performer. Junior, Senior, and Nursing Manager are three different role positions identified for the job position, Nurse. Initial data for task and performers (human resources) were explored through two queries (Queries C1 & C2). When the ‘injection insulin’ task was explored, some executions were found under other roles. However, Tab. 2 only shows records for the role of Nurse as this task was categorized ‘for Nurse role only’. For the same role (Nurse), Query C2 was executed to identify all possible role positions (career path). The output of Query C2 is shown in Tab. 3 which illustrates the complete hierarchy for the job/role of ‘Nurse’. In the present work, these role positions were extracted from historical data (PW) but role hierarchies can also be extracted from an employment book provided by most organizations. Role positions are important for the identification of current working placements and human resource experience.
Outputs from Queries C1 and C2 provided inputs for Procedure C1. The processing of procedure C1 can be changed with different output queries. With any change in Query C1, the processing of Procedure C1 also changes. Thus, the introduction of a query as input makes the processing of Procedure C1 dynamic. Hence, Query C1 returned the distinct title, Nurses (human agents), as shown in Tab. 2; and Query C2 returned role positions for the same role (Query C1).
Outputs from Queries C1 and C2 were provided to Procedure C1 and Tab. 4 was generated after tracing all steps of the pseudo-code. The task ‘injection insulin’ (Task Id, ‘K’) was instanced 76 times as this task was only executed for case_pattern_4. From these 76 instances, the same task was executed 39 times by selecting Nurse (CP_Nurse_1) under Senior Nurse and Nursing Manager roles (Gr2 and Gr3). The excerpt from the example output generated by tracing Procedure C1 is shown in Tab. 4.
Table 2: List of human resources involved in the execution of the task ‘injection insulin’
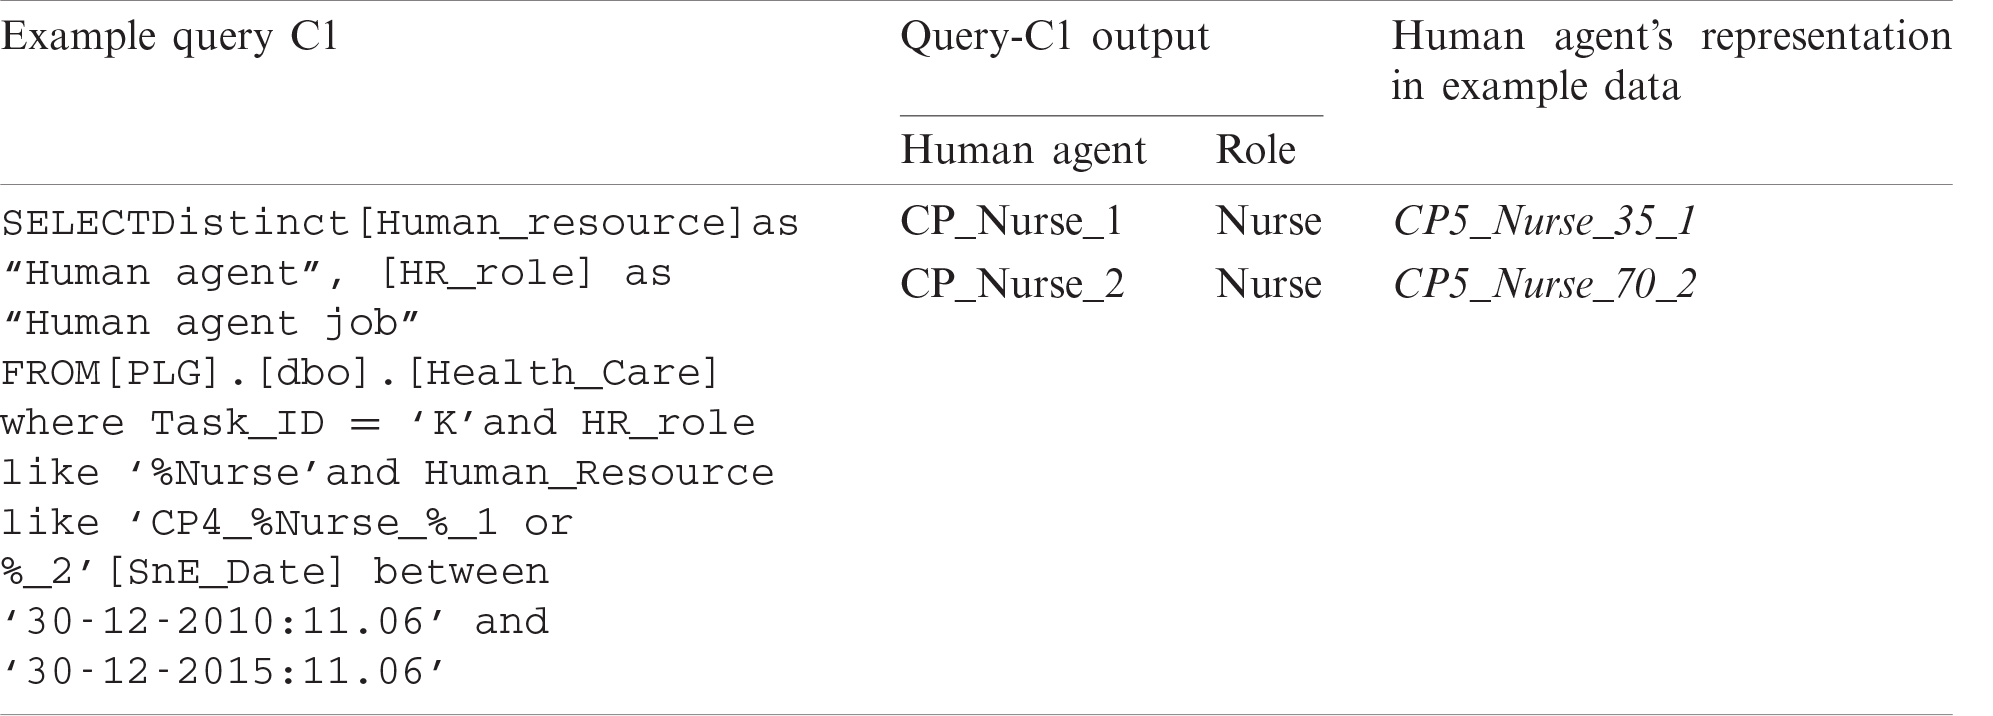
Table 3: Identified role positions for ‘Nurse’ role
5.2 Creation of Work Performance Sheets
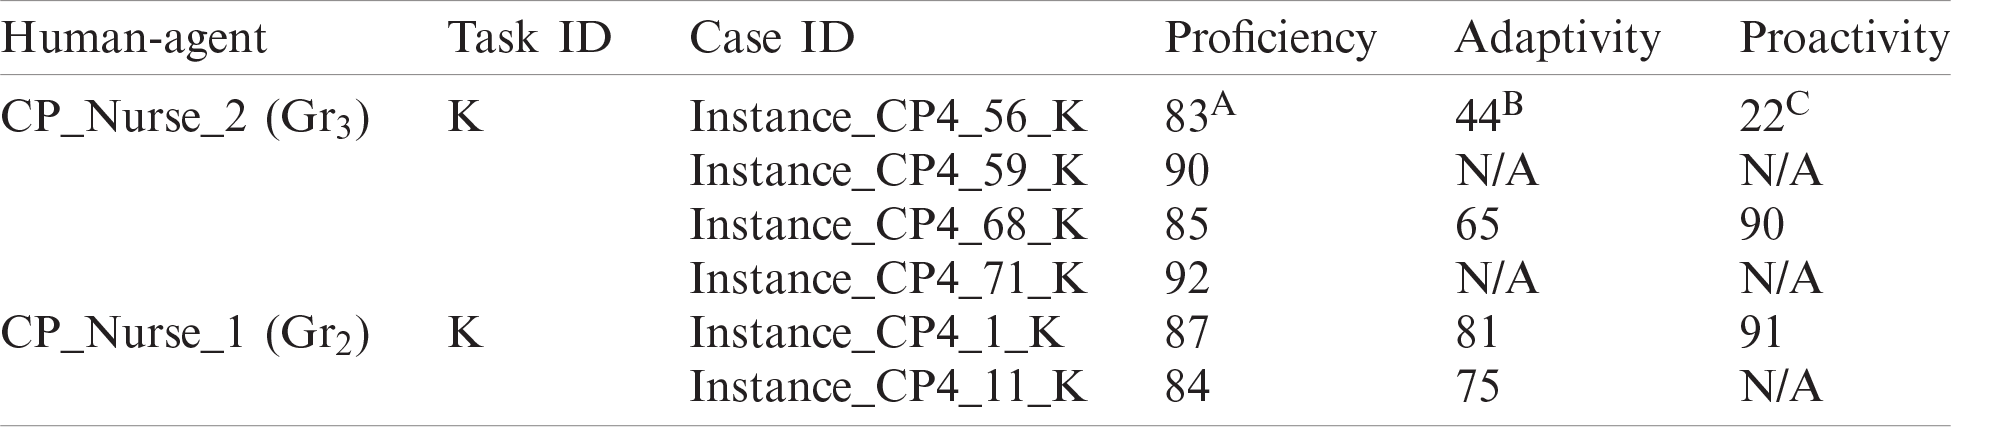
Step two involves the creation of Work performance sheets (WPS) to illustrate Procedure C2 functionality. WPS was created to obtain values for competency work behaviors. The WPS shown in Tab. 5 was created after using Procedure C1 data as an input. This section presents an illustration of Procedure C2 for human resource ‘CP_Nurse_1’. The goal of creating WPS is to define Facts values from PW with respect to dimensions selected in step one.
WPS sheets contain proficiency, adaptivity, and proactivity (competency work behaviors) values for every executed task instance. These work behavior values were mapped from Facts attributes in the Facts Table. If a work behavior’s value for any instance was not mapped, it was classed as unidentified assuming the specific worker’s behavior was not applicable to that task instance. Such values were set at ‘0’ assuming zero values would not affect overall measurements.
Sample Calculation for ‘Instance_CP4_56_K:
PG = (15/18) * 100 = 83.33 ≈ 83%A
AG = (8/18) * 100 = 44.44 ≈ 44%B
OG = (4/18) * 100 = 22.22 ≈ 22%C
The values of proficiency, adaptivity, and proactivity for generated PW [18] were calculated using a prototype and organized in a WPS. The WPS for every human resource was generated and passed to Algorithm 3 for competencies calculations.
Table 4: Human resource task histories with respect to the role (an excerpt from sample output)
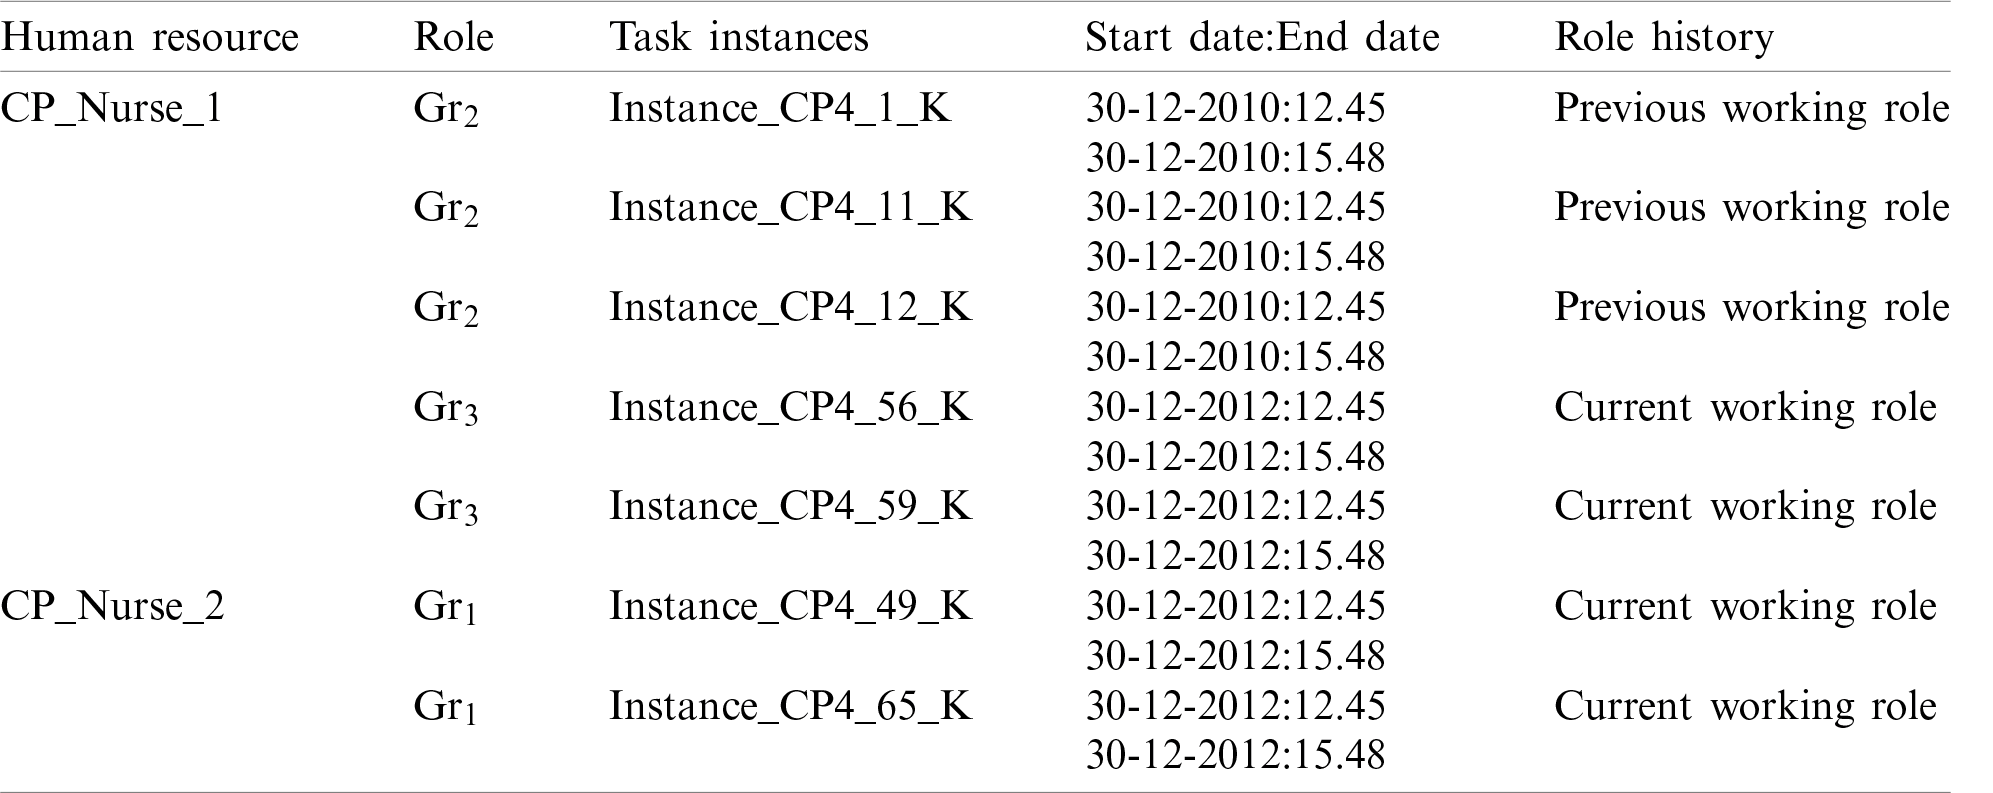
Table 5: Created work performance sheet human agent CP_Nurse_1 (an excerpt from sample output)
Calculated competencies for CP_Nurse_1 (Gr3, Nursing Manager) for the ‘injection insulin’ task (represented as ‘K’) are shown in Fig. 4. Procedure C3 was traced on PW data. The CDS1 dataset was generated from step two that is the creation of WPS. CSD1 provided scaled values for proficiency, adaptivity, and proactivity. Another data set (CWS) was defined as a ‘user provided’ weight dataset. Weights for proficiency, adaptivity, and proactivity were prompted by users. The CDS dataset was generated after the dot product of CDS1 and CWS. Row-wise submission of CDS generates the competency of a human resource at a specific role position. Finally, the C data set was produced representing CP_Nurse_1’ showing a 3.56 competency score for her work as Gr2 (Senior Nurse), and a 3.62 score when she worked as Gr3 (Nursing Manager, current role). The values are shown on a skill level scale of 1–5, (Novice = 1, Competent = 2, Proficient = 3, Expert = 4 and Master = 5).
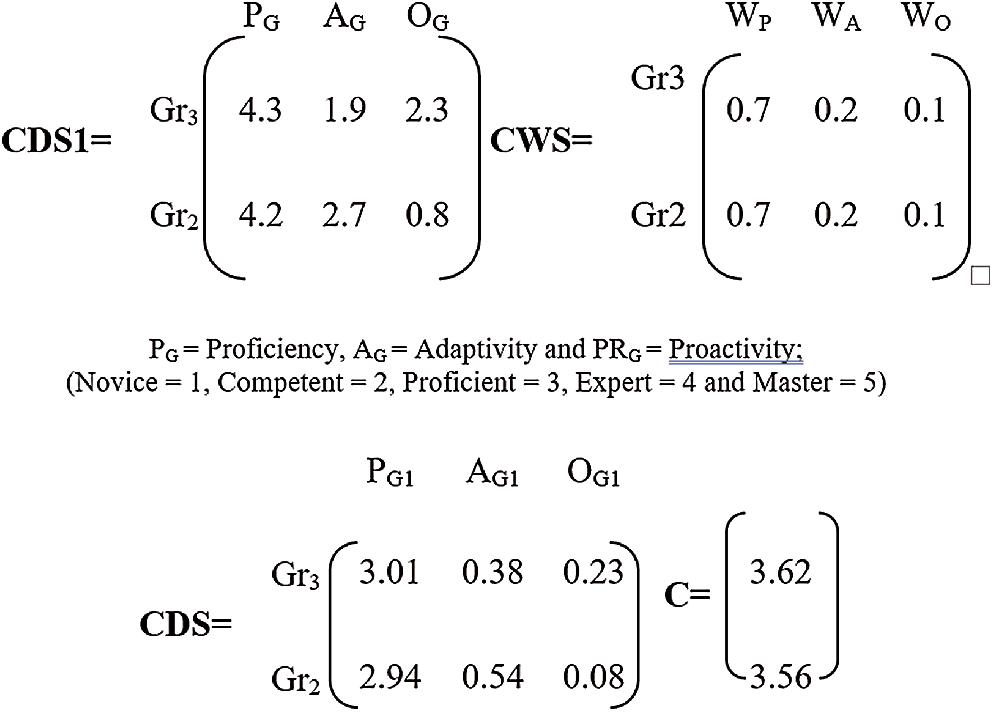
Figure 4: Competency measurement (excerpt from sample output)
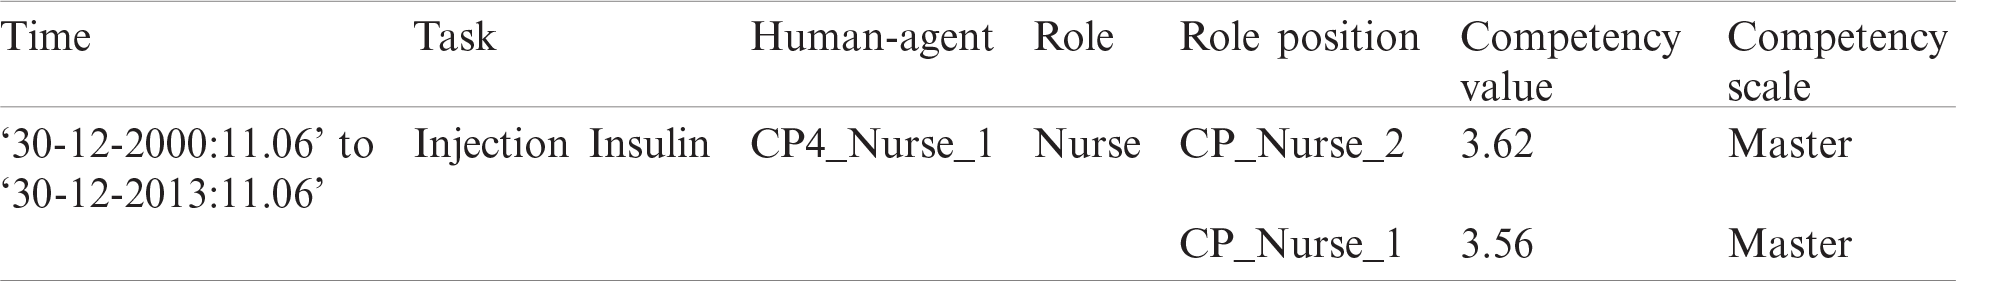
The final output of the competency evaluation method is shown in Tab. 6 which presents results for different dimensions. Computed information is available for four dimensions and one Fact. Dimensions include time, task, human resource, role, and role position. The dimensional information is presented in competency Fact. The present work aimed to provide improved data quality. Hence, when information is presented with specifically related dimensions as cited it automatically improves data quality.
Table 6: Final output of competency evaluation method
6 Result and Analysis of Resource Competence Method
The competence evaluation method produces a single value of human agent task competence. Expected advantages from a single value are, i). easy understanding and ii). easy to compare. If we consider only competence then human resources with maximum value are most likely to become a potential candidate for the assignment.
In this study, the proposed method is evaluating competencies as the summarization of human resource score at proficiency adaptivity and proactivity. It is believed that the proposed work behaviors are not equally the same for all tasks. In some situations, proficiency is more required than adaptivity and proactivity and vice versa. For instance, in the specific example of task ‘injecting medicine to patient’, the weight of proficiency should be higher than adaptivity and proactivity. In another example task of ‘Assistance during operation’, in this task major assigned duty is anticipation and preparation of equipment and drugs that might be needed to doctor during operation, the weight of proactivity should be considered higher than proficiency or adaptivity. So, weight assignment is one of the silent features of the proposed method over previous business process intelligence-based approaches.
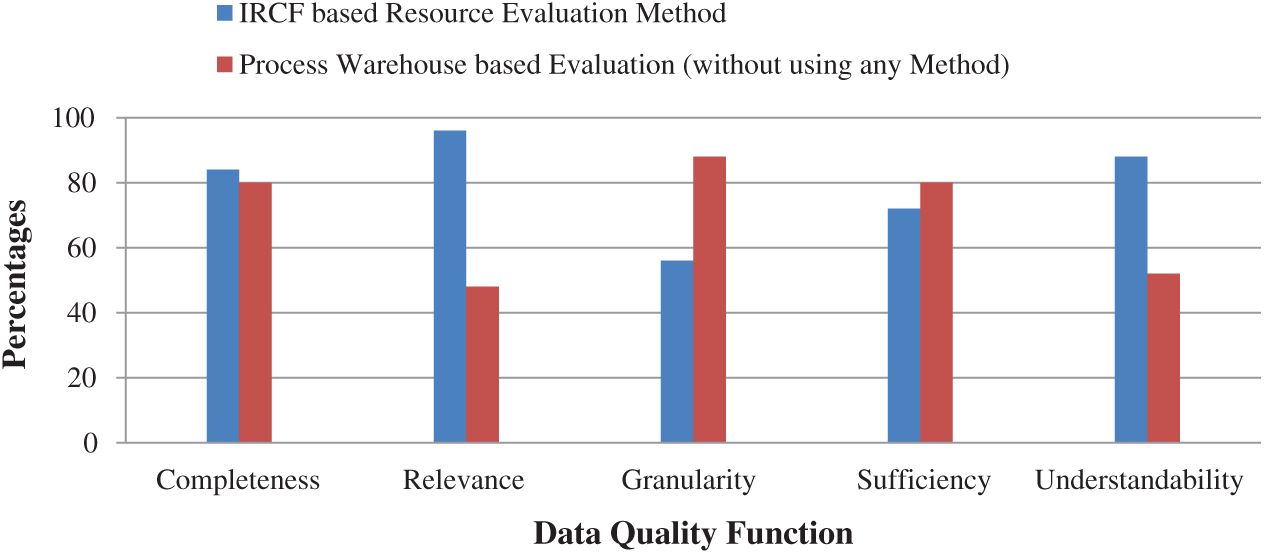
Figure 5: Competencies measurement method % age graph
Table 7: Comparisons of different work performance evaluation method with used methodology
To further understanding and evaluation of the proposed method an experimental setup is created for an empirical evaluation. For empirical analysis and evaluation, the quality variable of data are selected that are (Completeness, Relevance, Granularity, Sufficiency, and Understandability) rooted in Hong et al. [25]. Five respondents were selected randomly from UTP, Ph.D. students, with having minimum knowledge of process warehouse and business process analysis. Firstly, we provide them with the required domain knowledge and understanding of the selected case study. Data sets are simulated for the selected case study. The information generated from the PW and our method-generated information is given as a pre-survey test. After confirming the understanding presentation of the participant, questions were asked. Responses are gathered on an excel file. Final results are shown in Fig. 5, which shows this our method is producing highly relevant information, but the granularity is minimum.
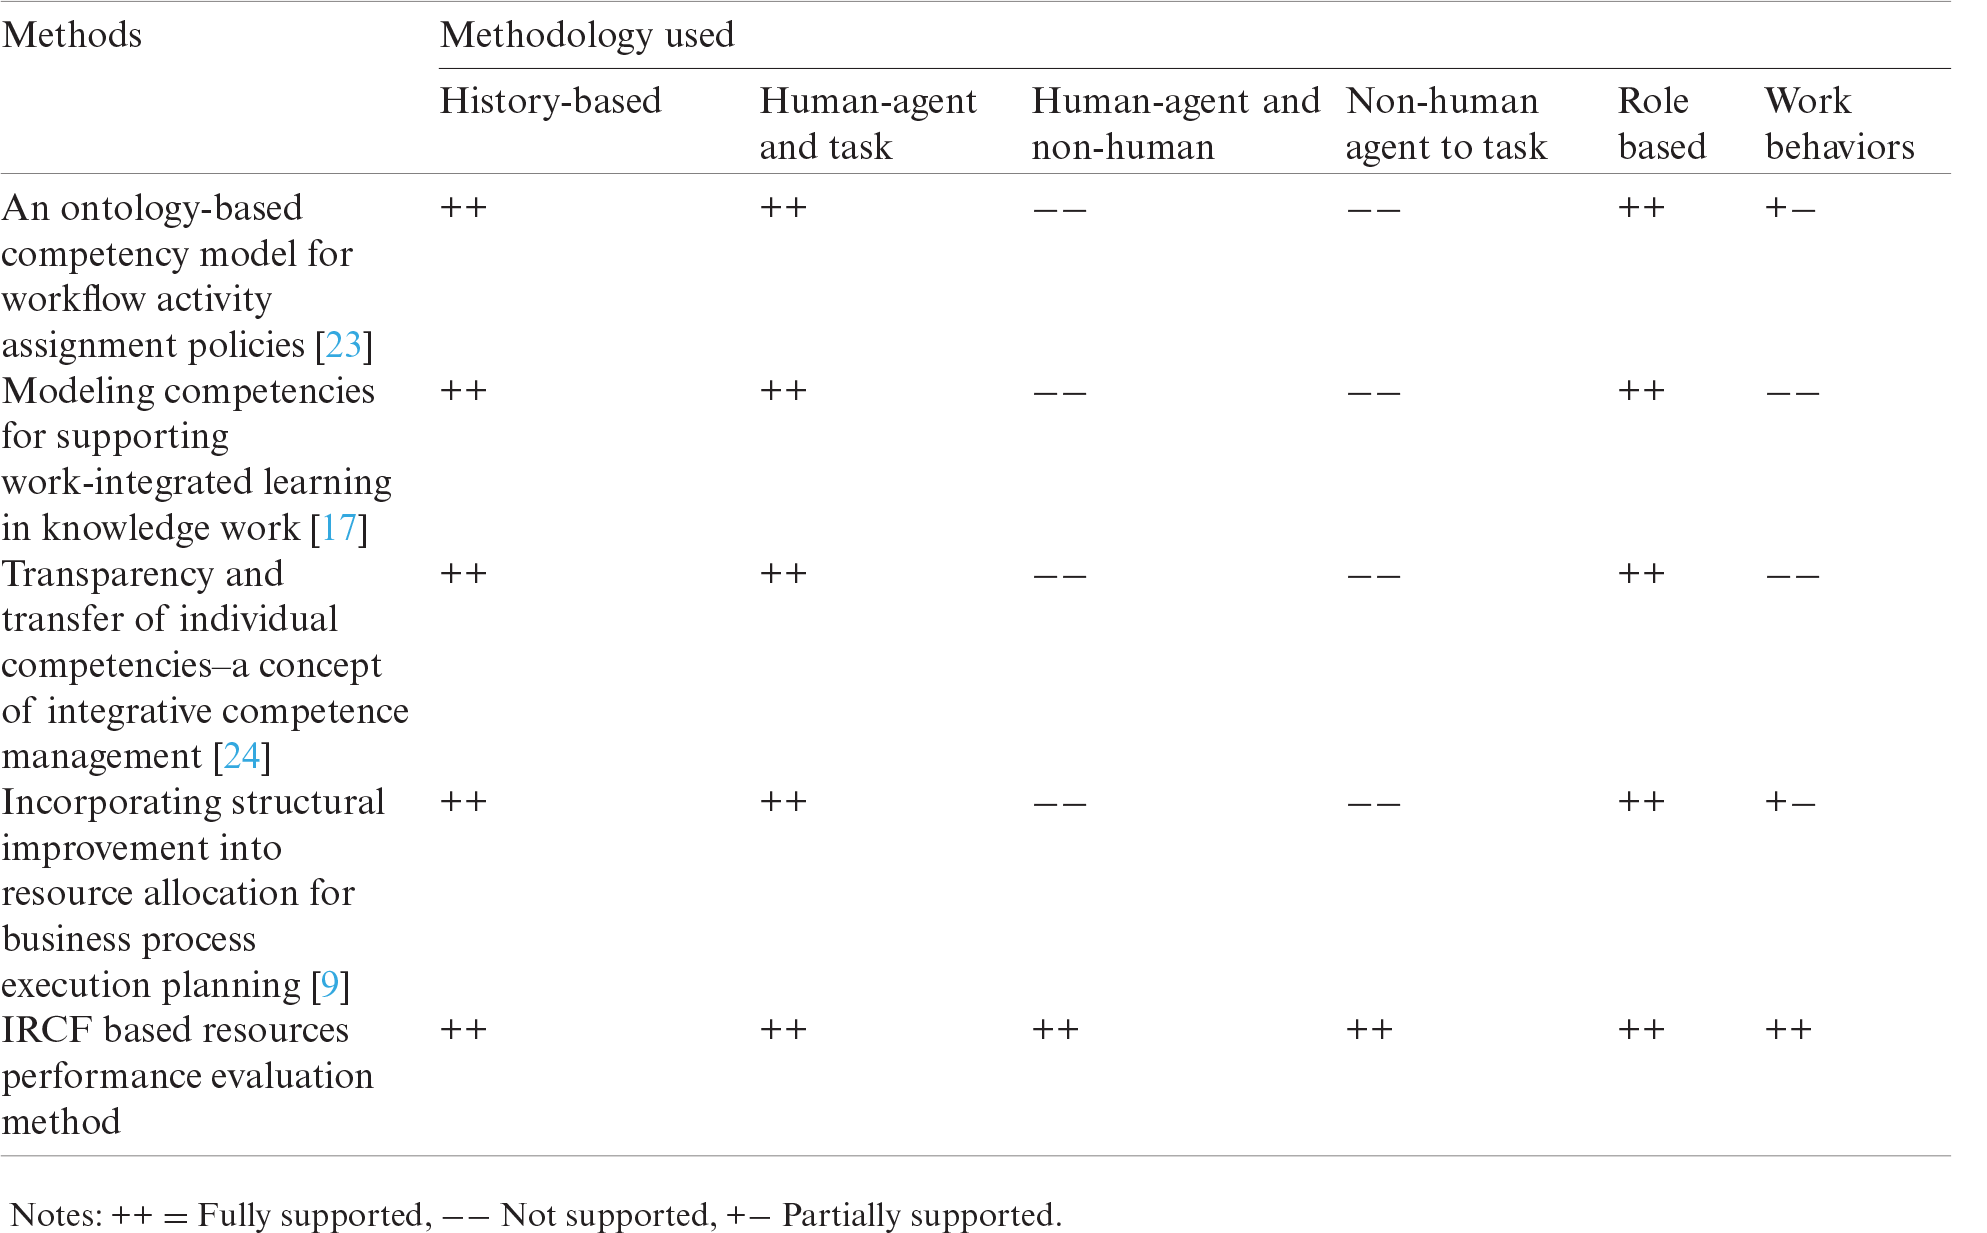
In Tab. 7 we show comparisons of different methods including the proposed resources performance evaluation method with methodologies used in the measurement of task performance. Partially support is only observed for work behaviors that mean methods are considering partial behaviors for work performance measurements.
Business process improvement is an established way that enterprises employ to achieve a competitive edge. One of the key aspects of improving the execution performance of a process is to assign the most appropriate resource to each task of the process. This requires an evaluation of the new role assigned to a resource and evaluation of previous performance roles to check the previous performance that may cause the process bottlenecks. However, a method that can guide the measurement of resource performance does not exist. It is because the existing artifacts are not composed of the five mandatory elements of the method, procedural model, information model, role, result, and technique. In this paper, we present an agent performance assessment method having five mandatory elements of the method definition. The applicability of the proposed method is illustrated with a healthcare case study. Regarding the directions of future work, we see empirical evaluation of the proposed method, as the major issue.
Funding Statement: The authors received no specific funding for this study.
Conflicts of Interest: The authors declare that they have no conflicts of interest to report regarding the present study.
1. M. Weske, “Business process management architectures,” in Business Process Management SE-7, 2nd ed., Berlin Heidelberg: Springer, pp. 333–371, 2012. [Google Scholar]
2. M. Zur Muehlen, “Organizational management in workflow applications–issues and perspectives,” Information Technology and Management, vol. 5, no. 3, pp. 271–291, 2004. [Google Scholar]
3. L. C. L. Chen, T. X. T. Xue and A. Y. A. Yang, “Business process continuous improvement system based on workflow mining technology,” in Proc. of World Congress on Computer Science and Information Engineering, Los Angeles, CA, USA, pp. 414–418, 2009. [Google Scholar]
4. M. K. Shahzad, “Improving business processes using process-oriented data warehouse,” Ph.D. dissertation. KTH Royal Institute of Technology, 2012. [Google Scholar]
5. M. zur Muehlen, “Process-driven management information systems combining data warehouses and workflow technology,” in Proc. of the Int. Conf. on Electronic Commerce Research, Dallas, USA, pp. 550–566, 2001. [Google Scholar]
6. G. Zellner, “A structured evaluation of business process improvement approaches,” Business Process Management Journal, vol. 17, no. 2, pp. 203–237, 2011. [Google Scholar]
7. I. Ajzen, “The theory of planned behavior,” Organizational Behavior and Human Decision Processes, vol. 50, no. 2, pp. 179–211, 1991. [Google Scholar]
8. Z. Huang, X. Lu and H. Duan, “Resource behavior measure and application in business process management,” Expert Systems with Applications, vol. 39, no. 7, pp. 6458–6468, 2012. [Google Scholar]
9. J. Xu, C. Liu, X. Zhao and Z. Ding, “Incorporating structural improvement into resource allocation for business process execution planning,” Concurrency and Computation: Practice and Experience, vol. 25, no. 3, pp. 427–442, 2013. [Google Scholar]
10. S. Coskun, H. Basligil and H. Baracli, “A weakness determination and analysis model for business process improvement,” Business Process Management Journal, vol. 14, no. 2, pp. 243–261, 2008. [Google Scholar]
11. A. Sohail, P. D. D. Dominic and K. Shahzad, “Business process analysis: A process warehouse-based resource preference evaluation method,” International Journal of Business Information Systems, vol. 21, no. 2, pp. 137–161, 2016. [Google Scholar]
12. A. Kumar, R. Dijkman and M. Song, “Optimal resource assignment in workflows for maximizing cooperation,” in Business Process Management, Berlin, Heidelberg: Springer, pp. 235–250, 2013. [Google Scholar]
13. M. Heravizadeh, J. Mendling and M. Rosemann, “Dimensions of business processes quality (QoBP),” in Business Process Management Workshops, Berlin, Heidelberg: Springer, pp. 80–91, 2009. [Google Scholar]
14. M. A. Griffin, A. Neal and S. K. Parker, “A new model of work role performance: Positive behavior in uncertain and interdependent contexts,” Academy of Management Journal, vol. 50, no. 2, pp. 327–347, 2007. [Google Scholar]
15. N. Russell, A. H. Ter Hofstede and W. M. Van Der Aalst, “Workflow control-flow patterns: A revised view,” BPM Center Report, vol. 622. Eindhoven, Netherlands: Bpmcenter org. press, 2006. [Google Scholar]
16. C. Giannoulis, M. Petit and J. Zdravkovic, “Modeling business strategy: A meta-model of strategy maps and balanced scorecards,” in Fifth Int. Conf. on Research Challenges in Information Science, Gosier, France, pp. 1–6, 2011. [Google Scholar]
17. T. Ley, A. Ulbrich, P. Schier, S. N. Lindstaedt, M. Lytras et al., “Modeling competencies for supporting work-integrated learning in knowledge work,” Journal of Knowledge Management, vol. 12, no. 6, pp. 31–47, 2008. [Google Scholar]
18. A. Sohail, K. Shahzad, P. D. Dominic, M. A. Butt, M. Arif et al., “On computing the suitability of non-human resources for business process analysis,” Computers, Materials & Continua, vol. 67, no. 1, pp. 303–319, 2021. [Google Scholar]
19. S. E. Dreyfuss and H. L. Dreyfus, “A five-stage model of the mental activities involved in directed skill acquisition,” Report in California University Berkeley Operations Research Center, 1980. [Google Scholar]
20. A. Awad, A. Grosskopf, A. Meyer and M. Weske, “Enabling resource assignment constraints in BPMN,” Potsdam: BPT in Hasso Plattner Institute, Technical report, 2009. [Google Scholar]
21. P. Senkul and I. H. Toroslu, “An architecture for workflow scheduling under resource allocation constraints,” Information Systems, vol. 30, no. 5, pp. 399–422, 2005. [Google Scholar]
22. K. M. Lee, “Adaptive resource scheduling for workflows considering competence and preference,” in Int. Conf. on Knowledge-Based Intelligent Information and Engineering Systems, Berlin, Heidelberg: Springer, pp. 723–730, 2004. [Google Scholar]
23. A. Macris, E. Papadimitriou and G. Vassilacopoulos, “An ontology-based competency model for workflow activity assignment policies,” Journal of Knowledge Management, vol. 12, no. 6, pp. 72–88, 2008. [Google Scholar]
24. K. Reinhardt and K. North, “Transparency and transfer of individual competencies—A concept of integrative competence management,” Journal of Universal Computer Science, vol. 9, no. 12, pp. 1372–1380, 2003. [Google Scholar]
25. S. Hong, P. Katerattanakul, S.-K. Hong and Q. Cao, “Usage and perceived impact of data warehouses: A study in Korean financial companies,” International Journal of Information Technology & Decision Making, vol. 5, no. 2, pp. 297–315, 2006. [Google Scholar]
 | This work is licensed under a Creative Commons Attribution 4.0 International License, which permits unrestricted use, distribution, and reproduction in any medium, provided the original work is properly cited. |