DOI:10.32604/cmc.2021.017292
| Computers, Materials & Continua DOI:10.32604/cmc.2021.017292 | |
| Article |
Deep Learning Approach for Cosmetic Product Detection and Classification
1Department of IT Convergence Engineering, Gachon University, Seongnam, 13120, Korea
2Department of Software, Gachon University, Seongnam, 13120, Korea
**Corresponding Author: Sang-Woong Lee. Email: slee@gachon.ac.kr
Received: 26 January 2021; Accepted: 26 March 2021
Abstract: As the amount of online video content is increasing, consumers are becoming increasingly interested in various product names appearing in videos, particularly in cosmetic-product names in videos related to fashion, beauty, and style. Thus, the identification of such products by using image recognition technology may aid in the identification of current commercial trends. In this paper, we propose a two-stage deep-learning detection and classification method for cosmetic products. Specifically, variants of the YOLO network are used for detection, where the bounding box for each given input product is predicted and subsequently cropped for classification. We use four state-of-the-art classification networks, namely ResNet, InceptionResNetV2, DenseNet, and EfficientNet, and compare their performance. Furthermore, we employ dilated convolution in these networks to obtain better feature representations and improve performance. Extensive experiments demonstrate that YOLOv3 and its tiny version achieve higher speed and accuracy. Moreover, the dilated networks marginally outperform the base models, or achieve similar performance in the worst case. We conclude that the proposed method can effectively detect and classify cosmetic products.
Keywords: Cosmetic product detection; cosmetic product classification; deep learning
Cosmetics are substances that are applied on the body and are intended to improve the appearance of a person. Accordingly, they are quite important in certain aspects of daily life. Most of them are applied on the face and hair. They are usually combinations of chemicals, some of which are extracted from natural sources, whereas others are synthetic. Common types of cosmetics include mascaras, lipsticks, eyeshadows, foundations, blushers, cleansers, lotions, shampoos, hair gels, hairsprays, and perfumes.
Over the years, several cosmetics have been specifically developed for each part of the face, and recently, lifestyle and environmental changes have led to an increasing demand for skin and face care products, particularly for those of natural or organic origin. Moreover, the technological advancements of the information age directly or indirectly affect the purchasing decisions of consumers, who, for example, interact with several mobile applications or watch YouTube videos. Therefore, it is critical to determine the current cosmetics industry trends, and collect the latest product and sales information so that a business model may be constructed. To this end, we use deep learning (DL) algorithms, as they have been proved successful in handling large amounts of unstructured data.
Image processing refers to the alteration and analysis of visual information and has been successfully applied in several areas [1–6]. Computer vision techniques are primarily used to identify, process, and analyze meaningful information from images, imitating the function of the human brain. Advances in artificial intelligence (AI) have allowed the application of several computer vision techniques in cosmetics and beauty [7–10]. However, little research has been conducted on the detection and classification of cosmetics. Prior methods primarily focused on makeup recommendation. Umer et al. [10] applied structural, statistical, transform-based, and hybrid texture analysis approaches for feature extraction, and used support vector machines, logistic regression, the k-nearest neighbor method, artificial neural networks, and decision tree classifiers for the classification of cosmetic products.
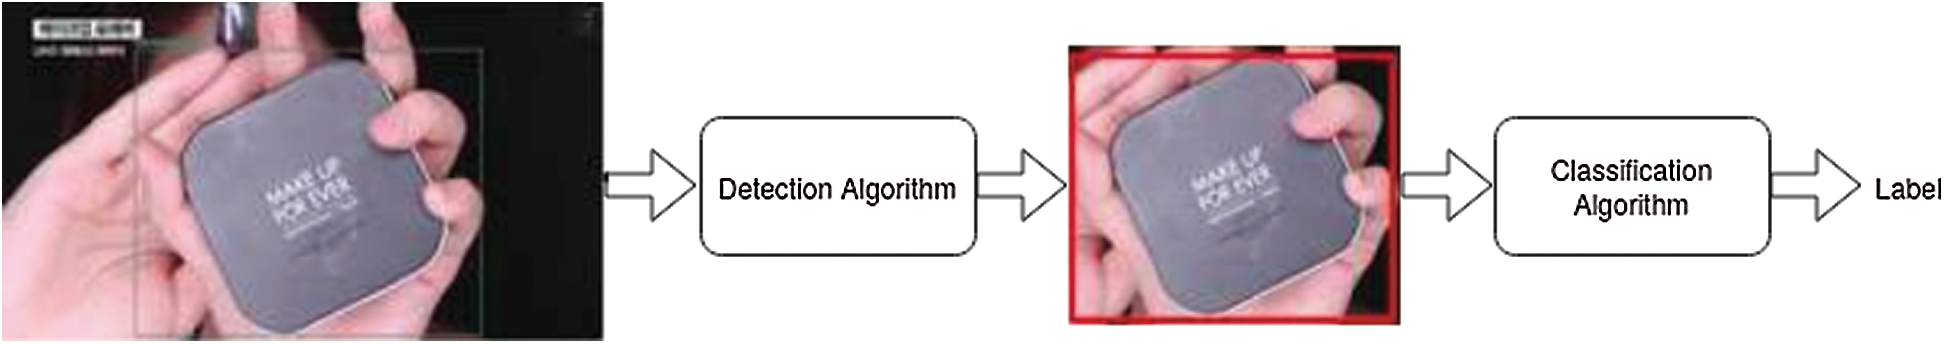
Figure 1: Overview of overall process
Nevertheless, several traditional machine learning methods have a significant disadvantage in practical applications, namely they use handcrafted features, which are difficult to design, have low abstraction level, and can only adapt to specific conditions, resulting in limited flexibility, generalizability, and transferability. In recent years, DL has been highly successful in computer vision tasks such as image classification [1,11–14], object detection [2,15,16], and image segmentation [17–20]. Convolutional neural networks (CNNs) have been widely adopted because of their strong feature representations, leading to stable performance. In contrast to linear models, deep neural networks model data nonlinearities using various nonlinear activation functions, such as sigmoid, tanh, and ReLU, thus capturing more complex features. This has been applied in classification, segmentation, and recommendation tasks, where deep neural networks are more effective than traditional methods. In this study, we use beauty videos (involving cosmetics) that could be of interest to young women. We propose a two-stage AI model that locates and identifies cosmetic products in images and videos [21]. The overall framework of our proposed method is shown in Fig. 1.
The major contributions of this study are summarized below:
• We propose a DL-based cosmetic data detection and classification network. To the best of our knowledge, this has not previously been considered.
• We analyze the accuracy and performance of several YOLO-based detection networks [15]. Moreover, we use dilated convolution in the following state-of-the-art classification networks: ResNet [14], InceptionResNetV2 [22], DenseNet [23], and EfficientNet [24].
• We conducted extensive experiments and compared the results obtained by different methods.
The rest of the paper is organized as follows. In Section 2, we present the proposed methodology and provide a detailed overview of the detection and the classification algorithms. In Section 3, we describe the dataset, and we provide the implementation details and evaluation metrics. The results are discussed in Section 4. Finally, the paper is concluded in Section 5.
In this study, we propose a detection and classification method for cosmetic products based on computer vision algorithms. The proposed system consists of two components: detection from images or videos, and classification. The block diagram of the proposed method is shown in Fig. 2.
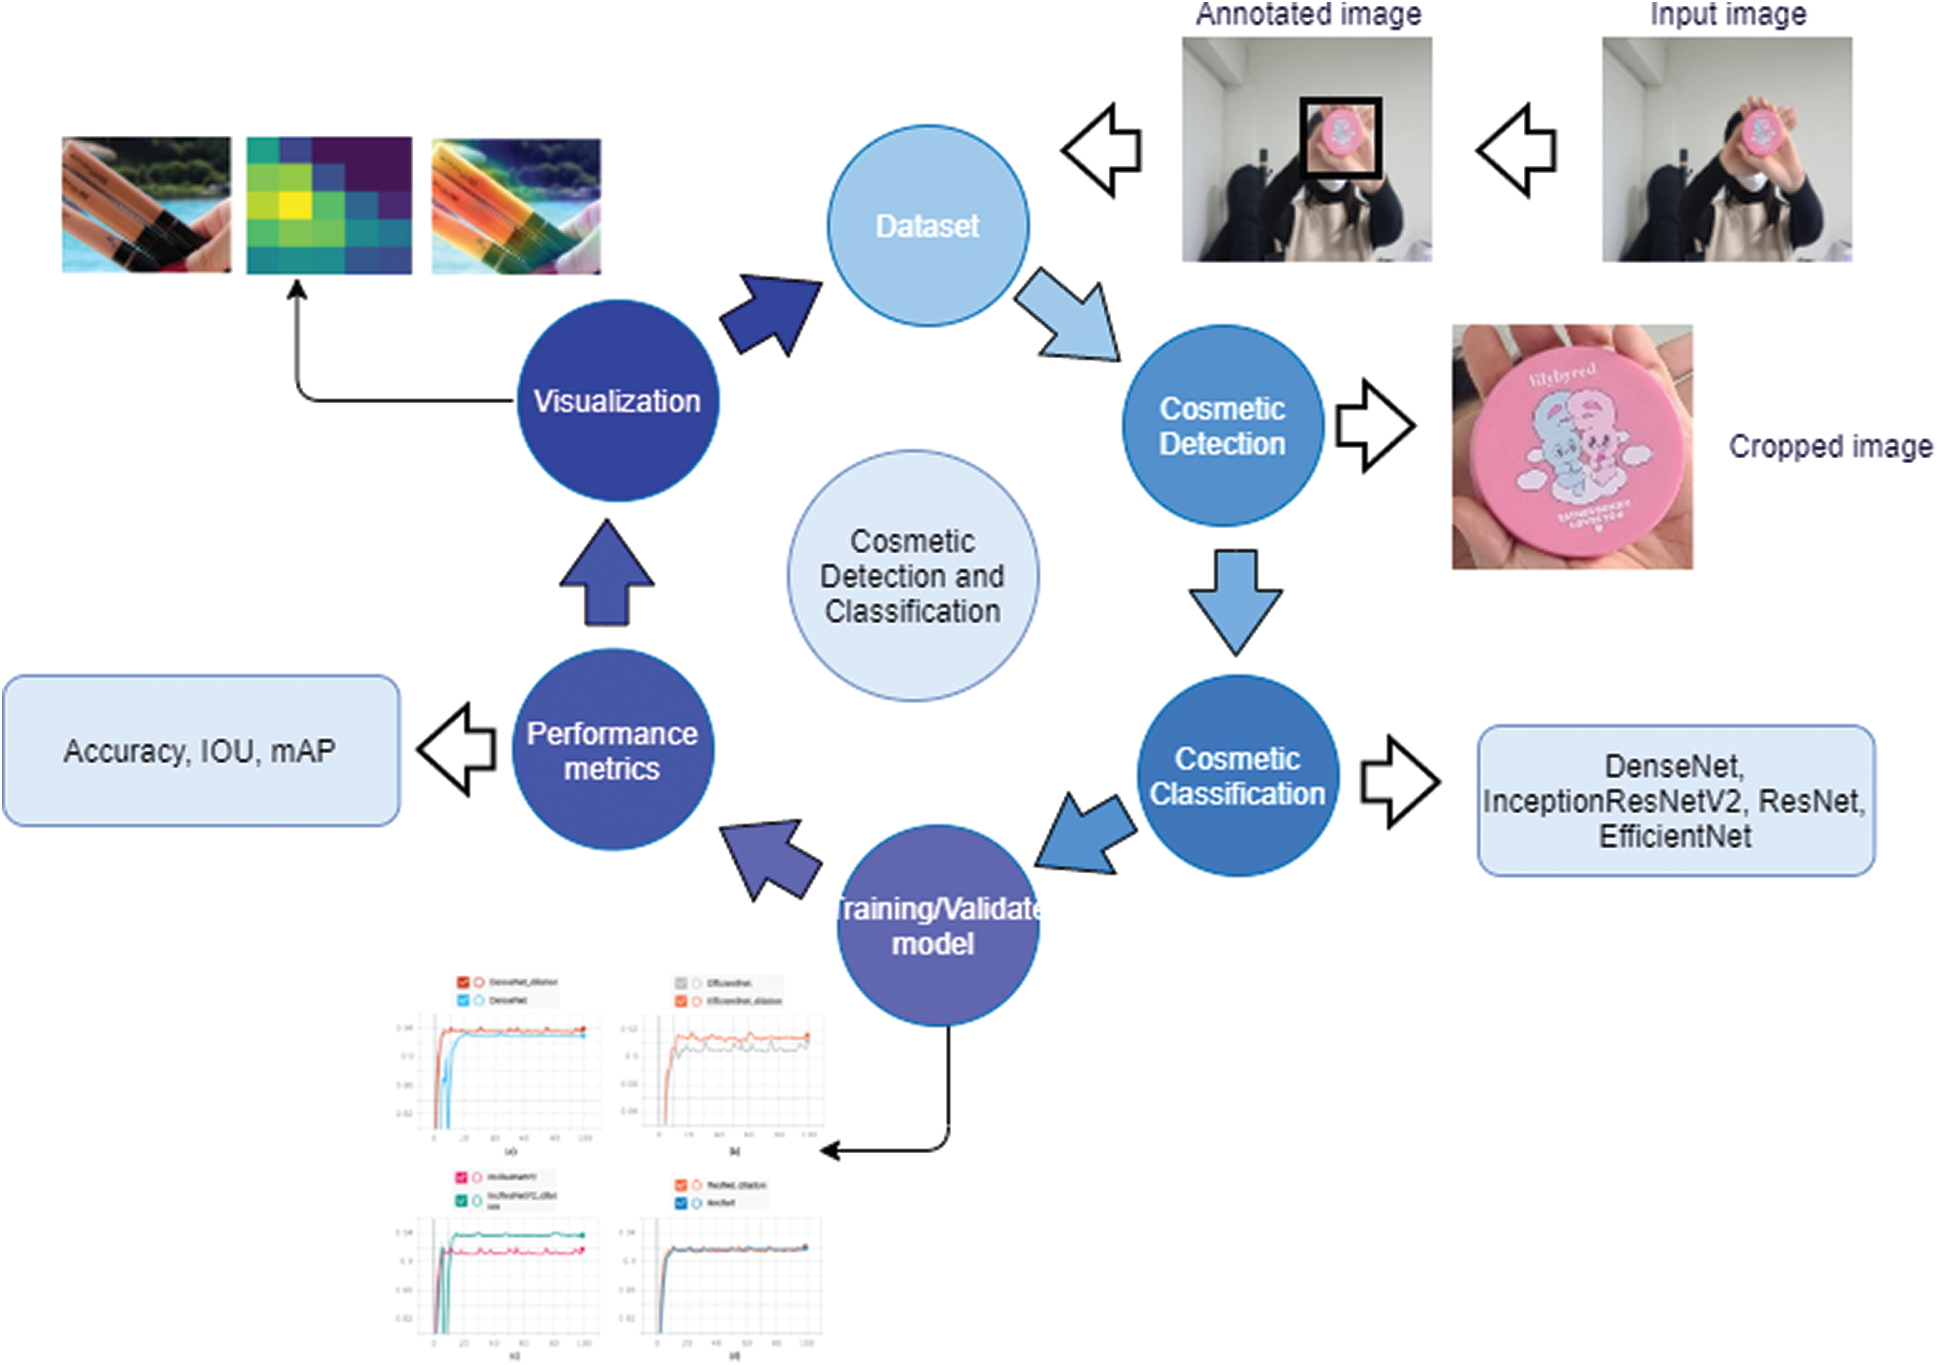
Figure 2: Flow diagram of proposed method: First, manually annotated images are fed into a detection network such as YOLO [15]. These images are subsequently cropped to the bounding box and are fed to the classification model. Performance metrics are used to evaluate the classification results, and finally, CAM [21] is generated to validate the performance of the network
We employ variants of YOLO for the detection and localization of cosmetics. Specifically, we use YOLOv1 [15], YOLOv1-tiny, YOLOv2 [25], YOLOv2-tiny, YOLOv3 [26], and YOLOv3-tiny, and we compare their performance in real time, in terms of speed and accuracy. The “tiny” YOLOs are smaller versions of the corresponding YOLOs and run at higher frame-per-second (fps) rates at the expense of accuracy. The main principle is to divide an image into a grid of size
Given an object, each grid cell predicts C class probabilities, and
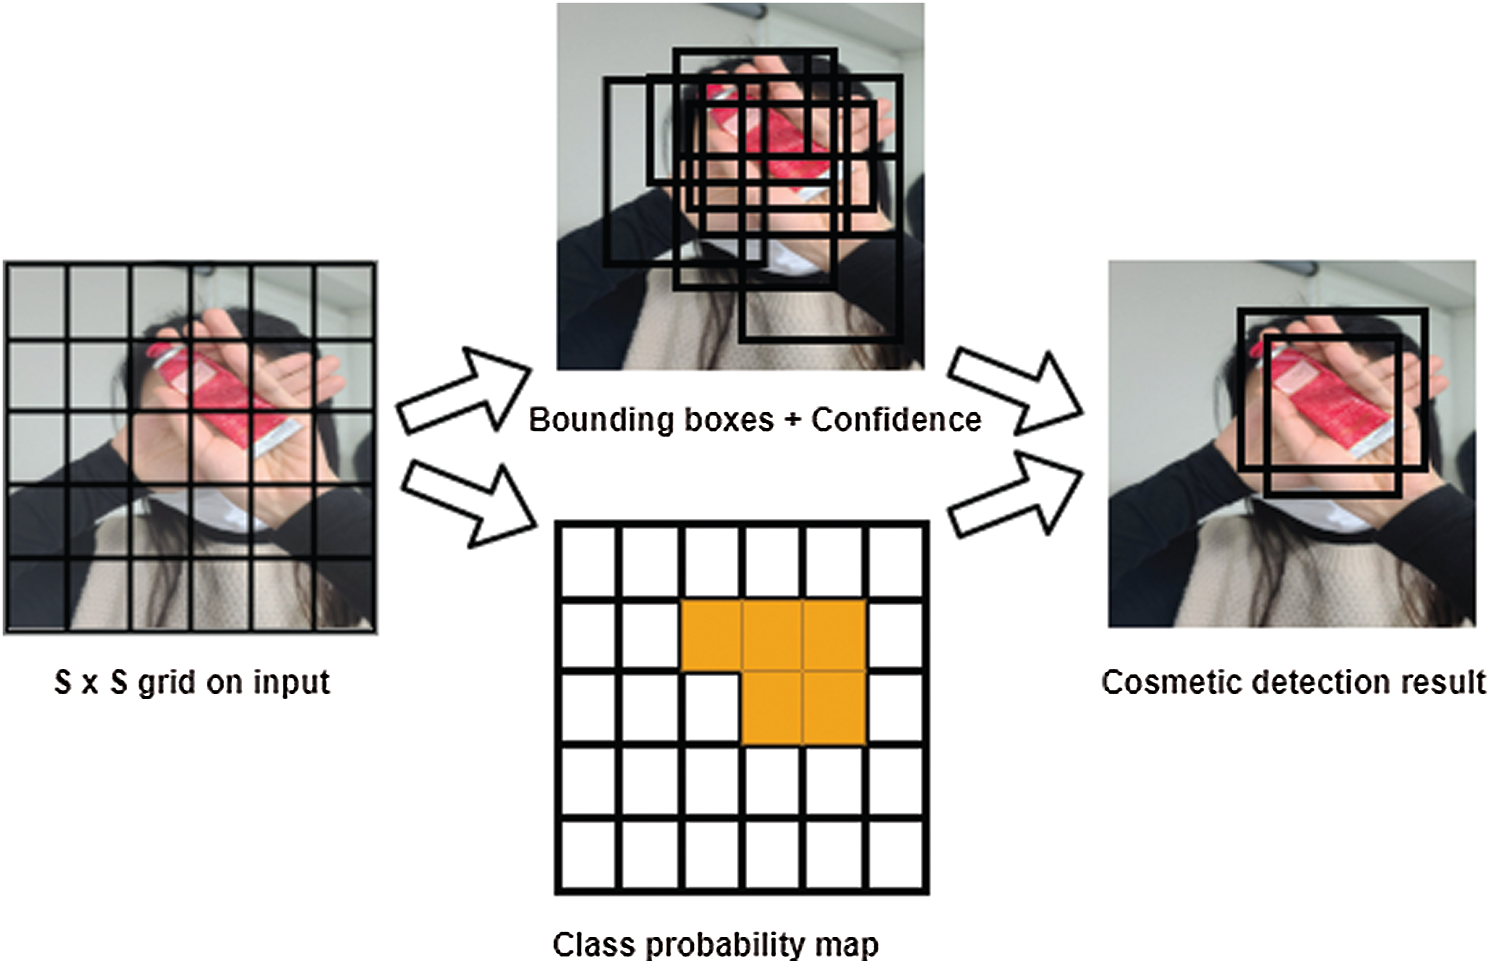
Figure 3: YOLO model detection
The loss function is used to improve the center and bounding box for each prediction. Every image is divided into an
After the bounding box is identified using YOLO, and all images are cropped accordingly, the result is fed into the state-of-the-art CNN architectures ResNet [14], InceptionResNetV2 [22], DenseNet [23], and EfficientNet [24] for classification. A CNN consists of a stack of convolution layers followed by downsampling layers such as max-pooling and ReLU activation function, as well as flatten and dense layers with softmax output activation function. A set of filters extract essential features with increasing complexity for classification. The kernel is convolved over the input image during the feed-forward process and generates a feature map by computing the dot product between the filter and the input entries. Thereby, the network learns essential filters when it detects complex features at a spatial position. A max pooling layer is used to reduce the spatial size of the feature maps at different layers and reduce computational complexity by reducing the number of parameters. Usually, the filter size is set to 2 × 2, with a stride of 2, downsampling the input feature map by 2 along both the width and height by determining the maximum of four numbers. A fully connected layer is used at the end to obtain information on the shape of the image. Using the softmax function, probability scores are generated for each class in the last layer. The following CNN architectures were selected for classification:
• ResNet: This model was proposed by He et al. [14]. 224 × 224 RGB three-color-channel images are used as inputs to the model, during training. Unlike traditional CNN architectures such as VGG16 [12], which stacks the convolutional layers resulting in vanishing gradient, ResNet uses skip connections so that the gradient can flow directly from the last layers to the initial filters. Therefore, it introduces identity shortcut connections, aiding in skipping one or more layers. The model uses global average pooling layers at the end, and a 1000-way dense layer with softmax.
• InceptionResNetV2: This network was proposed by C. Szegedy et al. [22]. It combines the Inception architecture with residual connections. An input of size 299 × 299 is fed into the 164-layer-deep network. Convolutional filters of multiple sizes are combined with residual connections to avoid the degradation problem and reduce training time.
• DenseNet: This network was proposed in [23]. It is quite narrow and requires fewer parameters. It can effectively alleviate the gradient problem, as each layer has access to the gradients from the loss function and the input image. Unlike ResNet, which uses the output feature maps of a layer with the previous incoming feature maps, DenseNet concatenates them. It takes as input three-channel images of size 224 × 224, and global average pooling is performed at the end of the last dense block. Finally, a softmax classifier is attached.
• EfficientNet: This model was proposed in [24]. It is a simple and effective scaling technique that applies a compound coefficient to uniformly scale network resolution, width, and depth.
Recent 2D neural networks often use small convolutional kernels of size 3 × 3 to reduce the number of parameters and enlarge the receptive field by alternating convolutions and pooling operations so that large image contexts may be captured. This successive downsampling process significantly reduces spatial resolution, resulting in information loss. Recently, dilated convolutions were proposed for semantic image segmentation [28]. By adding dilated convolutions at end layers, the feature maps can be computed with a high spatial resolution, and the size of the receptive field can be enlarged arbitrarily. Let
Using Eq. (3), we add dilated convolutions in the classification networks at the last layers. We select a dilation rate of 2 to enlarge the receptive field. For ResNet, InceptionResNetV2, and DenseNet, we use a dropout layer, with a dropout ratio of 0.5 after each 3 × 3 convolution to avoid overfitting. Similarly, we use the spatialDropout operation with a rate of 0.2 for EfficientNet. Thus, the dilated classification networks can capture better contextual image information and retain high spatial resolution.
The dataset consisted of 58 cosmetic varieties manufactured by 29 companies, collected from YouTube videos. Label numbers were determined by the order in which the images were collected. The ratio of training to test data was 6:4. In the classification process, as shown in Tab. 1, a learning image was formed for each label. For convenience, the labels were assigned numbers in the range of 0–90. Data augmentation techniques, namely scaling, cropping, and horizontal flipping, were performed before the images were fed into the CNN. Specifically, the images were first scaled by a random factor in the range [1.15, 1.25]. Then, a patch of the same size as that of the original image was randomly cropped from the scaled image. After the sampling step, each image was horizontally flipped with a probability of 0.5. Examples of augmentation are shown in Fig. 4.
The experiment was conducted on a computer with an Intel Core i7–4770 processor, an NVIDIA Ge Force 1080Ti graphics card, and 36 GB RAM. A python wrapper was used to incorporate Darknet into the system. We retained the same settings as in the original network architecture during the training of each variant of the YOLO versions. YOLOv1 uses 24 convolutional layers, followed by two fully connected layers. In the tiny version, nine convolutional layers and fewer filters were used; the other parameters were the same. Detailed information regarding all YOLO variants is provided in Tab. 2.
Table 1: Organization of training and testing data
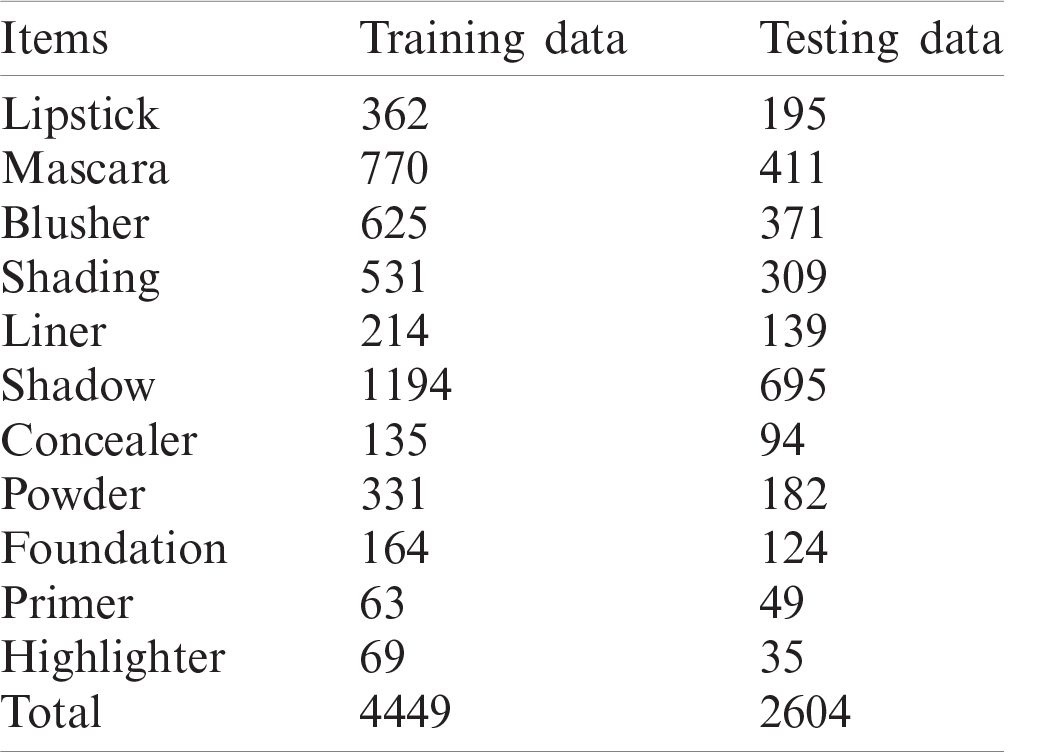
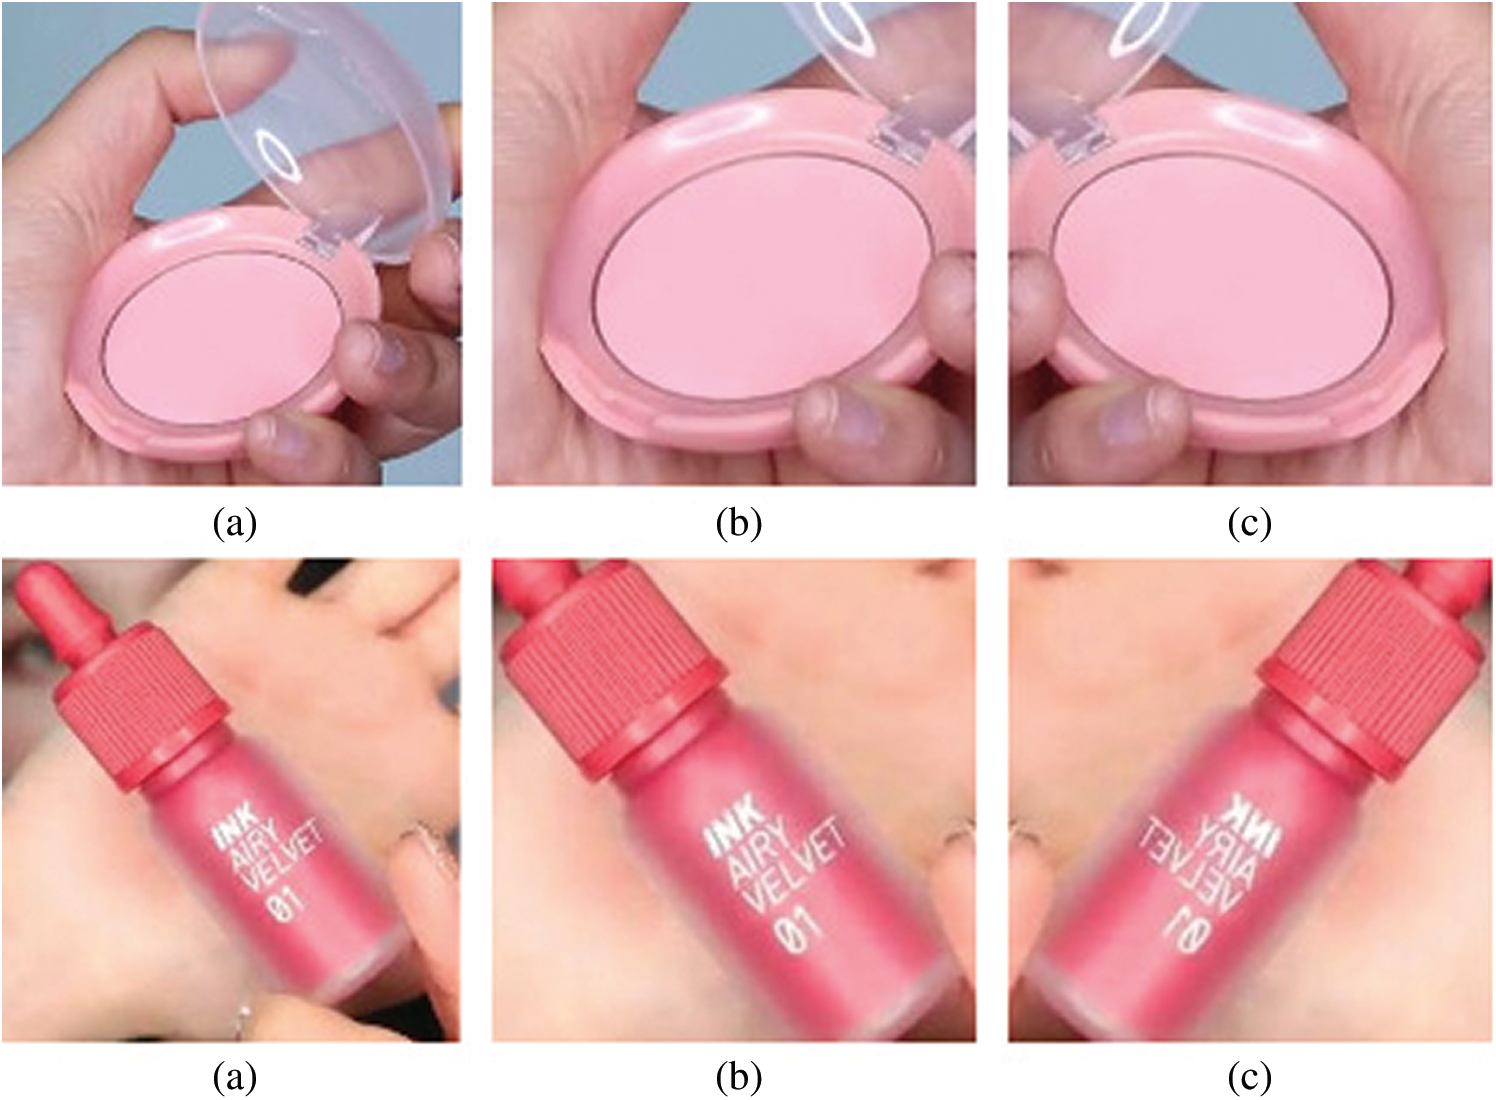
Figure 4: Examples of image augmentation operations: (left): original images, (middle): scaling and cropping, and (right): horizontal flip
For classification, we initialized the pretrained weights of ResNet, InceptionResNetV2, DenseNet, and EfficientNet with or without dilated convolution, and used stochastic gradient descent with a batch size of 8. The initial learning rate was 0.0001, and this was divided by 10 when the patience level exceeded 8. We used a weight decay of 0.0001 and a momentum of 0.9 without an accelerated gradient. We used 2D images of size 224 × 224 as input to the network.
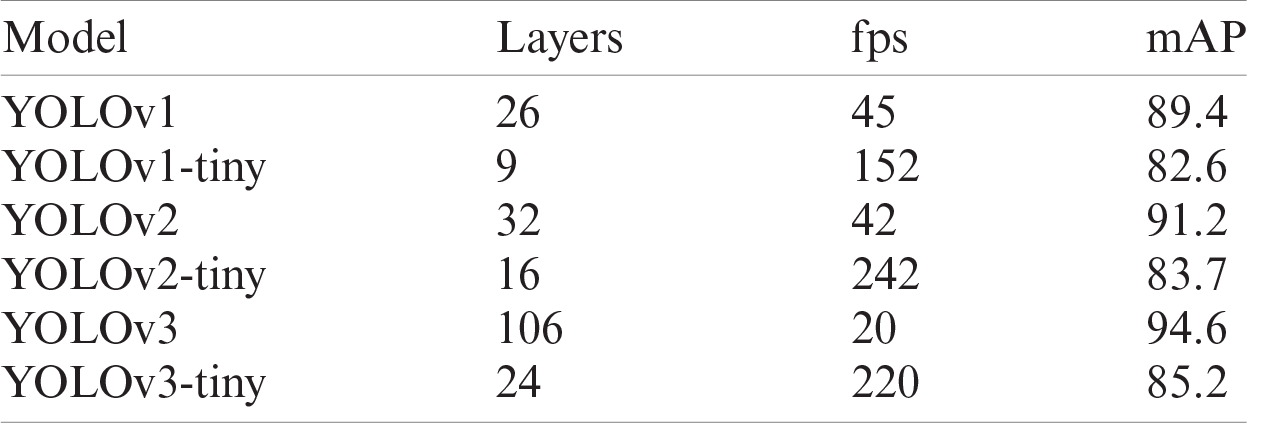
Table 2: Comparison of different version of YOLO variants in terms of number of layers, fps, and mAP
The Albumentation library was used for data augmentation along with the bounding boxes [29]. The training set was used to train the model and learn the parameters. The validation set was used to optimize the model and test it during training, that is, to automatically adjust the learning rate and determine whether to stop early according to the performance at given training step. The test set was used to evaluate the classification and generalization ability of the proposed model.
To evaluate the classifiers, we used the accuracy (ACC) score as a performance metric. It is computed as follows:
4.1 Comparison of Detection Algorithms
We evaluated the performance of the proposed method using different state-of-the-art detection methods, namely YOLOv1, YOLOv1-tiny, YOLOv2, YOLOv2-tiny, YOLOv3, and YOLOv3-tiny. The results are presented in Tab. 2. YOLOv1 achieved a mean average precision (mAP) score of 89.4 at 45 fps, with 26 convolutional layers. The tiny version of YOLOv1 reached 82.6 mAP, with only nine convolutional layers at a rate of 152 fps. YOLOv2 achieved a gain of approximately 3% in terms of mAP over YOLOv1, that is, a score of 91.2 mAP at a slightly lower speed (42 fps). However, the tiny version outperformed YOLOv2, with 83.7 mAP at a significantly higher speed (242 fps). YOLOv3 achieved the best detection performance, with 94.60 mAP using 106 convolutional layers. This represents a 5% and 3% improvement over the mAP scores of YOLOv1 and YOLOv2, respectively. The tiny version of YOLOv2 is marginally better than YOLOv3-tiny in terms of speed; however, it is recommended to use YOLOv3-tiny owing to its superior combination of speed and performance.
Table 3: Performance of classification networks
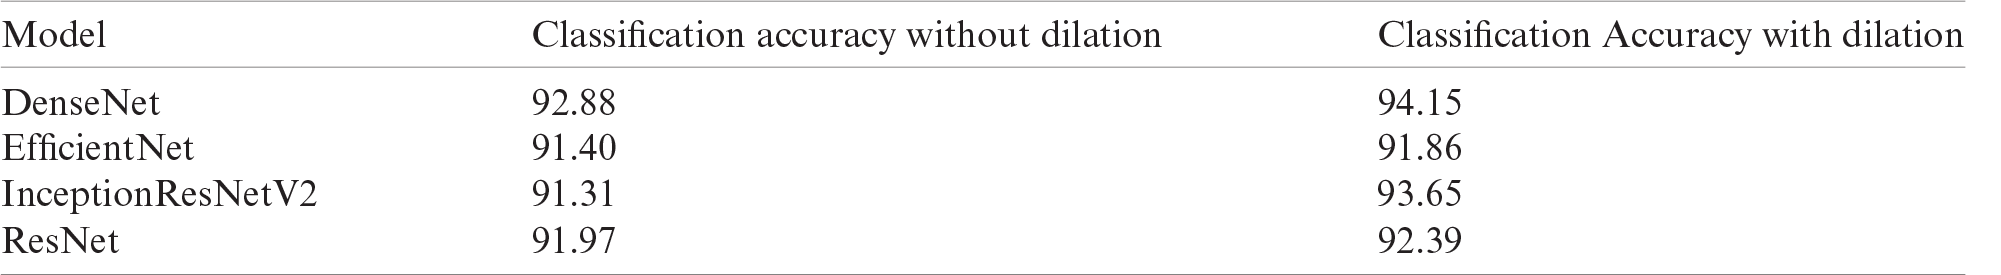
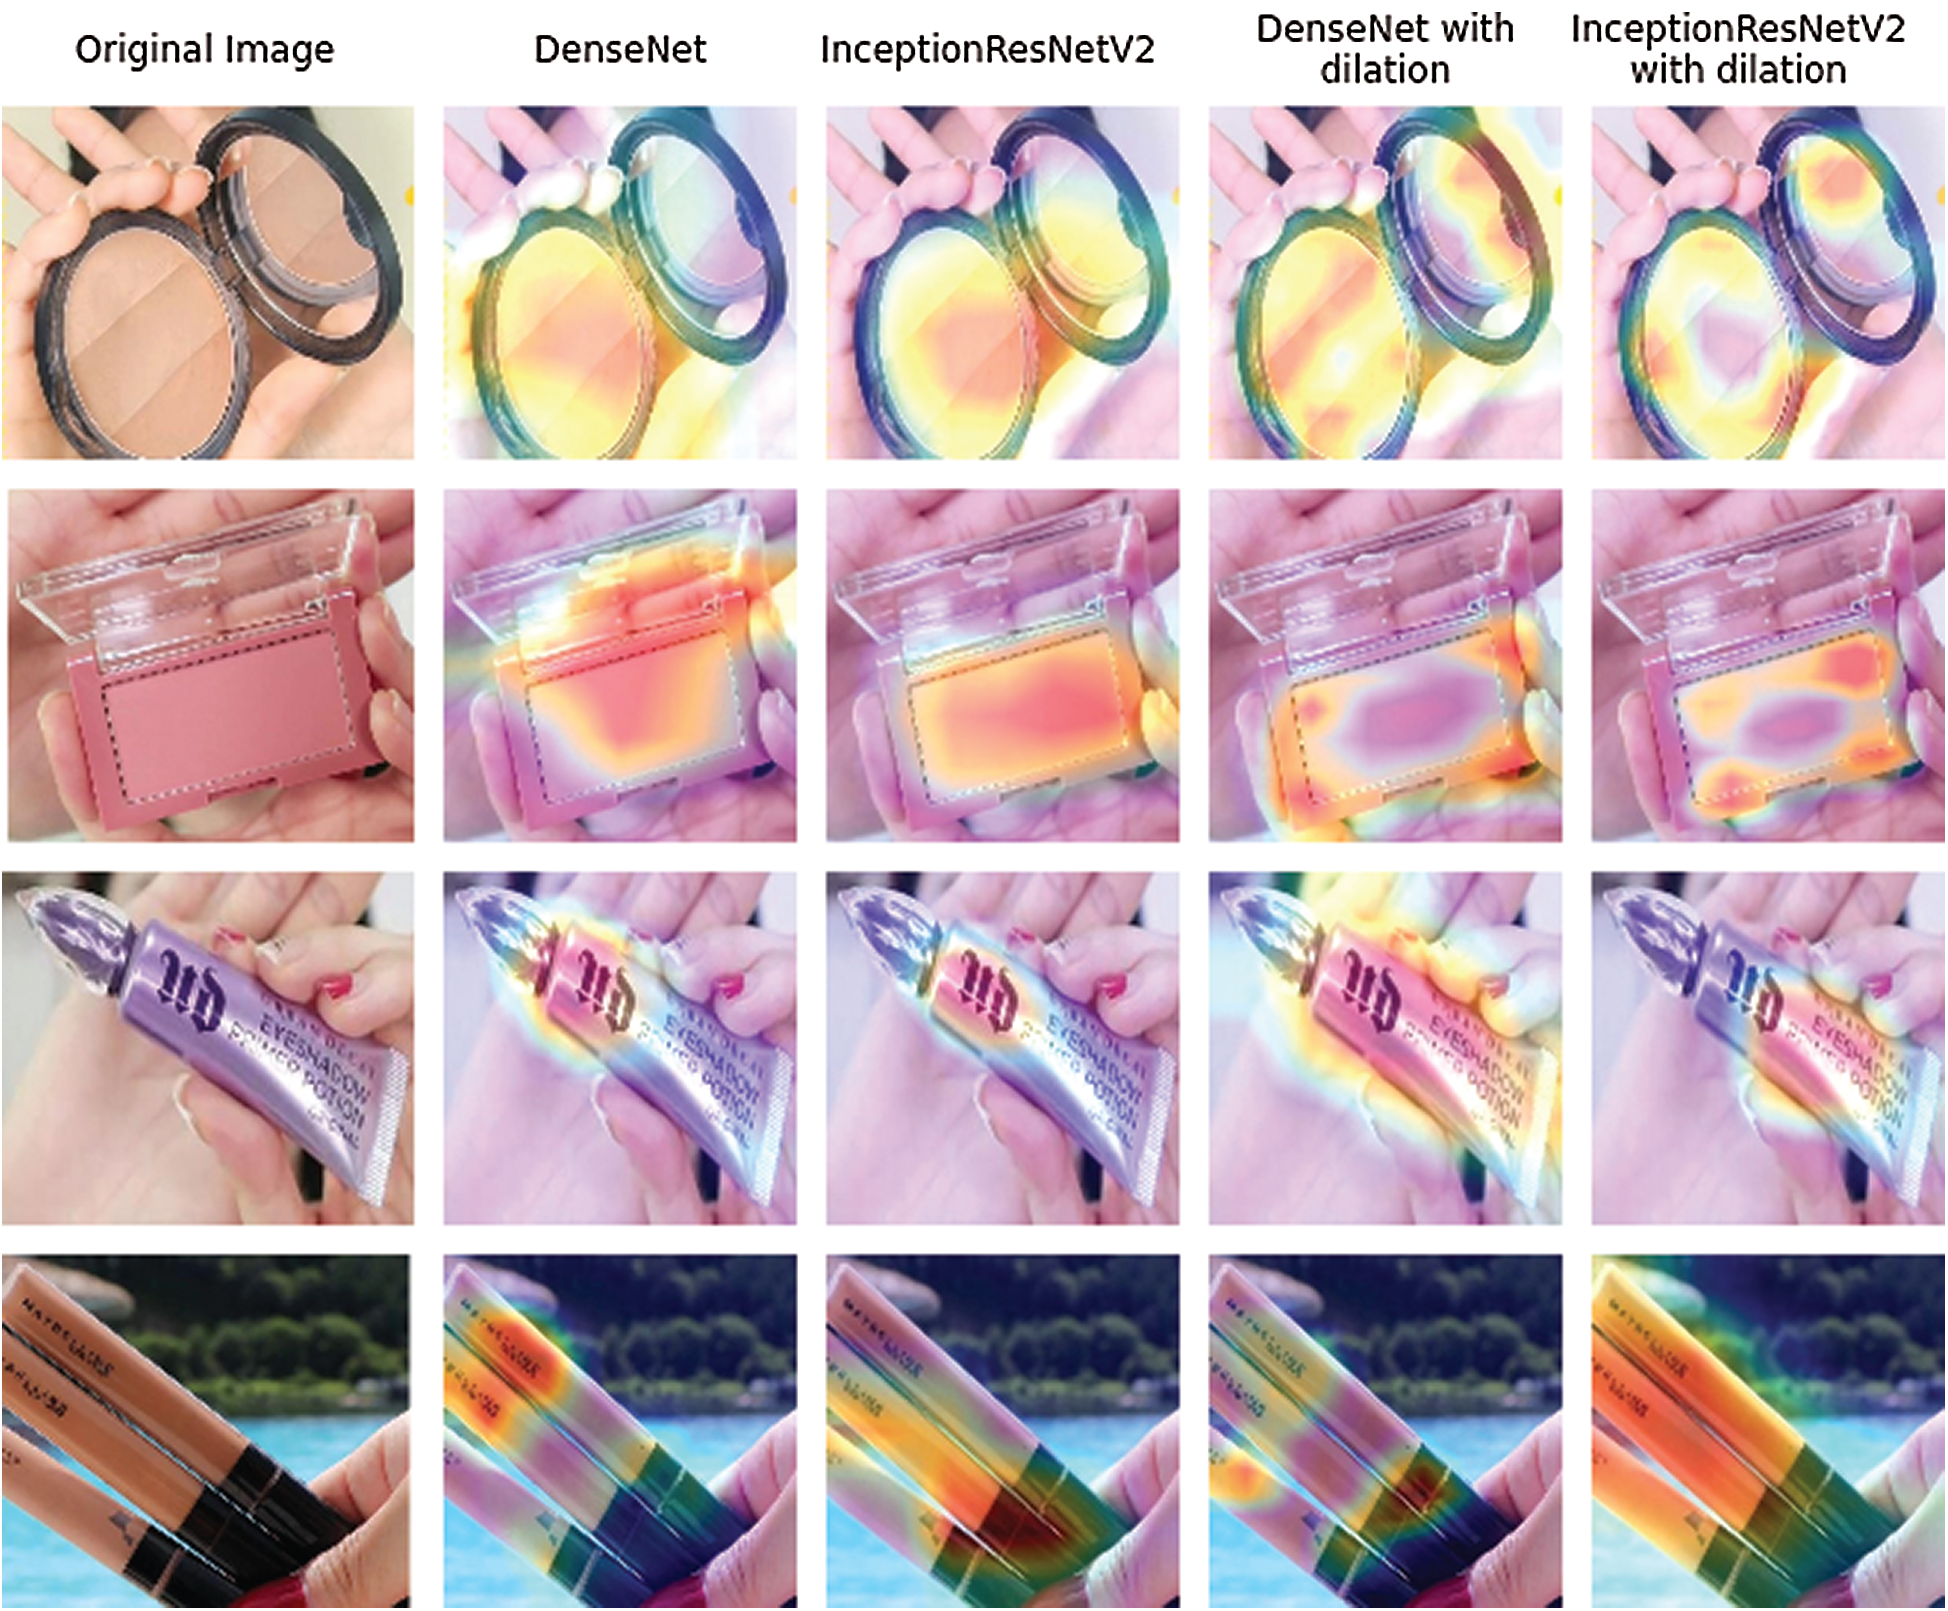
Figure 5: Effect of dilated convolution on different images through class activation mapping
4.2 Comparison of Classification Networks
Herein, we compare the classification performance of different architectures. Tab. 3 shows the accuracy of the classification networks. The cropped image generated from the detection algorithm is the input to the classification networks. It can be observed that DenseNet outperformed the other networks, achieving an accuracy of 92.88%. The other networks exhibited similar performance: EfficientNet (91.40%), InceptionResNetV2 (91.31%), and ResNet (91.97%). Furthermore, accuracy improved after the addition of dilated convolution, or was the same in the worst case. The validation accuracy of the dilated model was always higher than that of the other CNN models. DenseNet and InceptionResNetV2 with dilated convolution achieved a classification accuracy of 94.15% and 93.65%, respectively, outperforming the corresponding base models significantly. Similarly, EfficientNet and ResNet with dilation achieved similar performance gains. Fig. 5 shows the efficacy of adding dilated convolution through a class activation mapping, where the dilated networks achieve better feature representations. The training and testing accuracy is shown in Fig. 6.
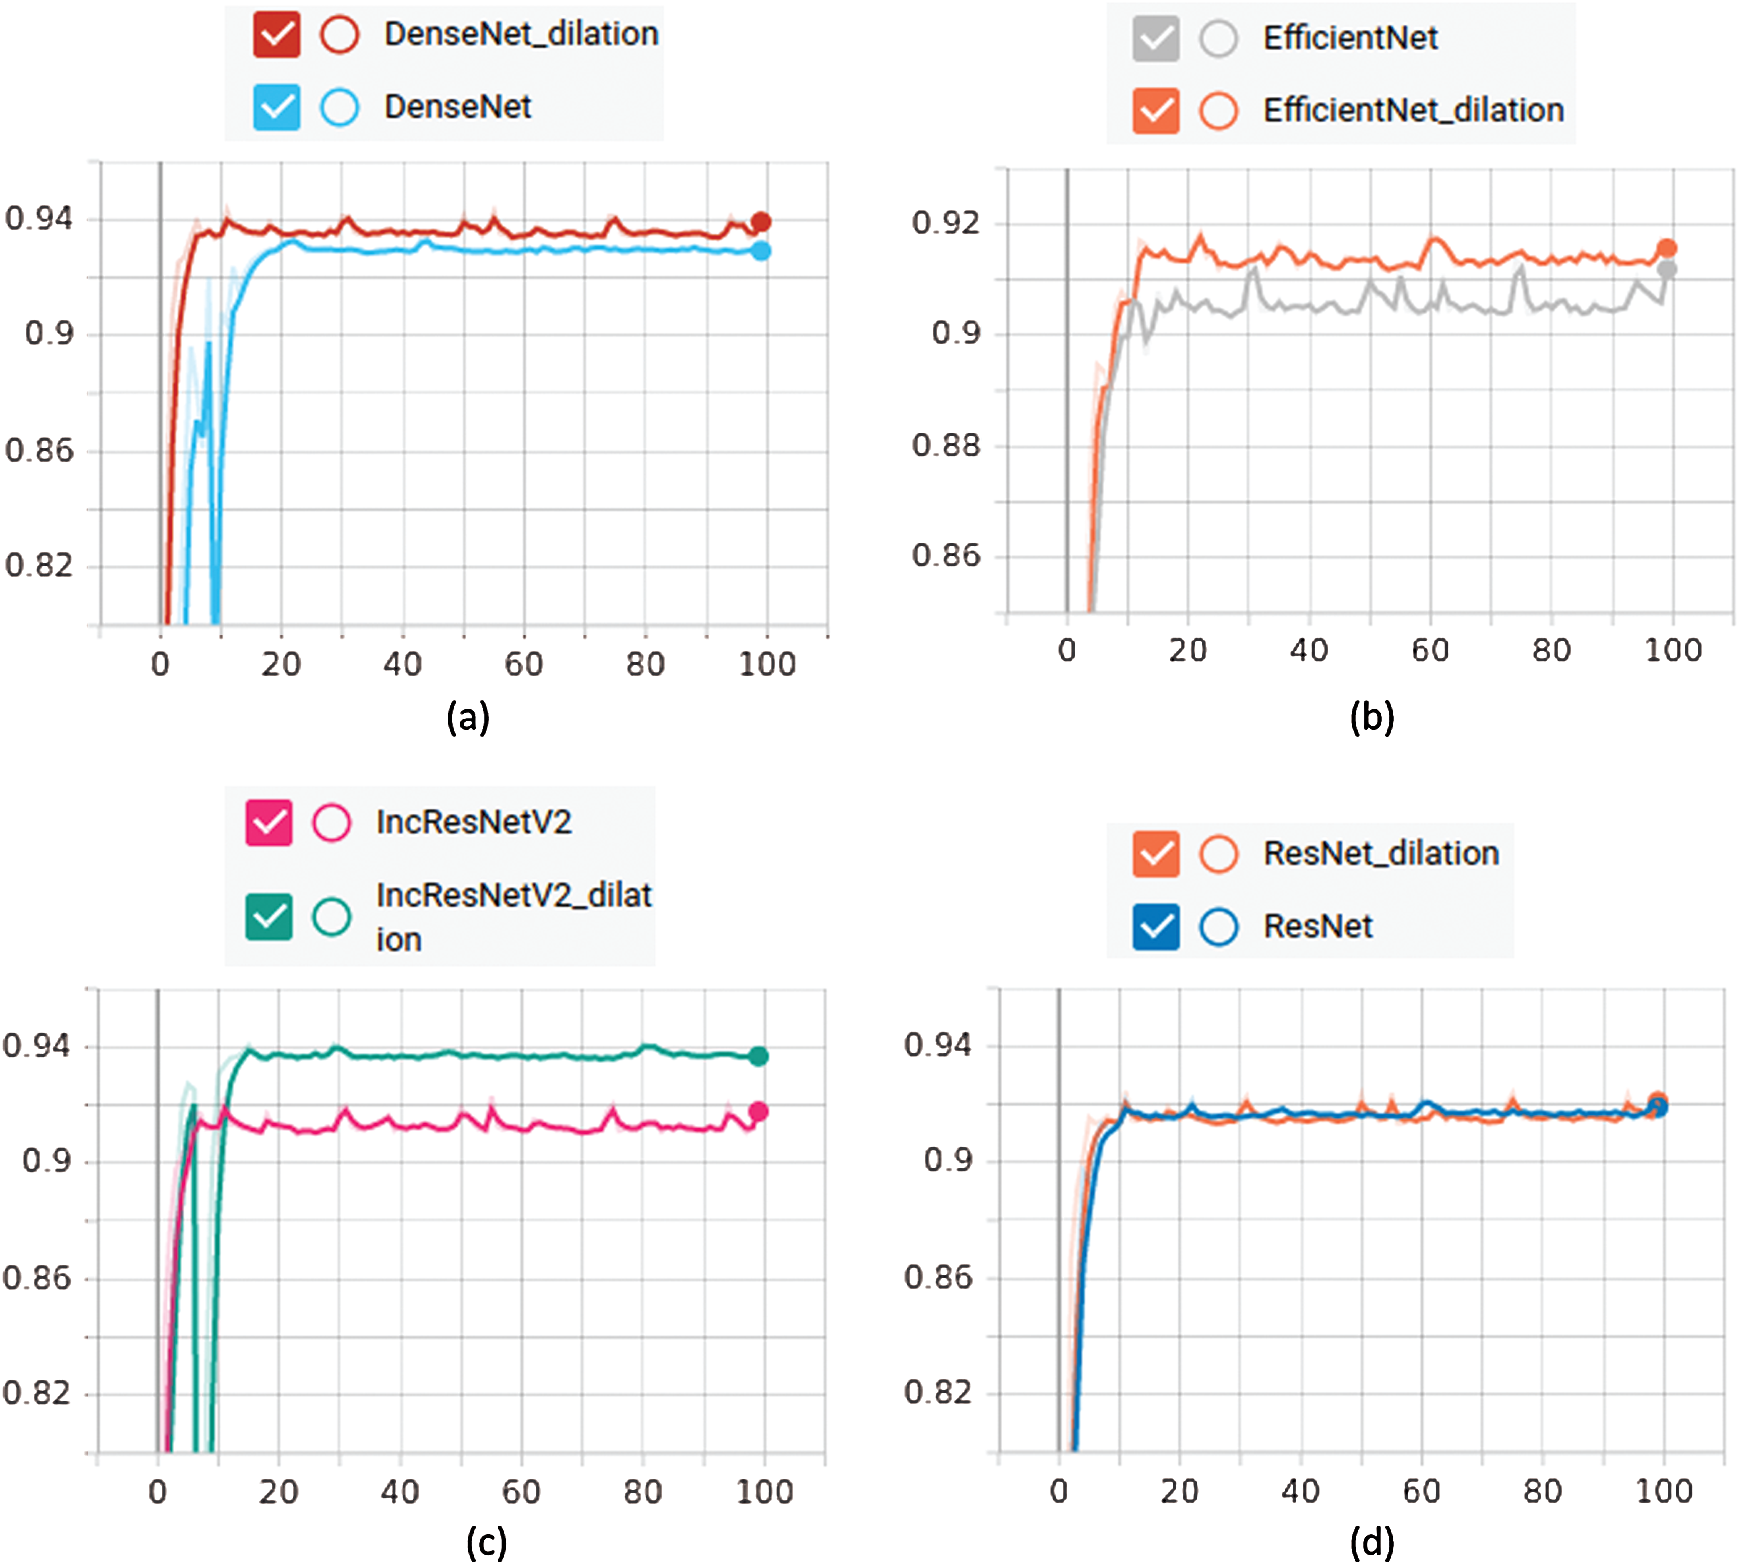
Figure 6: Testing accuracy of different models
We developed a detection and recognition system for cosmetic products in images or videos. The proposed method has two stages: detection and classification. For the former, we used various variants of YOLO, whereas for the later, we employed several CNN architectures. It was observed that YOLOv3 achieved the best overall performance. Furthermore, YOLOv3-tiny outperformed the other tiny versions. In classification, DenseNet was more effective than InceptionResNetV2, ResNet, and EfficientNet. Moreover, the addition of dilated convolution with a dilation rate of 2 further improved the classification performance. It was demonstrated that the proposed method can effectively detect and classify cosmetic products. In the future, we intend to study effective and efficient data visualization techniques so that global trends in cosmetic products can be analyzed using computer vision and DL techniques.
Acknowledgement: We would like to thank Mr. J. -H. Kim for providing supporting materials and suggestions.
Author Contributions: Se-Won Kim and Sang-Woong Lee conceived and planned the concept. Se-Won Kim developed the theory, conducted the experiments, and was responsible for writing the manuscript. Sang-Woong Lee verified the analytical methods. Sang-Woong Lee encouraged Se-Won Kim to undertake and supervise this study, provided critical feedback, and helped shape the research, analysis, and manuscript. All authors discussed the results and contributed to the final manuscript.
Funding Statement: This work was supported by a Gachon University research fund (GCU-2020–02500001) and by the GRRC program of Gyeonggi province [GRRC-Gachon2020(B02), AI-based Medical Information Analysis].
Conflicts of Interest: The authors declare that they have no conflicts of interest to report regarding the present study.
1. S. Poudel, Y. J. Kim, D. M. Vo and S. W. Lee, “Colorectal disease classification using efficiently scaled dilation in convolutional neural network,” IEEE Access, vol. 8, pp. 99227–99238, 2020. [Google Scholar]
2. S. Ren, K. He, R. Girshick and J. Sun, “Faster r-cnn: Towards real-time object detection with region proposal networks,” Advances in Neural Information Processing Systems, vol. 39, no. 6, pp. 1137–1149, 2015. [Google Scholar]
3. C. Henry, S. Poudel, S. W. Lee and H. Jeong, “Automatic detection system of deteriorated pv modules using drone with thermal camera,” Applied Sciences, vol. 10, no. 11, 2020. [Google Scholar]
4. S. Poudel, “A novel integrated convolutional neural network via deep transfer learning in colorectal images,” Information Technology Convergence Engineering Journal, vol. 9, no. 9, pp. 9–21, 2019. [Google Scholar]
5. H. Wang, Z. Li, Y. Li, B. B. Gupta and C. Choi, “Visual saliency guided complex image retrieval,” Pattern Recognition Letters, vol. 130, pp. 64–72, 2020. [Google Scholar]
6. H. Yoon, B. H. Kim, M. Mukhriddin and J. Cho, “Salient region extraction based on global contrast enhancement and saliency cut for image information recognition of the visually impaired,” KSII Transactions on Internet and Information Systems, vol. 12, no. 5, pp. 2287–2312, 2018. [Google Scholar]
7. T. Alashkar, S. Jiang, S. Wang and Y. Fu, “Examples-rules guided deep neural network for makeup recommendation,” Proc. of the AAAI Conf. on Artificial Intelligence, San Francisco, California, USA, vol. 31, no. 1, pp. 941–947, 2017. [Google Scholar]
8. H. Chang, J. Lu, F. Yu and A. Finkelstein, “Pairedcyclegan: Asymmetric style transfer for applying and removing makeup,” in Proc. of the IEEE Conf. on Computer Vision and Pattern Recognition, Salt Lake City, Utah, USA, pp. 40–48, 2018. [Google Scholar]
9. C. J. Holder, B. Obara and S. Ricketts, “Visual siamese clustering for cosmetic product recommendation,” In Asian Conf. on Computer Vision, Springer, Perth, Australia, pp. 510–522, 2018. [Google Scholar]
10. S. Umer, P. P. Mohanta, R. K. Rout and H. M. Pandey, “Machine learning method for cosmetic product recognition: A visual searching approach,” Multimedia Tools and Applications, pp. 1–27, 2020. [Google Scholar]
11. A. Krizhevsky, I. Sutskever and G. E. Hinton, “Imagenet classification with deep convolutional neural networks,” Advances in Neural Information Processing Systems, vol. 25, pp. 1097–1105, 2012. [Google Scholar]
12. Z. Liu, X. Xiang, J. Qin, Y. Ma, Q. Zhang et al., “Image recognition of citrus diseases based on deep learning,” Computers, Materials & Continua, vol. 66, no. 1, pp. 457–466, 2020. [Google Scholar]
13. K. Simonyan and A. Zisserman, “Very deep convolutional networks for large-scale image recognition,” arXiv preprint arXiv: 1409.1556, 2014. [Google Scholar]
14. K. He, X. Zhang, S. Ren and J. Sun, “Deep residual learning for image recognition,” in Proc. of the IEEE Conf. on Computer Vision and Pattern Recognition, Caesars palace, Las Vegas, Nevada, USA, pp. 770–778, 2016. [Google Scholar]
15. J. Redmon, S. Divvala, R. Girshick and A. Farhadi, “You only look once: unified, real-time object detection,” Proc. of the IEEE Conf. on Computer Vision and Pattern Recognition, Las Vegas, Nevada, USA, pp. 779–788, 2016. [Google Scholar]
16. T. Y. Lin, P. Dollár, R. Girshick, K. He, B. Hariharan et al. “Feature pyramid networks for object detection,” in Proc. of the IEEE Conf. on Computer Vision and Pattern Recognition, Hawaii, USA, pp. 2612117–2125, 2017. [Google Scholar]
17. O. Ronneberger, P. Fischer and T. Brox, “U-net: Convolutional networks for biomedical image segmentation,” in Int. Conf. on Medical Image Computing and Computer-Assisted Intervention, Munich, Germany, pp. 234–241, 2015. [Google Scholar]
18. A. Renugambal and K. S. Bhuvaneswari, “Image segmentation of brain mr images using otsu's based hybrid WCMFO algorithm,” Computers, Materials & Continua, vol. 64, no. 2, pp. 681–700, 2020. [Google Scholar]
19. Z. Zhou, M. M. R. Siddiquee, N. Tajbakhsh and J. Liang, “Unet++: A nested u-net architecture for medical image segmentation,” In Deep Learning in Medical Image Analysis and Multimodal Learning for Clinical Decision Support, Granada, spain: Springer, pp. 3–11, 2018. [Google Scholar]
20. N. Q. Nguyen, D. M. Vo and S. W. Lee, “Contour-aware polyp segmentation in colonoscopy images using detailed up sampling encoder-decoder networks,” IEEE Access, vol. 8, pp. 99495–99508, 2020. [Google Scholar]
21. B. Zhou, A. Khosla, A. Lapedriza, A. Oliva and A. Torralba, “Learning deep features for discriminative localization,” Proc. of the IEEE Conf. on Computer Vision and Pattern Recognition, Las Vegas, Nevada, USA, pp. 2962921–2929, 2016. [Google Scholar]
22. C. Szegedy, S.Ioffe, V.Vanhoucke and A. Alemi, “Inception-v4, inception-resnet and the impact of residual connections on learning,” arXiv preprint arXiv: 1602.07261, 2016. [Google Scholar]
23. G. Huang, Z. Liu, L. V. D. Maaten and K. Q. Weinberger, “Densely connected convolutional networks,” in Proc. of the IEEE Conf. on Computer Vision and Pattern Recognition, Hawaii Convention Center, Honolulu, Hawaii, pp. 4700–4708, 2017. [Google Scholar]
24. M. Tan and Q. V. Le, “Efficientnet: Rethinking model scaling for convolutional neural networks,” arXiv preprint arXiv:1905.11946 2019. [Google Scholar]
25. J. Redmon and A. Farhadi, “YOLO9000: better, faster, stronger,” in Proc. of the IEEE Conf. on Computer Vision and Pattern Recognition, Hawaii, USA, pp. 7263–7271, 2017. [Google Scholar]
26. J. Redmon and A.Farhadi, “Yolov3: An incremental improvement,” arXiv preprint arXiv:1804.02767, 2018. [Google Scholar]
27. S. Ioffe and C. Szegedy, “Batch normalization: Accelerating deep network training by reducing internal covariate shift,” arXiv preprint arXiv: 1502.03167, 2015. [Google Scholar]
28. F. Yu and V. Koltun, “Multi-scale context aggregation by dilated convolutions,” arXiv preprint arXiv:1511.07122303, 2015. [Google Scholar]
29. A. Buslaev, V. I. Iglovikov, E. Khvedchenya, A. Parinov, M. Druzhinin et al., “Albumentations:Fast and flexible image augmentations,” Information, vol. 11, no. 2, 2020. [Google Scholar]
 | This work is licensed under a Creative Commons Attribution 4.0 International License, which permits unrestricted use, distribution, and reproduction in any medium, provided the original work is properly cited. |