DOI:10.32604/cmc.2021.017101
| Computers, Materials & Continua DOI:10.32604/cmc.2021.017101 | |
| Article |
Segmentation and Classification of Stomach Abnormalities Using Deep Learning
1Department of Computer Science, HITEC University Taxila, Taxila, Pakistan
2College of Computer Science and Engineering, University of Ha’il, Ha’il, Saudi Arabia
3Department of Software, Sejong University, Seoul, Korea, Gwangjin-gu, Korea
4College of Computer Engineering and Sciences, Prince Sattam Bin Abdulaziz University, Al-Khraj, Saudi Arabia
5Faculty of Applied Computing and Technology, Noroff University College, Kristiansand, Norway
*Corresponding Author: Oh-Young Song. Email: Oysong@sejong.edu
Received: 18 January 2021; Accepted: 21 February 2021
Abstract: An automated system is proposed for the detection and classification of GI abnormalities. The proposed method operates under two pipeline procedures: (a) segmentation of the bleeding infection region and (b) classification of GI abnormalities by deep learning. The first bleeding region is segmented using a hybrid approach. The threshold is applied to each channel extracted from the original RGB image. Later, all channels are merged through mutual information and pixel-based techniques. As a result, the image is segmented. Texture and deep learning features are extracted in the proposed classification task. The transfer learning (TL) approach is used for the extraction of deep features. The Local Binary Pattern (LBP) method is used for texture features. Later, an entropy-based feature selection approach is implemented to select the best features of both deep learning and texture vectors. The selected optimal features are combined with a serial-based technique and the resulting vector is fed to the Ensemble Learning Classifier. The experimental process is evaluated on the basis of two datasets: Private and KVASIR. The accuracy achieved is 99.8 per cent for the private data set and 86.4 percent for the KVASIR data set. It can be confirmed that the proposed method is effective in detecting and classifying GI abnormalities and exceeds other methods of comparison.
Keywords: Gastrointestinal tract; contrast stretching; segmentation; deep learning; features selection
Computerized detection of human diseases is an emerging research domain for the last two decades [1,2]. In medical imaging, numerous remarkable methods were developed for automated medical diagnosis systems [3]. Stomach infection is one of the most common types that caused a large number of deaths every year [4]. The most common type of disease related to the stomach is colorectal cancer. It affects both women and men [5]. Colorectal cancer consists of three significant infections that are polyp, ulcer, and bleeding. In 2015, about 132,000 cases of colorectal cancer were recorded in the USA [6]. A survey conducted in 2017 showed that approximately 21% population of the USA is suffering from gastrointestinal infections, and 765,000 deaths are noticed due to maladies found in the stomach [7]. According to the global cancer report of 2018 for 20 regions of the world, total estimated cases of cancer are 18.1 million. Among them, 9.2% for deaths and 6.1% for new cases relate to colorectal cancer. According to the American cancer society, in 2019, approximately 27,510 new stomach cancer cases of both genders (consisting of 10,280 women’s and 17,230 men’s) are observed in the US. A total of 11,140 deaths (consisting of 4340 women’s and 6800 men’s) are noticed in 2019 due to colorectal cancer [8].
GI infections can be easily cured if they were diagnosed at an early stage. As small bowel has a complex structure, that is why push gastroscopy is not considered as the best choice for the diagnosis of small bowel infections like bleeding, polyp, and ulcer [9]. The traditional endoscopic method is an invasive method that is not utilized by endoscopists and is also not recommended to patients due to its high level of discomfort [10]. These problems were resolved by a new technology introduced in the year 2000, namely, Wireless Capsule Endoscopy (WCE) [11]. WCE is a small pill shaped device, consisting of batteries, a camera, and a light source [12]. While passing through the gastrointestinal tract (GIT), WCE captures almost 50,000 images and releases them through the anus. Mostly malignant diseases of GIT like bleeding, polyp, and ulcer are diagnosed through WCE. WCE is proved to be an authentic modality for painless investigation and examination of GIT [13]. This technique is more convenient to use than traditional endoscopies. Moreover, it provides better diagnostic accuracy for bleeding and tumor detection, specifically in the small intestine [14]. It is too difficult for an expert physician to thoroughly examine all of the captured images as it is a chaotic and time taking task. The manual analysis of WCE frames is not an easy process, and it takes much time [15]. To resolve this problem, researchers are working on introducing several computer-aided diagnosis (CAD) methods [16]. The suggested methods will help the doctors to detect the disease more accurately in less time. A typical CAD system consists of five major steps that are image pre-processing, feature extraction, optimal feature selection, feature fusion, and classification. The extraction of useful features is one of the most significant tasks. Numerous features are extracted in the CAD systems for accurate diagnosis of disease. These features include texture [17], color [18], and so on [19]. All of the extracted features are not useful; there may exist some irrelevant. Therefore, it is essential to reduce the feature vector to remove irrelevant features for better efficiency.
In this work, to detect and classify GI abnormalities, two pipeline procedures are considered: bleeding segmentation and GI abnormality classification. The significant contributions of the work are: i) in the bleeding detection step, a hybrid technique is implemented. In this method, the original image is split into three channels and thresholding is applied for each color channel. After that, pixel-by-pixel matching is performed, and a mask is generated for each channel. Finally, combining all mask images in one image for final bleeding segmentation; ii) in the classification procedure, transfer learning is ustilized for extracting deep learning features. The original images are enhanced by using a unified method, which is a combination of chrominance weight map, gamma correction, haze reduction, and YCbCr color conversion. Later, deep learning features are extracted by using a pre-trained CNN model. Further, the LBP features are also obtained for textural information of each abnormal regions; iii) a new method named entropy controlled ensemble learning is proposed and it selects the best learning features for correct prediction as well as fast execution. The selected features are ensemble in one vector by using a concatenation approach; iv) the performance of the proposed method is validated by several combinations of features. Further, many classification methods are also used for validation of selected features vector.
Several machine learning and computer vision-based techniques are introduced for the diagnosis of human diseases like lung cancer, brain tumor, GIT infections from WCE images, and so on [20,21]. The stomach is one of the most significant organs of the human body. The most conspicuous diseases of the stomach are ulcer, bleeding, and polyp. In the study [22], the authors have utilized six features of different color spaces for the classification of non-ulcer and ulcerous regions. The used color spaces are CMYK, YUV, RGB, HSV, LAB, and XYZ. After the extraction of features, the cross-correlation method is utilized for the fusion of extracted features. Finally, 97.89% accuracy is obtained by utilizing the support vector machine (SVM) for the classification. Suman et al. [23] proposed a new method for the classification of bleeding images from non-bleeding ones. Their suggested method is mainly based on the statistical color features obtained from the RGB images. Charfi et al. [24] presented another methodology for colon irregularity detection from WCE images utilizing variance, LBP, and DWT features. They have been used a multilayer perceptron (MLP) and SVM for the classification. The suggested method performed well than existing methods and achieved 85.86% accuracy on linear SVM and 89.43% accuracy on MLP. In [25], authors have proposed a CAD method for bleeding classification. They have used unsupervised and supervised learning algorithms. Souaidi et al. [26] proposed a unique approach named multiscale complete LBP (MS-CLBP) for ulcer detection which is mainly based on the Laplacian pyramid and completed LBP (CLBP). In this method, ulcer detection is performed using two-color spaces (YCbCr and RGB). They have used the G channel of RGB and Cr of YCbCr for the detection of ulcers. Classification is performed using SVM and attained an average accuracy of 93.88% and 95.11% for both datasets. According to the survey conducted by Fan et al. [27], different pre-trained models of deep learning have covered numerous aspects of the medical imaging domain. Many researchers have utilized CNN models for the accurate classification and segmentation of disease or infections.
In contrast, the images that have the same category should share the same learned features. The overall achieved recognition accuracy of this method is 98%. Sharif et al. [28] have used the contrast-enhanced color features for the segmentation of the infected region from the image. After that, geometric features are pull-out from the resultant segmented portion of the image. Two deep CNN models VGG19 and VGG16, are also used in this method. Extracted deep features of both models are fused using the Euclidean fisher vector (EFV) that are later combined with the geometric characteristics to obtain strong features. Conditional entropy is employed on the resultant feature vector for optimal feature selection, which is classified using the KNN classifier and achieved the highest accuracy of 99.42%. Diamantis et al. [29] have proposed a novel method named as LB-FCN (Look Behind Fully Convolutional Neural Network). The proposed method has performed well than existing methods and achieved better GI abnormality detection results. Alaskar et al. [30] have utilized GoogleNet and AlexNet for the ulcer and non-ulcer images classification. Khan et al. [31] have suggested a technique for the ulcer detection and GI abnormality classification. ResNet101 is utilized by the authors for features extraction. Moreover, they optimized features by utilizing distance fitness function along with grasshopper optimization. They have utilized C-SVM and achieved 99.13% classification accuracy. The literature depicts that CAD systems for disease recognition mostly rely on handcrafted features (shape, color, and texture information). However, impressed by the performance of CNN in other domains, some researchers have employed CNN models in the medical field for disease segmentation and classification [32,33]. Inspired by these studies, we utilized deep learning for better classification accuracy.
A hybrid architecture is proposed in this work for automated detection and classification of stomach abnormalities. The proposed architecture follows two pipeline procedures: Bleeding abnormality segmentation and GI infections classification. The proposed bleeding segmentation procedure is illustrated in Fig. 1. First, select the RGB bleeding images from the Database, then, extract all three channels and apply thresholding. Output images produced by a threshold function are compared by pixel-wise and used for generating a mask for each channel. Later, combined the mask of all three channels, as a result, a segmented image is obtained. The detail description of each step given as follows.
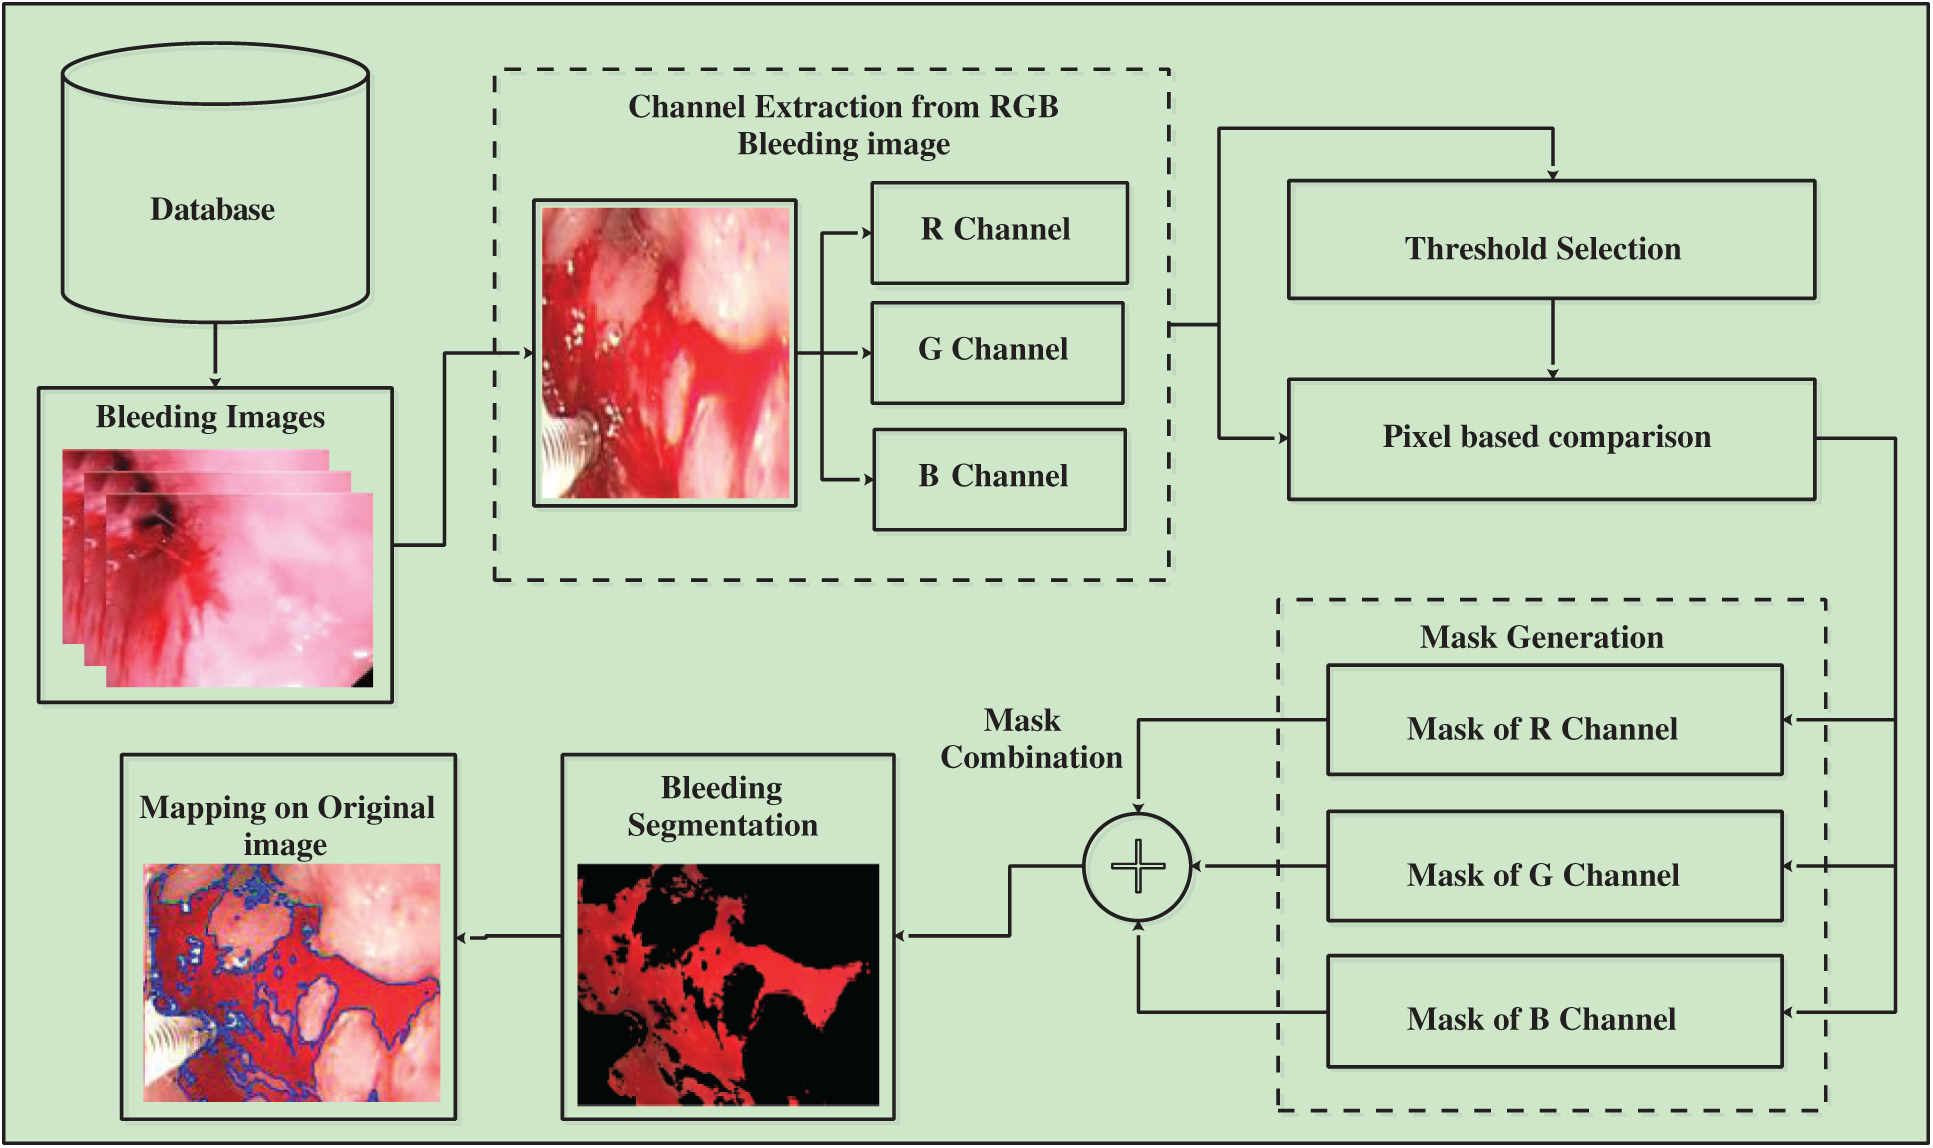
Figure 1: Flow diagram of proposed segmentation method
3.1 Bleeding Abnormality Segmentation
Consider
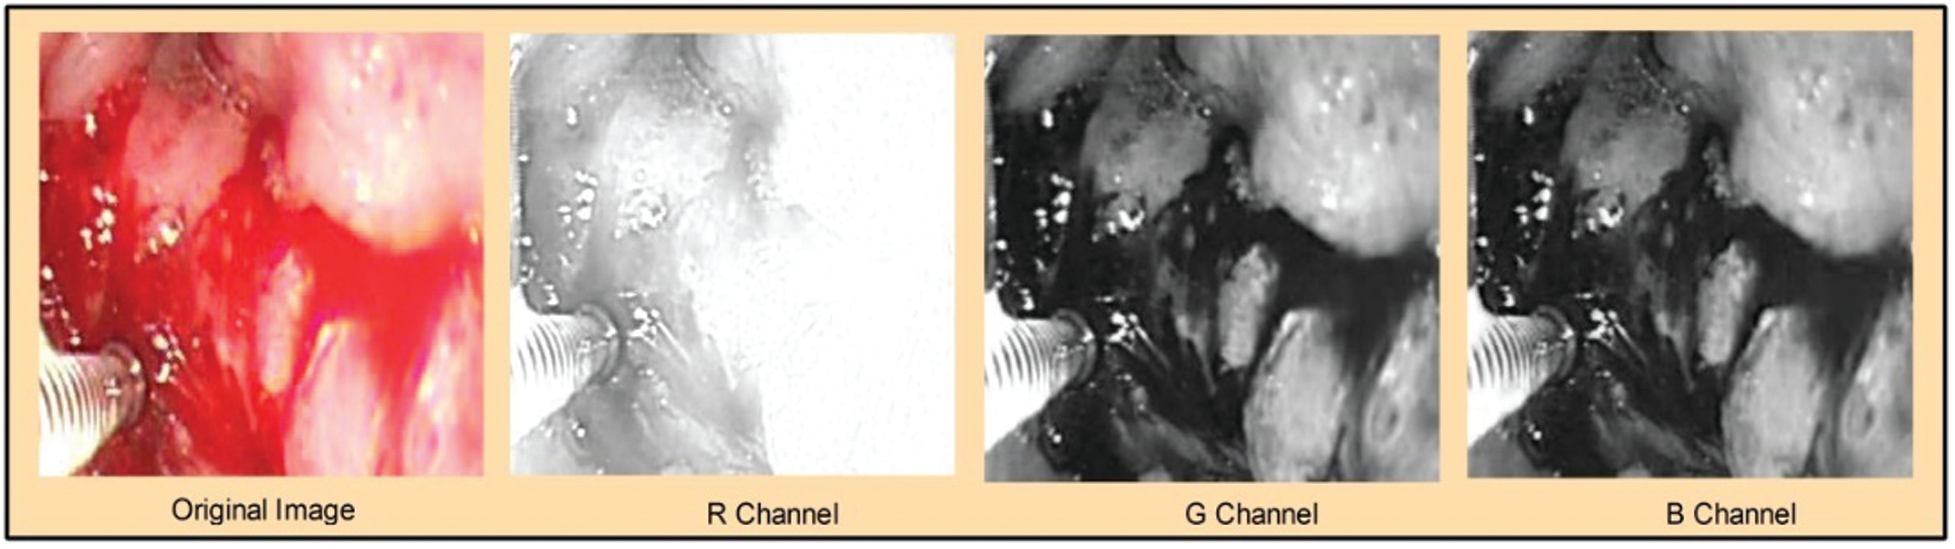
Figure 2: Visualization of the original image and extracted channels:
Considering three channels
where,
where,
Bi-class variance can be expressed as:
In Ostu segmentation, threshold selection is based on the cost function and can be calculated as:
where,
Suppose,
where
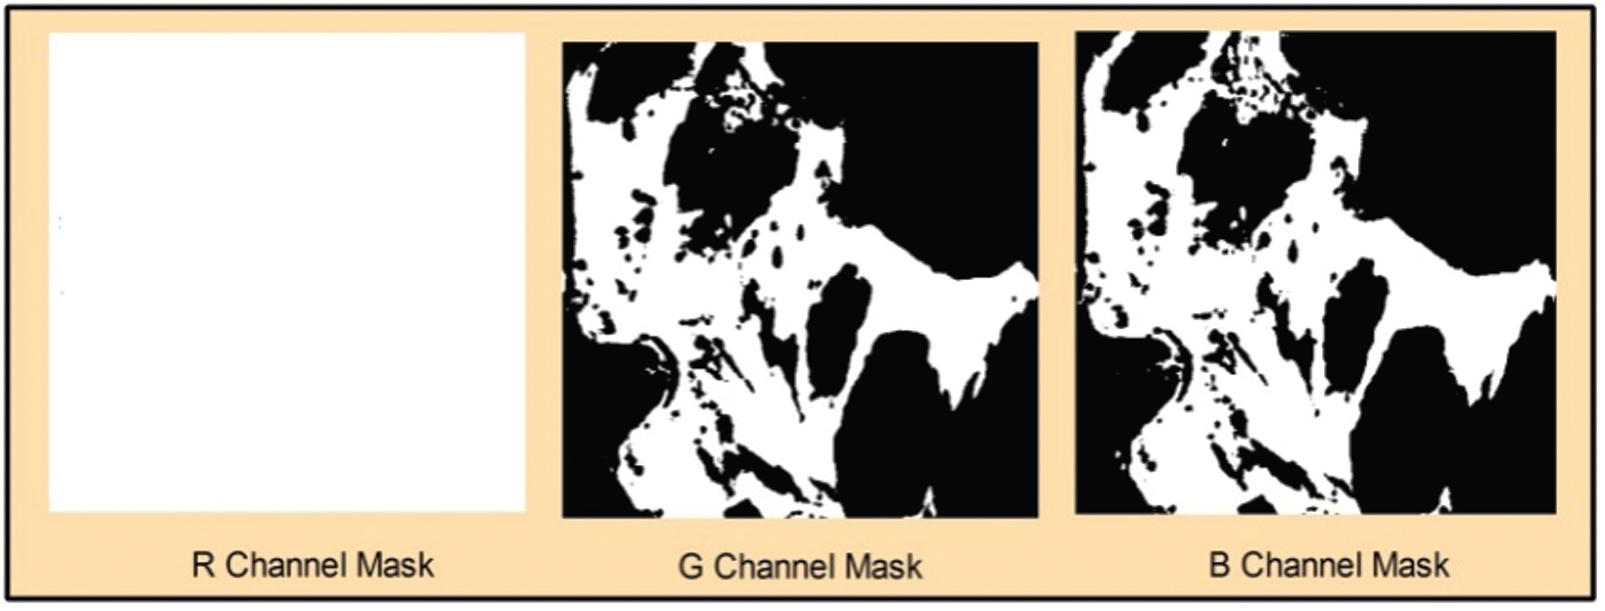
Figure 3: Extracted thresholding channels
3.2 Abnormalities Classification
In the classification task, we presented a deep learning-based architecture for GI abnormalities classification such as bleeding, ulcer, and healthy. This task consists of three steps: enhancement of original images, deep feature extraction, and selection of robust features for classification. The flow diagram is presented in Fig. 5. The mathematical description of the proposed classification task is given below.
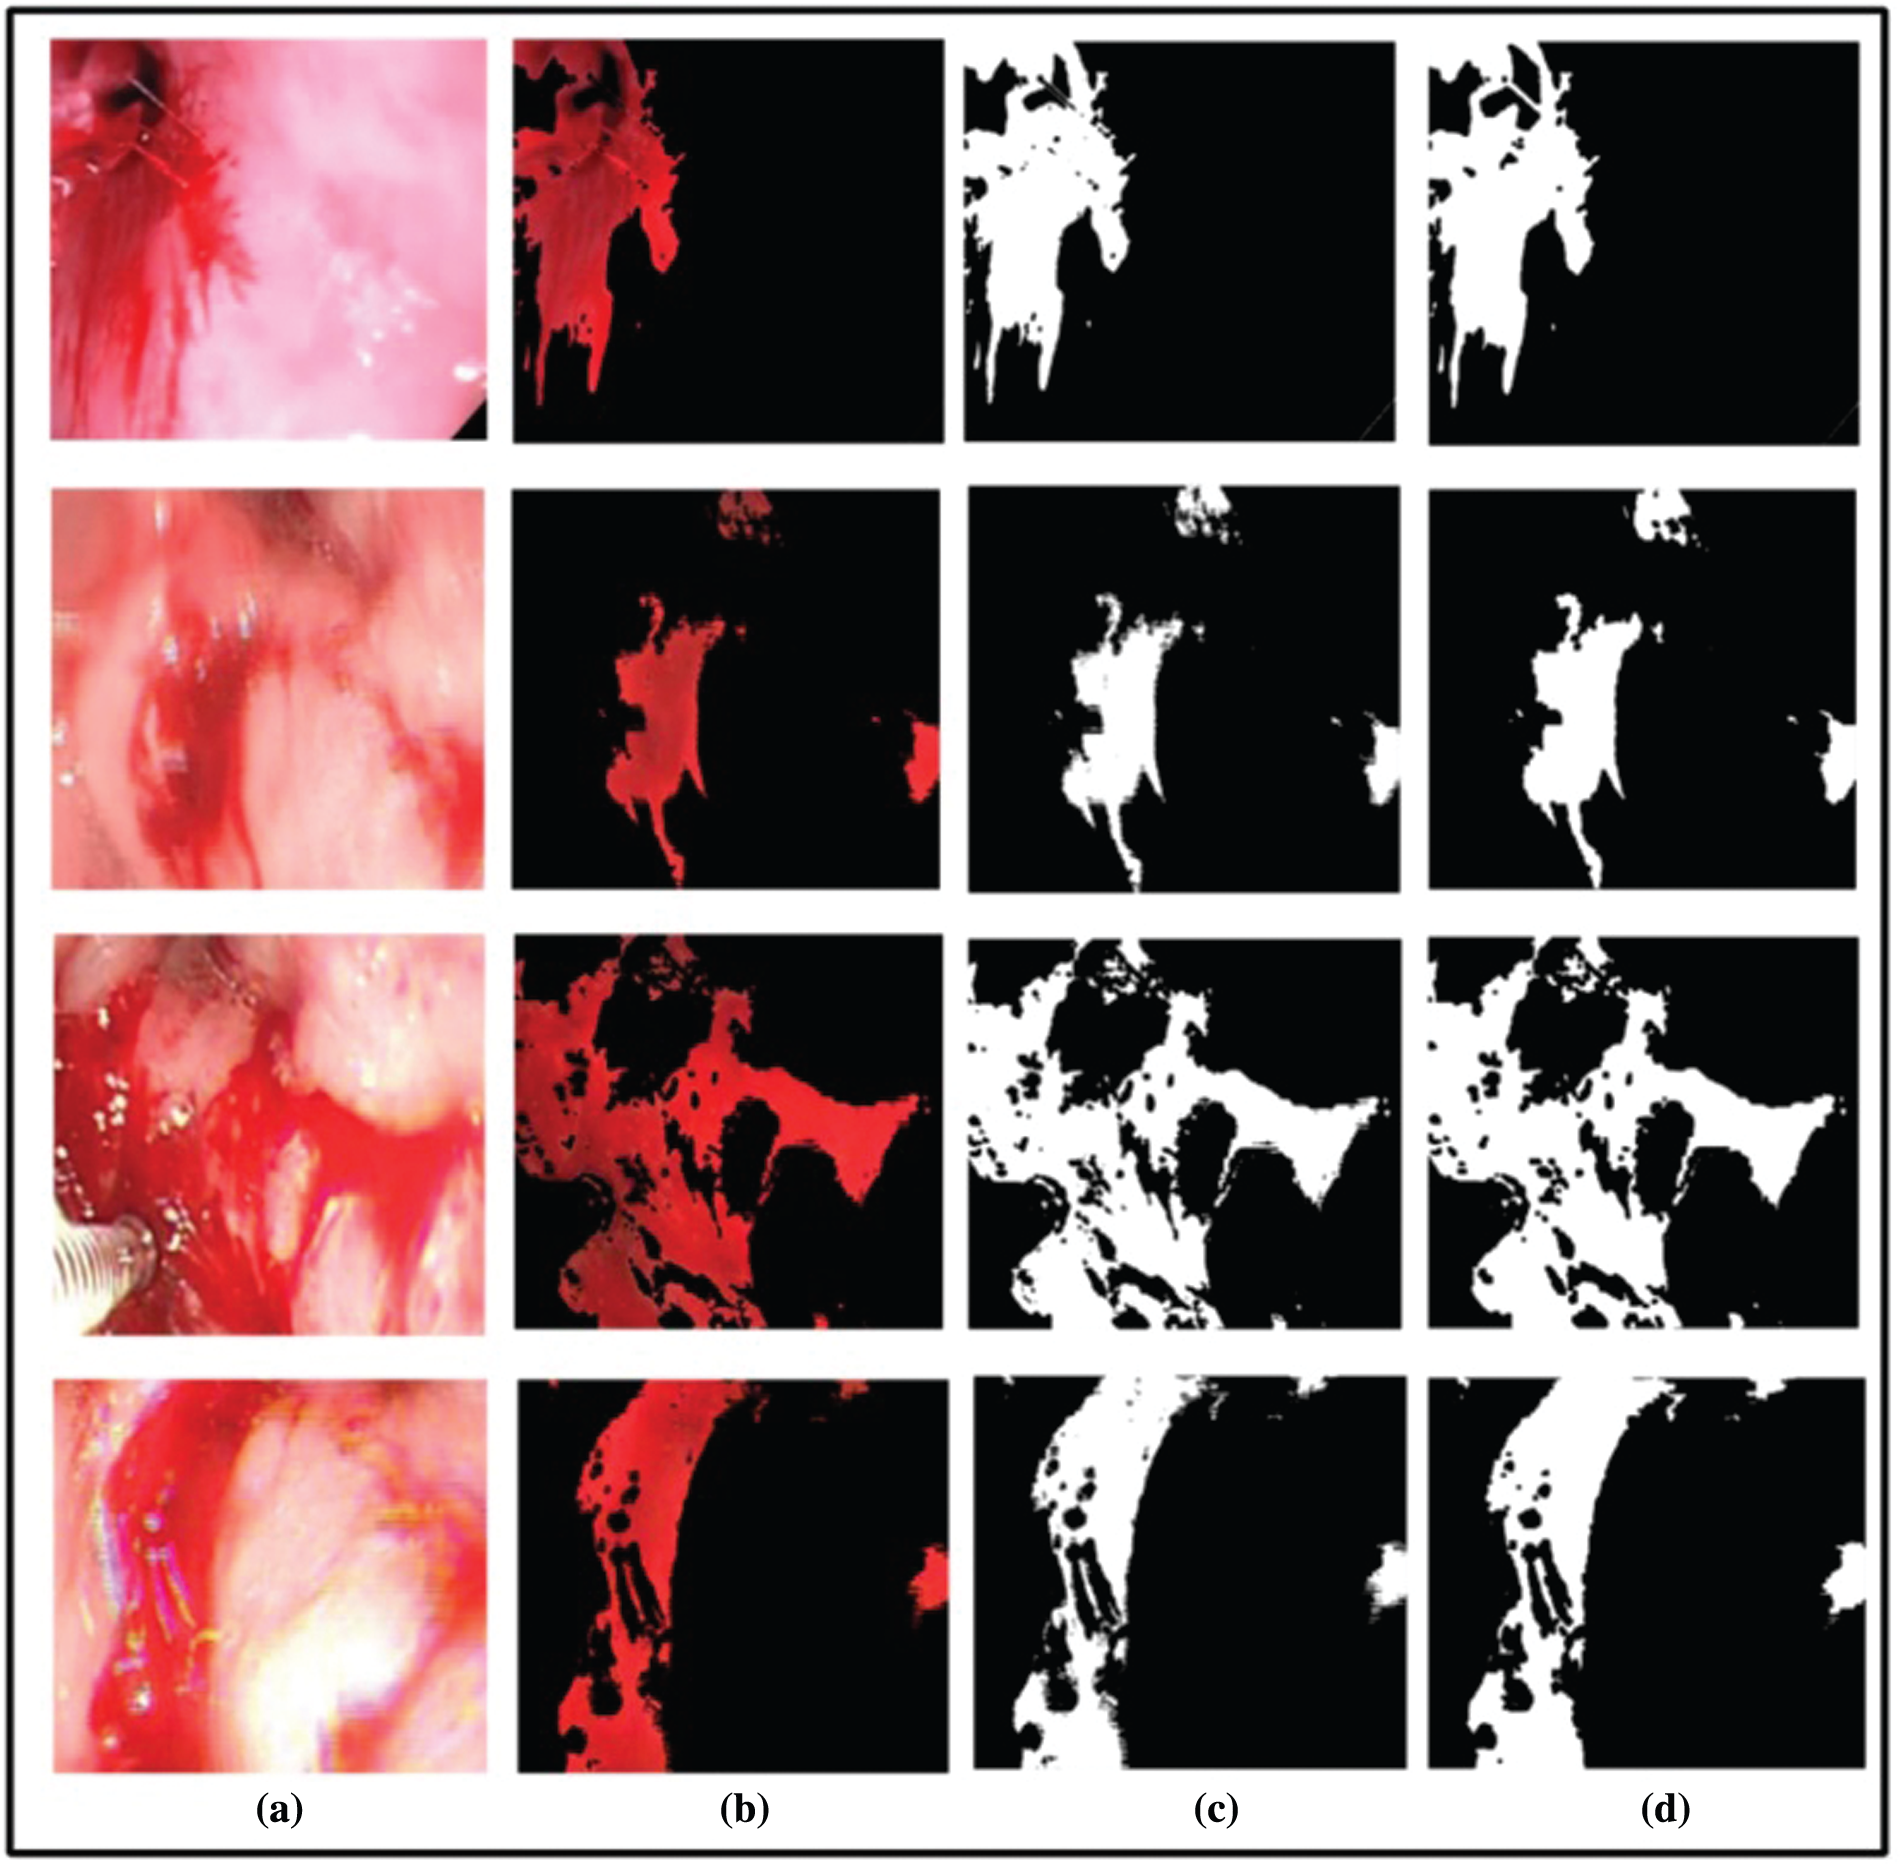
Figure 4: Segmentation output. (a) Original image, (b) detected red spots, (c) proposed binarized segmented image, (d) ground truth image
WCE images may suffer from non-uniform lighting, low visibility, diminished colors, blurring, and low contrast of image characteristics [34]. In the very first step, we have applied a chromatic weight map to improve the saturation in the images. Thus, the color can be an essential indicator of image value. Let,
where,
where, A is a constant,
The foundation of a hazy image can be presented as a curved combination of the image radiance J and the light A, which can be formulated as where
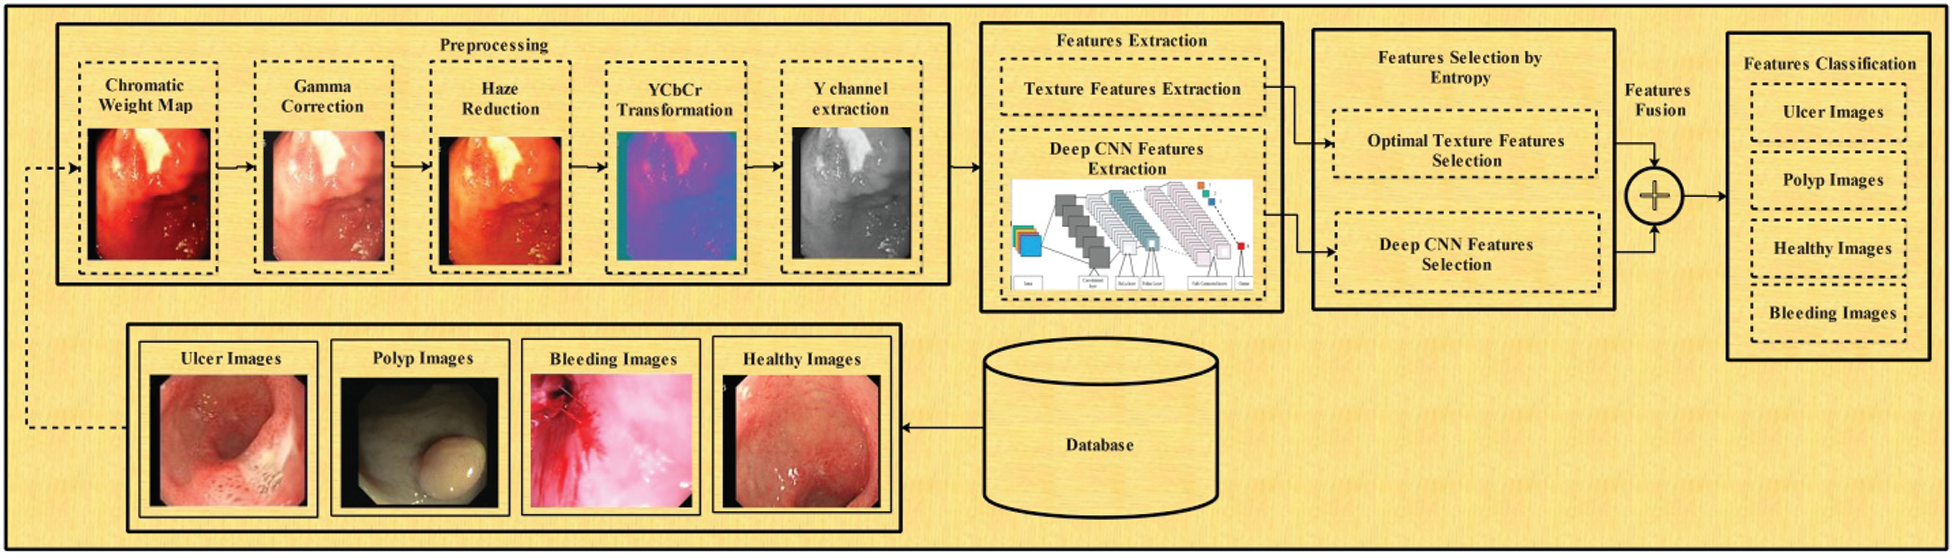
Figure 5: Flow diagram of proposed classification method
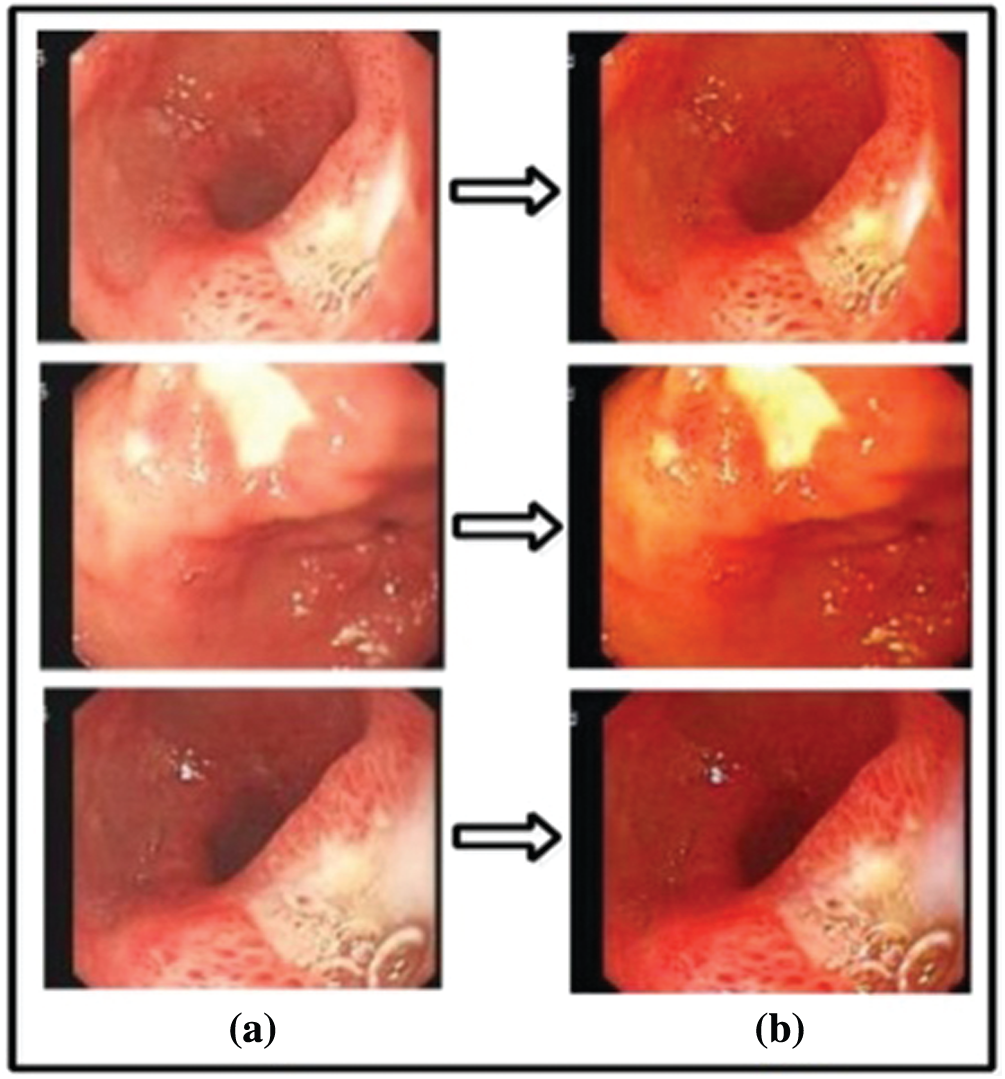
Figure 6: (a) Output images of gamma correction, (b) output images of haze reduction
3.2.2 Features Extraction (FE)
Deep Learning Features: For deep learning features, we have utilized a pre-trained inceptionV3 model. This model is trained on an enhanced WCE dataset. InceptionV3 model consists of 316 layers and

Figure 7: Detailed model of inceptionV3
Using this model, the ratio that we have used for training and testing is 70:30. This feature extraction process is conducted using the transfer learning method. In the TL, a pre-trained model was trained on GI WCE images. For this purpose, we required an input layer and an output layer. For input layer, we are using the first convolution layer, while in the output; we select the average pool layer. We have obtained a feature vector of dimension
Texture Oriented Features–-For the sake of texture oriented features, we are extracting Local Binary Patterns (LBP). LBP is a significant method used for object identification and detection [35]. Basically, LBP features consist of two bitwise transitions from 0 to 1 and 1 to 0. LBP use a greyscale image as input, then calculate mean and variance for each pixel intensity. Mathematical representation of LBP is formulated as follow:
Here, the number of neighborhood intensities are represented byP, R is the radius, kp is the variance of the neighboring pixel intensity, KC represents the contrast of intensity calculated from
where neighboring pixels dn(P) are compared with the central pixel t. It obtains a feature vector of
After the extraction of texture and deep learning features, the next phase involves the optimal features selection. In this work, we have utilized Shannon entropy along with an ensemble learning classifier for best features selection. A heuristic approach has opted for feature selection. The Shannon Entropy is computed from both vectors separately and set a target function based on the mean value of original entropy vectors. The features that are equal or higher than mean features are selects as robust features and passed to ensemble classifiers. However, this process is to continue until the error rate of the ensemble classifier is below 0.1. Mathematically Shannon entropy is ratified by the equation as follow:
Let
The Shannon entropy E(tj) of the term tj is given by:
Through this process, approximately 50% of features are removed from both vectors-deep learning and texture oriented. Later on, these selected vectors are fused in one vector by simple concatenation approach as given as: Let A and B be two feature spaces that are defined on the sample space
4 Experimental Results and Comparison
Two datasets are used in this work for the assessment of suggested GI infections detection and classification method. The description of each dataset is given as:
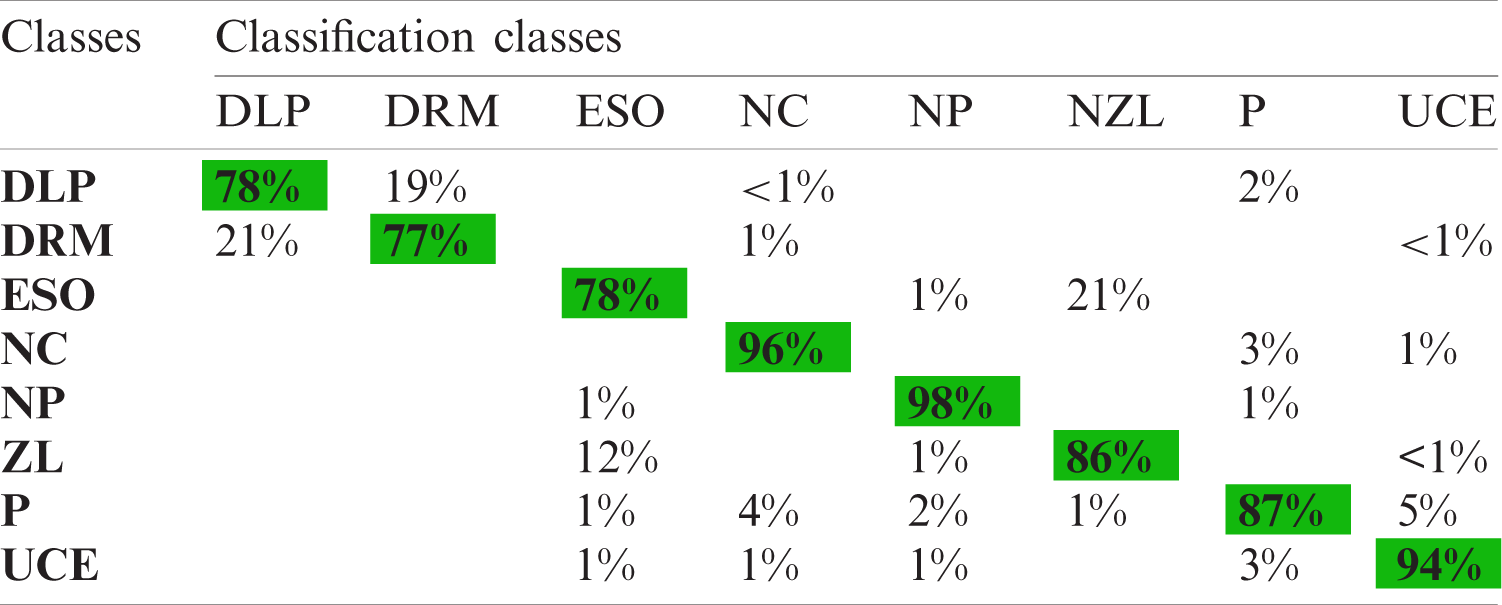
KVASIR Dataset contains a total of 4000 images, which are confirmed by expert doctors [36]. Eight different types of infections are included in this dataset, such as Dyed-Lifted-Polyp (DLP), Dyed-Resection-Margin (DRM), Esophagitis (ESO), Normal-Cecum (NC), Normal-Pylorus (NP), Normal Z-Line (NZL), Polyps (P), and Ulcerative-Colities (UCE). Every class contains 500 images of different resolution-
Private Dataset was collected from COMSATS Computer Vision Lab [37], and it includes a total of 2326 clinical sample images. These images consist of three categories-ulcer, bleeding, and healthy. The image size is
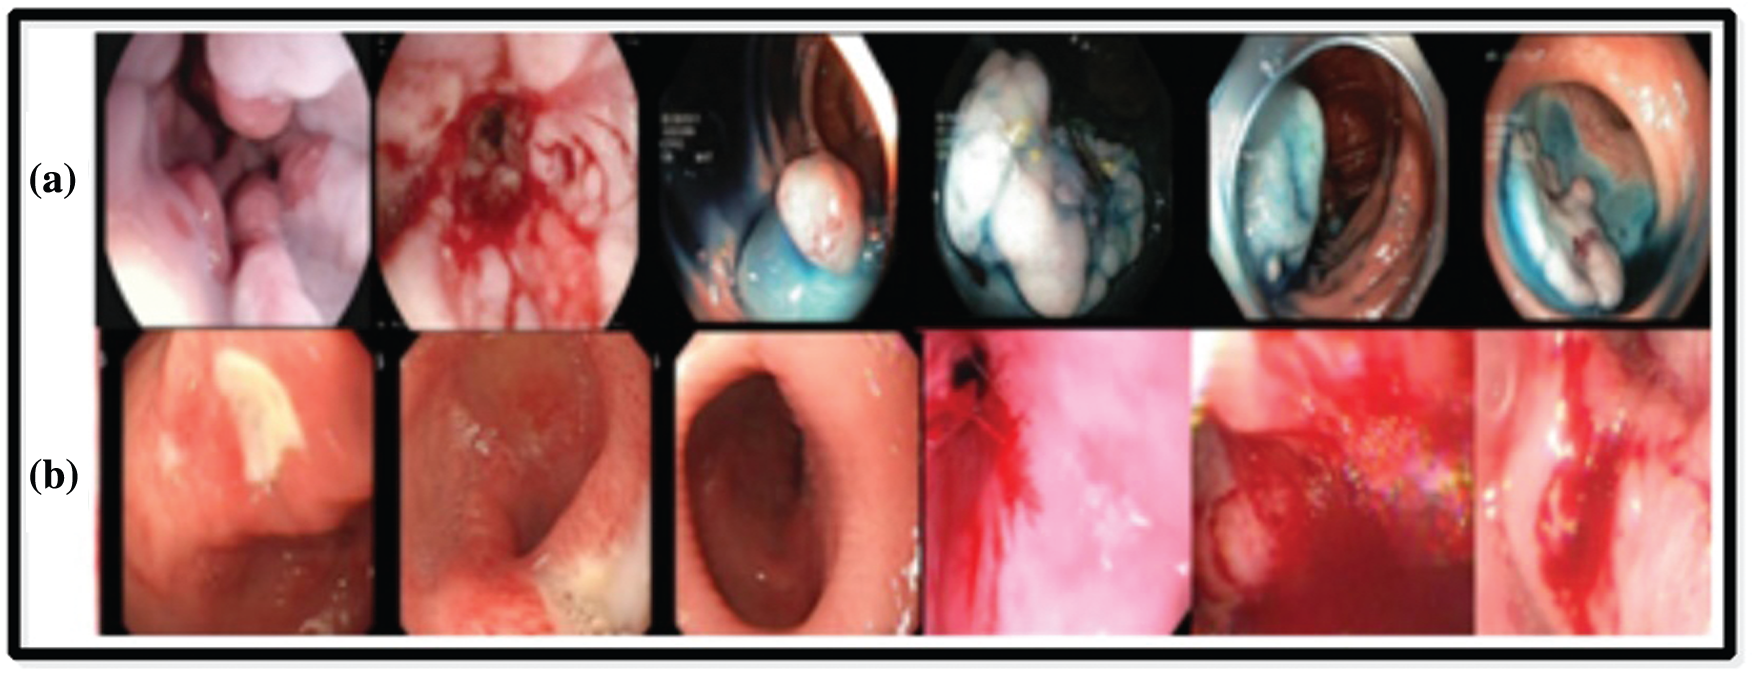
Figure 8: Sample images selected from the datasets: (a) KVASIR dataset [36], (b) Private dataset [37]
A detailed description of classification results in quantitative and graphical form is given in this section. For experimental results, seven different classifiers are used for the evaluation of suggested methods that are Linear Discriminant (L-Disc), Fine Tree (F-Tree), Cubic SVM (C-SVM), Medium Gaussian SVM (M-G-SVM), Linear SVM (L-SVM), Fine KNN (F-KNN), and ENSEM subspace discriminant (ESDA). In this research, we have utilized different performance measures for the evaluation of suggested methods, including Specificity (SPE), FNR, Precision (PRE), FPR, Sensitivity (SEN), Accuracy (ACC), F1-Score, Jaccard index, and Dice. All the tests are implemented on MATLAB 2019b using Core i5-7thGen, 4 GB RAM. Further, an 8 GB graphics card is also used for the evaluation of results.
Bleeding Segmentation Results: To validate segmentation accuracy, 20 sample images from the Private dataset are randomly chosen for bleeding segmentation. In this research we have utilized the ground truth images designed by an expert physician for the segmentation accuracy calculation. The ground truth images are compared with the proposed segmented images pixel-by-pixel. Our proposed bleeding method has achieved the highest accuracy of 93.39%. Other calculated measures are Jack-index (96.58%) and FNR (6.61). The selected image’s accuracy is given in Tab. 1. In this table, it is shown that for all selected 20 images, Jack-Index, Dice, FNR, and Time (s) is presented. The average dice rate is 87.59%, which is good for bleeding segmentation.
Table 1: Bleeding segmentation results

Classification Results: For classification results, we have performed experiments for both selection and fusion processes separately. As mentioned above, two datasets named KVASIR and Private datasets are used for the evaluation of the proposed method. As the Private Dataset includes a total of 2326 RGB images consisting of three classes, namely ulcer, bleeding, and healthy. Initially, robust deep learning features are selected using the proposed selected approach. For robust deep learning features, maximum achieved accuracy of 99.7% on ESDA classifier, as numerical results are given in Tab. 2. In this table, it is observed that the other calculated measures are SEN (99.7%), SPE (99.88%), PRE (99.70%), F1 score (99.70%), FPR (zero), and FNR (0.3%). Further, the accuracy of ESDA can also be validated by Tab. 3. Besides, the execution time of each classifier is noted during the testing, as given in Tab. 2. In this table, the best noted time is 16.818 s for the ESDA classifier. The worst execution time is 26.166 s for the M-G-SVM classifier.
Table 2: Propose classification results on selected deep learning features for private dataset. The maximum accuracy is bold in the table

Table 3: Confusion matrix using selected inceptionV3 features for private dataset

Tab. 4 shows the classification results using robust deep learning features for KVASIR dataset. The 10-fold cross-validation was used for testing results and achieved the best accuracy of 86.6% on the ESDA classifier, as numerical results can be seen in Tab. 4. In this table, it is observed that the other calculated measures of ESDA classifier are SEN (86.62%), SPE (98.08%), PRE (87.08%), F1 score (86.60%), FPR (0.04) and FNR (13.4%). The accuracy of this classifier can also be validated by Tab. 5. The minimum noted time is 27.67 s for F-Tree, while 43.01 s for ESDA classifier. However, the accuracy of the ESDA classifier is better as compared to all other methods.
Table 4: Propose classification results on selected deep learning features for KVASIR dataset. The maximum accuracy is bold in the table

Table 5: Confusion matrix using selected inception features for KVASIR dataset
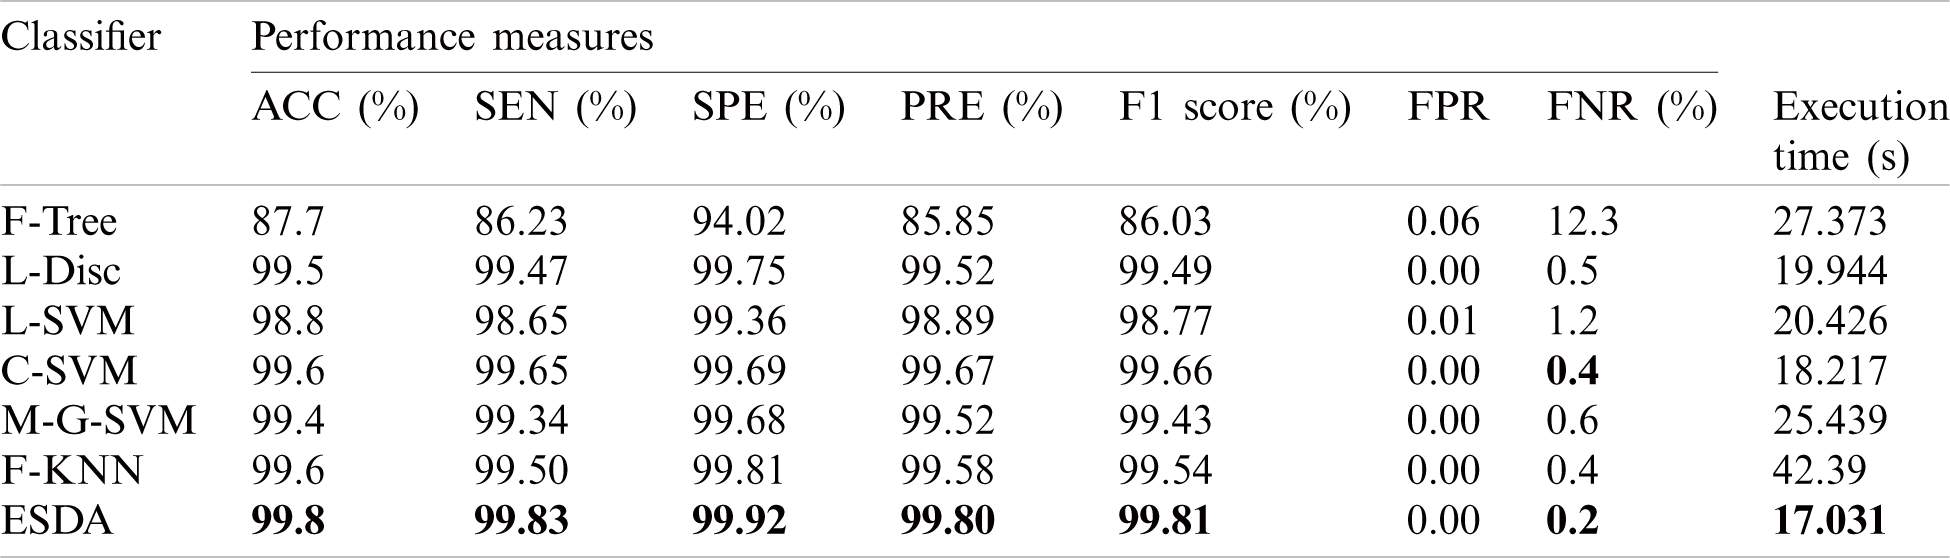
Later on, the selected deep learning and LBP features are fused and performed evaluation. Results are presented in Tab. 6 using a fused vector for Private Dataset. The maximum achieved accuracy after the fusion process is reached to 99.8% for the ESDA classifier. In this table, it is observed that the ESDA classifier shows better performance in terms of other performance measures as compared to other classifiers. Other calculated measures of ESDA are SEN (99.83%), SPE (99.92%), PRE (99.80%), F1 score (99.81%), FPR (zero), and FNR (0.2%). The accuracy of this classifier can also be validated by Tab. 7. From the comparison with Tab. 2, it is shown that after the fusion process, the results are a little bit improved. But on the other side, the computational time is increased up to an average of 4 to 5 sec. The best noted time for this experiment is 17.03 s, while the worst time is 42.39 s. In conclusion, ESDA performs better as compared to other methods.
Table 6: Classification results of proposed classification architecture for private dataset. The maximum accuracy is bold in the table
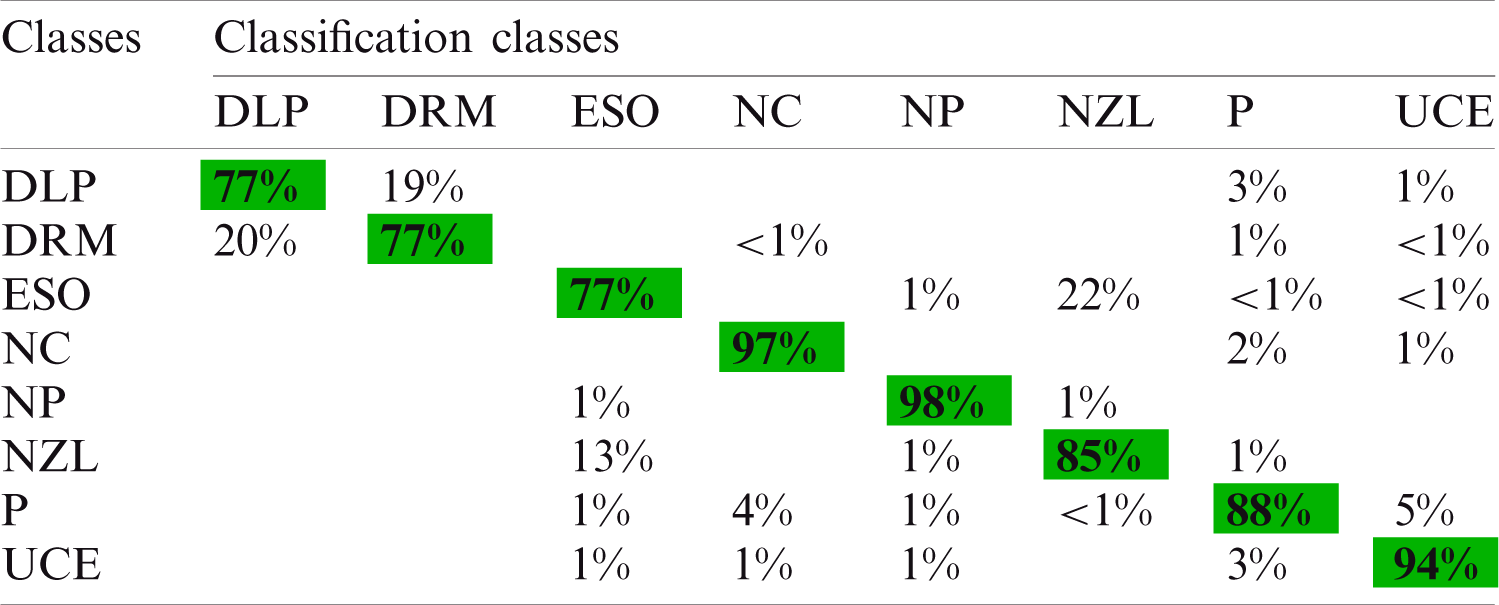
The fused vector is also applied to the KVASIR dataset and achieved maximum accuracy of 87.8% for the ESDA classifier. Tab. 8 shows the results of the proposed architecture. The other calculated measures of this classifier are SEN (86.4%), SPE (98.06%), PRE (86.99%), F1 score (86.63%), FPR (0.02), and FNR (13.6%). Moreover, Tab. 9 shows a confusion matrix of this classifier, which can be used as the authenticity of proposed ESDA accuracy. The diagonal values show the correct prediction of each abnormality while the rest of the values are FNR. After fusion process accuracy is improved. However, a little bit of increase occurs in the execution time. After the fusion process, the best noted time is 26.06 s, while for ESDA classifier is 50.70 s. Overall, it can be easily concluded that the ESDA classifier shows better performance.
Table 7: Confusion matrix for proposed classification architecture for private dataset
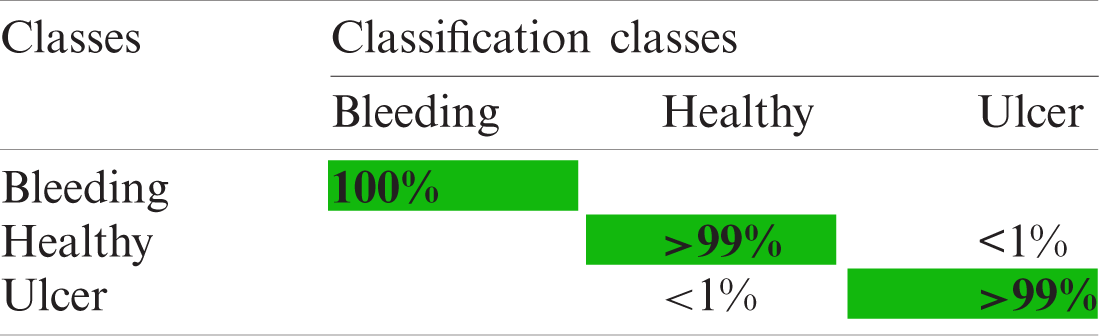
Table 8: Classification results of proposed classification architecture for KVASIR Dataset. The maximum accuracy is bold in the table
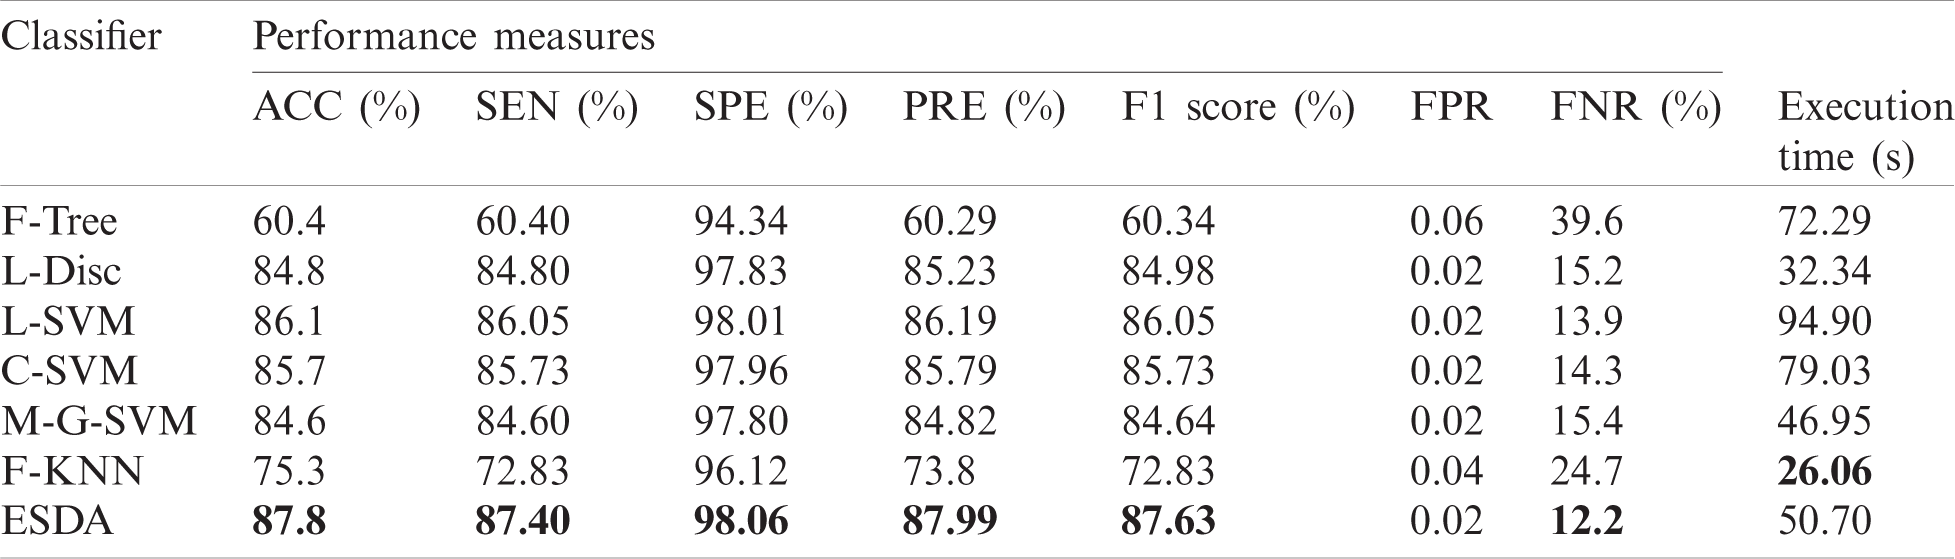
Table 9: Confusion matrix using selected fused LBP and inceptionV3 features for KVASIR dataset
4.2 Comparison with Existing Methods
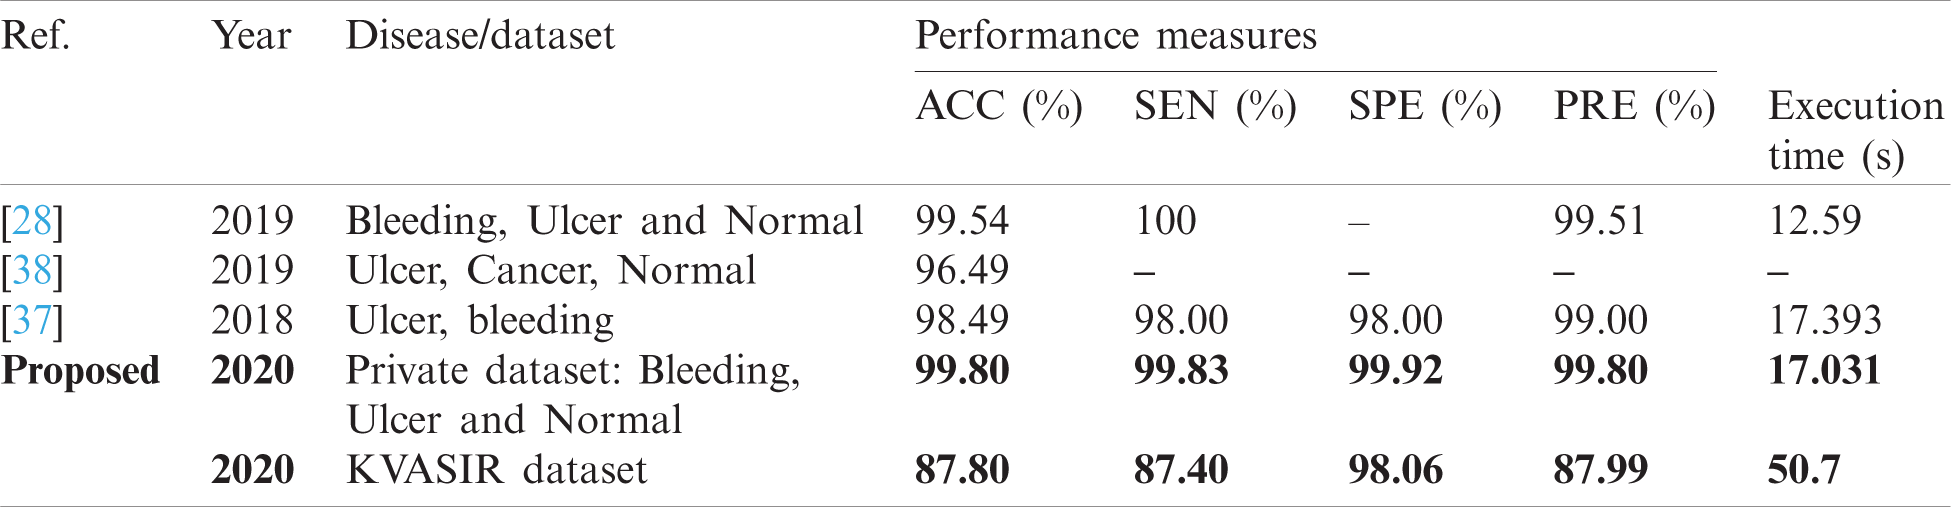
From the above review, it is noted that several methods are proposed by the researchers for GI disease abnormality detection and classification. Most of the existing CAD methods are based on traditional techniques and algorithms, such as most of them are based on only color information or texture information. Although there exists some methods in which authors have used a combination of features. Some methods are also based on deep CNN features. Despite too many existing CAD methods, there exist some limitations in the old approaches such as low contrast of captured frames, the same color of the infected and healthy region, the problem of proper color model selection, hazy image, redundant information, etc. These limitations forced us to develop a robust method for GI abnormality detection and classification with better accuracy. The proposed deep learning method is evaluated on two datasets-Kvasir and Private and achieved an accuracy of 99.80% and 87.80%. The comparison with existing techniques is given in Tab. 10. In this table, the comparison is conducted based on the abnormality name or dataset. Because most of the GI datasets are private, therefore, we mainly focused on disease type. From this table, it is shown that the proposed architecture gives better accuracy as well as execution time.
Table 10: Comparison with existing methods
In this article, we proposed a deep learning architecture for the detection and classification of GI abnormalities. The proposed architecture consists of two procedures for pipeline detection and classification. In the detection task, the bleeding region is segmented by a fusion of three separate channels. In the classification task, deep learning features and texture-oriented features are extracted and the best features are selected using the Shanon Entropy controlled ESDA classifier. The selected features are concatenated and are classified. In the evaluation phase, the segmentation process achieves an average accuracy of over 87% for abnormal bleeding regions. For classification, the accuracy of the private data set is 99.80 percent, while for the Kvasir data set, the accuracy is 87.80 percent. It is concluded from the results that the proposed selection method shows better performance compared to the existing techniques. It also concludes that the merger process is effective for more classes, such as the Kvasir dataset classification. In addition, texture features also have a high impact on disease classification and deep learning fusion, addressing the issue of texture variation. In future studies, we will focus on ulcer segmentation through deep learning.
Funding Statement: This research was financially supported in part by the Ministry of Trade, Industry and Energy (MOTIE) and Korea Institute for Advancement of Technology (KIAT) through the International Cooperative R&D program. (Project No. P0016038) and in part by the MSIT (Ministry of Science and ICT), Korea, under the ITRC (Information Technology Research Center) support program (IITP-2021-2016-0-00312) supervised by the IITP (Institute for Information & communications Technology Planning & Evaluation).
Conflicts of Interest: The authors declare that they have no conflicts of interest to report regarding the present study.
1. Y.-D. Zhang, M. Sharif and T. Akram, “Pixels to classes: Intelligent learning framework for multiclass skin lesion localization and classification,” Computers & Electrical Engineering, vol. 90, pp. 106956, 2021. [Google Scholar]
2. H. T. Rauf, M. I. U. Lali, M. A. Khan, S. Kadry, H. Alolaiyan et al., “Time series forecasting of COVID-19 transmission in Asia Pacific countries using deep neural networks,” Personal and Ubiquitous Computing, vol. 2, pp. 1–18, 2020. [Google Scholar]
3. M. Sharif, T. Akram, S. A. C. Bukhari and R. S. Nayak, “Developed newton-raphson based deep features selection framework for skin lesion recognition,” Pattern Recognition Letters, vol. 129, no. 4/5, pp. 293–303, 2020. [Google Scholar]
4. M. A. Khan, M. Sharif, T. Akram, M. Yasmin and R. S. Nayak, “Stomach deformities recognition using rank-based deep features selection,” Journal of Medical Systems, vol. 43, no. 12, pp. 329, 2019. [Google Scholar]
5. R. Siegel, C. DeSantis and A. Jemal, “Colorectal cancer statistics,” 2014 A Cancer Journal for Clinicians, vol. 64, no. 2, pp. 104–117, 2014. [Google Scholar]
6. R. L. Siegel, K. D. Miller, S. A. Fedewa, D. J. Ahnen, R. G. Meester et al., “Colorectal cancer statistics, 2017,” A Cancer Journal for Clinicians, vol. 67, no. 3, pp. 177–193, 2017. [Google Scholar]
7. M. Khan, M. Rashid, M. Sharif, K. Javed and T. Akram, “Classification of gastrointestinal diseases of stomach from WCE using improved saliency-based method and discriminant features selection,” Multimedia Tools and Applications, vol. 78, no. 19, pp. 27743–27770, 2019. [Google Scholar]
8. R. L. Siegel, K. D. Miller and A. Jemal, “Cancer statistics,” 2019 A Cancer Journal for Clinicians, vol. 69, no. 1, pp. 7–34, 2019. [Google Scholar]
9. M. A. Khan, M. S. Sarfraz, M. Alhaisoni, A. A. Albesher, S. Wang et al., “StomachNet: Optimal deep learning features fusion for stomach abnormalities classification,” IEEE Access, vol. 8, pp. 197969–197981, 2020. [Google Scholar]
10. M. Mackiewicz, “Capsule endoscopy-state of the technology and computer vision tools after the first decade, new techniques in gastrointestinal endoscopy,” InTech ISBN, vol. 4, pp. 978–953, 2011. [Google Scholar]
11. G. Iddan, G. Meron, A. Glukhovsky and P. Swain, “Wireless capsule endoscopy,” Nature, vol. 405, no. 6785, pp. 417, 2000. [Google Scholar]
12. M. Liedlgruber and A. Uhl, “Computer-aided decision support systems for endoscopy in the gastrointestinal tract: A review,” IEEE Reviews in Biomedical Engineering, vol. 4, pp. 73–88, 2011. [Google Scholar]
13. G. M. Cobrin, R. H. Pittman and B. S. Lewis, “Increased diagnostic yield of small bowel tumors with capsule endoscopy,” Cancer: Interdisciplinary International Journal of the American Cancer Society, vol. 107, pp. 22–27, 2006. [Google Scholar]
14. G. Liu, G. Yan, S. Kuang and Y. Wang, “Detection of small bowel tumor based on multi-scale curvelet analysis and fractal technology in capsule endoscopy,” Computers in Biology and Medicine, vol. 70, no. 3, pp. 131–138, 2016. [Google Scholar]
15. T. Aoki, A. Yamada, K. Aoyama, H. Saito, A. Tsuboi et al., “Automatic detection of erosions and ulcerations in wireless capsule endoscopy images based on a deep convolutional neural network,” Gastrointestinal Endoscopy, vol. 89, no. 2, pp. 357–363, 2019. [Google Scholar]
16. M. A. Khan, S. Kadry, M. Alhaisoni, Y. Nam, Y. Zhang et al., “Computer-aided gastrointestinal diseases analysis from wireless capsule endoscopy: A framework of best features selection,” IEEE Access, vol. 8, pp. 132850–132859, 2020. [Google Scholar]
17. B.-P. Li and M. Q.-H. Meng, “Comparison of several texture features for tumor detection in CE images,” Journal of Medical Systems, vol. 36, no. 4, pp. 2463–2469, 2012. [Google Scholar]
18. K. Pogorelov, S. Suman, F. Azmadi Hussin, A. Saeed Malik, O. Ostroukhova et al., “Bleeding detection in wireless capsule endoscopy videos–-color versus texture features,” Journal of Applied Clinical Medical Physics, vol. 20, no. 8, pp. 141–154, 2019. [Google Scholar]
19. T. Saba, M. A. Khan, A. Rehman and S. L. Marie-Sainte, “Region extraction and classification of skin cancer: A heterogeneous framework of deep CNN features fusion and reduction,” Journal of Medical Systems, vol. 43, pp. 289, 2019. [Google Scholar]
20. M. A. Khan, S. Rubab, A. Kashif, M. I. Sharif, N. Muhammad et al., “Lungs cancer classification from CT images: An integrated design of contrast based classical features fusion and selection,” Pattern Recognition Letters, vol. 129, pp. 77–85, 2020. [Google Scholar]
21. M. A. Khan, I. Ashraf, M. Alhaisoni, R. Damaševičius, R. Scherer et al., “Multimodal brain tumor classification using deep learning and robust feature selection: A machine learning application for radiologists,” Diagnostics, vol. 10, pp. 565, 2020. [Google Scholar]
22. S. Suman, F. A. Hussin, A. S. Malik, S. H. Ho, I. Hilmi et al., “Feature selection and classification of ulcerated lesions using statistical analysis for WCE images,” Applied Sciences, vol. 7, no. 10, pp. 1097, 2017. [Google Scholar]
23. S. Suman, F. A. B. hussin, A. S. Malik, K. Pogorelov, M. Riegler et al., “Detection and classification of bleeding region in WCE images using color feature,” in Proc. of the 15th Int. Workshop on Content-Based Multimedia Indexing, NY, United States, pp. 1–6, 2017. [Google Scholar]
24. S. Charfi and M. El Ansari, “Computer-aided diagnosis system for colon abnormalities detection in wireless capsule endoscopy images,” Multimedia Tools and Applications, vol. 77, no. 3, pp. 4047–4064, 2018. [Google Scholar]
25. O. Bchir, M. M. B. Ismail and N. AlZahrani, “Multiple bleeding detection in wireless capsule endoscopy,” Signal, Image and Video Processing, vol. 13, no. 1, pp. 121–126, 2019. [Google Scholar]
26. M. Souaidi, A. A. Abdelouahed and M. El Ansari, “Multi-scale completed local binary patterns for ulcer detection in wireless capsule endoscopy images,” Multimedia Tools and Applications, vol. 78, no. 10, pp. 13091–13108, 2019. [Google Scholar]
27. S. Fan, L. Xu, Y. Fan, K. Wei and L. Li, “Computer-aided detection of small intestinal ulcer and erosion in wireless capsule endoscopy images,” Physics in Medicine & Biology, vol. 63, pp. 165001, 2018. [Google Scholar]
28. M. Sharif, M. Attique Khan, M. Rashid, M. Yasmin, F. Afza et al., “Deep CNN and geometric features-based gastrointestinal tract diseases detection and classification from wireless capsule endoscopy images,” Journal of Experimental & Theoretical Artificial Intelligence, vol. 2, no. 7, pp. 1–23, 2019. [Google Scholar]
29. D. E. Diamantis, D. K. Iakovidis and A. Koulaouzidis, “Look-behind fully convolutional neural network for computer-aided endoscopy,” Biomedical Signal Processing and Control, vol. 49, no. 2, pp. 192–201, 2019. [Google Scholar]
30. H. Alaskar, A. Hussain, N. Al-Aseem, P. Liatsis and D. Al-Jumeily, “Application of convolutional neural networks for automated ulcer detection in wireless capsule endoscopy images,” Sensors, vol. 19, no. 5, pp. 1265, 2019. [Google Scholar]
31. M. A. Khan, M. A. Khan, F. Ahmed, M. Mittal, L. M. Goyal et al., “Gastrointestinal diseases segmentation and classification based on duo-deep architectures,” Pattern Recognition Letters, vol. 131, pp. 193–204, 2020. [Google Scholar]
32. V. Rajinikanth, A. N. Joseph Raj, K. P. Thanaraj and G. R. Naik, “A customized VGG19 network with concatenation of deep and handcrafted features for brain tumor detection,” Applied Sciences, vol. 10, no. 10, pp. 3429, 2020. [Google Scholar]
33. N. Dey, Y.-D. Zhang, V. Rajinikanth, R. Pugalenthi and N. S. M. Raja, “Customized VGG19 architecture for pneumonia detection in chest X-rays,” Pattern Recognition Letters, vol. 2, pp. 1–8, 2021. [Google Scholar]
34. N. Dey, F. Shi and V. Rajinikanth, “Image examination system to detect gastric polyps from endoscopy images,” Information Technology and Intelligent Transportation Systems, vol. 323, pp. 107–116, 2020. [Google Scholar]
35. T. Ojala, M. Pietikäinen and D. Harwood, “A comparative study of texture measures with classification based on featured distributions,” Pattern Recognition, vol. 29, no. 1, pp. 51–59, 1996. [Google Scholar]
36. K. Pogorelov, K. R. Randel, C. Griwodz, S. L. Eskeland and T. de Lange, “Kvasir: A multi-class image dataset for computer aided gastrointestinal disease detection,” in Proc. of the 8th ACM on Multimedia Systems Conf., NY, United States, pp. 164–169, 2017. [Google Scholar]
37. A. Liaqat, J. H. Shah, M. Sharif, M. Yasmin and S. L. Fernandes, “Automated ulcer and bleeding classification from WCE images using multiple features fusion and selection,” Journal of Mechanics in Medicine and Biology, vol. 18, no. 04, pp. 1850038, 2018. [Google Scholar]
38. J. H. Lee, Y. J. Kim, Y. W. Kim, S. Park, Y.-I. Choi et al., “Spotting malignancies from gastric endoscopic images using deep learning,” Surgical Endoscopy, vol. 11, no. 2, pp. 1–8, 2019. [Google Scholar]
 | This work is licensed under a Creative Commons Attribution 4.0 International License, which permits unrestricted use, distribution, and reproduction in any medium, provided the original work is properly cited. |