DOI:10.32604/cmc.2021.016860
| Computers, Materials & Continua DOI:10.32604/cmc.2021.016860 | |
| Article |
Parametric Methods for the Regional Assessment of Cardiac Wall Motion Abnormalities: Comparison Study
1University of Tunis El Manar, Higher Institute of Medical Technologies of Tunis, Laboratory of Biophysics and Medical Technologies, Tunis, Tunisia
2College of Computer Science and Information Technology, University of Anbar, 31001, Anbar, Iraq
3Faculty of Medicine of Monastir, Medical Imaging Technology Lab - LTIM-LR12ES06, University of Monastir, 5019, Monastir, Tunisia
4Gaspard-Monge Computer-Science Laboratory, Paris-Est University, Mixed Unit CNRS-UMLV-ESIEE UMR8049, BP99, ESIEE Paris Cité Descartes, 93162 Noisy Le Grand, France
5Military Hospital of Instruction of Tunis, Tunis, Tunisia
6eVIDA Lab, University of Deusto, Avda/Universidades 24, Bilbao, 48007, Spain
7College of Agriculture, Al-Muthanna University, Samawah, 66001, Iraq
**Corresponding Author: Narjes Benameur. Email: narjes.benameur@yahoo.fr
Received: 14 January 2021; Accepted: 25 March 2021
Abstract: Left ventricular (LV) dysfunction is mainly assessed by global contractile indices such as ejection fraction and LV Volumes in cardiac MRI. While these indices give information about the presence or not of LV alteration, they are not able to identify the location and the size of such alteration. The aim of this study is to compare the performance of three parametric imaging techniques used in cardiac MRI for the regional quantification of cardiac dysfunction. The proposed approaches were evaluated on 20 patients with myocardial infarction and 20 subjects with normal function. Three parametric images approaches: covariance analysis, parametric images based on Hilbert transform and those based on the monogenic signal were evaluated using cine-MRI frames acquired in three planes of views. The results show that parametric images generated from the monogenic signal were superior in term of sensitivity (89.69%), specificity (86.51%) and accuracy (89.06%) to those based on covariance analysis and Hilbert transform in the detection of contractile dysfunction related to myocardial infarction. Therefore, the parametric image based on the monogenic signal is likely to provide additional regional indices about LV dysfunction and it may be used in clinical practice as a tool for the analysis of the myocardial alterations.
Keywords: Covariance analysis; cardiac MRI; monogenic signal; assessment; Hilbert transform
Cardiovascular disease is one of the primary causes of death worldwide [1]. These diseases can affect the coronary arteries, the myocardial muscle and other structures closely related to the heart. Nevertheless, their early detection faces several obstacles, mainly related to the diversity of the etiologies of these pathologies as well as to the complex architecture of the heart. The diagnosis of cardiovascular disease is primarily based on an evaluation of cardiac function as well as an appreciation of possible architectural modifications of the heart. These structural and functional analyze are made possible thanks to several cardiac imaging techniques that have experienced significant technological growth in recent years. Among all these examinations, Magnetic Resonance Imaging (MRI) remains the reference modality that would explore the heart of the anatomical, functional and dynamic levels. Moreover, MRI allows the study of cardiac function thanks to fast echo gradient sequences. This provides an optimal study of the heart in one apnea. The detection of cardiovascular disease is based on an accurate analysis of left ventricular (LV) dysfunction. In cardiac MRI, this evaluation is performed in three planes of views with a visual analysis of the acquired sequences. The radiologist follows in real time the movement and thickening of the myocardium and the chronology of contraction in the different myocardial walls. It then proceeds to a computation of the functional parameters using software specially designed for this study. The radiologist performs manual or semi-automatic delineation of the epicardial and endocardial contour of the myocardium, and may subsequently obtain the necessary information on ventricular function. The MRI would allow the computation of global indices like cardiac output, left ventricular ejection fraction (LVEF), LV volumes and myocardial mass [2,3]. Although LVEF is considered a reliable indicator for the quantification of LV alteration, it does not reflect the state of ventricular contractility. Indeed, in some cases such as mitral insufficiency, preserved values of the LVEF may obscure a significant functional dysfunction. In addition, the global parameters are insufficient to identify the contraction abnormalities extent [4]. The detection of LV alterations and the quantification of their degrees allow an assessment of the pathologic severity and early identification of several diseases. The wall motion abnormalities are divided into three classes: the hypokinesia, which manifests by a decrease in contraction, the akinesia that is characterized by a total absence of contractility and the dyskinesia defined as a paradoxical movement [5,6]. The lack of reliable regional indices for evaluating MRI contractility in clinical routine is, therefore, a significant limitation for the analysis of cardiac function. Therefore, the search for an effective method for the regional quantification of contraction abnormalities remains an important topic of research given its importance and its contribution to the therapeutic decision.
In the recent years, several researchers have focused on the development of new methods for the regional assessment of LV dysfunction. These methods include the automatic detection of endocardial and epicardial myocardial contours using active contour approaches and level set techniques [7–9]. In addition, other optical flow approaches and new methods based on feature tracking (FT) have been developed for the estimation of cardiac motion [10–13]. Besides these methods, a very promising approach called parametric imaging has also been developed in MRI for the regional assessment of cardiac motion. This method makes it possible to extract images offering the possibility of estimating new regional functional parameters such as amplitudes and contraction times [14,15]. Although the clinical interest of this parametric image approach is well demonstrated in nuclear medicine, its application in MRI clinical practice is still limited. One of the limits being the hypothesis of the signals stationarity on which is based the parametric image methods based on Fourier analysis. This hypothesis assumes that the signals generated from MRI images are periodic. However, this hypothesis cannot be respected, since the cardiac cycle could be affected by several factors, such as the non-periodicity of apneas during the examination, the patient's motion and some other artifacts resulting from the acquisition of the images. All these factors contribute to the non-stationary behavior of cardiac signals [16]. Recently, new parametric images approaches have been developed to provide solutions and assistance in the diagnosis of cardiovascular diseases. Among these approaches, it can note those based on covariance analysis, Hilbert transform and the monogenic signal. The aim of this study is to evaluate the performance of these three approaches for the generation of parametric images using cardiac MRI images.
The main contributions of this study are:
• It compares the performance of three parametric imaging techniques developed by researchers in cardiac MRI for the regional quantification of cardiac dysfunction.
• It provides in detail the different steps leading to the computation of three parametric images for the identification of cardiac alterations. This identification is important as some patients with preserved ejection fraction could be diagnosed as healthy based on the use of global indices.
• It validates the reproducibility of detecting contractile alterations using three different approaches. Additionally, the comparison between them enable us to choose the most accurate one able to locate the extent of left ventricular dysfunction.
The paper is organized as follows: Section 2 describes the process of parametric imaging computation using three different approaches and the protocol used to compare them. The outcomes of this comparison are presented in Section 3. The obtained results are discussed in Section 4. A summary of this work is presented in Section 5.
This study was carried out in collaboration with the radiology department of Military Hospital of Tunis (HMPIT), Tunisia. Images that used by the proposed study were acquired on a Siemens 3 Tesla MRI scanner (Siemens Medical Solution, Erlangen, Germany) using segmented cine-MRI gradient echo sequences with retrospective ECG synchronization. For each patient, cine-MRI sequences in two cavities, four cavities and short-axis views were performed. Each cine-MRI sequence consists of 25 frames representing different moments of the cardiac cycle. The following parameters were used for the sequence acquisition: Repetition time (TR) = 3.5 ms; Echo time (TE) = 1.44 ms; thickness = 8 mm; acquisition matrix = 147 * 258.
This retrospective study was performed on a cohort of 40 clinical cases (21 women and 19 men) with an age range from 20 years to 67 years. Among these clinical cases, we distinguish 20 healthy subjects, 20 subjects with myocardial infarction. All variables were presented as the mean ± standard deviation (SD). A linear regression and Bland-Altman analysis were used to evaluate the correlation and the degree of agreement between contraction values derived from the different methods. Statistical analysis was performed using the statistical software IBM-SPSS Statistics (Windows, version 21.0). The main clinical features of the studied cases are described in Tab. 1:
Table 1: Clinical description of the studied population

The majority of the parametric imaging approaches described in the literature is evaluated using small clinical populations collected by the authors during their work [17,18]. Comparing the performance of the different methods is a challenging task given the absence of a standard database that serves as a reference standard. A reliable comparison must meet particular criteria such as the homogeneity of the clinical population studied and the uniformity of the data acquisition conditions. However, compliance with these criteria remains difficult. Therefore, the validation of a comparative study that is relevant for policy makers and clinical practice poses a significant challenge in the absence of a standard database. Fig. 1 shows example of cine MRI dataset (short-axis view) used for the generation of parametric images.
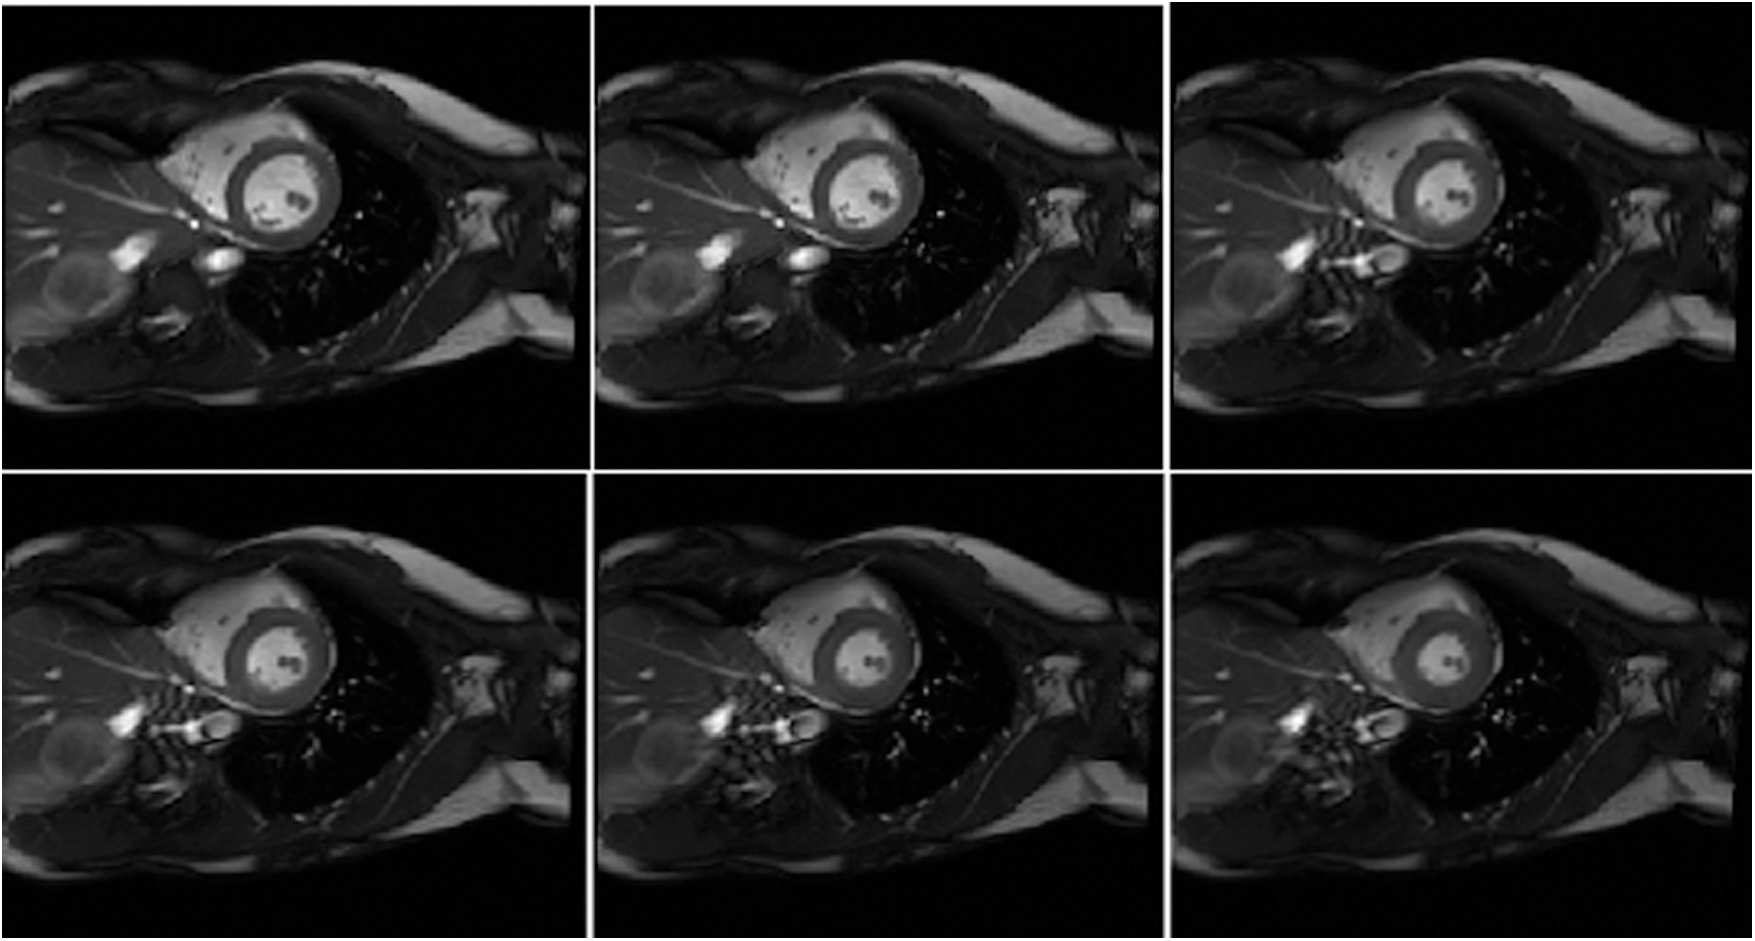
Figure 1: Example of cine MRI dataset (short-axis view) used for the generation of parametric images
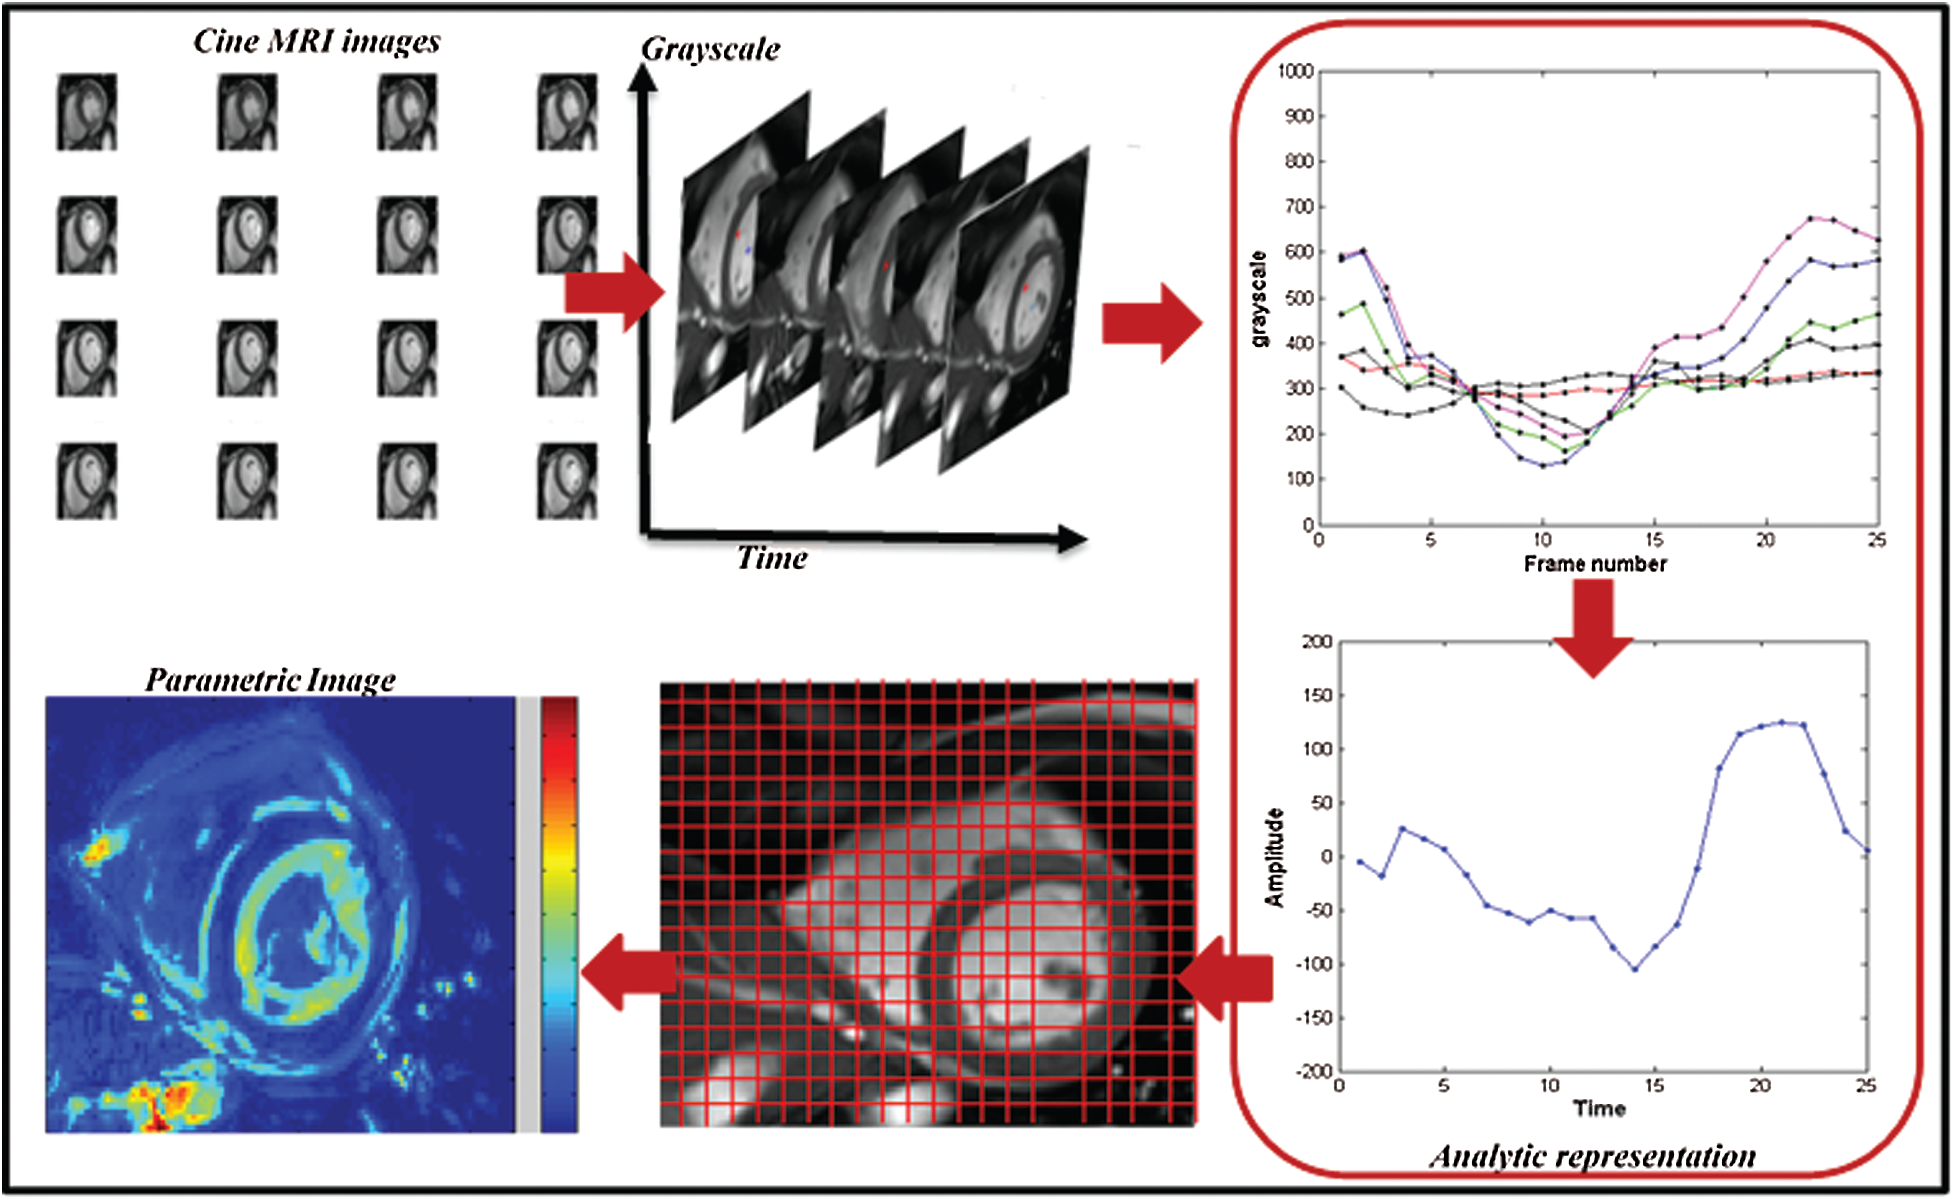
Figure 2: Computation of parametric image from the analytic signal
In order to establish an accurate comparison between three parametric methods that have been developed recently for quantification of LV dysfunction, we chose to implement the three methods of parametric images computation following the same validation protocol for the different methods and keeping the same conditions. The different approaches and the steps leading to the computation of different parametric images will be described in the next section.
2.3.1 Parametric Imaging Technique
The parametric imaging technique is based on the measurement of signal variability within the pixel over the cardiac cycle to capture wall motion information. From these extracted signals, it is possible to compute a physical parameter such as the maximum amplitude, the phase or the contraction time calculated for each pixel in the image that reflects the wall motion of the myocardium. All the quantitative parameters were used to generate a map that contains all feature values that reflect the degree of contraction in a well-defined region of interest. The quantitative feature values were projected on a color scale ranging from black to red. If a region suffers from a contraction decrease such as hypokinesia, this will be manifested by a sudden decrease in color indicating the seat of the abnormality [19].
This technique represents a potential tool in improving the regional detection of wall motion abnormalities. First, the parametric image does not requires the detection of myocardial contours for all images through the cardiac cycle, which is time consuming. Additionally, it provides the exact size of wall motion dysfunction, which manifests by a change of color intensity in the image. Therefore, parametric imaging represents an alternative approach to obtain quantitative indices about motion of underlying structures and to represent an image that summarizes the information of the whole cardiac cycle.
2.3.2 Parametric Imaging Method Based on Covariance Analysis
The covariance is a mathematical function for measuring the deviation degree between sets of data that consist of two variables. In medical imaging, this technique was applied to test whether two points or regions in the image move independently or follow the same direction. In cardiology, specifically in cardiac MRI, the covariance was used to measure the deviation of contractility between different myocardial segments in term of wall motion [20,21]. The computation of parametric images using the covariance function requires the identification of small region with well-known contraction behavior. This region serves as reference for the other points. In this section, it will give an overview of the steps leading to the computation of a parametric image using the statistical tool covariance function. By computing the covariance value for each pixel, it is possible to analyze the contraction degree for each point located in the myocardium. The covariance function for a defined pixel is calculated as follows [20]:
The covariance value
2.3.3 Parametric Imaging Method Based on Hilbert Transform
The analytic signal is a complex signal computed from the real signal in conjunction with its Hilbert transform [22]. It conserves the same energy as the real signal by canceling the negative frequencies and doubling the amplitude of the positive frequencies. The analytical signal noted
The Hilbert transform is a phase shift of –Π/2 of the original signal. This analytical representation of the signal allows the simple modeling of the stationary and non-stationary signals. Moreover, some important characteristics of an image could be obtained from the expression of this complex signal, such as the phase and the amplitude, which represent respectively the envelope and the shape of the signal. The instantaneous frequency could also be generated by deriving the phase feature [24].
For parametric amplitude image computation, it have followed the variation of the pixel intensities through the MRI sequence. A temporal curve was defined for each pixel, reflecting the variation of the LV volume. To compute the analytical signals, this study used the mathematical tool “the Hilbert transform”. This tool makes it possible to add to the real signal an imaginary component. The set of two real and imaginary components forms the complex representation 1D called an analytic representation. From each analytic signal, the maximum value was defined and the instantaneous amplitude feature of the analytical signal was computed using this equation [25]:
This feature has been computed for each pixel within the myocardium. Color-coding was used to represent all amplitude values as a parametric map (see Fig. 2). It projected all amplitude values on a color scale from black to white. Each color reveals the level of contractility in a specific segment [26].
2.3.4 Parametric Imaging Method from the Monogenic Signal
The analytical signal has been commonly employed in the field of “image processing” specially, for the extraction of the instantaneous features like amplitude and frequency. By using the mathematical tool Riesz transform as an alternative of the Hilbert transform, it is possible to extend the concept of analytic signal to 2D. This 2D generalization is known as the monogenic signal [27]. The monogenic signal tool allows the computation of local features from the image such as the local amplitude that represents the energy, image structural information that usually defined by local phase, and the orientation that informs about the dominant direction in an image [28]. The monogenic signal is defined as [29]:
With
In this study, a spherical bandpass filter “log-Gabor” was used to compute the real component of the monogenic signal [30]. Each pixel from the MRI image was convolved by the log-Gabor filter. Then, we computed the two odd filter responses to compute the monogenic signal. Finally, the amplitude value was generated using the following expression:
The process was repeated for all pixel intensity in the MRI image to generate a cartography of amplitudes. The parametric image generated from the monogenic signal gives an information about the contraction level in each region of the myocardium that represents the source of cardiac wall. In this image, a normal left ventricular function is characterized by a homogeneous color, whereas a contractile dysfunction is defined by a variation of color in the myocardial segments. The simplicity of this approach enables its use in the clinical routine of MRI and other imaging methods without any need to draw complex assumptions. Fig. 3 shows steps for amplitude image computation based on three parametric imaging methods.
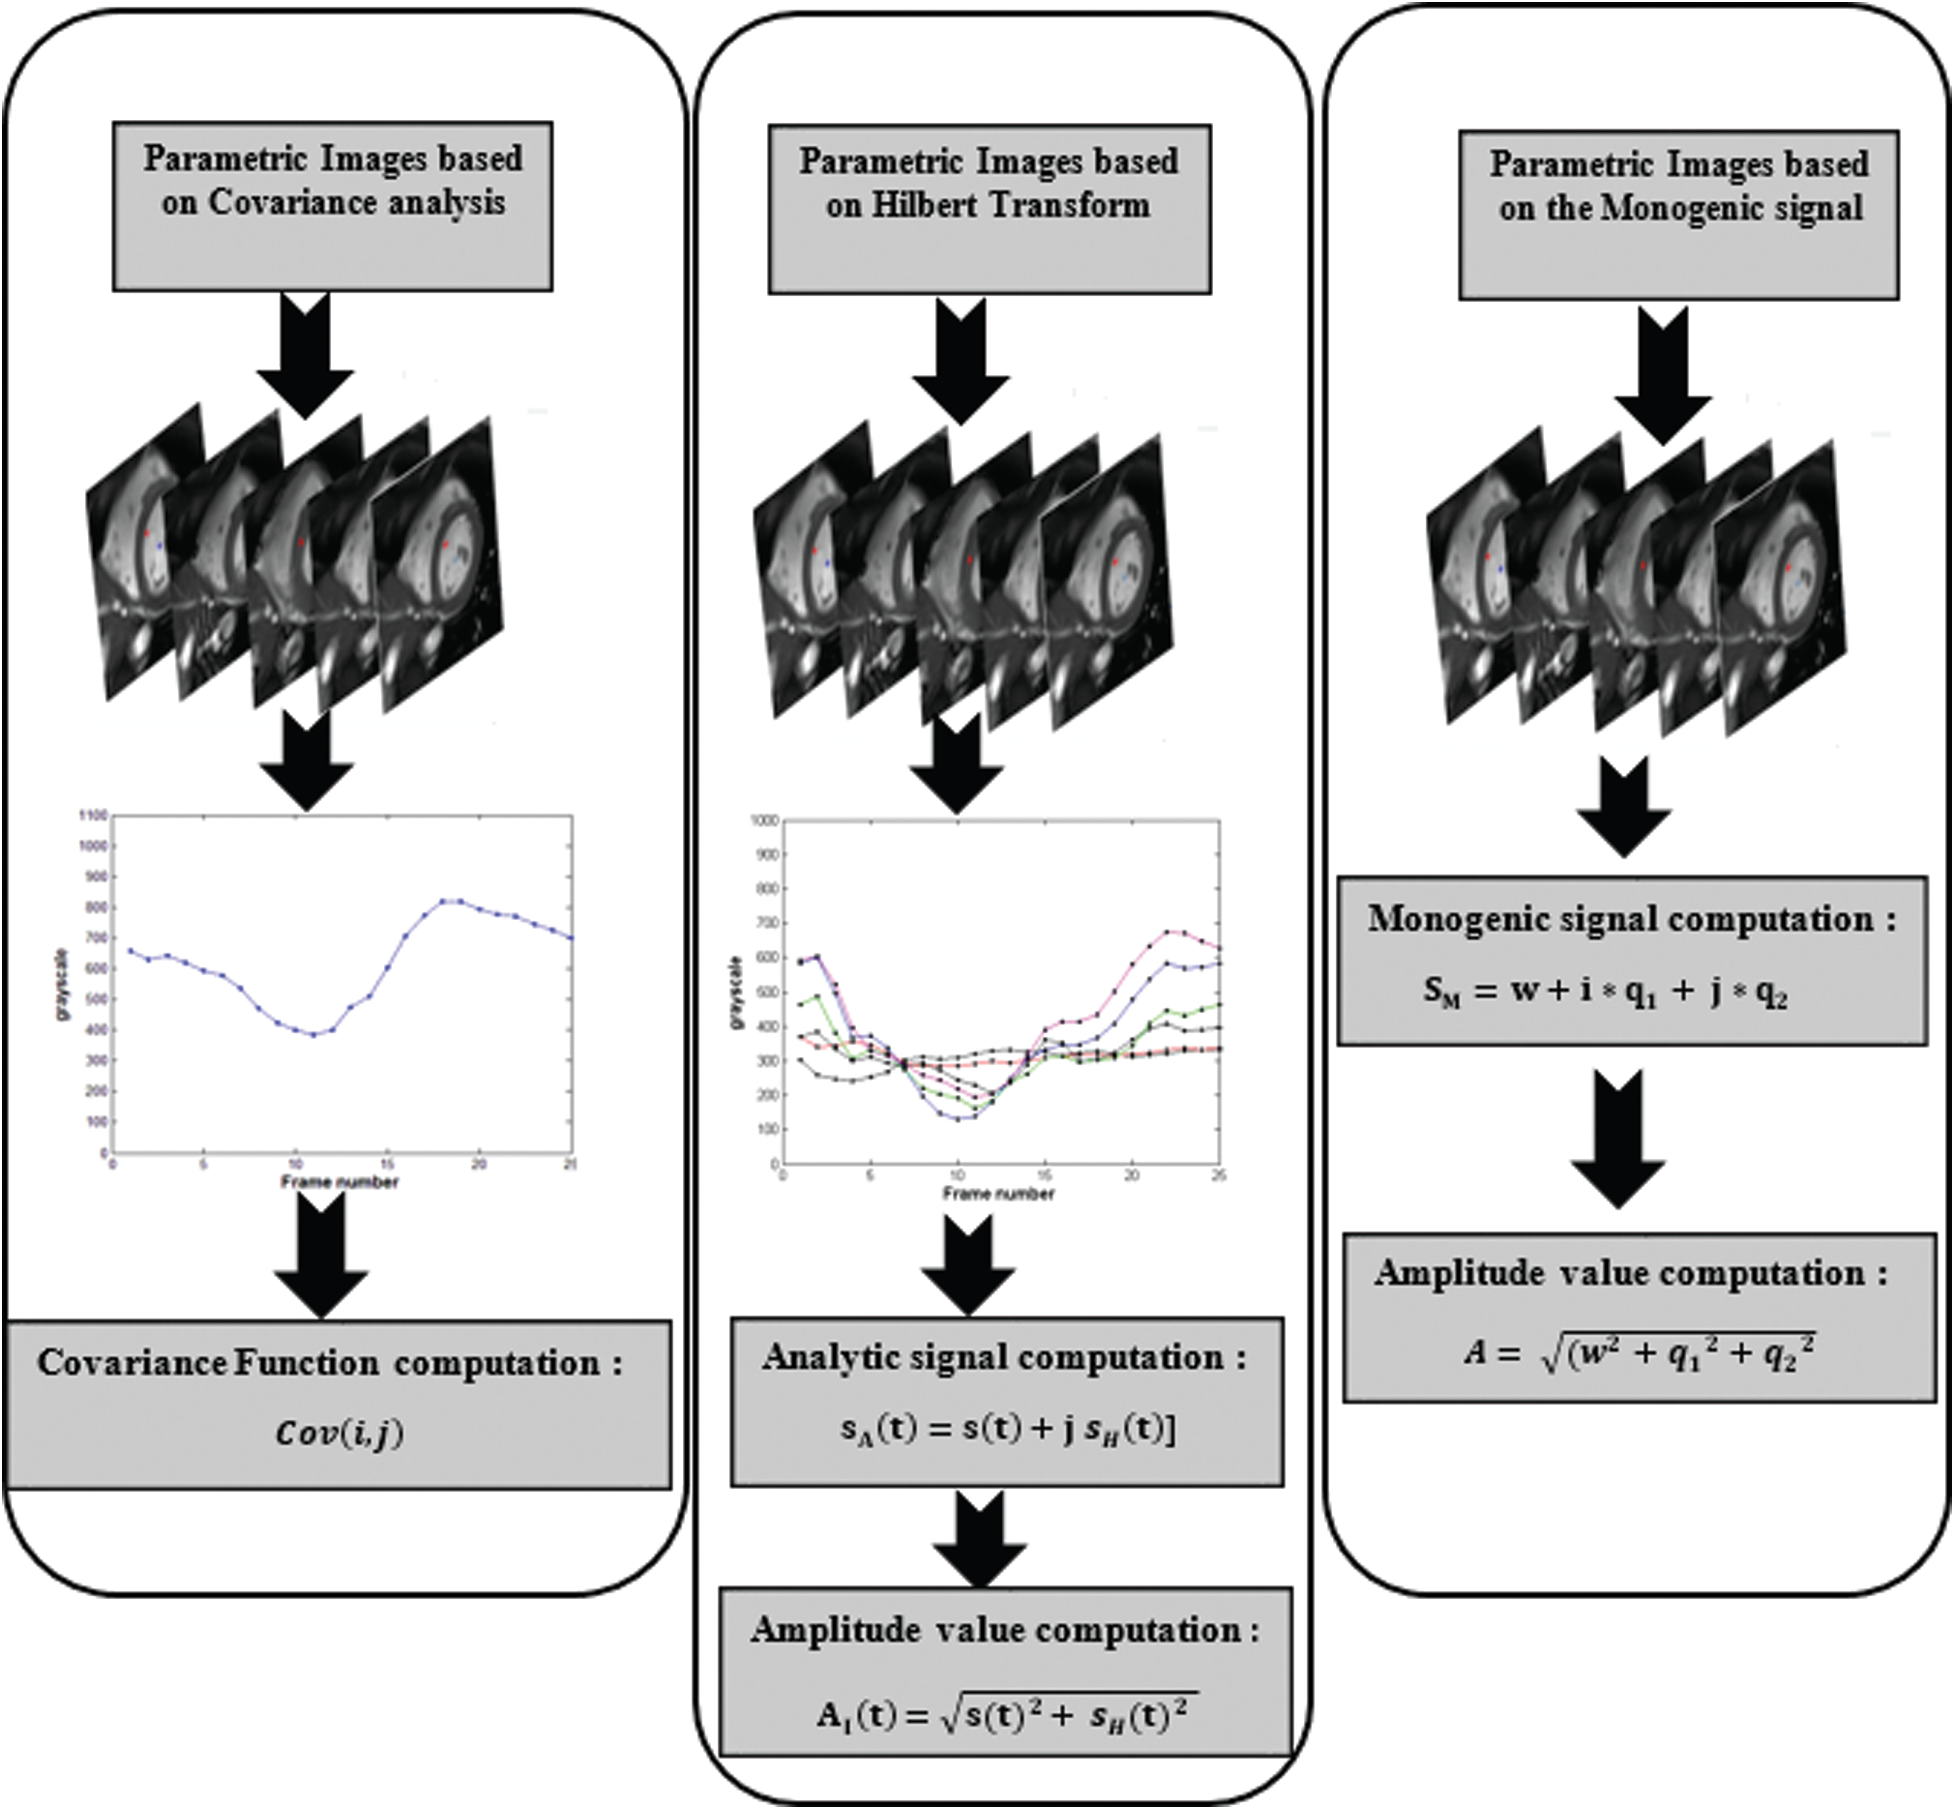
Figure 3: A workflow describing the process of amplitude image generation using three parametric imaging approaches
To validate our comparative study, we used the following protocol: for each patient, three parametric amplitude images were computed using three different approaches: covariance analysis, parametric images using Hilbert transform and those based on the monogenic signal. In this study, two experienced cardiologists using the 16 segments model recommended by American Heart Association/American college of cardiology (AHA/ACC) analyzed contraction abnormalities [31]. Following the 16 segments model, the myocardium is divided to six segments for respectively basal and Medio-basal slices and 4 segment for the basal slice. The 17 segments was not analyzed in CMRI short-axis view. Additionally, FT-strain analysis was performed offline for the same patients using dedicated software (cvi42, Circle Cardiovascular Imaging, Calgary, Canada). For each patient, segmental radial strain maps were computed according to the 16-segments model and the results of this analysis was used for the classification of different segments (see Fig. 4). The identification of myocardial dysfunction was based on three criteria: the motion of each myocardial segment, the myocardial thickness variation and the FT-strain results. According to the cardiologists ‘interpretation, each myocardial segment were classified as normal or with dysfunction. All the 640 segments (40 cine MRI sequences * 16 segments) were scored independently by the two cardiologists and the final interpretation results between them were served as a gold standard for the comparative study.
After three weeks, two other experienced readers reviewed the same segments to establish a comparison between the three parametric methods and to evaluate the agreement level between each one and the ground truth. The outcomes of this analysis were used to compute sensitivity, specificity, accuracy, positive predictive value and negative predictive value.
Additionally, the average of contraction values generated from the monogenic signal for each myocardial sector were compared to that obtained from the other two approaches. The linear regression and the Bland-Altman analysis were computed. For further validation, the execution time for different algorithms were also compared.
All of 640 myocardial segments that use in this study have classified as normal function and dysfunction. Due to the gold standard interpretation, 514 segments suffered from contractile dysfunction (80.31%) while 126 segments had normal function (19.68%). The results of the comparison between the three methods of parametric images computation reveal that the monogenic signal-based approach is more efficient in terms of accuracy (89.06%), sensitivity (89.69%) and specificity (86.51%). The parametric images based on the Hilbert transform is superior in terms of sensitivity (83.07%) and accuracy (82.50%) to the covariance analysis method while this later has a higher specificity (84.92%) than that based on the Hilbert transform (80.16%). Tab. 2 summarizes the results of the comparison between the parametric amplitude images based on the covariance analysis, Hilbert transforms and the monogenic signal:
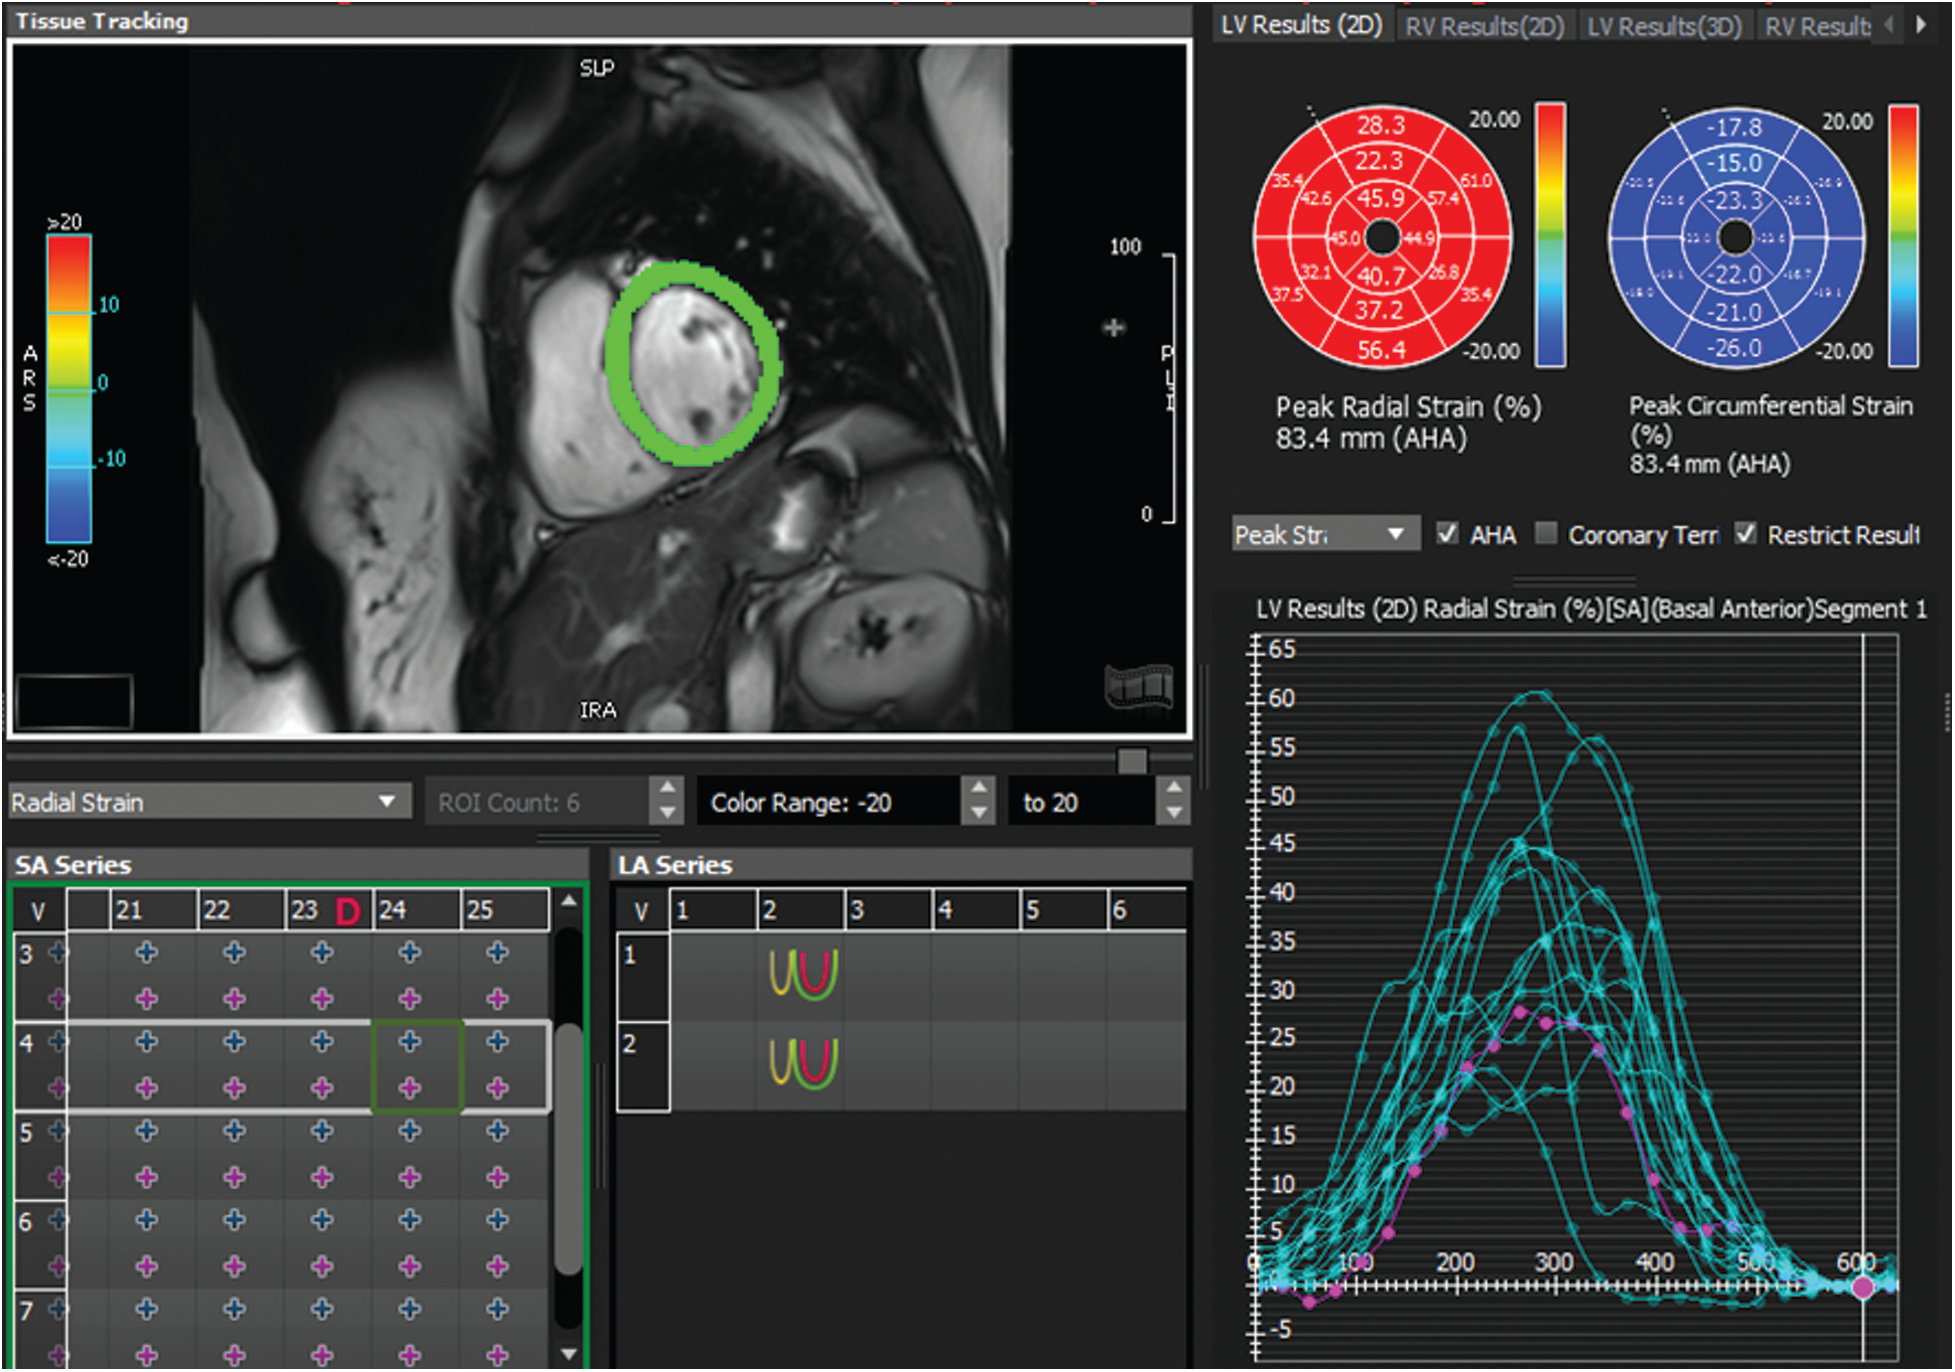
Figure 4: Example of radial strain map and time-strain curve derived from feature tracking software (Circle cvi42) for a patient with normal wall motion
For further evaluation, we opted to evaluate the execution time for different algorithms using 1.73 GHz i7–740QM Processor. According to Tab. 3, the execution time is acceptable for the three approaches. However, it is far lower in the case of parametric images using the monogenic signal. According to the result, the monogenic signal algorithm could generate a parametric image with CPU time 6 s in its best while the Hilbert transform and the covariance approaches require respectively 32 and 17 s to generate the same image.
As an additional quantitative assessment, the average of contraction values generated from the monogenic signal for each myocardial sector were compared to that obtained from the other two approaches. The linear regression analysis shows a strong correlation between the contraction values obtained by monogenic signal approach and the Hilbert transform with a coefficient of correlation r = 0.91 (for p < 0.01). Furthermore, the Bland-Altman analysis shows a mean difference = −2.3 between contraction values derived from the two methods (see Fig. 5b). The results reveal that there was no significant difference in contraction measurements obtained by both methods. However, the difference in contraction values was more pronounced between the monogenic approach and the covariance analysis (mean difference = −10.8). Additionally, the correlation coefficient was little lower (r = 0.85) in comparison to that obtained between the monogenic and Hilbert transform approaches.
Table 2: Results of the comparison between the parametric amplitude images based on the covariance analysis, Hilbert transform and the monogenic signal

Table 3: Comparison between the three approaches of parametric images in term of execution time

Fig. 6 shows an example of two frames of cine-MRI sequences with their corresponding parametric images computed respectively. The computation is done based on the monogenic signal, the Hilbert transform (top panel), and the covariance analysis (bottom panel) methods for a patient with myocardial infarction located in the inferior as well as inferolateral walls. Based on the Hilbert transform analysis, the parametric amplitude image shows a momentous variation of color intensity and different pattern, which was reflecting the presence of contractile dysfunction. Similarly, a decrease in the amplitude value have been revealed in the two parametric images. These two images were examined based on the monogenic signal and covariance analysis of the same patient. The decrease ratio is observed clearly in the images by a decreased intensity in the same sectors compared to the other myocardial areas. The qualitative and the quantitative analysis confirms that the location of wall motion abnormalities is the same for the three parametric amplitude images. Additionally, the regional heterogeneity of contraction amplitude was easily identified using parametric image with the monogenic signal where a significant change of color distribution was depicted in the segments with reduced contraction. The covariance analysis was less helpful for the identification of segments with myocardial dysfunction where Fig. 6i shows a little change of myocardial thickness while the color is kept the same.
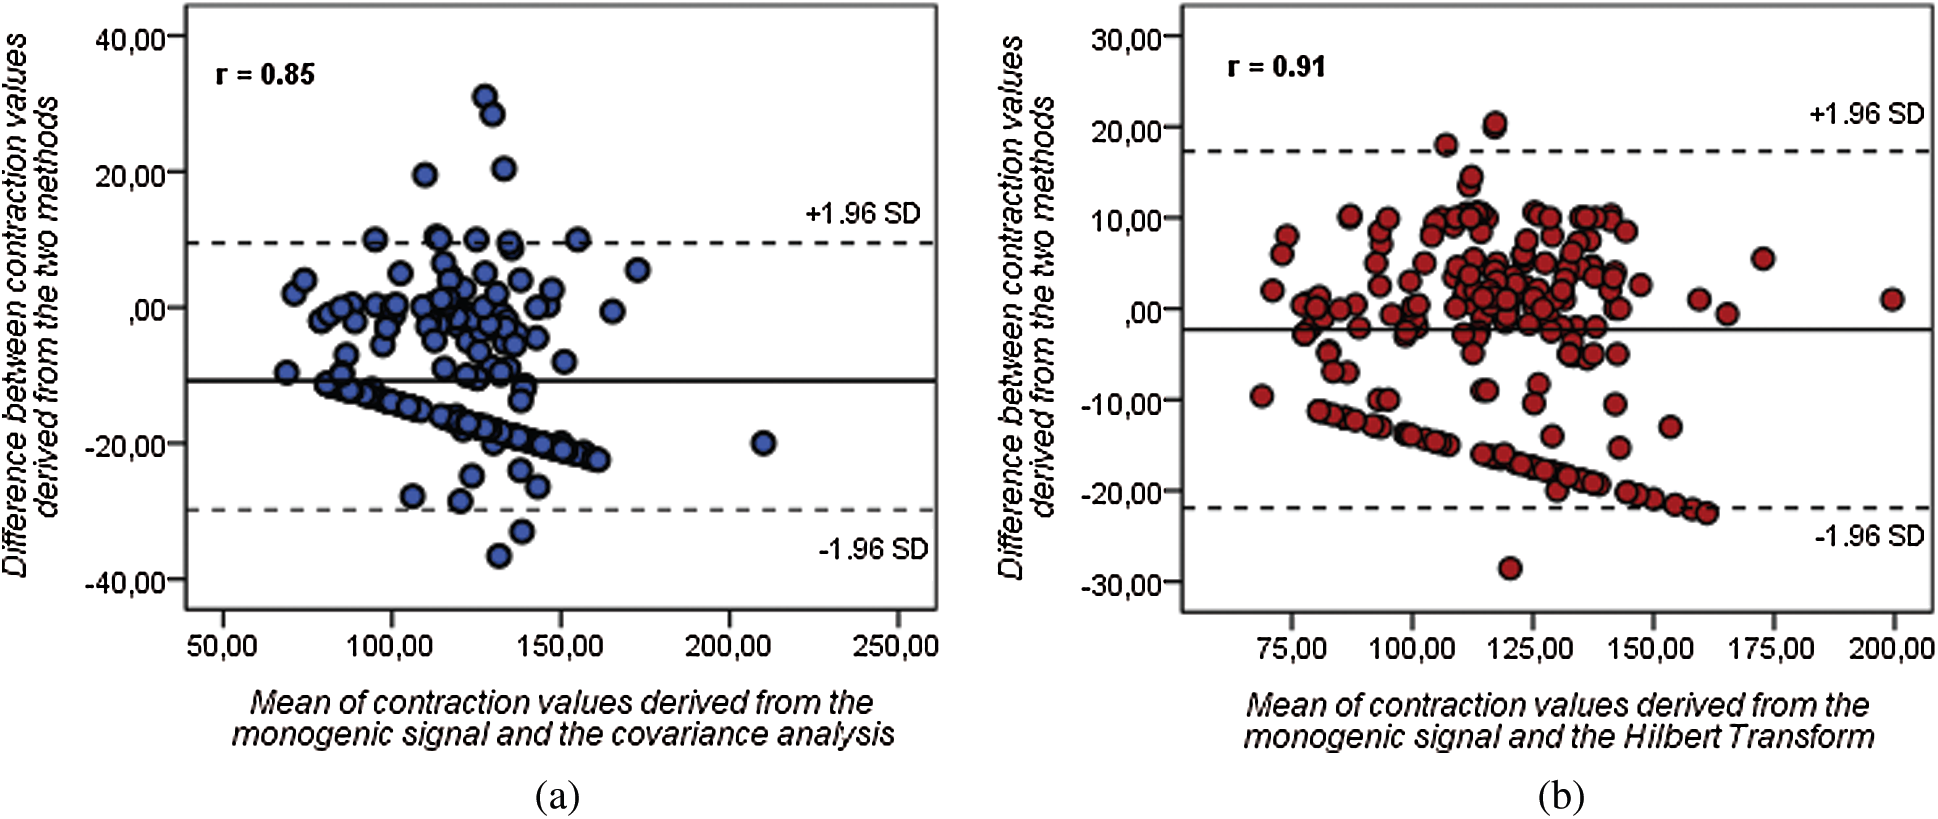
Figure 5: Bland-Altman (BA) diagrams showing the mean difference (solid line) between contraction values derived from (a) monogenic signal and covariance analysis and between (b) monogenic signal and Hilbert transform (dashed lines represent the upper and lower limits of agreement)
A visual inspection of Fig. 7 shows a homogeneous distribution of contraction ‘amplitude along the myocardium. The three approaches reveal similar results of contraction amplitude, which approve the normal aspect of the myocardium. This observation was confirmed by the circumferential map obtained from strain analysis (Fig. 7c) where there is a uniform color distribution in the different myocardial segments. The blue color that characterizes the entire myocardium in the circumferential map reveals normal strain values.
Additionally, we compared the findings of our study to the results of other recent methods developed for regional assessment of cardiac wall motion. The results of this comparison are summarized in Tab. 4:
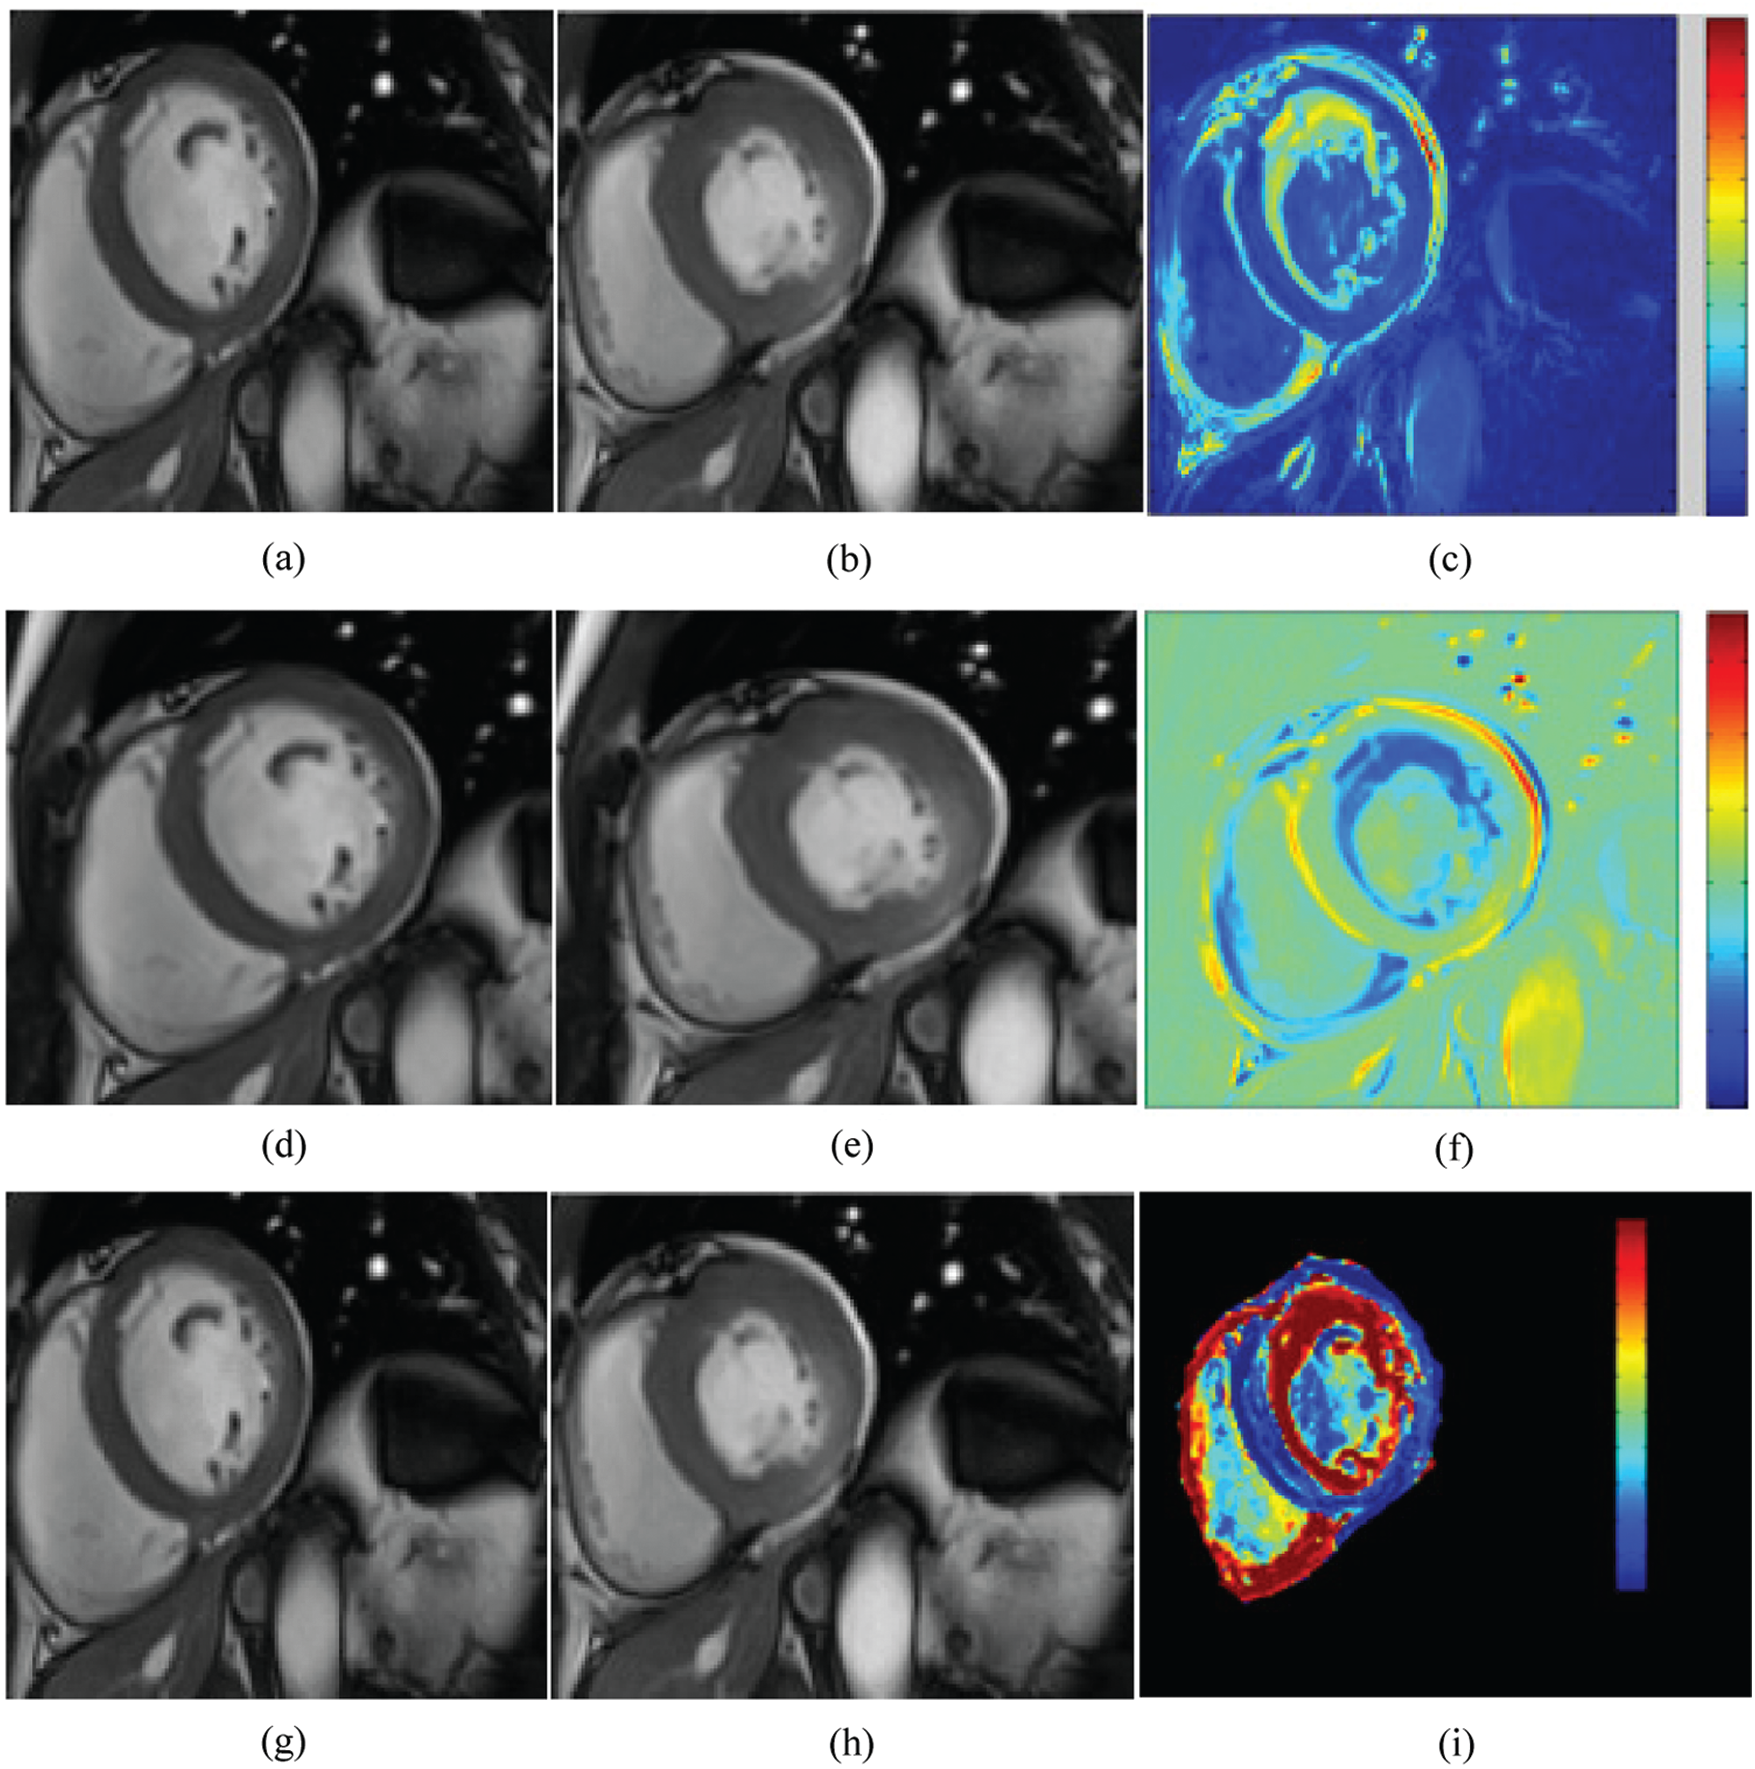
Figure 6: Cine MRI images at the two instants: end-diastole (a, d, g) and end systole (b, e, h) with the corresponding parametric images computed from the Hilbert transform (c), the monogenic signal (f), and the covariance analysis (i) for a subject with myocardial infarction. A significant change of color distribution and myocardial thickness were depicted in the same segments (the inferior and inferolateral segments) of parametric images
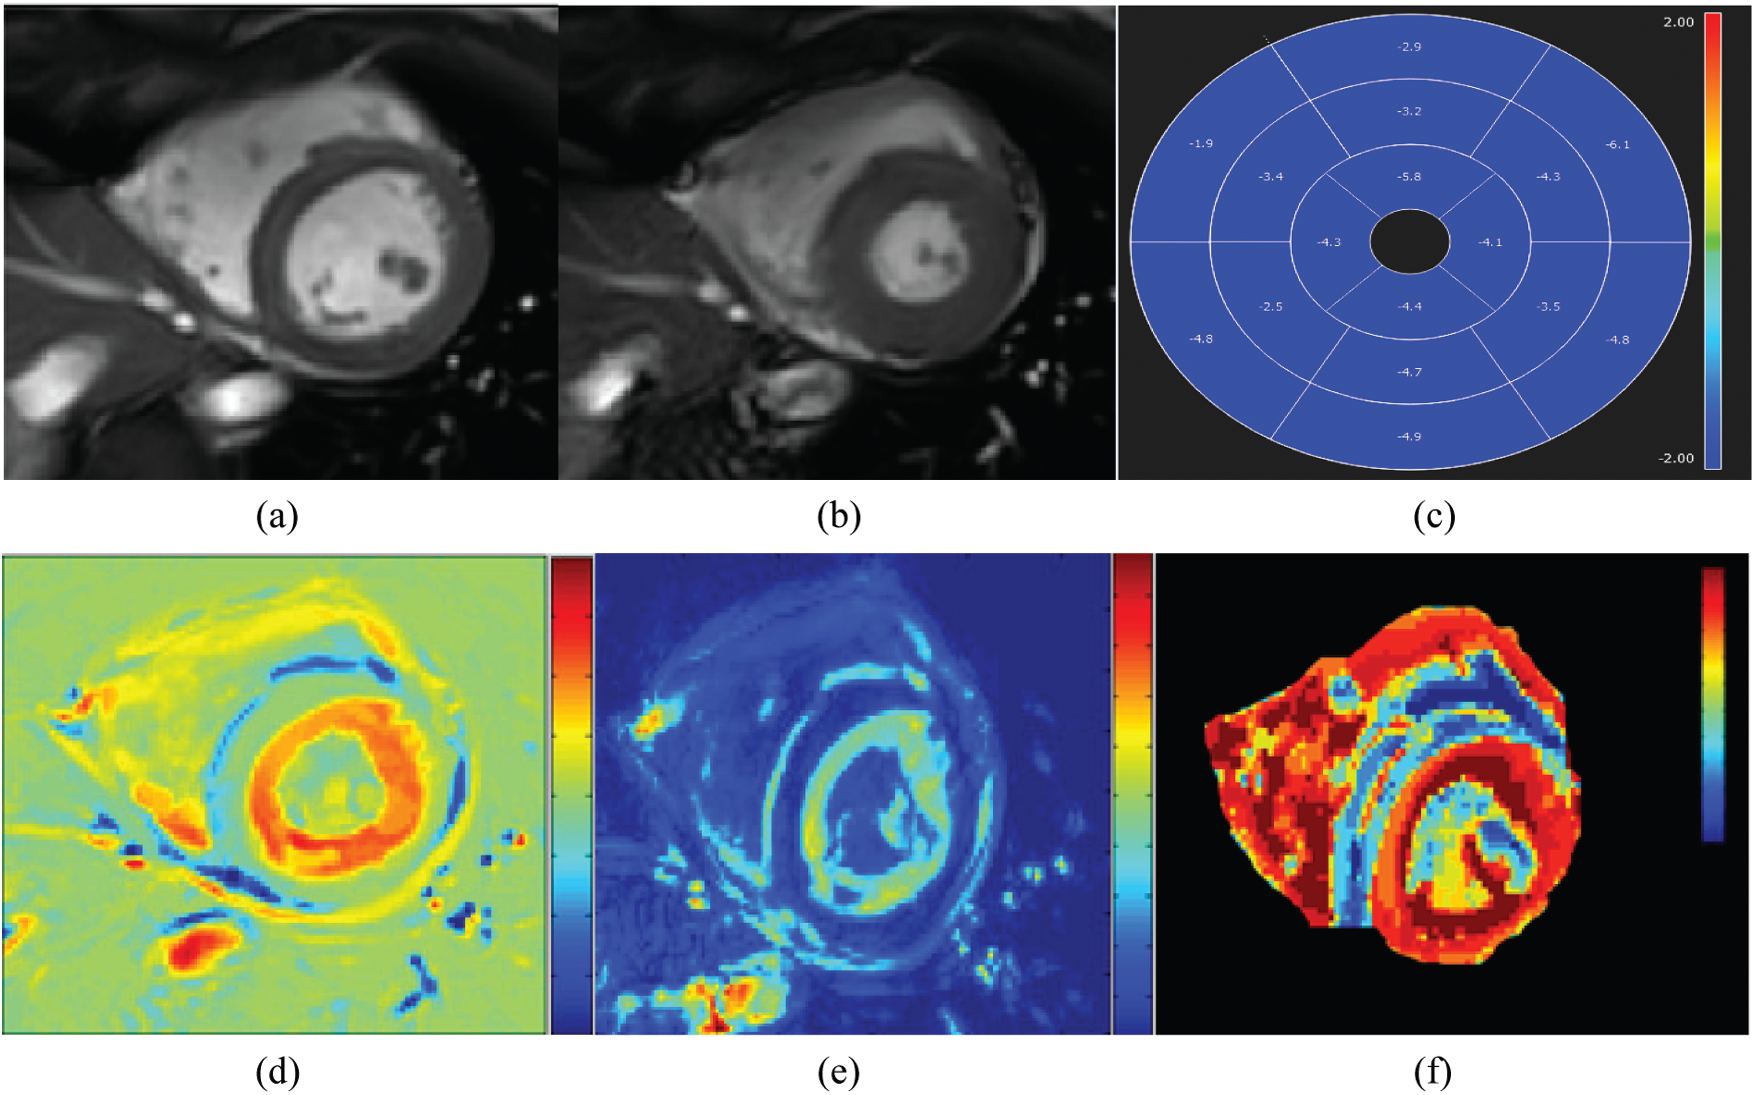
Figure 7: Cine MRI images at the two instants: end-diastole (a) and end systole (b) with the corresponding circumferential strain map (c) and parametric images computed from the monogenic signal (d), the Hilbert transform (e), and the covariance analysis (f) for a healthy subject
Table 4: Overview of some comparative studies between different methods developed in literature for regional assessment of cardiac wall motion using MRI

The analysis of abnormal myocardial segments using CMRI is usually performed by visual interpretation of cine-MRI images and after the computation of some global parameters using manual delineation of the epicardial and endocardial contours [39]. An analysis of the late gadolinium enhancement sequence is often requested in a cardiac examination for the detection of the location of cardiac diseases, which manifests by a hyperintense signal that appears in the necrotic zones. Nevertheless, the interpretation of this one is not able to distinguish between the segments with contractile dysfunction and the infarcted areas [40,41]. In this context, the parametric image shows good performances in the evaluation of contractile alterations associated with various cardiovascular diseases. The parametric image generates a mapping by computing a quantitative physical parameter that reflects the level of contractility. The main advantage of this technique is its ability to give more details on the degree of ventricular contraction without the need for more sophisticated methods of detecting myocardial contours [42-48]. Recently, different approaches for generating a parametric amplitude have been proposed [26]. These methods use the concept of complex representation, which makes it possible to extract the amplitude feature at any time directly from a complex signal. In this study, we established a comparison between the performances of three parametric imaging techniques developed in cardiac MRI for the regional quantification of cardiac dysfunction.
The outcomes of this study show the approach based on Hilbert transform is superior in terms of sensitivity and accuracy to the covariance analysis method. This result prove the ability of parametric image based on Hilbert transform to correctly identify segments with myocardial dysfunction. Additionally, The Hilbert transform is suitable for both stationary and nonstationary signals but it still suffers from a relatively long acquisition time (23 s/image) that may limit its transfer and accreditation for use in clinical practice. Our findings also demonstrate that the use of monogenic signal show an improvement in the accuracy, specificity and sensitivity of the parametric image interpretation. Thus could be lies to the fact that this approach extracts contraction ‘amplitude feature directly from the images without the need to proceed to signal extraction step (see Fig. 3). In the covariance analysis and Hilbert transform methods, features were extracted from a signal and then were used to generate a parametric mapping, resulting in lower detection performances in comparison with the monogenic signal [28]. Furthermore, this later offers an optimization in the acquisition time of the images (6 s/image). The statistical analysis shows a strong correlation between the averages of contraction values obtained between the three approaches. However, the highest correlation was found between contractions values derived from the monogenic and the Hilbert transform approaches while a little variation was observed between contraction measurements derived from the monogenic and the covariance analysis. The results confirm that the use of the monogenic signal allows a better identification of abnormal myocardial segments, mainly hypokinesia, which is the most common contraction abnormality for cardiovascular diseases. This study highlight the potential usefulness of parametric amplitude images in the quantification of wall motion alterations and their reliability as a diagnostic aid tool in clinical routine. Nevertheless, it is important to note that the presence of papillary muscles and trabecula on the endocardial surface can cause problems for parametric imaging interpretation derived from cine image series. To overcome this limitation, a preprocessing step are needed to filter the original MRI images. Moreover, as regards the computational aspects of the amplitude image itself, the main limitation is related to the sensitivity to the variation of content between end-diastole and end-systole frames.
In this study, the following limitations should be considered:
• The evaluation of three approaches is based the interpretation made by expert radiologists and strain analysis. However, the dependence on the observer skills leads to interobserver variability.
• Our comparative study are based on a binary score of normal and abnormal. The classification of myocardial alterations into different categories (moderate hypokinesia, severe hypokinesia, akinesia and dyskinesia) was not performed.
• To establish a comparison between three methods, the short-axis view was only used. Other studies including cine-MRI images in two and four-chamber views should be performed.
• The described approaches may be adequate for the identification of abnormal segments for patients with myocardial infarction. However, they could be not reproducible for other cardiovascular diseases such as myocarditis. For this reason, other comparative analysis should be conducted and validated on a larger population of clinical cases using more cardiovascular diseases.
In the present study, a comparative study was established between three methods for computing a parametric image using different approaches. The evaluation was based on multiple performance metrics such as accuracy, sensitivity, specificity and execution time. The comparison results shows that the detection performance of contractile alterations using the monogenic signal is superior to those obtained with Hilbert transform and covariance analysis. Additionally, the approach of the monogenic signal offers a rapid acquisition of parametric images and a correct identification of abnormal segments. Hence, this method is likely to give more details about LV dysfunction and it may be used in clinical practice as a tool for the analysis of myocardial dysfunction. A possible way for future research is to evaluate the diagnostic performance of this approach based on the monogenic signal in the study of myocardial viability.
Acknowledgement: The authors would like to acknowledge University of Tunis el Manar and University of Deusto for providing all facilities and support for this study.
Funding Statement: This research received funding from Basque Country Government.
Conflicts of Interest: The authors declare that they have no conflicts of interest to report regarding the present study.
1. E. J. Benjamin, M. J. Blaha, S. E. Chiuve, M. Cushman, S. R. Das et al., “Heart disease and stroke statistics—2017 update: A report from the American heart association,” Circulation, vol. 135, pp. e146–e603, 2017. [Google Scholar]
2. D. J. Pennell, “Cardiovascular magnetic resonance,” Circulation, vol. 121, pp. 692–705, 2010. [Google Scholar]
3. S. Pujadas, G. P. Reddy, O. Weber, J. J. Lee and C. B. Higgins, “MR imaging assessment of cardiac function,” Journal of Magnetic Resonance Imaging, vol. 19, pp. 789–799, 2004. [Google Scholar]
4. M. Elhoseny, M. A. Mohammed, S. A. Mostafa, K. H. Abdulkareem, M. S. Maashi et al., “A new multi-agent feature wrapper machine learning approach for heart disease diagnosis,” Computers, Materials & Continua, vol. 67, no. 1, pp. 51–71, 2021. [Google Scholar]
5. P. J. Ahrens, F. H. Sheehan, J. V. Dahl and R. Uebis, “Extension of hypokinesia into angiographically perfused myocardium in patients with acute infarction,” Journal American College Cardiology, vol. 22, no. 4, pp. 1010–1015, 1993. [Google Scholar]
6. E. Santas, E. Núñez and J. Núñez, “Role of functional mitral regurgitation in heart failure with preserved ejection fraction: An unrecognized protagonist?,” European Journal of Heart Failure, vol. 19, pp. 290, 2016. [Google Scholar]
7. K. T. Dietenbec, M. Alessandrini and D. Barbosa, “Detection of the whole myocardium in 2D echocardiography for multiple orientations using a geometrically contrained level-set,” Medical Image Analysis, vol. 16, pp. 386–401, 2012. [Google Scholar]
8. S. Bricq, J. Frandon and M. Bernard, “Semiautomatic detection of myocardial contours in order to investigate normal values of left ventricular trabeculated mass using MRI,” Journal of Magnetic Resonance Imaging, vol. 42, pp. 1398–1406, 2016. [Google Scholar]
9. N. Arunkumar, M. A. Mohammed, S. A. Mostafa, D. A. Ibrahim, J. J. Rodrigues et al., “Fully automatic model-based segmentation and classification approach for MRI brain tumor using artificial neural networks,” Concurrency and Computation: Practice and Experience, vol. 32, no. 1, pp. e4962, 2020. [Google Scholar]
10. M. Xavier, A. Lalande, P. M. Walker, F. Brunotte and L. Legrand, “An adapted optical flow algorithm for robust quantification of cardiac wall motion from standard cine-mr examinations,” IEEE Transactions on Information Technology in Biomedicine, vol. 16, pp. 859–868, 2012. [Google Scholar]
11. M. Alessandrini, H. Liebgott and O. Bernard, “Monogenic phase-based optical flow computation for myocardial motion analysis in 3D echocardiography,” in STACOM Workshop of the 15th Int. Conf. on Medical Image Computing and Computer-Assisted Intervention, Nice, France, pp. 159–168, 2012. [Google Scholar]
12. M. S. Amzulescu, M. De Craene, H. Langet and A. Pasquet, “Myocardial strain imaging: Review of general principles, validation, and sources of discrepancies,” European Heart Journal—Cardiovascular Imaging, vol. 20, pp. 605–619, 2019. [Google Scholar]
13. H. Everaars, L. F. Robbers, M. Götte, P. Croisille, A. Hirsch et al., “Strain analysis is superior to wall thickening in discriminating between infarcted myocardium with and without microvascular obstruction,” European Radiology, vol. 28, pp. 5171–5181, 2018. [Google Scholar]
14. V. L. Ramaiah, B. Harish, H. V. Sunil, J. Selvakumar, K. Ravi et al., “Fourier phase analysis on equilibrium gated radionuclide ventriculography: Range of phase spread and cut-off limits in normal individuals,” Indian Journal of Nuclear Medicine, vol. 26, pp. 131–134, 2011. [Google Scholar]
15. N. A. Lassen, H. Lida and I. Kanno, “Parametric imaging in nuclear medicine,” Annals of Nuclear Medicine, vol. 9, pp. 167–170, 1995. [Google Scholar]
16. C. L. Hansen, “Limitations of parametric modeling of the left ventricle using first harmonic analysis: Possible role for Gaussian modeling,” Journal of Nuclear Cardiology, vol. 21, pp. 723–729, 2014. [Google Scholar]
17. C. Ruiz Dominguez, N. Kachenoura, A. De Cesare, A. Delouche, P. Lim et al., “Assessment of left ventricular contraction by parametric analysis of main motion (pammTheory and application for echocardiography,” Physics in Medicine and Biology, vol. 50, pp. 3277–3296, 2005. [Google Scholar]
18. N. Kachenoura, A. Delouche, C. Ruiz Dominguez, O. Nardi, F. Frouin et al., “An automated four-point scale scoring of segmental wall motion in echocardiography using quantified parametric images,” Physics in Medicine and Biology, vol. 55, pp. 5753–5766, 2010. [Google Scholar]
19. A. Dimitrakopoulou-Strauss, L. Pan and C. Sachpekidis, “Kinetic modeling and parametric imaging with dynamic PET for oncological applications: General considerations, current clinical applications, and future perspectives”, vol. 78, no. 1, pp. 21–39, 2021. [Google Scholar]
20. A. O. Boudraa, F. Behloul and M. Janier, “Temporal covariance analysis of first-pass contrast enhanced myocardial magnetic resonance images,” Computers in Biology and Medicine, vol. 3, pp. 133–142, 2001. [Google Scholar]
21. K. Hamrouni and N. Khlifa, “Two methods for analysis of dynamic scintigraphic images of the heart,” Int Arab J Inf Techn, vol. 3, pp. 119–125, 2006. [Google Scholar]
22. D. Gabor, “Theory of communication. J Inst Electr Eng, vol. 93, pp. 429–457, 1946. [Google Scholar]
23. A. Mutlag, M. Ghani, M. Mohammed, M. Maashi, S. Mostafa et al., “MAFC: Multi-agent fog computing model for healthcare critical tasks management,” Sensors, vol. 20, no. 7, pp. 1853, 2020. [Google Scholar]
24. M. Mohammed, K. Abdulkareemet, A. Al-Waisy, S. Mostafa, S. Al-Fahdawi et al., “Benchmarking methodology for selection of optimal covid-19 diagnostic model based on entropy and topsis methods,” IEEE Access, vol. 8, pp. 99115–99131, 2020. [Google Scholar]
25. E. Bedrosian, “The analytic signal representation of modulated waveforms,” in Proc. of the IRE, New York, USA, pp. 2071–2076, 1962. [Google Scholar]
26. N. Benameur, E. G. Caiani, Y. Arous, N. B. Abdallah and T. Kraiem, “Interpretation of cardiac wall motion from cine-mri combined with parametric imaging based on the hilbert transform,” Magnetic Resonance Materials in Physics Biology and Medicine, vol. 30, pp. 347–357, 2017. [Google Scholar]
27. M. Alessandrini, A. Basarab, H. Liebgott, and O. Bernard, “Myocardial motion estimation from medical images using the monogenic signal,” IEEE Transaction on Image Processing, vol. 22, pp. 1084–1095, 2013. [Google Scholar]
28. N.Benameur, E. G. Caiani, Y. Arous, N. B. Abdallah and T. Kraiem, “Left ventricular MRI wall motion assessment by monogenic signal amplitude image computation,” Magnetic Resonance Imaging, vol. 54, pp. 109–118, 2018. [Google Scholar]
29. M. Felsberg and G. Sommer, “The monogenic scale-space: A unifying approach to phase-based image processing in scale-space,” J Math Imaging Vis, vol. 21, pp. 5–26, 2004. [Google Scholar]
30. D. Boukerroui, J. A. Noble and M. Brody, “On the choice of band-pass quadrature filters,” Journal of Mathematical Imaging and Vision, vol. 21, pp. 53–80, 2004. [Google Scholar]
31. M. D. Cerqueira, N. J. Weissman and V. Dilsizian, “Standardized myocardial segmentation and nomenclature for tomographic imaging of the heart: A statement for healthcare professionals for the cardiac imaging committee of the council on clinical cardiology of the American heart association,” Circulation, vol. 105, pp. 539–542, 2002. [Google Scholar]
32. G. Korosoglou, S. Futterer, P. M. Humpert, N. Riedle, D. Lossnitzer et al., “Strain-encoded cardiac MR during high-dose dobutamine stress testing: Comparison to cine imaging and to myocardial tagging,” Journal of Magnetic Resonance Imaging, vol. 29, no. 5, pp. 1053–1061, 2009. [Google Scholar]
33. D. M. Harrild, Y. Han, T. Geva, J. Zhou, E. Marcus et al., “Comparison of cardiac mri tissue tracking and myocardial tagging for. assessment of regional ventricular strain,” International Journal of Cardiovascular Imaging, vol. 28, no. 8, pp. 2009–2018, 2012. [Google Scholar]
34. M. S. Amzulescu, H. Langet and E. Saloux, “Head-to-head comparison of global and regional two-dimensional speckle tracking strain versus cardiac magnetic resonance tagging in a multicenter validation study,” Circulation Cardiovascular Imaging, vol. 10, no. 11, pp. e006530, 2017. [Google Scholar]
35. H. Everaars, L. F. H. J. Robbers, M. Götte, P. Croisille, A. Hirsch et al., “Strain analysis is superior to wall thickening in discriminating between infarcted myocardium with and without microvascular obstruction,” Clinical Trial, vol. 25, no. 5, pp. 5171–5181, 2018. [Google Scholar]
36. J. J. Cao, N. Ngai, L. Duncanson, J. Cheng, K. Gliganic et al., “A comparison of both DENSE and feature tracking techniques with tagging for the cardiovascular magnetic resonance assessment of myocardial strain,” Journal of Cardiovascular Magnetic Resonance, vol. 28, no. 12, pp. 5171–5181, 2018. [Google Scholar]
37. S. Giusca, G. Korosoglou, V. Zieschang, L. Stoiber, B. Schnackenburg et al., “Reproducibility study on myocardial strain assessment using fast-sENC cardiac magnetic resonance imaging,” Scientific Reports, vol. 8, no. 1, pp. 14100, 2018. [Google Scholar]
38. R. Mahmoudi, N. Ben ameur, A. Ammari, M. Akil, R. Saouli et al., “Left ventricular segmentation based on a parallel watershed transformation towards an accurate heart function evaluation,” IET Image Processing, vol. 14, no. 3, pp. 506–517, 2020. [Google Scholar]
39. A. B. Redheuil, N. Kachenoura and R. Laporte, “Interobserver variability in assessing segmental function can be reduced by combining visual analysis of cmr cine sequences with corresponding parametric images of myocardial contraction,” Journal of Cardiovascular Magnetic Resonance, vol. 9, pp. 863–872, 2007. [Google Scholar]
40. E. G. Caiani, E. Toledo and P. MacEneaney, “The role of still frame parametric imaging in magnetic resonance: Assessment of left ventricular wall motion by non cardiologists,” Journal of Cardiovascular Magnetic Resonance, vol. 6, pp. 619–625, 2004. [Google Scholar]
41. G. Heusch and R. Schulz, “Characterization of hibernating and stunned myocardium,” European Heart Journal, vol. 18, pp. 102–110, 1997. [Google Scholar]
42. N. Benameur, E. G. Caiani, Y. Arous, N. B. Abdallah and T. Kraiem, “Parametric imaging for the assessment of cardiac motion: A review,” Cardiovascular Engineering and Technology, vol. 9, pp. 377–393, 2018. [Google Scholar]
43. H. J. Harms, M. C. Huisman, P. Knaapen, A. A. Lammertsma and M. Lubberink, “Parametric imaging of myocardial blood flow and viability using [15O] H2O and PET/CT,” Imaging in Medicine, vol. 3, pp. 711–724, 2011. [Google Scholar]
44. M. A. Mohammed, K. H. Abdulkareem, S. A. Mostafa, M. K. A. Ghani, M. S. Maashi et al., “Voice pathology detection and classification using convolutional neural network model,” Applied Sciences, vol. 10, no. 11, pp. 3723, 2020. [Google Scholar]
45. M. K. Abd Ghani, M. A. Mohammed, N. Arunkumar, S. A. Mostafa, D. A. Ibrahim et al., “Decision-level fusion scheme for nasopharyngeal carcinoma identification using machine learning technique,” Neural Computing and Applications, vol. 32, no. 3, pp. 625–638, 2020. [Google Scholar]
46. M. A. Mohammed, K. H. Abdulkareem, B. Garcia-Zapirain, S. A. Mostafa, M. S. Maashi et al., “A comprehensive investigation of machine learning feature extraction and classification methods for automated diagnosis of covid-19 based on X-ray images,” Computers, Materials & Continua, vol. 66, no. 3, pp. 3289–3310, 2021. [Google Scholar]
47. N. Arunkumar, M. A. Mohammed, M. K. Abd Ghani, D. A. Ibrahim, E. Abdulhay et al., “K-means clustering and neural network for object detecting and identifying abnormality of brain tumor,” Soft Computing, vol. 23, no. 19, pp. 9083–9096, 2019. [Google Scholar]
48. O. L. Obaid, M. A. Mohammed, M. K. A. Ghani, A. Mostafa and F. Taha, “Evaluating the performance of machine learning techniques in the classification of wisconsin breast cancer,” International Journal of Engineering & Technology, vol. 7, pp. 160–166, 2018. [Google Scholar]
 | This work is licensed under a Creative Commons Attribution 4.0 International License, which permits unrestricted use, distribution, and reproduction in any medium, provided the original work is properly cited. |