DOI:10.32604/cmc.2021.016816
| Computers, Materials & Continua DOI:10.32604/cmc.2021.016816 | |
| Article |
COVID19 Classification Using CT Images via Ensembles of Deep Learning Models
1Department of Computer Science, HITEC University Taxila, Taxila, 47080, Pakistan
2Department of Computer Science and Engineering, Soonchunhyang University, Asan, Korea
3College of Computer Engineering and Sciences, Prince Sattam Bin Abdulaziz University, Al-Khraj, Saudi Arabia
4PRTTL, Washington University in Saint Louis, Saint Louis, MO 63110, USA
5Department of Information Systems, Faculty of Computers and Information Sciences, Mansoura University, Mansoura, 35516, Egypt
6Department of Computer Science, Faculty of Computers and Information Sciences, Mansoura University, Mansoura, 35516, Egypt
*Corresponding Author: Yunyoung Nam. Email: ynam@sch.ac.kr
Received: 12 January 2021; Accepted: 20 March 2021
Abstract: The recent COVID-19 pandemic caused by the novel coronavirus, severe acute respiratory syndrome coronavirus 2 (SARS-CoV-2), has had a significant impact on human life and the economy around the world. A reverse transcription polymerase chain reaction (RT-PCR) test is used to screen for this disease, but its low sensitivity means that it is not sufficient for early detection and treatment. As RT-PCR is a time-consuming procedure, there is interest in the introduction of automated techniques for diagnosis. Deep learning has a key role to play in the field of medical imaging. The most important issue in this area is the choice of key features. Here, we propose a set of deep learning features based on a system for automated classification of computed tomography (CT) images to identify COVID-19. Initially, this method was used to prepare a database of three classes: Pneumonia, COVID-19, and Healthy. The dataset consisted of 6000 CT images refined by a hybrid contrast stretching approach. In the next step, two advanced deep learning models (ResNet50 and DarkNet53) were fine-tuned and trained through transfer learning. The features were extracted from the second last feature layer of both models and further optimized using a hybrid optimization approach. For each deep model, the Rao-1 algorithm and the PSO algorithm were combined in the hybrid approach. Later, the selected features were merged using the new minimum parallel distance non-redundant (PMDNR) approach. The final fused vector was finally classified using the extreme machine classifier. The experimental process was carried out on a set of prepared data with an overall accuracy of 95.6%. Comparing the different classification algorithms at the different levels of the features demonstrated the reliability of the proposed framework.
Keywords: COVID19; preprocessing; deep learning; information fusion; firefly algorithm; extreme learning machine
Coronavirus Disease 2019 (COVID-19) is a contagious disease caused by the novel coronavirus, severe acute respiratory syndrome coronavirus 2 (SARS-CoV-2) [1], which was first recognized in Wuhan, China, at the end of 2019 [2]. The COVID-19 pandemic has had a major effect on public health around the world. The symptoms of COVID-19 include fever, headache, shortness of breath, muscle pain, fatigue, and sore throat [3]. Severe outcomes of this disease include organ failure, severe respiratory problems, and death. Approximately 20% of COVID-19 cases become severe, and it has an estimated mortality rate of 3% [4]. This disease is detected by a reverse transcription polymerase chain reaction (RT-PCR) test, but as the RT-PCR test has low sensitivity it is not sufficient for early detection and treatment [5]. As RT-PCR is a time-consuming procedure, the application of artificial intelligence (AI) and deep learning-based systems would save a great deal of time for physicians [6]. As of February 2021, the total number of recorded COVID-19 cases worldwide is 106,440,335, with 2,322,351 deaths. These statistics show that approximately 3.4% of deaths around the entire world are due to COVID-19.
Deep learning has been successfully applied in medical imaging [7–9]. The major areas where medical imaging is applied are in the detection of skin cancer [10], brain tumors [11], stomach cancer [12], lung cancer [13], breast cancer [14], blood cancer [15], and COVID-19 [16,17]. Several techniques have been introduced by computer vision (CV) researchers for early coronavirus recognition using chest X-ray [18] and computed tomography (CT) [19] images, and AI and deep learning models have been applied for accurate classification [20,21]. A system has been designed for prediction and detection of COVID-19 on chest X-rays using deep learning [22]. This method is based on AI and uses the features of a convolution neural network (CNN). In the detection phase, three algorithms are used, i.e., the Autoregressive Integrated Moving Average (ARIMA) method, the Prophet Algorithm (PA), and the Long Short-Term Memory (LSTM) neural network. Many other methods are also discussed in the Related Work section.
Several issues remain that are related to the classification of COVID-19 using CT images. The first is the availability of high-dimensional datasets, as an extensive dataset is always needed to train a deep learning model. The second is the selection of a deep model for feature extraction. Several deep models are available for classification purposes and, therefore, the most useful model must be chosen. The third and most important issue is the existence of redundant and irrelevant features that increase the computational time and affect the accuracy of classification. However, some relevant features that are important for improving accuracy are sometimes discarded during the selection of important features.
Here, we propose a new method based on a set of deep learning models. The main purpose of this work was to allow the selection of optimal features from two pre-trained deep learning models and then combine their information. As mentioned above, important features may also be lost in the selection stage. Therefore, optimal information from the two models is used to fill the gap, which improves the accuracy of classification. In this work, we prepared a database of three classes: Pneumonia, COVID-19, and Healthy. The prepared dataset consisted of a total of 6000 CT images adjusted with two pre-trained deep learning models (ResNet50 and DarkNet53) and trained by transfer learning. Later, the features were extracted from the second last layer called the feature layer. A hybrid optimization method is proposed based on the hybrid Rao-1 algorithm and the PSO algorithm. The features of both deep models were optimized by this hybrid method for the next step. Optimal features were merged using a new approach called Parallel Minimum Distance Non-Redundant (PMDNR).
The rest of the article is organized as follows. Related work is discussed in Section 2. Section 3 presents the proposed methodology with the detailed mathematical formulation. The results and discussion are presented in Section 4. Section 5 presents the conclusion.
In 2020, image processing and CV researchers worked to develop systems for diagnosing and recognizing COVID-19 on CT and X-ray images. These detection systems focused mainly on deep learning to improve efficiency and performance. Apostolopoulos et al. [23] introduced a deep learning-based approach for recognizing COVID-19 on X-ray images. In this method, transfer learning was performed using state-of-the-art CNN models, including VGG-19, Inception ResNet v2, Inception, Xception, and MobileNet v2. The best results were obtained with MobileNet v2, with specificity, accuracy, and sensitivity of 96.46%, 96.78%, and 98.66%, respectively. Ozturk et al. [24] developed a CNN-based automated system for recognizing coronavirus in chest X-ray images, which implemented You Only Look Once (YOLO) and used the DarkNet network for classification to achieve a binary class recognition rate of 98.08%. Ismael et al. [25] presented a CNN approach to recognizing COVID-19 in chest X-ray images. In this approach, different deep learning models were used for feature extraction. The extracted features were then passed to a disease-recognition support vector machine (SVM). The maximum accuracy achieved by this method was 94.7%. Panwar et al. [26] developed a CNN-based technique for the rapid detection of COVID-19 on chest CT and X-ray images. The transfer learning approach was implemented on three different datasets. This technique detected COVID-19 in less than 2 min and produced more accurate results from CT images than the X-ray dataset. A new CNN framework called CoroDet [27] was introduced to recognize COVID-19 on chest X-ray and CT images. The network consisted of 22 layers, and had a recognition rate of 99.1% for binary class classification, 94.2% for three classes, and 91.2% for four classes. Islam et al. [28] presented a CNN-based method for the detection of COVID-19. In this method, the CNN extracted features that were then used to classify the dataset into normal and COVID-19 images using LSTM. This technique achieved an area under the receiver operating characteristic (ROC) curve (AUC) of 99.9%, accuracy of 99.4%, sensitivity of 99.3%, specificity of 99.2%, and F1 score of 98.9%.
A new artificial neural network (ANN), CapsNet [29], was introduced to detect COVID-19 in a chest X-ray image dataset. The network showed recognition accuracies for binary and multi-class classification of 97.24% and 84.22%, respectively. A dual-branch combination network (DCN) [30] was established to detect and diagnose COVID-19 on chest CT. The lesion area was first segmented to obtain more accurate results in the classification phase, and the DCN model achieved an accuracy of 96.74%. Horry et al. [31] used the transfer learning approach to diagnose COVID-19 in ultrasound, X-ray, and CT images. They selected the VGG-19 network to perform transfer learning and made appropriate changes to the parameters to fine-tune the model. The technique showed accuracies of 100%, 86%, and 84% for ultrasound, X-ray, and CT images, respectively. A number of other methods using statistical modeling [32], a cloud-based framework model [33], and machine learning [34] have also been reported, all of which focused on pre-trained models for COVID-19 image classification. However, they focused only on classification accuracy rather than computational time, which is a vital functionality of any computerized method.
The proposed automated set of deep learning methods is presented in this section with the detailed mathematical formulation and visible results. The main flow of the proposed method is shown in Fig. 1. As shown in this figure, the initially collected dataset is processed and the contrast is improved using a hybrid method. Then, two pre-trained models are fine-tuned and trained by transfer learning. Both fine-tuned models are trained in a dataset consisting of three classes: Pneumonia, COVID-19, and Healthy. Features are extracted from these two fine-tuned models and optimized using a hybrid Rao-1 and PSO algorithm. The selected optimum features are blended using a novel approach called Parallel Minimum Distance Non-Redundant (PMDNR). The final fused vector features are classified using an extreme learning machine (ELM) classifier. The details of each step are presented below.
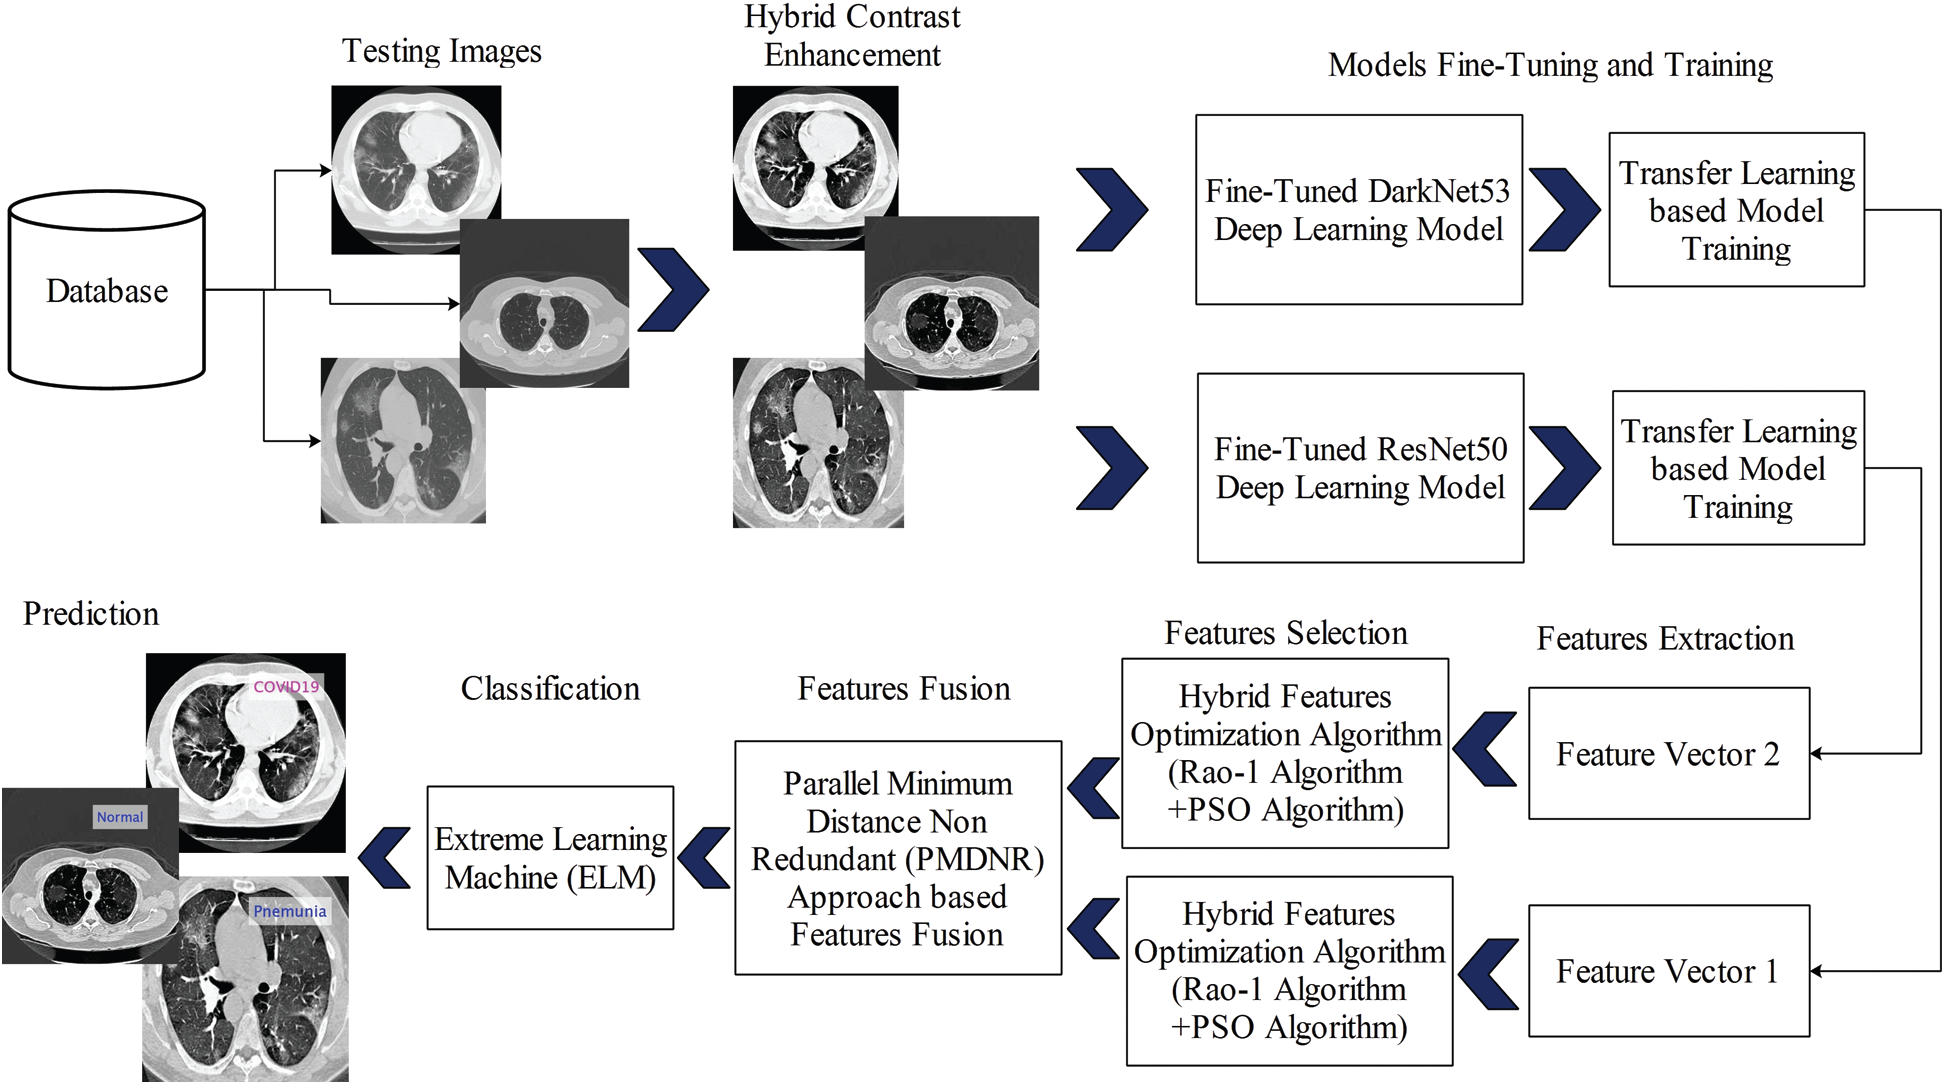
Figure 1: Proposed diagram for COVID19 classification using CT Images based on ensembles of deep learning models
In this work, we collected a dataset from the Radiopaedia Website (https://radiopaedia.org). This website has CT images of more than 100 COVID-19-positive patients. We used the data from the first 80 patients, which included a total of 4000 CT images. Later, we collected 3000 CT images of healthy individuals and 2500 CT images of patients with pneumonia from the same website. Due to the imbalance in numbers between the classes, we performed data augmentation with horizontal flip and vertical flip operations. Mathematically, these flip operations are defined as follows:
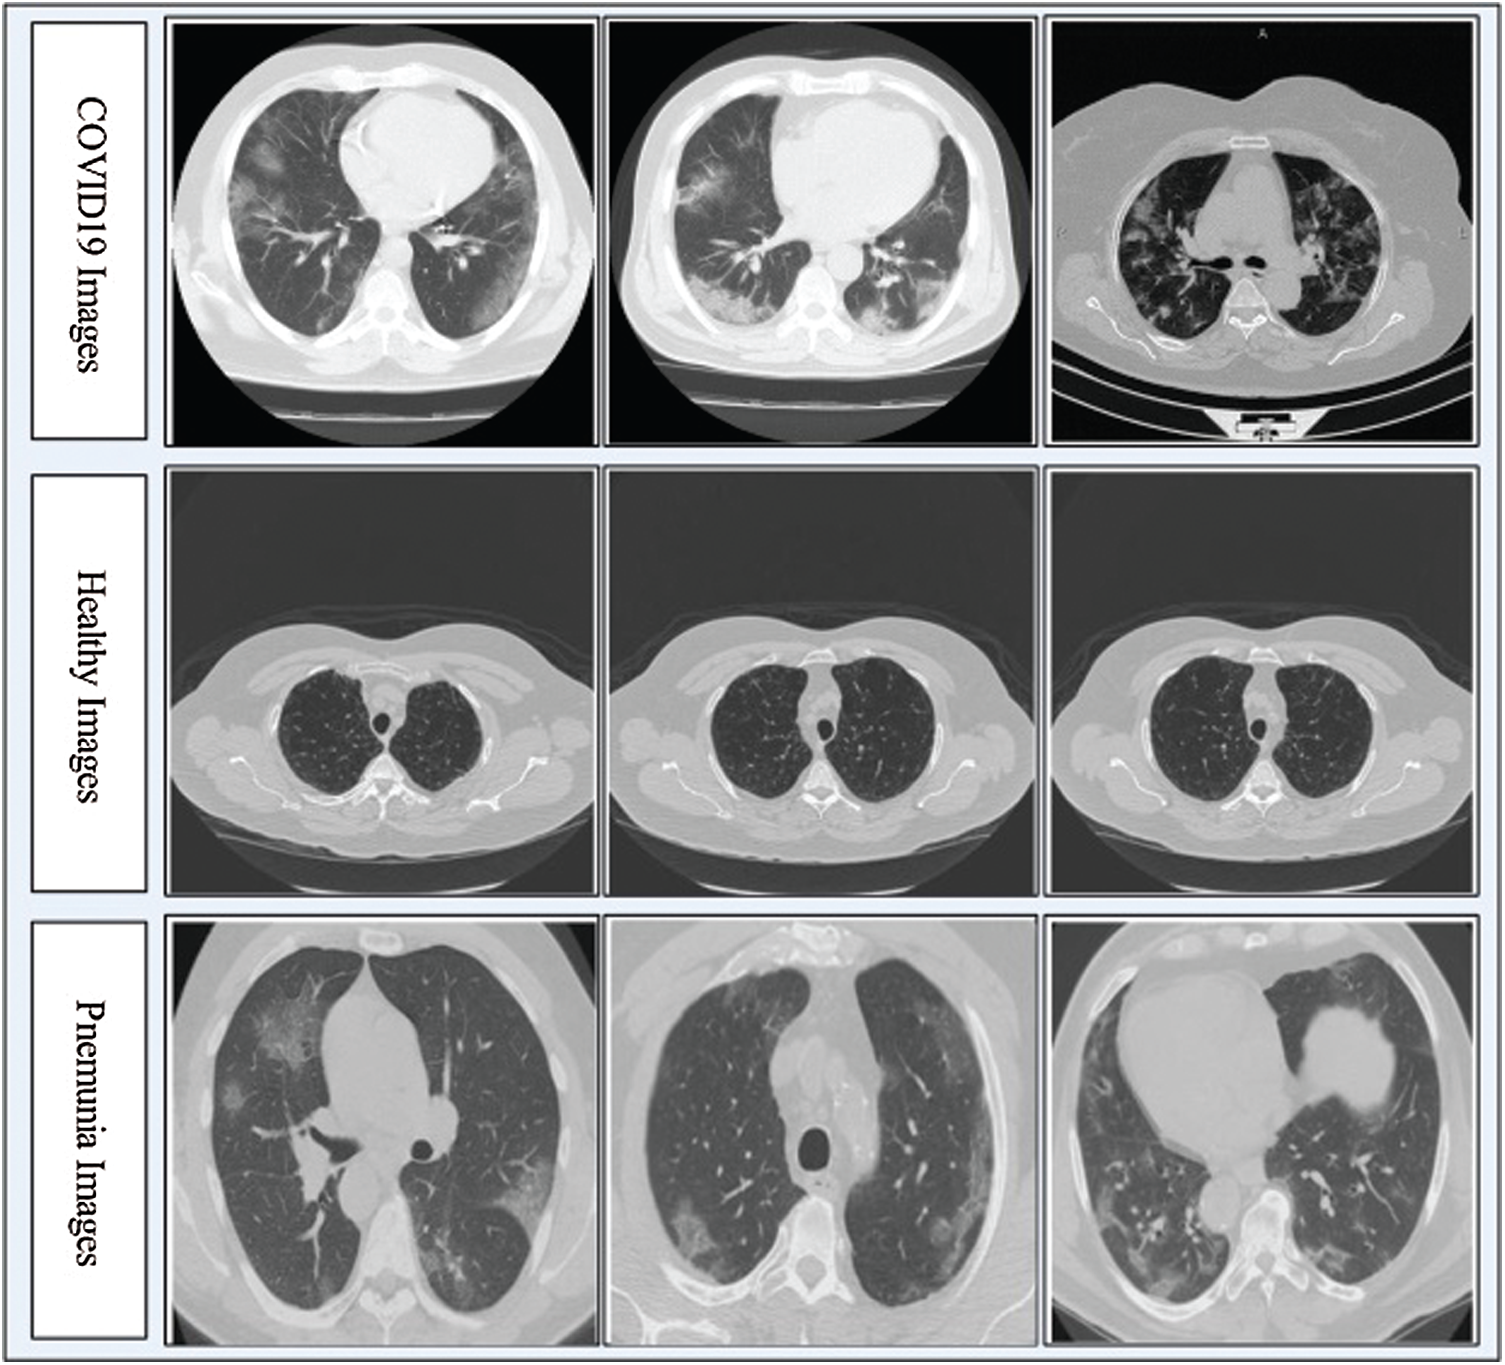
Figure 2: Sample CT images of COVID19, Pneumonia, and Healthy
Contrast enhancement improves the quality of input images for useful feature extraction in the pattern recognition step [35]. Here, we implemented a hybrid approach for CT image contrast enhancement. The main purpose of this step was to show a difference between COVID-19 and Pneumonia images. The hybrid approach is based on a new threshold function defined using closing and opening operations, which are applied on original images with a constant parameter. The constant parameter controls the image pixel values and far from zero.
Consider
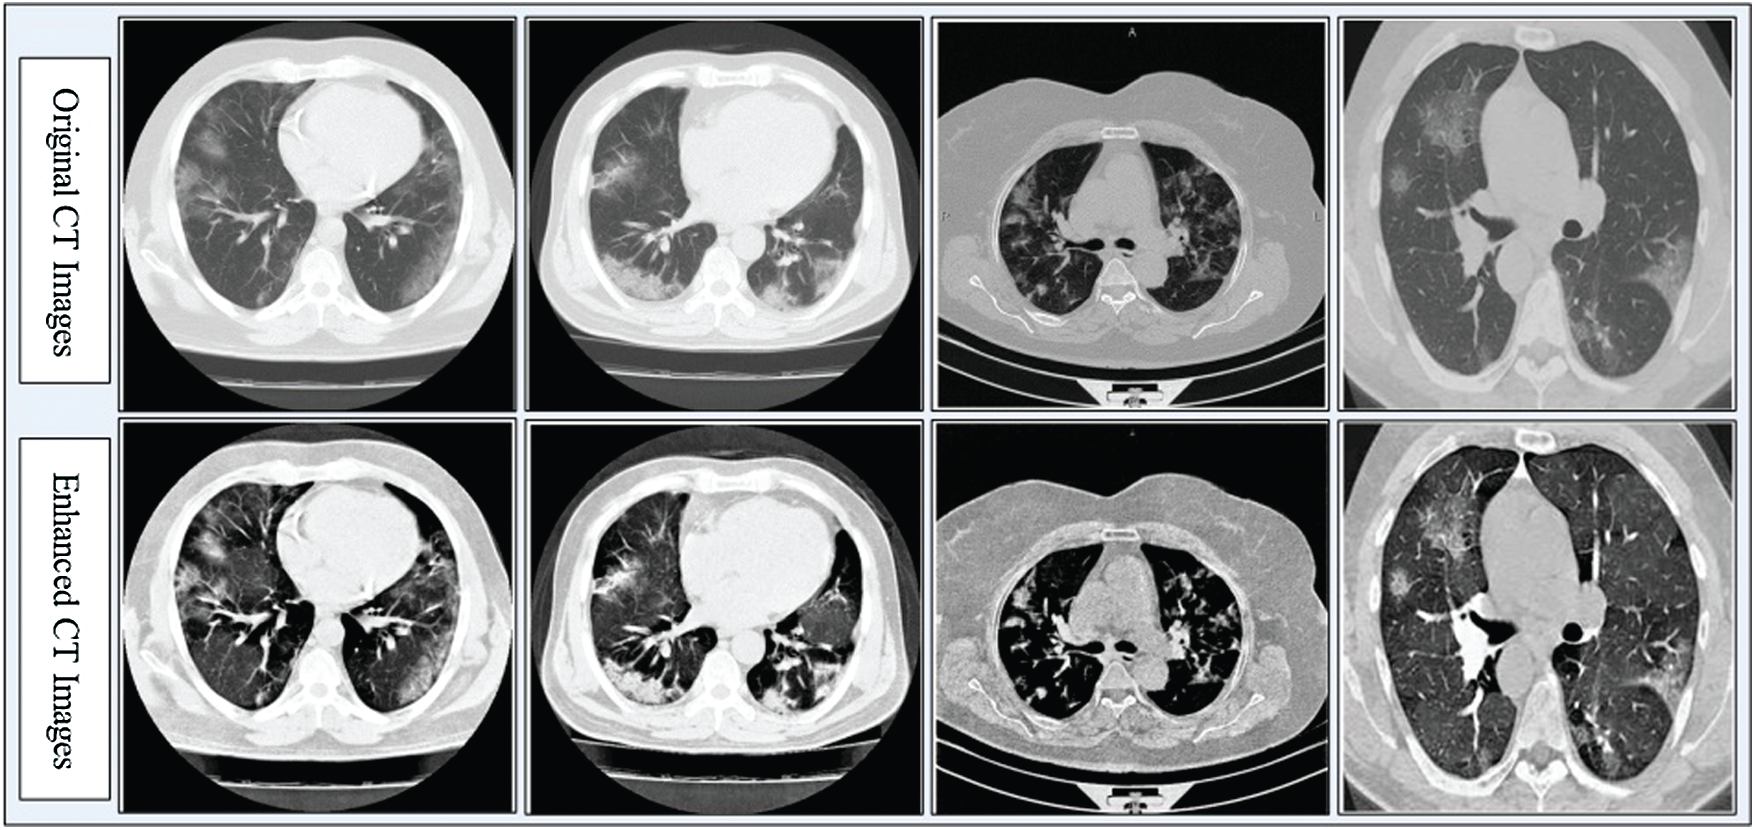
Figure 3: Hybrid contrast enhancement approach results
3.3 Deep Learning Features Extraction
Deep learning has been an important area of machine learning research for the last 5 years [36]. Many deep learning methods have been introduced for classification purposes, such as object classification [37], medical infections, etc. CNN is a type of deep learning, and consists of many intermediate layers, such as the convolutional layer, pooling layers (max pooling and average pooling), ReLu layer for activation, fully connected layer, and Softmax. The convolutional layer extracts the features of input images based on the filter size. The parameters of this layer are filter size, number of channels, and stride. The pooling layers, such as the max pooling layer, can be useful to handle the issue of overfitting. In this layer, the main parameters are filter size and stride. Usually, the filter size is
3.3.1 The Modified Darknet53 Model
The CNN-based model DarkNet53 [38] is utilized to extract deep features. Two deep networks named YOLOv2 DarkNet19 [39] and the deep Residual Network [40] were combined to develop this model. The deep structure of DarkNet53 consists of 53 layers. The convolution layer utilized in this network is
The result of the BN layer is
Here, we fine-tuned this model and removed the last classification layer. A new classification layer was added, which included three instead of 1000 classes. The same weights were used for the fine-tuned model. Later, transfer learning was applied to train this model. The transfer learning process is shown in Fig. 4. As shown in the figure, the feature weights of the original model were transferred to the fine-tuned model. The last features were extracted from the convolutional 53 layers of dimension
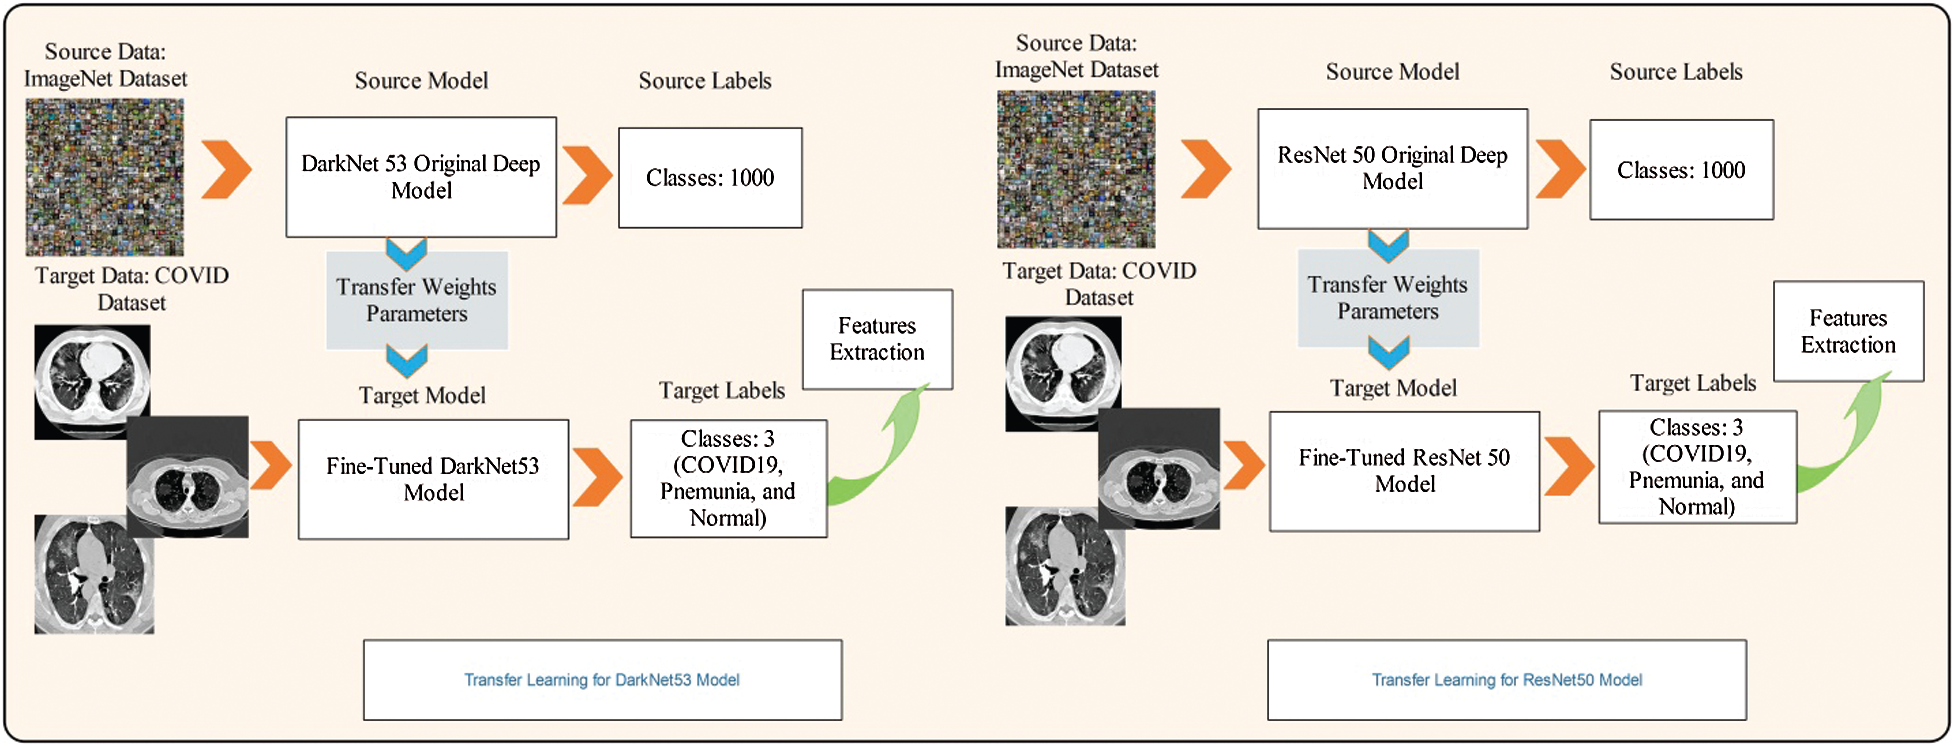
Figure 4: Transfer learning based features extraction
ResNet50 [40] is a 50-layer deep neural network based on residual learning that consists of 16 bottleneck residual blocks. The convolution size for each residual block is
Selection of the best features always helps to achieve faster execution in supervised learning methods. The irrelevant and redundant features mislead the classification accuracy and increase the overall system time [42]. Here, we must deal with both issues of feature redundancy and irrelevant features. Therefore, we proposed a hybrid algorithm based on Rao-1 [43] and PSO [44] to select the most important features. We initially implemented both algorithms separately, identified the correlations among features of both techniques, and selected the most positively correlated features. Finally, the features selected by both approaches were fused using the new PMDNR approach.
Particle Swarm Optimization: This algorithm finds the best possible solution from the given solutions. A swarm is referred to as possible solutions, and each solution is considered a particle. In the search space, each particle set its set and accelerates with some velocity. After each iteration, PSO selected the best solution and changed its position. The new position of the particle is based on previous learning. The evaluation of each particle is measured according to the defined fitness function [45]. At the end of the iterations, PSO produces an optimal solution. Let the search space be N-dimensional with n number of particles or solutions; the N-dimensional vector is denoted by
Rao-1 Algorithm: This algorithm is computationally complex, easy to implement, and to the point. This algorithm solves the optimization problem more efficiently than other metaheuristic algorithms. The search process for finding an optimal solution is based on the best and worst candidate solutions within a random and entire population.
This algorithm first initializes the parameters, such as the number of solutions, design variables, lower and upper bounds, and maximum iterations. Then, the candidate solutions are generated and a fitness function is applied for evaluation. Initially, the fitness function counter and interactions are zero. Based on the fitness values, the best and worst feature values are then identified. In the later stage, the solutions are updated through the following equation:
Hybridization: Consider,
4 Experimental Results and Analysis
This section presents the experimental process. The classification results were computed for several classifiers using a 50:50 approach of training and testing. All classification results were computed using 10-fold validation. In the training process, we used Stochastic Gradient Descent for the learning of fine-tuned models. Moreover, the learning rate was 0.00001, the mini-batch size was 64, and 100 epochs were used. The selected classifiers were ELM, Fine Tree, SVM, fine-KNN, and ensemble trees. The main classifier was ELM, which was used in this work for prediction, while the rest of the classifiers were considered for classification comparison. Each classifier's performance was calculated according to the following measures: sensitivity rate, precision rate, F1-score, accuracy, FNR, and testing time. Time was the most important measure in this work due to the optimization algorithms. All experiments are performed in MATLAB 2020b on a PC with 512 SSD storage, 16 GB RAM, and an 8 GB graphics card.
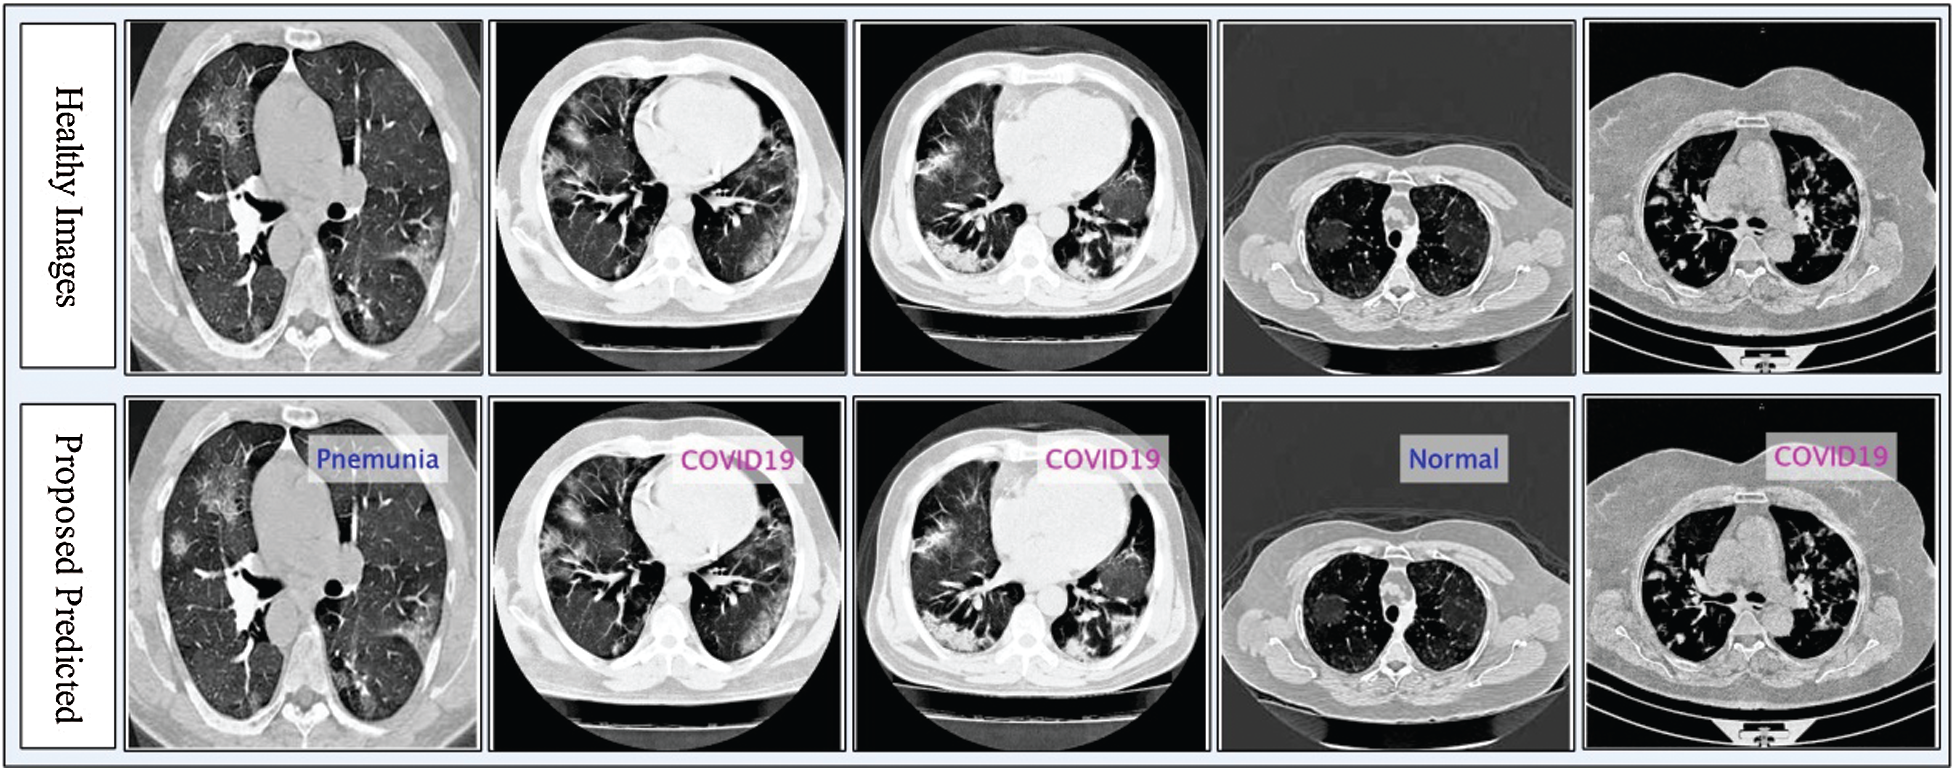
Figure 5: Proposed prediction results in terms of labeled data
4.1 Numerical Results: Experiment 1
The numerical results with accompanying evidence are presented in this section. The results were computed for each step. Tab. 1 presents the classification results after applying a hybrid optimization algorithm on fine-tuned ResNet50 model features. The results shown in this table were calculated for several classifiers using the selected performance measures. The greatest accuracy of this experiment was 92.7% for the ELM classifier. The computed accuracies for the remaining classifiers, i.e., Fine Tree to Softmax, were 86.2%, 84.7%, 83.2%, 90.8%, 90.7%, 91.2%, 91.4%, and 92.1%, respectively. These results indicated that the ELM classifier had the best performance. A number of other measures were also computed to support the performance of ELM; ELM showed sensitivity of 92.67%, precision of 93%, F1-Score of 92.83%, and FNR of 7.33%. To verify the sensitivity of ELM, a confusion matrix was added as shown in Fig. 6. This figure shows that the COVID-19 class correct prediction rate was 94%, and the correct prediction rates for Pneumonia and Normal classes were 96% and 88%, respectively. Thus, the prediction accuracy was best for the Pneumonia class followed by the COVID-19 class. The best time for this experiment was 25.706 s, which was noted during the testing process of all 50% of images, indicating that the hybrid optimization algorithm minimized computational time in real-time testing.
Table 1: Proposed classification results after employing a hybrid optimization algorithm on fine-tuned ResNet50 deep feature vector
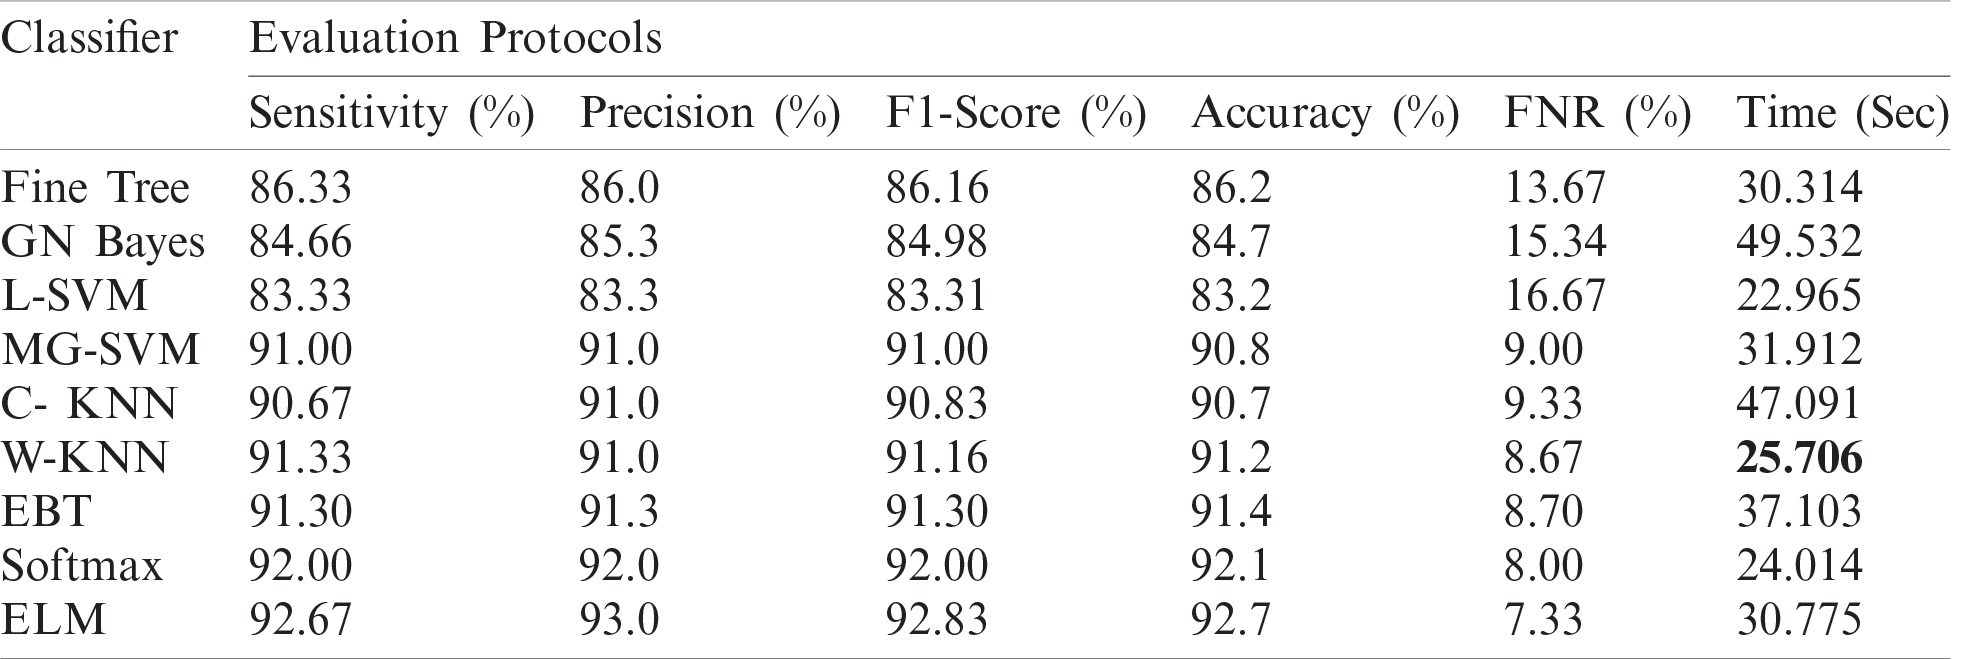
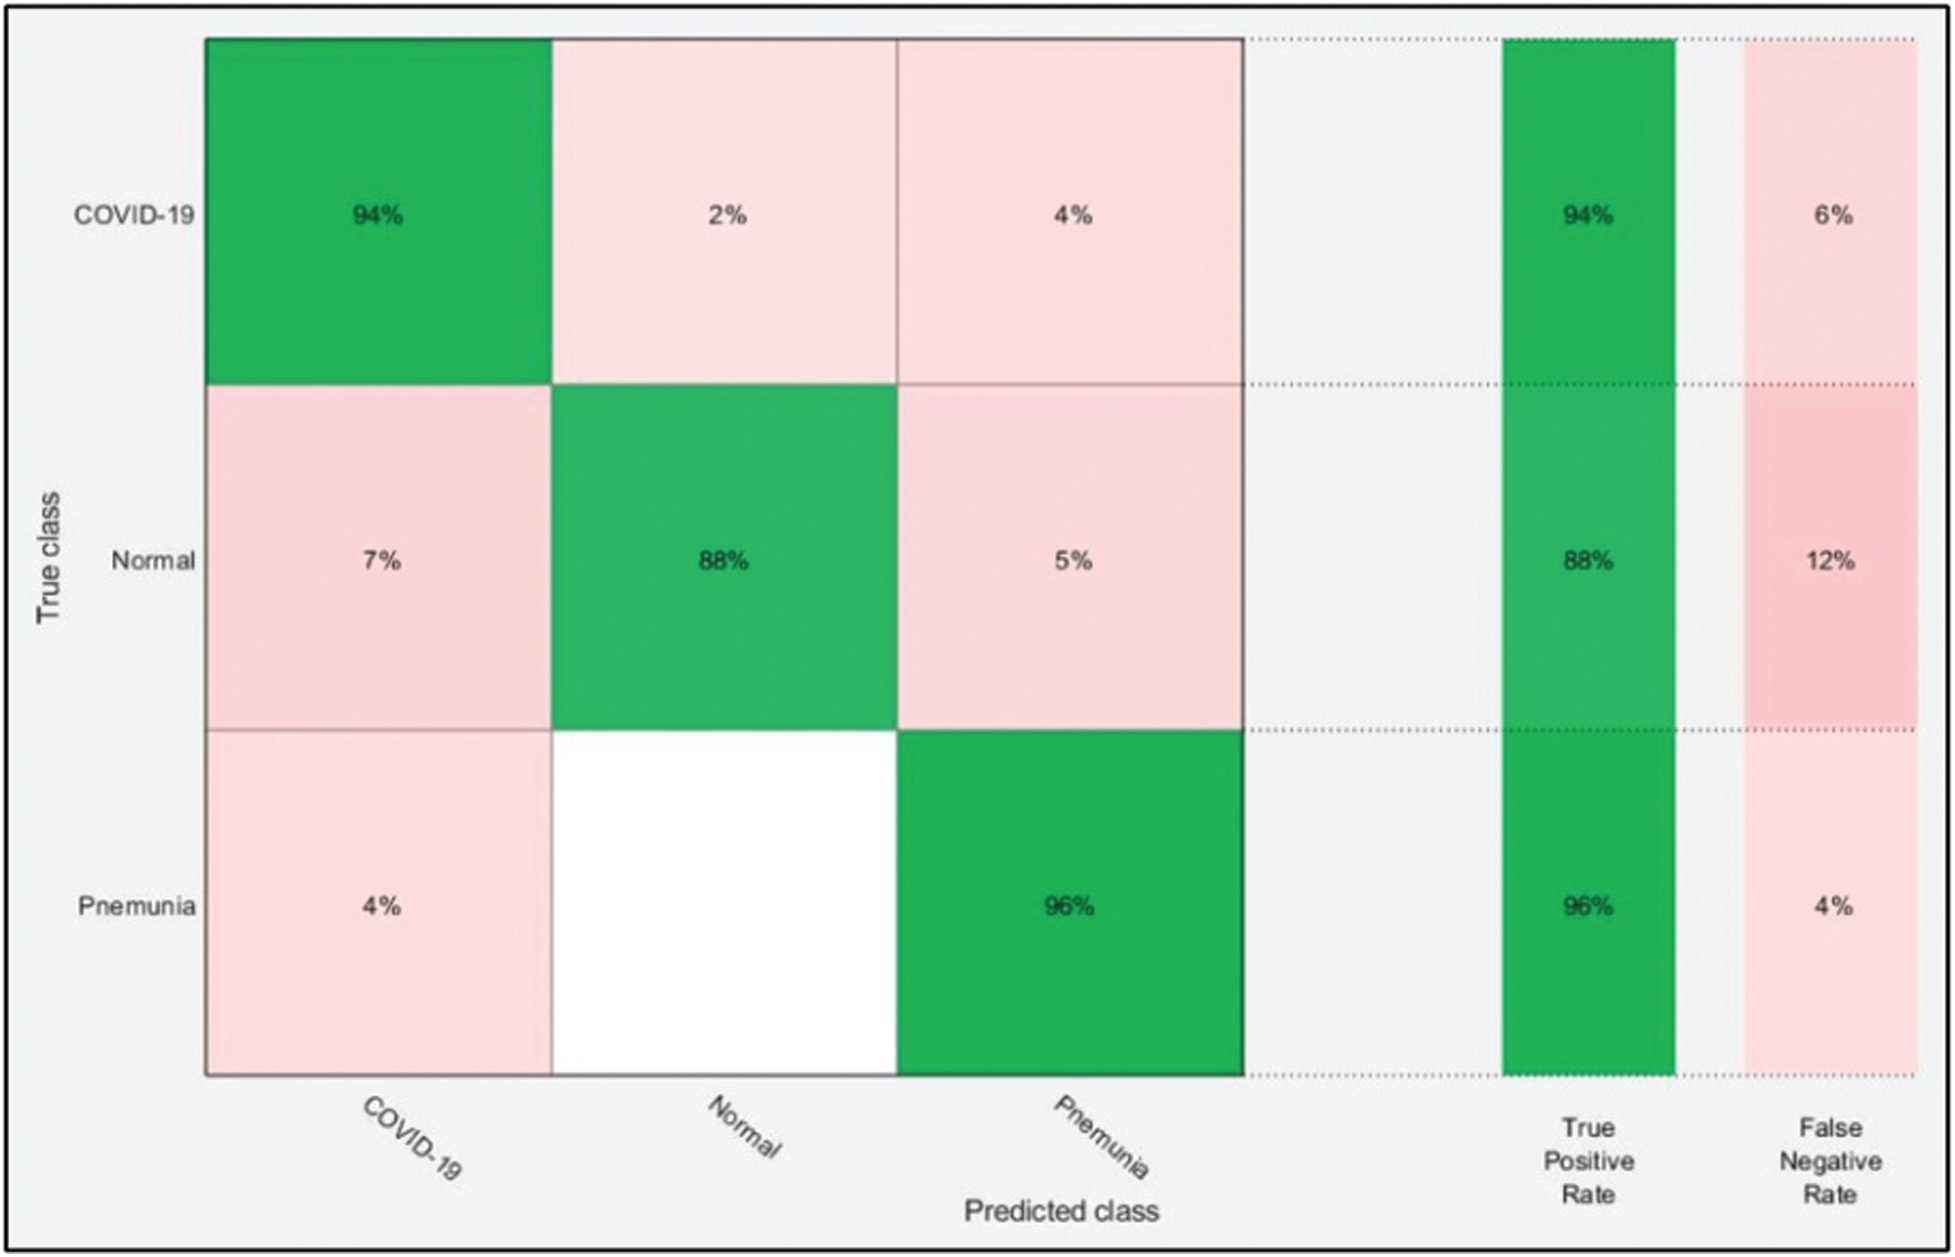
Figure 6: Confusion matrix of ELM for optimal ResNet50 deep learning features
4.2 Numerical Results: Experiment 2
Tab. 2 presents the classification results after applying the hybrid optimization algorithm on fine-tuned DarkNet53 model features. The results shown in this table were calculated for several classifiers using selected performance measures. The ELM classifier showed the highest accuracy of 92.40% in this experiment, which was 0.3% lower than in the experiment shown in Tab. 1. The computed accuracies for the remaining classifiers, i.e., Fine Tree to Softmax, were 87.4%, 88.2%, 90.2%, 90.6%, 91.0%, 90.4%, 91.9%, and 91.6%, respectively. These results indicated that the ELM classifier had the best performance, and that the performance in this experiment was better than that in Tab. 1. A number of other measures were also computed to support the performance of ELM; ELM showed sensitivity of 92.40%, precision of 92.7%, F1-Score of 92.55%, and FNR of 7.66%. To verify the sensitivity of ELM, a confusion matrix was added as shown in Fig. 7. The time was also noted, and the best time for this experiment was 23.927 s showing that the accuracy of the ELM classifier using a hybrid optimized approach for DarkNet features executed faster than ResNet50 features. The performance of optimized DarkNet53 features was also better in comparison to Tab. 1.
Table 2: Proposed classification results after employing a hybrid optimization algorithm on fine-tuned Darknet53 deep feature vector
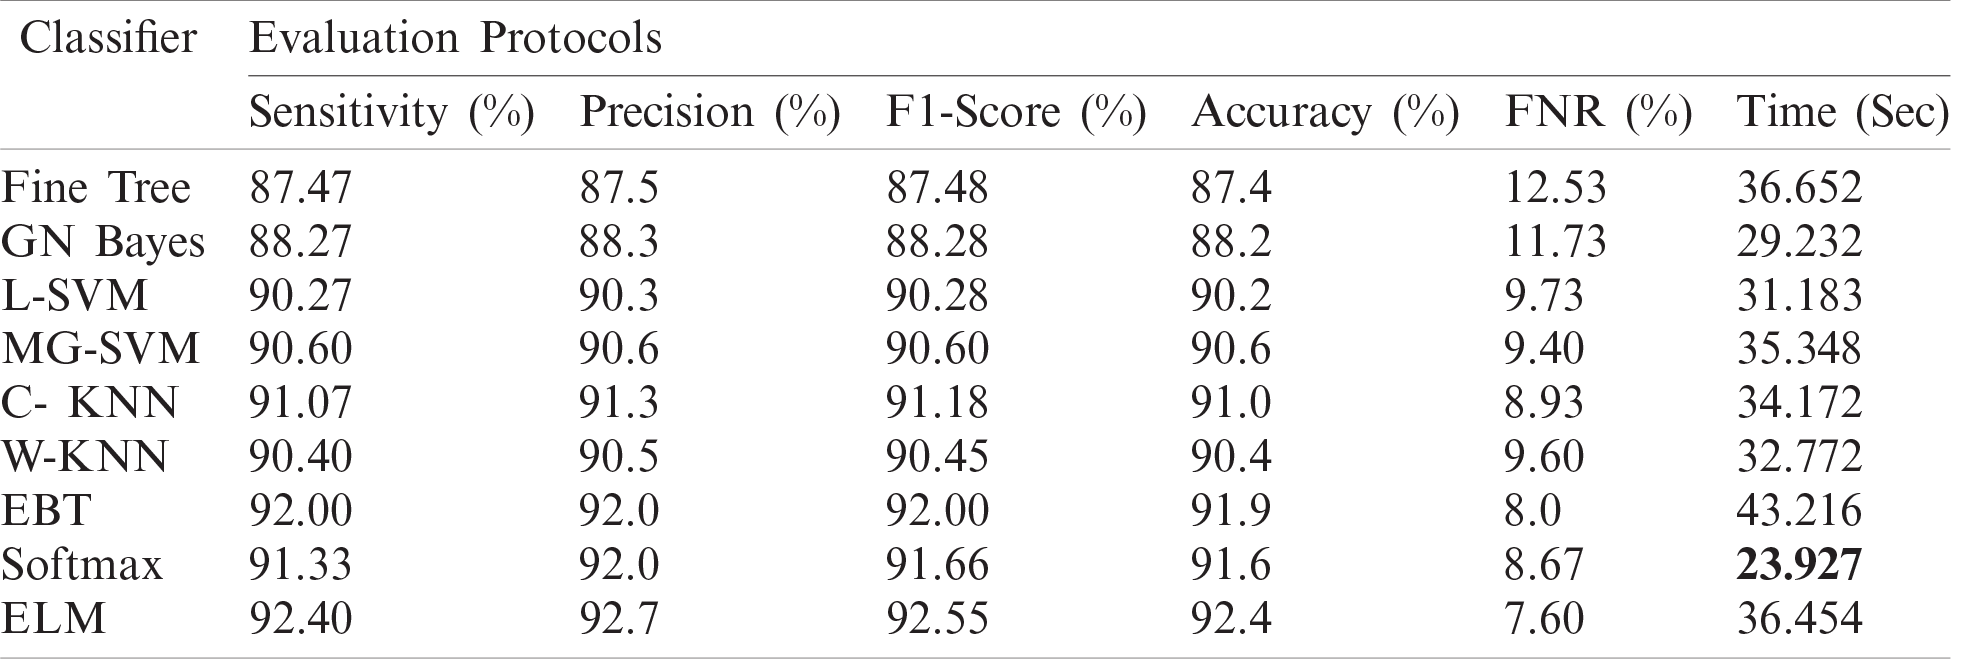
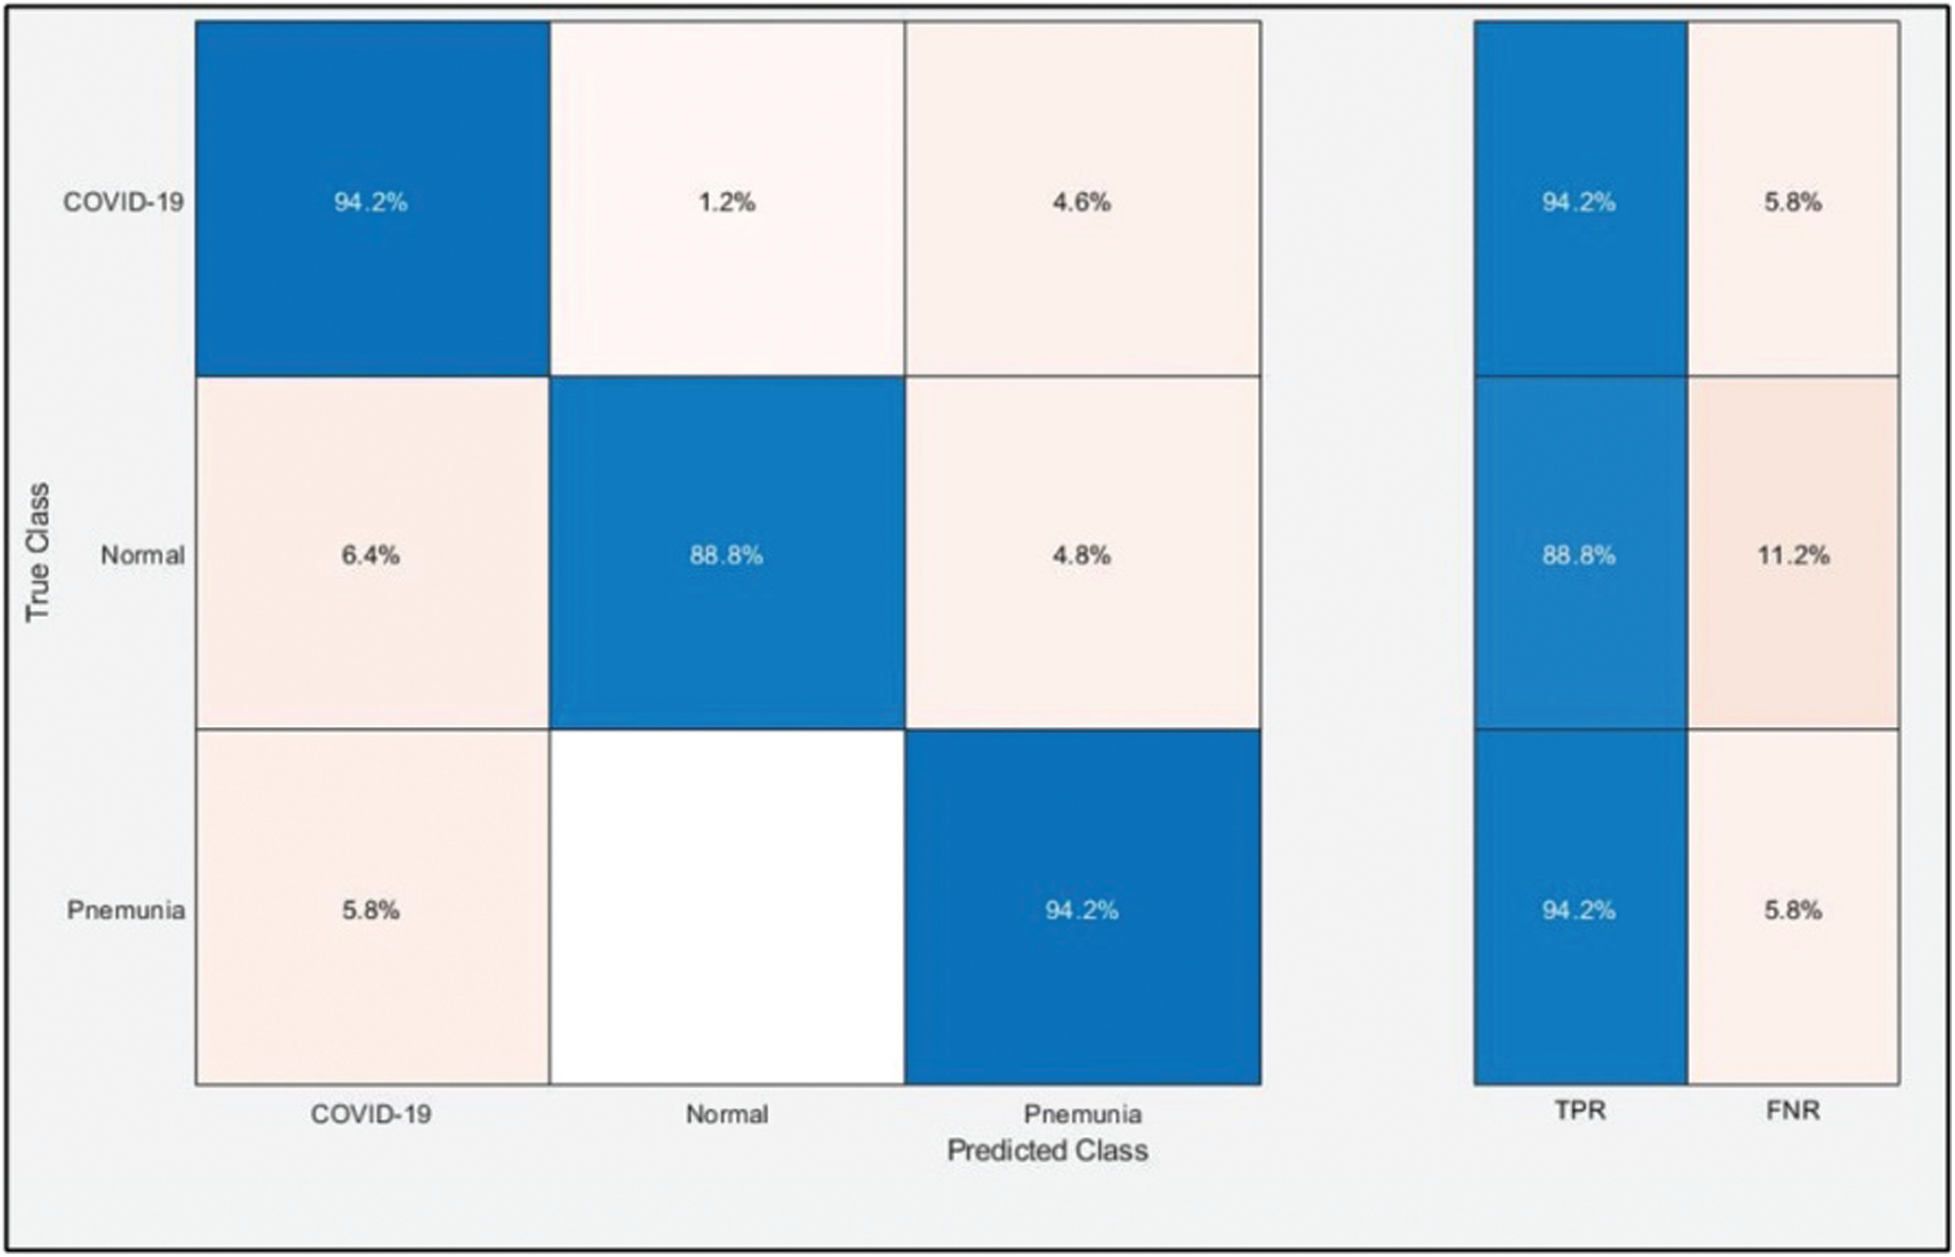
Figure 7: Confusion matrix of ELM for optimal DarkNet53 deep learning features
Table 3: Proposed classification results after ensembles of deep learning models information fusion
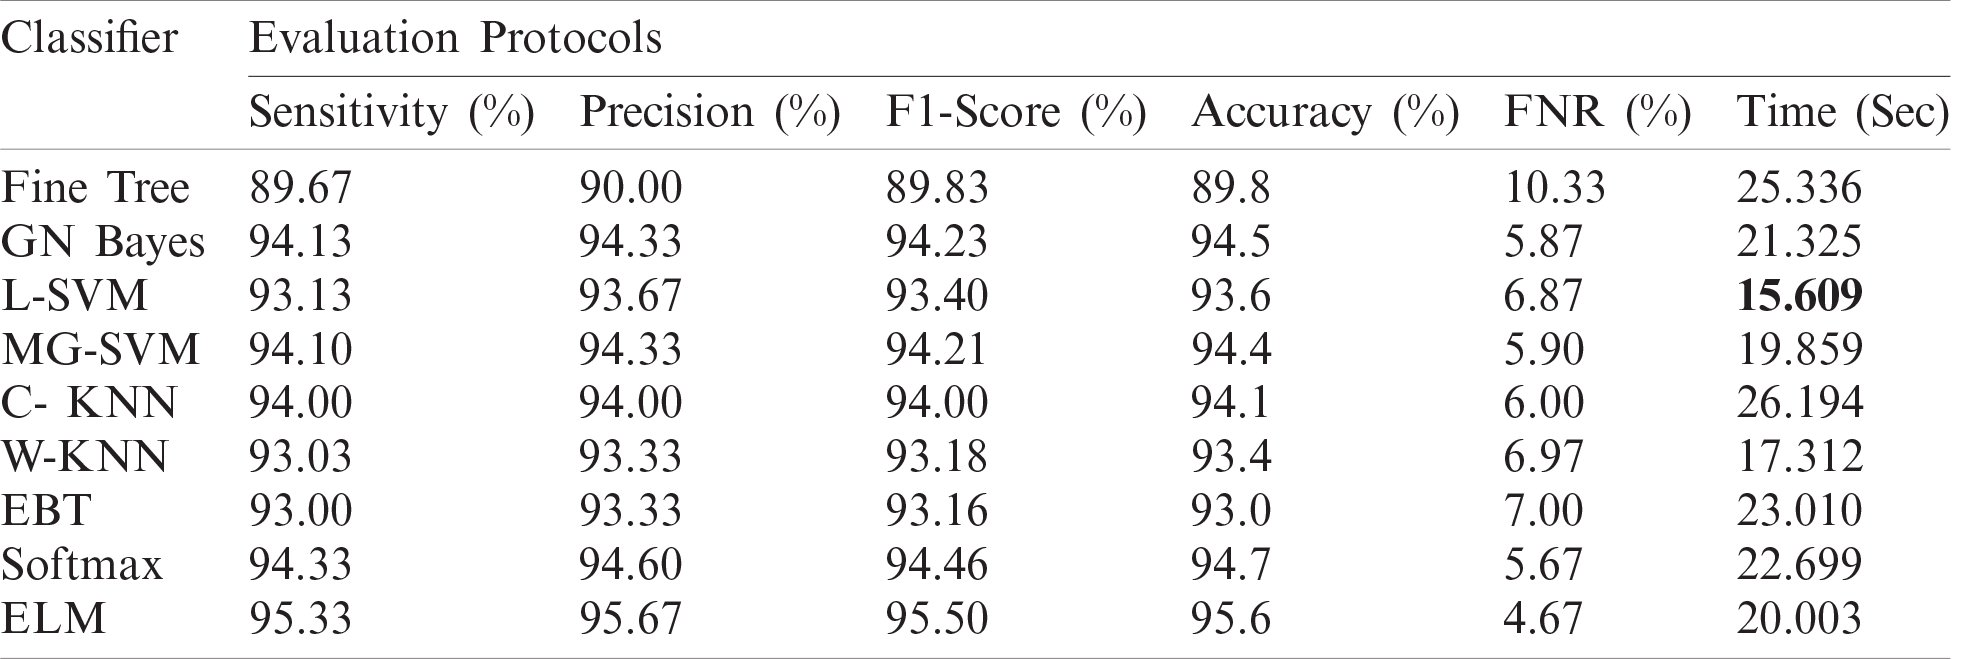
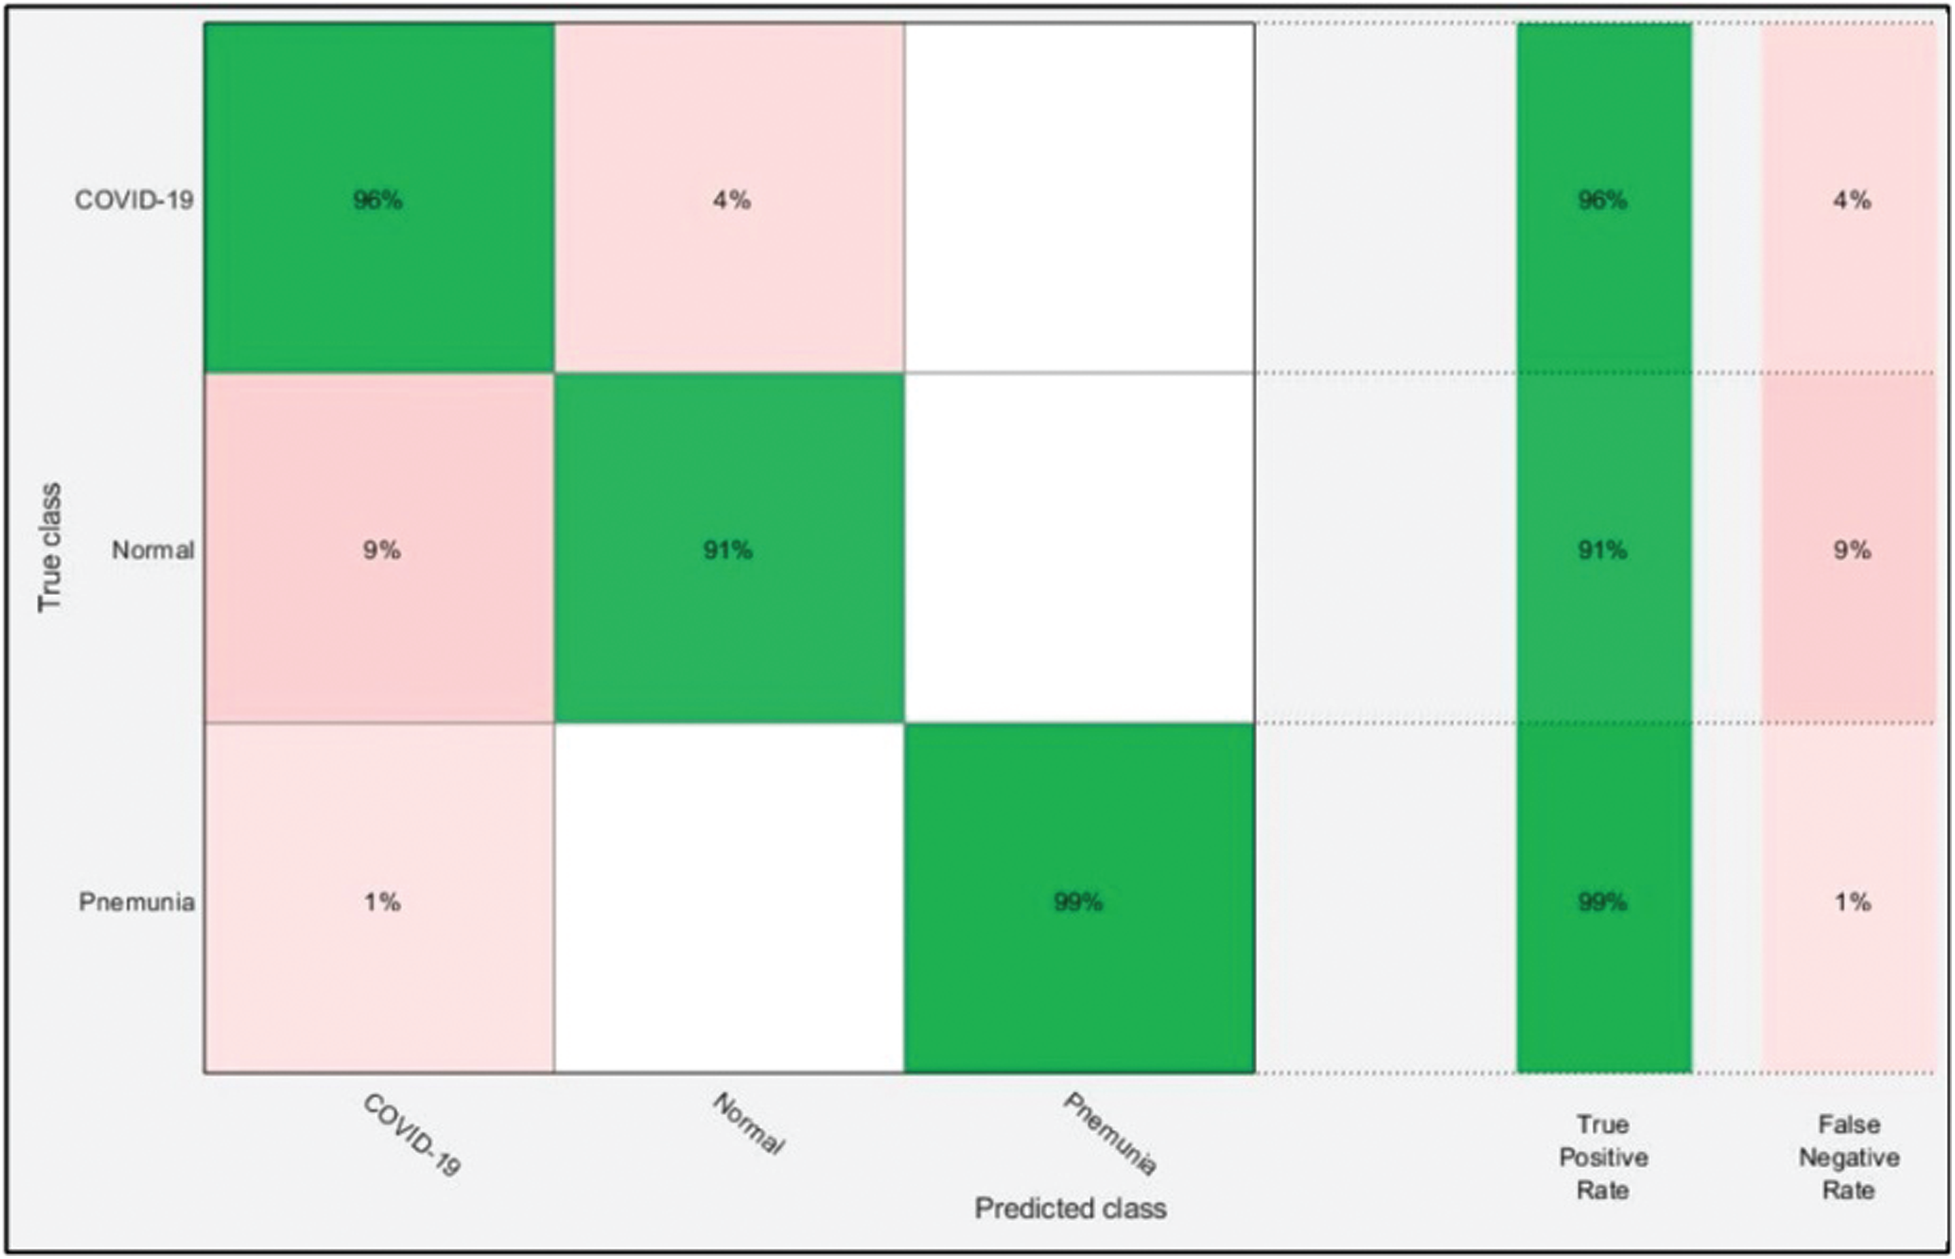
Figure 8: Confusion matrix of ELM after ensembles of deep learning models information fusion
4.3 Numerical Results: Experiment 3
The optimal features of both models were fused using the proposed PMDNR approach, and the results are presented in Tab. 3. The results shown in this table indicated that the highest accuracy achieved was 95.6% for the ELM classifier. The other measures were sensitivity of 95.33%, precision of 95.67%, F1-Score of 95.50%, and FNR of 4.67%. The noted computational time of ELM was 20.003 s, which was less than in Tabs. 1 and 2. In addition, the accuracy of ELM after fusion was improved compared to Tabs. 1 and 2. Fig. 8 shows a confusion matrix, which can be used to verify the sensitivity of ELM. As shown in this figure, the correct prediction rates for Pneumonia and COVID-19 images were 99% and 96%, respectively, representing significant improvements compared to Figs. 6 and 7.
Finally, we discuss the overall experimental process of our proposed framework. Fig. 9 shows the proposed framework accuracy with individual steps. Initially, the results were computed using original ResNet50 (O_Res_F) features and achieved an accuracy of 87.86%. For the original DarkNet53 (O_Drk_F) features, the results accuracy was 85.62%. The results of optimal ResNet50 features were 92.7%, which were improved compared to O_Res_F. Similarly, the results were improved after employing optimal DarkNet53 (Op_Drk_F) and reached 92.4%. The results are illustrated for a proposed framework of accuracy of 95.6%. The proposed framework results demonstrated the significance for classification of COVID-19 on CT images. Similarly, the F1-Score-based comparison was also conducted as shown in Fig. 10. This figure shows that the proposed framework achieved better results on the ELM classifier. A time-based comparison was also conducted shown in Fig. 11, which indicated that the ensembles of deep features executed faster, compared to the ResNet and DarkNet features.
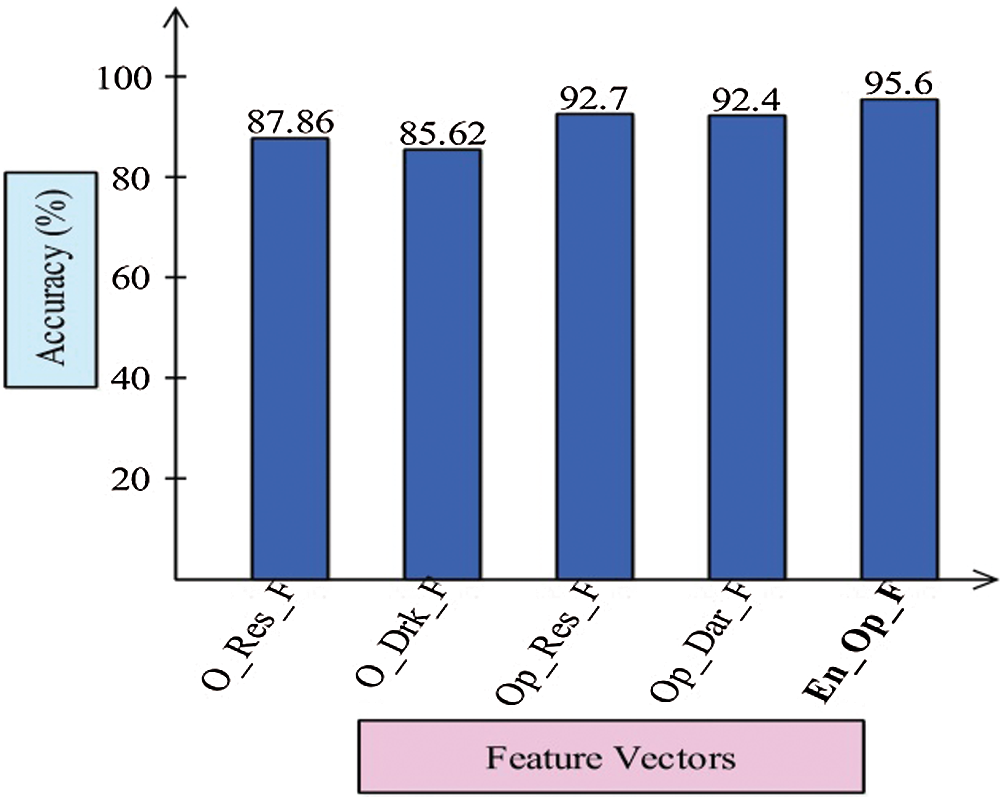
Figure 9: Proposed ensemble method accuracy comparison with individual steps
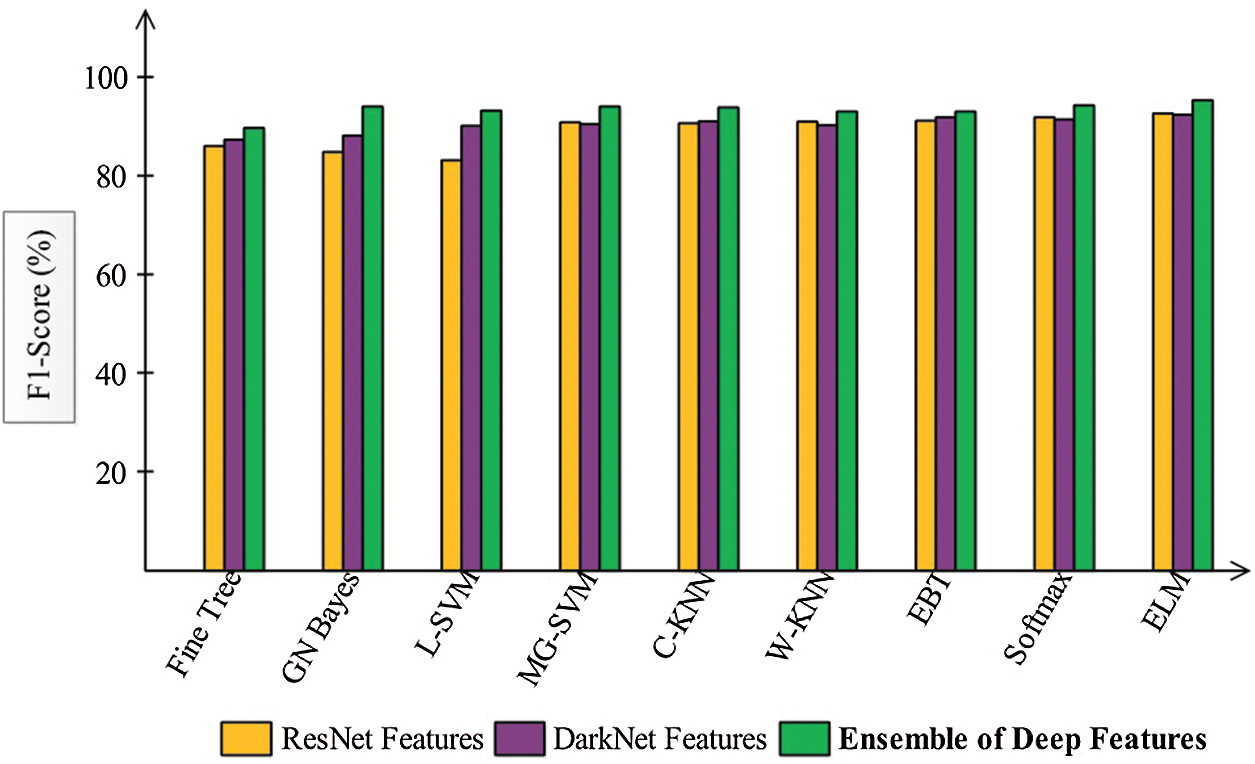
Figure 10: F1-Score based comparison among each step for the selected classifiers
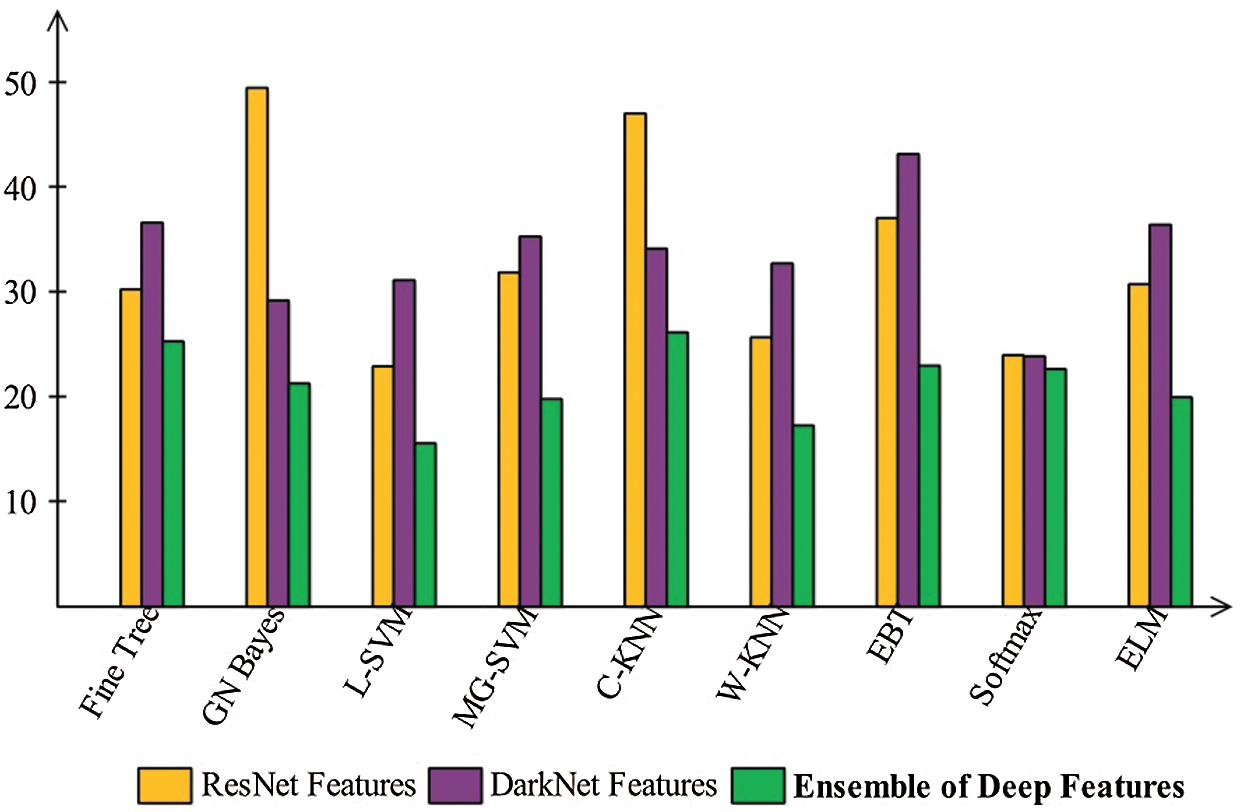
Figure 11: Time plot to compare the performance of each step
To classify COVID-19 CT images, a set of optimal deep learning features based on a computerized framework was presented. This work allowed the selection of the most optimal features using a hybrid algorithm and the fusion of features through the proposed PMDNR approach. Finally, the fused features were classified using an ELM classifier. The results were computed on the prepared database and showed 95.6% accuracy. The results indicated that the proposed method works better with the ELM classifier. Pre-processing of the original images improved the visibility of infected and curative CT images from the results. Use of improved contrast images often allowed the extraction of more useful deep learning features. In addition, optimizing features improved the accuracy of the system and minimized the number of predictors required. With fewer predictors, the procedure was completed quickly, which is helpful for improving the performance of the real-time system. We also concluded that the fusion of features using the proposed approach further impaired accuracy. In future, the features will be extracted through two or three stream networks and fused for more accurate classification accuracy.
Funding Statement: This research was supported by X-mind Corps program of National Research Foundation of Korea (NRF) funded by the Ministry of Science, ICT (No. 2019H1D8A1105622) and the Soonchunhyang University Research Fund.
Conflicts of Interest: The authors declare that they have no conflicts of interest to report regarding the present study.
1. S. B. Stoecklin, P. Rolland, Y. Silue, A. Mailles, C. Campese et al. “First cases of coronavirus disease 2019 (COVID-19) in France: Surveillance, investigations and control measures,” Eurosurveillance, vol. 25, no. 3, pp. 2000094, 2020. [Google Scholar]
2. N. Zhu, D. Zhang, W. Wang, X. Li, B. Yang et al. “A novel coronavirus from patients with pneumonia in China,” New England Journal of Medicine, vol. 4, no. 7, pp. 1–4, 2020. [Google Scholar]
3. T. Singhal, “A review of coronavirus disease-2019 (COVID-19),” Indian Journal of Pediatrics, vol. 6, no. 2, pp. 1–6, 2020. [Google Scholar]
4. C. Wang, P. W. Horby, F. G. Hayden and G. F. Gao, “A novel coronavirus outbreak of global health concern,” Lancet, vol. 395, no. 2, pp. 470–473, 2020. [Google Scholar]
5. T. Ai, Z. Yang, H. Hou, C. Zhan, C. Chen et al. “Correlation of chest CT and RT-pCR testing in coronavirus disease 2019 (COVID-19) in China: A report of 1014 cases,” Radiology, vol. 7, no. 11, pp. 200642, 2020. [Google Scholar]
6. F. M. Salman, S. S. Abu-Naser, E. Alajrami, B. S. Abu-Nasser and B. A. Alashqar, “Covid-19 detection using artificial intelligence,” International Journal of Academic Engineering Research, vol. 4, no. 3, pp. 18–25, 2020. [Google Scholar]
7. A. Mittal, D. Kumar, M. Mittal, T. Saba, I. Abunadi et al. “Detecting pneumonia using convolutions and dynamic capsule routing for chest X-ray images,” Sensors, vol. 20, no. 1, pp. 1068, 2020. [Google Scholar]
8. M. A. Khan, M. S. Sarfraz, M. Alhaisoni, A. A. Albesher, S. Wang et al. “Stomachnet: Optimal deep learning features fusion for stomach abnormalities classification,” IEEE Access, vol. 8, no. 11, pp. 197969–197981, 2020. [Google Scholar]
9. A. Rehman, M. Khan, T. Saba, Z. Mehmood, U. Tariq et al. “Microscopic brain tumor detection and classification using 3D CNN and feature selection architecture,” Microscopy Research and Technique, vol. 5, no. 3, pp. 1–21, 2020. [Google Scholar]
10. S. A. C. Bukhari and R. S. Nayak, “Developed newton-raphson based deep features selection framework for skin lesion recognition,” Pattern Recognition Letters, vol. 129, no. 2, pp. 293–303, 2020. [Google Scholar]
11. M. Alhaisoni, R. Damaševičius and R. Scherer, “Multimodal brain tumor classification using deep learning and robust feature selection: A machine learning application for radiologists,” Diagnostics, vol. 10, pp. 565, 2020. [Google Scholar]
12. M. A. Khan, S. Kadry, M. Alhaisoni, Y. Nam, Y. Zhang et al. “Computer-aided gastrointestinal diseases analysis from wireless capsule endoscopy: A framework of best features selection,” IEEE Access, vol. 8, no. 7, pp. 132850–132859, 2020. [Google Scholar]
13. S. Rubab, A. Kashif, M. I. Sharif and N. Muhammad, “Lungs cancer classification from CT images: An integrated design of contrast based classical features fusion and selection,” Pattern Recognition Letters, vol. 129, pp. 77–85, 2020. [Google Scholar]
14. S. Zahoor, I. U. Lali, M. A. Khan, K. Javed and W. Mehmood, “Breast cancer detection and classification using traditional computer vision techniques: A comprehensive review,” Current Medical Imaging, vol. 7, no. 17, pp. 1–31, 2020. [Google Scholar]
15. H. M. J. Lodhi, M. Nazir, K. Javed and M. Qasim, “Automated design for recognition of blood cells diseases from hematopathology using classical features selection and ELM,” Microscopy Research and Technique, vol. 7, no. 5, pp. 1–19, 2020. [Google Scholar]
16. G. R. Shinde, A. B. Kalamkar, P. N. Mahalle, N. Dey, J. Chaki et al. “Forecasting models for coronavirus disease (COVID-19A survey of the state-of-the-art,” SN Computer Science, vol. 1, no. 3, pp. 1–15, 2020. [Google Scholar]
17. S.-H. Wang, X. Wu, Y.-D. Zhang, C. Tang and X. Zhang, “Diagnosis of COVID-19 by wavelet renyi entropy and three-segment biogeography-based optimization,” International Journal of Computational Intelligence Systems, vol. 13, pp. 1332–1344, 2020. [Google Scholar]
18. Y.-D. Zhang, S. C. Satapathy, S. Liu and G.-R. Li, “A five-layer deep convolutional neural network with stochastic pooling for chest CT-based COVID-19 diagnosis,” Machine Vision and Applications, vol. 32, no. 2, pp. 1–13, 2020. [Google Scholar]
19. Y.-D. Zhang, S. C. Satapathy, L.-Y. Zhu, J. M. Górriz and S.-H. Wang, “A seven-layer convolutional neural network for chest CT based COVID-19 diagnosis using stochastic pooling,” IEEE Sensors Journal, vol. 1, no. 13, pp. 1–9, 2020. [Google Scholar]
20. X. Yu, S. Lu, L. Guo, S.-H. Wang and Y.-D. Zhang, “Resgnet-c: A graph convolutional neural network for detection of COVID-19,” Neurocomputing, vol. 3, pp. 1–18, 2020. [Google Scholar]
21. S.-H. Wang, D. R. Nayak, D. S. Guttery, X. Zhang, and Y.-D. Zhang, “COVID-19 classification by CCSHNet with deep fusion using transfer learning and discriminant correlation analysis,” Information Fusion, vol. 68, pp. 131–148, 2020. [Google Scholar]
22. M. Alazab, A. Awajan, A. Mesleh, A. Abraham, V. Jatana et al. “COVID-19 prediction and detection using deep learning,” International Journal of Computer Information Systems and Industrial Management Applications, vol. 12, no. 26, pp. 168–181, 2020. [Google Scholar]
23. I. D. Apostolopoulos and T. A. Mpesiana, “Covid-19: Automatic detection from x-ray images utilizing transfer learning with convolutional neural networks,” Physical and Engineering Sciences in Medicine, vol. 6, no. 2, pp. 1, 2020. [Google Scholar]
24. T. Ozturk, M. Talo, E. A. Yildirim, U. B. Baloglu, O. Yildirim et al. “Automated detection of COVID-19 cases using deep neural networks with X-ray images,” Computers in Biology and Medicine, vol. 23, pp. 103792, 2020. [Google Scholar]
25. A. M. Ismael and A. Şengür, “Deep learning approaches for COVID-19 detection based on chest X-ray images,” Expert Systems with Applications, vol. 164, pp. 114054, 2020. [Google Scholar]
26. H. Panwar, P. Gupta, M. K. Siddiqui, R. Morales-Menendez, P. Bhardwaj et al. “A deep learning and grad-cAM based color visualization approach for fast detection of COVID-19 cases using chest X-ray and CT-scan images chaos,” Solitons & Fractals, vol. 140, pp. 110190, 2020. [Google Scholar]
27. E. Hussain, M. Hasan, M. A. Rahman, I. Lee, T. Tamanna et al. “Corodet: A deep learning based classification for COVID-19 detection using chest X-ray images chaos,” Solitons & Fractals, vol. 11, pp. 110495, 2020. [Google Scholar]
28. M. Z. Islam, M. M. Islam and A. Asraf, “A combined deep CNN-lSTM network for the detection of novel coronavirus (COVID-19) using X-ray images,” Informatics in Medicine Unlocked, vol. 20, no. 6, pp. 100412, 2020. [Google Scholar]
29. S. Toraman, T. B. Alakus and I. Turkoglu, “Convolutional capsnet: A novel artificial neural network approach to detect COVID-19 disease from X-ray images using capsule networks chaos,” Solitons & Fractals, vol. 140, pp. 110122, 2020. [Google Scholar]
30. K. Gao, J. Su, Z. Jiang, L.-L. Zeng, Z. Feng et al. “Dual-branch combination network (DCNTowards accurate diagnosis and lesion segmentation of COVID-19 using CT images,” Medical Image Analysis, vol. 67, no. 1, pp. 101836, 2020. [Google Scholar]
31. M. J. Horry, S. Chakraborty, M. Paul, A. Ulhaq, B. Pradhan et al. “COVID-19 detection through transfer learning using multimodal imaging data,” IEEE Access, vol. 8, pp. 149808–149824, 2020. [Google Scholar]
32. M. Arora, L. M. Goyal, N. Chintalapudi and M. Mittal, “Factors affecting digital education during COVID-19: a statistical modeling approach,” in 2020 5th Int. Conf. on Computing, Communication and Security (ICCCSPatna, India, pp. 1–5, 2020. [Google Scholar]
33. M. Mittal, G. Battineni, L. M. Goyal, B. Chhetri, S. V. Oberoi et al. “Cloud-based framework to mitigate the impact of COVID-19 on seafarers’ mental health,” International Maritime Health, vol. 71, pp. 213–214, 2020. [Google Scholar]
34. J. K. Sethi and M. Mittal, “Monitoring the impact of air quality on the COVID-19 fatalities in Delhi, India: Using machine learning techniques,” Disaster Medicine and Public Health Preparedness, vol. 8, pp. 1–8, 2020. [Google Scholar]
35. A. Liaqat, M. Sharif, M. Mittal and T. Saba, “Gastric tract infections detection and classification from wireless capsule endoscopy using computer vision techniques: A review,” Current Medical Imaging, vol. 22, pp. 1–31, 2020. [Google Scholar]
36. M. Mittal, L. M. Goyal, S. Kaur, I. Kaur, A. Verma et al., “Deep learning based enhanced tumor segmentation approach for MR brain images,” Applied Soft Computing, vol. 78, pp. 346–354, 2019. [Google Scholar]
37. M. Rashid, M. A. Khan, M. Alhaisoni, S.-H. Wang, S. R. Naqvi et al. “A sustainable deep learning framework for object recognition using multi-layers deep features fusion and selection,” Sustainability, vol. 12, pp. 5037, 2020. [Google Scholar]
38. A. Farhadi and J. Redmon, “Yolov3: An incremental improvement,” Computer Vision and Pattern Recognition, vol. 2, no. 7, pp. 1–6, 2018. [Google Scholar]
39. J. Redmon and A. Farhadi,“YOLO9000: Better, faster, stronger,” in Proc. of the IEEE Conf. on Computer Vision and Pattern Recognition, Honolulu, Hawaii, pp. 7263–7271, 2017. [Google Scholar]
40. K. He, X. Zhang, S. Ren and J. Sun, “Deep residual learning for image recognition,” in Proc. of the IEEE Conf. on Computer Vision and Pattern Recognition, Las Vegas, Nevada, pp. 770–778, 2016. [Google Scholar]
41. J. Deng, W. Dong, R. Socher, L.-J. Li, K. Li et al. “Imagenet: A large-scale hierarchical image database,” in 2009 IEEE Conf. on Computer Vision and Pattern Recognition, Miami, FL, USA, pp. 248–255, 2009. [Google Scholar]
42. N. Naheed, M. Shaheen, S. A. Khan, M. Alawairdhi and M. A. Khan, “Importance of features selection, attributes selection, challenges and future directions for medical imaging data: A review,” Computer Modeling in Engineering & Sciences, vol. 125, no. 3, pp. 314–344, 2020. [Google Scholar]
43. R. V. Rao and R. Pawar, “Constrained design optimization of selected mechanical system components using rao algorithms,” Applied Soft Computing, vol. 89, no. 4, pp. 106141, 2020. [Google Scholar]
44. S. Yadav, A. Ekbal and S. Saha, “Feature selection for entity extraction from multiple biomedical corpora: A PSO-based approach,” Soft Computing, vol. 22, no. 11, pp. 6881–6904, 2018. [Google Scholar]
45. M. Amoozegar and B. Minaei-Bidgoli, “Optimizing multi-objective PSO based feature selection method using a feature elitism mechanism,” Expert Systems with Applications, vol. 113, no. 26, pp. 499–514, 2018. [Google Scholar]
46. G.-B. Huang, X. Ding and H. Zhou, “Optimization method based extreme learning machine for classification,” Neurocomputing, vol. 74, no. 2, pp. 155–163, 2010. [Google Scholar]
 | This work is licensed under a Creative Commons Attribution 4.0 International License, which permits unrestricted use, distribution, and reproduction in any medium, provided the original work is properly cited. |