DOI:10.32604/cmc.2021.016659
| Computers, Materials & Continua DOI:10.32604/cmc.2021.016659 | |
| Article |
Evolution-Based Performance Prediction of Star Cricketers
1Department of Computer Science, National Textile University, Faisalabad, Pakistan
2Faculty of Information and Communication Technology, Universiti Tunku Abdul Rahman, Kampar, 31900, Perak, Malaysia
3Department of Information Technology, College of Computers and Information Technology, Taif University, Taif, 21944, Saudi Arabia
4Department of Information Systems, King Abdulaziz University, Jeddah, Saudi Arabia
*Corresponding Author: Mobashar Rehman. Email: mobashar@utar.edu.my
Received: 07 January 2021; Accepted: 01 March 2021
Abstract: Cricket databases contain rich and useful information to examine and forecasting patterns and trends. This paper predicts Star Cricketers (SCs) from batting and bowling domains by employing supervised machine learning models. With this aim, each player’s performance evolution is retrieved by using effective features that incorporate the standard performance measures of each player and their peers. Prediction is performed by applying Bayesian-rule, function and decision-tree-based models. Experimental evaluations are performed to validate the applicability of the proposed approach. In particular, the impact of the individual features on the prediction of SCs are analyzed. Moreover, the category and model-wise feature evaluations are also conducted. A cross-validation mechanism is applied to validate the performance of our proposed approach which further confirms that the incorporated features are statistically significant. Finally, leading SCs are extracted based on their performance evolution scores and their standings are cross-checked with those provided by the International Cricket Council.
Keywords: Online social databases; cricket; star cricketers; prediction; machine learning
Cricket is the second most crowd-pleasing sport that originated from England and is currently played worldwide [1,2]. Star cricketers (SCs) have the actual ability to make a fortune in their respective domains. Such players, for instance, Sir Don Bradman, Sir Viv Richards, Brian Lara, Sachin Tendulkar, Zaheer Abbas and Muttiah Muralitharan, were known as “game-changers.” Each can be considered a single-man team, as they become the backbone of their teams in critical scenarios and always try to win by exerting maximum effort.
SCs’ experience, playing strategies, pressure handling and match-winning abilities inspire emerging players to follow them as role models [2]. Such mentors can also be employed as team coaches and managers, based on their domain expertise. Although the mere ranking of players based on historical data is insufficient, practical anticipation that highly ranked players will perform similarly in upcoming ventures is essential. Therefore, SC Prediction (SCP) is a practical problem that requires attention from the research community. However, despite the popularity of the game, it still lacks analytics due to either inadequate interest by the research community or ignorance of its regulations and insights. Therefore, this work presents a practical SCP approach to identifying SCs who will continue to perform excellently in upcoming ventures. SCP is performed based on performance evolution, which includes each player’s influential role in wins. Identification of such SCs is vital for the current era of cricket, as it will enable stakeholders to effectively utilize each player’s expertise for winning games. Based on their evolutionary performance, cricketers can be grouped into different categories. Despite a large number of possible classes, a player can be included in four major evolutionary classes based on their performance, as depicted in Fig. 1 [3]. SCs are experienced players whose expertise and incredible performance result in wins for their teams. However, there are no existing criteria for anticipating SCs. Therefore, the identification of SCs is an open issue that has driven us to recognize high-performing stars from the field of cricket.
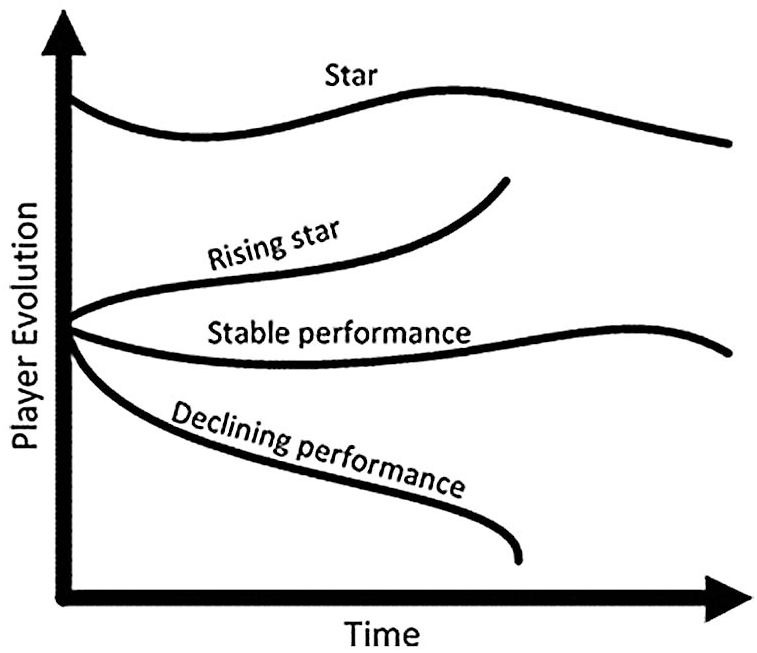
Figure 1: Four different evolution stages of a sports player [3]
With the emergence of online social networks, several researchers have presented proposals on various analytical aspects. Some sports forecasting issues were discussed in [4–12], but the authors neither presented a proper prediction mechanism nor considered cricket. Davis et al. [13] presented a match simulator for evaluating team strength in T20 cricket. In further proposals, network-based approach PR [14] was suggested for team and captain ranking [15], and a study proposed a modified method of team ranking that adopts the h-index and PageRank [16]. However, none of these works presented any method for SCP.
Therefore, this research uses the performance evolution of bowlers and batsmen for SCP. In the presented SCP method, players’ upcoming performance is anticipated by incorporating the early-year performance of players and comparing it with the performance of peers in the same era. In this manner, the playing strategies of cricketers under diverse playing conditions and critical circumstances are examined. To be in a team, a player must be prolific while simultaneously playing with and learning from their teammates. An unproductive player will be considered a failing performer and could be omitted from the team. Therefore, the performance evolution of players can be adopted for SCP. In this research, two categories of features (primary and derived) for batsmen and bowlers are introduced for SCP, and their mathematical notations are presented.
Supervised machine learning (SML) models, namely, Bayesian-rule-, function- and decision-tree-based models, are applied and evaluated for SCP. The results of each machine learning (ML) classifier are assessed based on the following question: H = is the player likely to perform similarly or not? The key contributions of this research are as follows:
a) A method for SCP that incorporates the concept of performance evolution is presented.
b) Different SML classifiers are analysed for binary classification of SCs.
c) A ranking of leading SCs is presented and validated against the International Cricket Council (ICC) ranking of cricketers.
The first steps toward ranking were taken by Li et al. [10] using Pub Rank. The authors proposed the use of out-links instead of in-links of participating nodes. The mutual influence, track record and chronological changes in a citation network were incorporated. However, the publication venue worth and co-authors’ citation standings were not included. Callaghan et al. [8] presented a mechanism that will determine the scientific impact of new papers. The authors found that the first three years of statistics of the author, paper and venue determine the future impact of research entities. Daud et al. [12] employed several features for rising star prediction (RSP) in citation networks. Among the incorporated features, venue-based features were found to be the most effective for RSP. However, the authors did not include the academic and social network worth. In a different domain, Le et al. [9] mined RSs from an online question-answering forum. The authors used data from the Stack Overflow forum. The personal features category outperformed the others, and random forest (RF) performed the best for their scenario. Panagopoulos et al. [6] recently adopted unsupervised ML to extract rising research groups in citation networks. However, none of the previously presented proposals provided a star prediction method for cricket.
Some works presented efficient methods for ranking teams and finding experts from teams. Recently, the popularity of this field has attracted social networking analysts from the scholastic community. Croucher [17] developed an efficient and elaborate batting index composed of the product of the batting average and the strike rate [16]. Using a parallel foundation, Van Staden [18] suggested graphical presentations for a comparative analysis of players’ performance. Manage and Scariano utilized IPL data and employed principal component analysis for reducing the batting and bowling dimensions to provide player rankings [19]. Lemmer [20] developed a statistical measure to estimate individual performance using a limited over-match dataset. Bracewell and Ruggiero incorporated a parametric control chart to monitor cricket batsmen in different matches [21]. The proposal of Amin et al. [22] includes an ordered weighted averaging method joined with a regression structure to identify the performance of, and rank, cricket batsmen. However, their batsman ranking is only based on a commonly used measure, namely, the strike rate. Daud et al. [23] incorporated intertype links, including batsman-to-bowler and player-to-team links, for a region-wise ranking of cricket players. More precisely, the better the performance of a batsman (bowler) against the top bowler (batsman) of a strong team, the better the rank of the batsman (bowler).
Published literature regarding team ratings, result prediction and evaluation are also available, such as [3,13,15,16,18,19,24]. The Bayesian approach was employed by De Silva et al. for the evaluation of ODI team strength. The authors proposed and well incorporated the role of the first or second batting and home-ground advantage and predicted the win of an ODI team. Allsopp and Clarke also suggested a similar approach; they evaluated the team strength in test matches by employing the least-squares estimation method instead of the Bayesian approach [24]. A similar work proposed a match simulator to predict T20 team strengths [13]. Through this match simulator, the outcome of a T20 team can be predicted by providing a specific line-up of teams. Despite such analytics in the game of cricket, none of these approaches can predict SCs. Therefore, this research proposes an effective method of addressing this gap in cricket research.
The ICC regularly publishes team rankings by evaluating the performance of each player. Their performance against that of their opponents affects their rating. The ICC further utilizes these points over a timespan to rank players and teams. Some fundamental metrics are used to establish rankings for batsmen, including runs (score of a batsman), strike rate (average number of runs scored by a particular batsman per 100 balls faced) and batting average (number of runs scored by a batsman divided by the number of times they have been out). Other metrics are also evaluated for batting ratings, including 100, 50, 6, 4s and the most runs in one inning. Likewise, the evaluation metrics for ranking bowlers include the bowling strike rate (number of deliveries bowled by the bowler divided by the number of wickets taken), bowling average (the number of runs conceded divided by the number of wickets taken), bowling economy (average number of runs conceded per over bowled) and best bowling (largest number of wickets taken in an innings). The following metrics are also used to evaluate bowlers: four wickets in an innings, five wickets in an innings and maiden overs bowled. In the proposed SCP method, these metrics are incorporated for feature generation.
Consider a set of tuples with n training examples (X1, yi), (X2, yi),…, (Xn, yi) }, where Xi denotes the feature vector of cricketer Ci; Xi ∈ Rm, Rm and n present the real feature space, a total count of features and a total count of underlying cricketers, respectively; yi ∈ SC, Not SC }. The prediction function PSC for SCP is defined as follows [12]:
where
The objective of SCP is to learn whether a cricketer will become a star after time ∆t. The predictive function PSC should be computed as follows:
This work incorporates various classes of SML models, namely, (1) function-based models, including simple logistic (SL) [25] and support vector machine (SVM) [26]; (2) decision-tree-based models, including RF [27] and classification and regression tree (CART) [28]; and (3) Bayesian-rule-based models, including Bayesian network (BN) [29] and naïve Bayesian (NB) [30]. Neural networks that may perform better classification require extensive datasets, which involve thousands of instances. There are only a few players in our scenario and therefore a limited number of instances; thus, it is not feasible to incorporate neural networks. In both datasets of each domain, 10-fold cross-validation is performed to train and test the SML models. To check the correctness of binary classification, precision (Eq. (4)), recall (Eq. (5)) and F-measure (Eq. (6)) are employed as evaluation metrics, as suggested in the literature [3,12]. The F-measure, which is an inclusive measure, is adopted for the evaluation of SCP.
6.1 Batsman Performance Evaluation Metrics
For analyzing the Batsman Performance Evolution (BPE), a set of eight features is proposed in this work: Batting Strike Rate Evolution (BSRE), Batting Average Evolution (BAE), Highest Runs Evolution (HRE), 4 Runs Evolution (4RE), 6 Runs Evolution (6RE), 50 Runs Evolution (50RE), 100 Runs Evolution (100RE) and 0 Run Evolution (0RE). The mathematical equations of the proposed features for BPE (Eqs. (7)–(14)) are formulated under each feature description.
The BAE of a batsman is a quantifiable measure computed by incorporating the batting average of each peer p who played innings in the same year. The BAE of a batsman i for each year is the ratio score. For a single year, a greater ratio score indicates a better BAE for a batsman.
where BAi refers to the batting average of player i, Avg(BAp) indicates an average of the batting average of the peer batsmen p, and SD(BAp) denotes the standard deviation of the batting averages of the peers. The multiplication term |inn| is incorporated to give the batsman the advantage of maintaining the average for the number of innings played during the given year.
The BSRE of batsman i for every year is computed by integrating the batting strike rate of each peer p who played innings in the same year.
where BSRi refers to the batting strike rate of player i, Avg(BSRp) indicates the average batting strike rate of the peer batsmen p, and SD(BSRp) denotes the standard deviation of the batting strike rate of the peers. The multiplication term |inn| is added to give the batsman the advantage of maintaining the strike rate for the number of innings played during the underlying year.
The HRE of batsman i for every year is acquired by incorporating the highest runs of each peer p who played innings in the same year.
where HRi refers to the highest runs of player i in a single inning, Avg(HRp) indicates the average of the highest runs of the peer batsmen p, and SD(HRp) denotes the standard deviation of the highest runs of the peers for the studied year.
The 50RE of batsman i for every year is computed by integrating the 50 runs made by each peer p who played innings in the same year.
where |50Ri| refers to the number of times player i made 50 runs, Avg(|50Rp|) indicates the average count of the 50 runs made by the peer batsmen p, and SD(|50Rp|) denotes the standard deviation of times the peers made 50 runs during the given year.
The 100RE of batsman i for every year is acquired by incorporating the 100 runs made by each peer p who played innings in the same year.
where |100Ri| refers to the number of times player i made 100 runs, Avg(|100Rp|) indicates the average of the 100 runs made by the peer batsmen p, and SD(|100Rp| denotes the standard deviation of the number of times the peers made 100 runs during the underlying year.
The 4RE of a batsman i for every year is computed by integrating the number of 4 runs made by each peer p who played innings in the same year.
where |4Ri| refers to the number of times player i made 4 runs, Avg(|4Rp|) indicates the average of the 4 runs made by the peer batsmen p, and SD(|4Rp|) denotes the standard deviation of the number of 4 runs made by the peers during the studied year.
The 6RE of a player i for every year is acquired by incorporating the number of 100 runs made by each peer p who played innings in the same year.
where |6Ri| refers to the number of times player i made 6 runs, Avg(|6Rp|) indicates the average of the 6 runs hit by the peer batsmen p, and SD(|6Rp|) denotes the standard deviation of the count of the 6 runs scored by the peers during the given year.
The 0RE of batsman i for every year is computed by integrating the number of ducks made by each peer p who played innings in the same year.
where |0Ri| refers to the number of times batsman i got out for 0, Avg(|0Rp|) indicates the average count of ducks of the peer batsmen p, and SD(|0Rp|) denotes the standard deviation of the number of ducks of the peers during the underlying year.
6.2 Bowler Performance Evolution Metrics
The presented bowler performance evolution (BoPE) incorporates seven effectively designed features to predict SCs from the bowling domain. These features include bowling strike rate evolution (BoSRE), bowling average evolution (BoAE), bowling economy evolution (BoEE), maiden overs evolution (MOE), 4 wickets evolution (4WE), 5 wickets evolution (5WE) and best bowling evolution (BBoE). Unlike batting features, most bowling features negatively correlate with the bowler’s performance. For instance, a high bowling strike rate, bowling economy, bowling average and best bowling in single innings values depict poor performance. Therefore, the features for BoPE are accordingly designed in consideration of this aspect. The following subsection explains the development of these features, along with their mathematical formulations (Eqs. (15)–(21)).
The BoAE of a bowler is a quantifiable score computed for each year by incorporating the bowling average of each peer p who bowled in innings during the same year.
where BoAi refers to the bowling average of player i, Avg(BoAp) indicates the average of the bowling averages of the peer bowlers’ p, and SD(BoAp) denotes the standard deviation of the bowling averages of the peers. The multiplication term |inn| is incorporated to give the bowler the advantage of maintaining the average for the number of innings played during the given year.
The BoSRE of bowler i for every year is a quantitative score acquired by integrating the bowling strike rate of each peer p who bowled in innings during the same year.
where BoSRi refers to the bowling strike rate of player i, Avg(BoSRp) indicates the average bowling strike rates of the peer bowlers’ p, and SD(BoAp) denotes the standard deviation of the bowling strike rates of the peers. The multiplication term |inn| is added to give the bowler the advantage of maintaining the average for the number of innings played during the underlying year.
The BoEE of bowler i is a quantitative score acquired for each year by incorporating the bowling economy of each peer p who bowled in innings during the same year.
where BoEi refers to the bowling economy of bowler i, Avg(BoEp) indicates the average bowling economies of the peer bowlers’ p, and SD(BoEp) denotes the standard deviation of the bowling economies of the peers. The multiplication term |inn| is incorporated to give the bowler the advantage of maintaining the average for the number of innings played during the studied year.
The BBoE of bowler i is a quantifiable score computed for each year by integrating the best bowling of each peer p in a single innings during the same year.
where BBoi refers to the best bowling of bowler i in a single inning, Avg(BBop) indicates the average best bowling of the peer bowlers p in a single inning, and SD(BBop) denotes the standard deviation of the best bowling in a single innings by the peers for the given year.
The MOE of bowler i is a quantitative score acquired for each year by incorporating the maiden overs bowled by each peer p who bowled in innings during the same year.
where |MOi| refers to the number of maiden overs by bowler i, Avg(|MOp|) indicates the average count of maiden overs by the peer bowlers’ p, and SD(|MOp|) denotes the standard deviation of the number of maiden overs by the other bowlers for the underlying year.
The 4WE of bowler i is a quantifiable score extracted for each playing year by integrating the number of 4 wickets taken by each peer p who bowled in innings during the same year.
where |4Wi| refers to the number of times bowler i took 4 wickets, Avg(|4Wp|) indicates the average count of 4 wickets taken by the peer bowlers’ p, and SD(|4Wp|) denotes the standard deviation of the count of 4 wickets taken by the peers for the studied year.
The 5WE of bowler i is a quantitative score acquired for each year by incorporating the 5-wicket hauls by each peer p who bowled in innings during the same year.
where |5Wi| refers to the number of times bowler i took 5-wicket hauls, Avg(|5Wp|) indicates the average count of 5-wicket hauls by the peer bowlers’ p, and SD(|5Wp|) denotes the standard deviation of the count of 5-wicket hauls by the peers for the given year.
7 Experimental Setup and Performance Evaluation
The following section details the experimental setup and evaluation of this work.
The online forum ESPN Cricinfo2 is a reliable source of cricket data, as it contains the data of matches from 1779 to date. The data used in the following prediction task were crawled from this forum. Specifically, the data from the years 2008–2016 were extracted for SCP in the batting and bowling areas. This random era was selected to incorporate enough data for better analytics. Since the presented method and its results do not considerably depend on the specific period, any span with an appropriate quantity of player data may be used. Initially, a dataset covering 955 batsmen and 748 bowlers who played at least one match was extracted. The top six players in the playing 11 were considered in the batting SCP, while six bowlers from the playing 11 were considered in the bowling SCP [3].
Players from both domains who played less than five innings were excluded because they did not perform against the most top-ranked teams; therefore, they were not potential SCs. Furthermore, the predictions were performed for the players who played ODIs for at least two years in their respective cricket teams. After the task-relevant data were extracted, the batsmen were sorted in descending order based on runs scored, while the bowlers were sorted based on the number of wickets taken. The top 250 players were included in the analysis. Afterward, the presented features were calculated, and the values were normalized from 0 to 1 for players of both domains using min-max Scalar. Jupyter Notebook and Python 3.6 were used for the data pre-processing and detailed analysis.
The training and testing datasets were extracted for year-wise performance evolution based on the BPE metrics: BAE, BSRE, HRE, 50RE, 100RE, 4RE, 6RE and 0RE. Similarly, the BoAE, BoSRE, BoEE, BBoE, MOE, 4WE and 5WE were used to assess the performance evolution. Moreover, the whole dataset of both domains was divided into two spans for each player; one half was used for training, and the other half was employed for testing. With n denoting the total number of playing years of player i, the expression n/2 = k divides it into two; therefore, the span n = 1 to k was used for training, whereas the span n = k + 1 to n was employed for testing.
7.1.1 Performance Evolution Score of Batsman (PES (B))
The performance evolution score (PES) of batsman i for training, denoted as PES(Bi)train, is formulated as follows:
The PES of batsman i for testing denoted as PES(Bi)test is formulated as follows:
7.1.2 PES of Bowler (PES (Bow))
The PES of bowler i for training denoted as PES(Bowi)train is formulated as follows:
The PES of bowler i for testing, denoted as PES(Bowi)test is formulated as follows:
The 250 instances belonging to both domains were first sorted in descending order based on the PES calculated from the selected metrics; the top 125 instances were labeled SCs (positive samples), and the bottom 125 were labeled Not SCs (negative samples). Afterward, 50 instances were randomly obtained from the positive and negative samples for training and testing purposes. The equal number of positive and negative samples fulfills the required class balance.
7.2 Evaluation of Incorporated Features
Not all features may necessarily be contributing to the prediction task. Some features contribute considerably, some may have only a small impact, and some may even decrease prediction performance. State-of-the-art metrics, namely, information gain, gain ratio and chi-squared statistics, were used to determine each feature’s contribution to the prediction task [3].
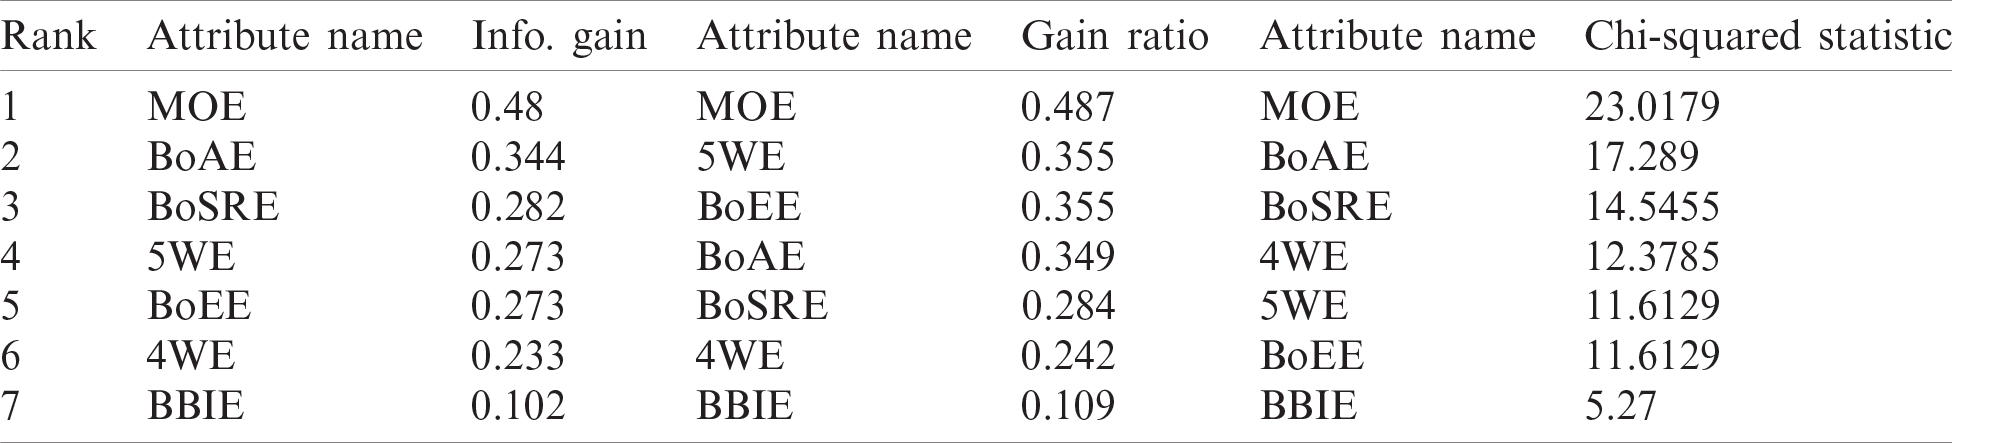
The presented batting and bowling feature metrics were computed to determine the relative importance of SCP. Afterward, the features from both domains were sorted in descending order based on the calculated metric values. The ranked features of the bowlers are depicted in Tab. 1, whereas the ranked bowler features are presented in Tab. 2. In both tables, all the proposed features have non-zero values; thus, all of them may be contributing to the prediction task. However, the employed metrics provide different ranking values to the various features of both domains.
Table 1: Batting feature ranking: ranking comparison of batting features extracted from the dataset
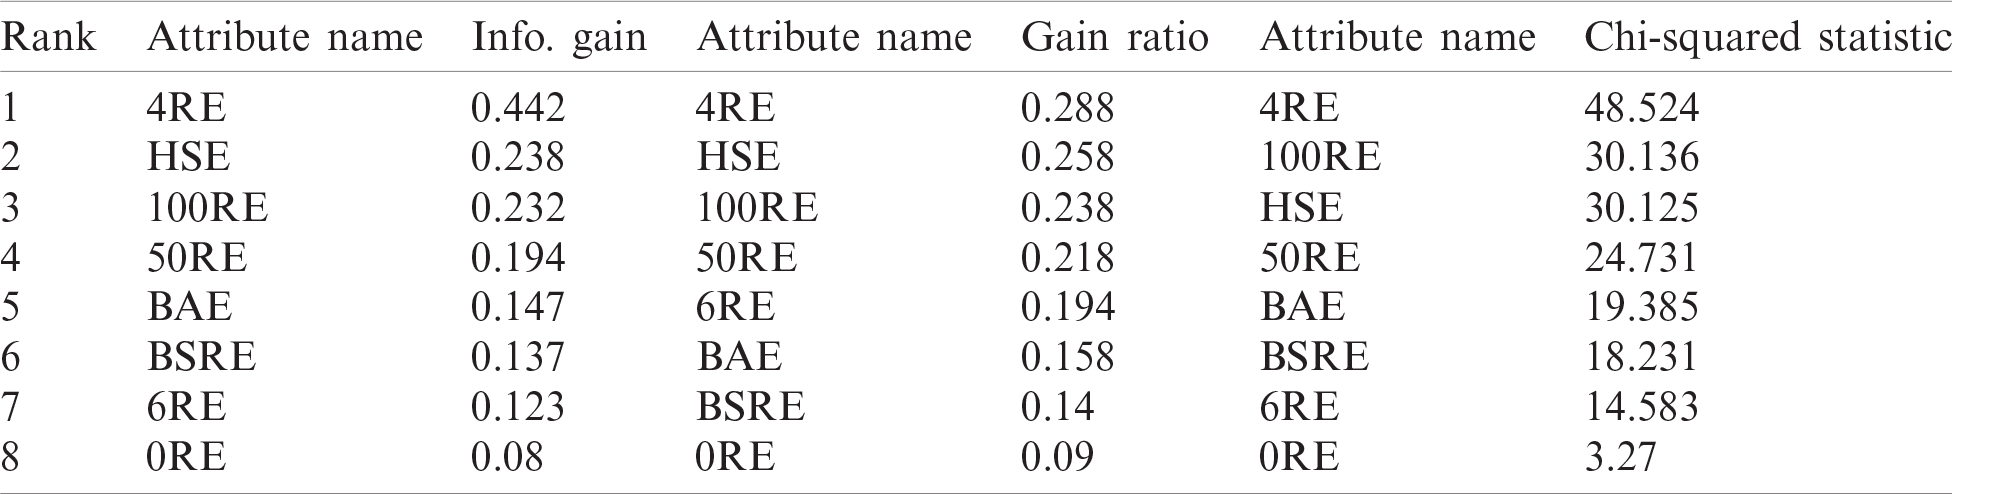
Table 2: Bowling feature ranking: ranking comparison of bowler features extracted from the dataset
Each of the individual features is examined using state-of-the-art SML models. This section presents the detailed evaluation results of each feature’s effectiveness in the batting domain for SCP. For the batting dataset, 4RE dominated all the other features for SCP, with an accuracy of 78%. Therefore, 4RE alone can predict SCs more effectively than the other features. For the same feature, the SML models SVM, NB, CART, SL, BN and RF scored accuracies of 78%, 77%, 76%, 76%, 75% and 72%, respectively. Furthermore, for SCP, HSE and 100RE were identified as the second and third-best features, respectively.
In the overall evaluation, for SCP, the SL classifier outperformed all the other classifiers. In terms of the F-measure score, the precedence order for the remaining SML models was as follows: NB, SVM, CART, BN and RF. For SCP in the batting domain, all the proposed features were adequate, as shown in Fig. 2.
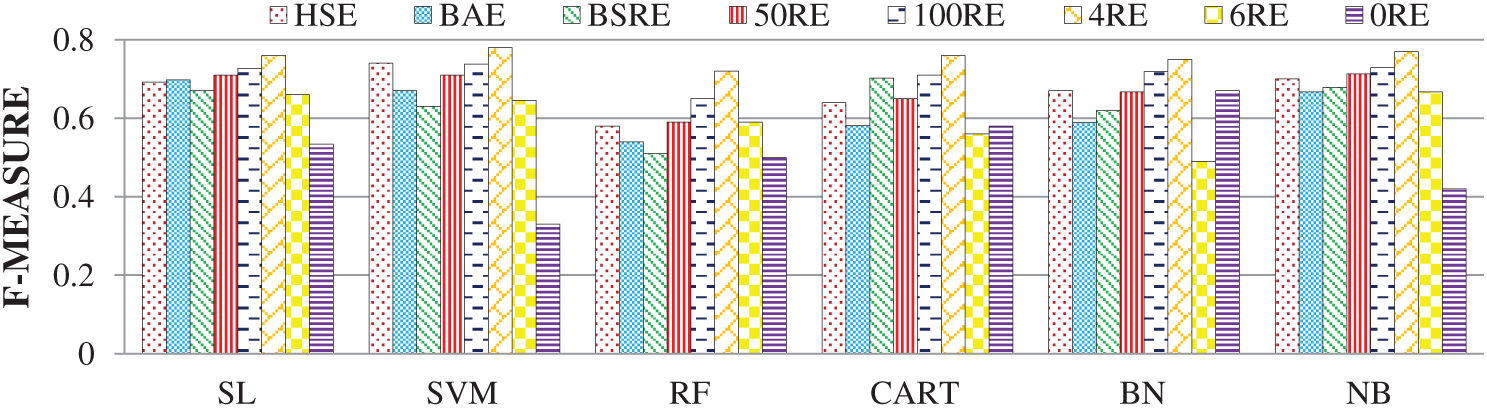
Figure 2: F-measure analysis of individual features using the batting dataset
A comprehensive evaluation was also performed on the bowling dataset. In this dataset, MOE outperformed all the other features, with an accuracy score of 73.9%. These evaluation results reinforce the claim that MOE alone is the best feature for SCP in the bowling domain. For the same feature, the SL, CART, BN, NB, SVM and RF classifiers attained accuracy scores of 73.9%, 70.6%, 70.1%, 69.7%, 69% and 66.7%, respectively. Moreover, the evaluation results showed that BoAE and BoSRE attained the second and third positions, respectively, for predicting SCs. The order of precedence for the employed SML classifiers for the bowling dataset in terms of the F-measure was as follows: SL, NB, CART, BN, SVM and RF (Fig. 3). All the proposed features for SCP were highly effective for SCP in the bowling domain. Moreover, the evaluation results revealed that the influence of the individual bowling features was slightly lower than that of the batting dataset in terms of prediction accuracy.
BAE and BSRE were included in the ‘derived’ feature category because these features were derived while incorporating the other metrics. The primary category consisted of HRE, 50RE, 100RE, 4RE, 6RE and 0RE. The batting dataset based on the evolution performance features for SCP exhibited an effective performance, as presented in Fig. 4a. In this dataset, the ‘primary’ feature set category outperformed the others, achieving an accuracy score of 77.2%. This outcome also strengthens the claim that the use of an individual primary feature is enough for SCP. For the ‘primary’ category, accuracies of 77.2%, 74.7%, 74.7%, 74.7%, 73.9% and 73.1% were achieved by using the SL, NB, SVM, CART, BN and RF classifiers, respectively. In the overall evaluation, the SVM classifier outperformed all the other SML classifiers for SCP. The precedence order of the remaining classifiers based on the average F-measure score for the batting dataset was as follows: SL, NB, CART, BN and RF. Furthermore, the batting dataset’s evaluation results revealed that the individual categories’ influence was the same in terms of prediction accuracy.
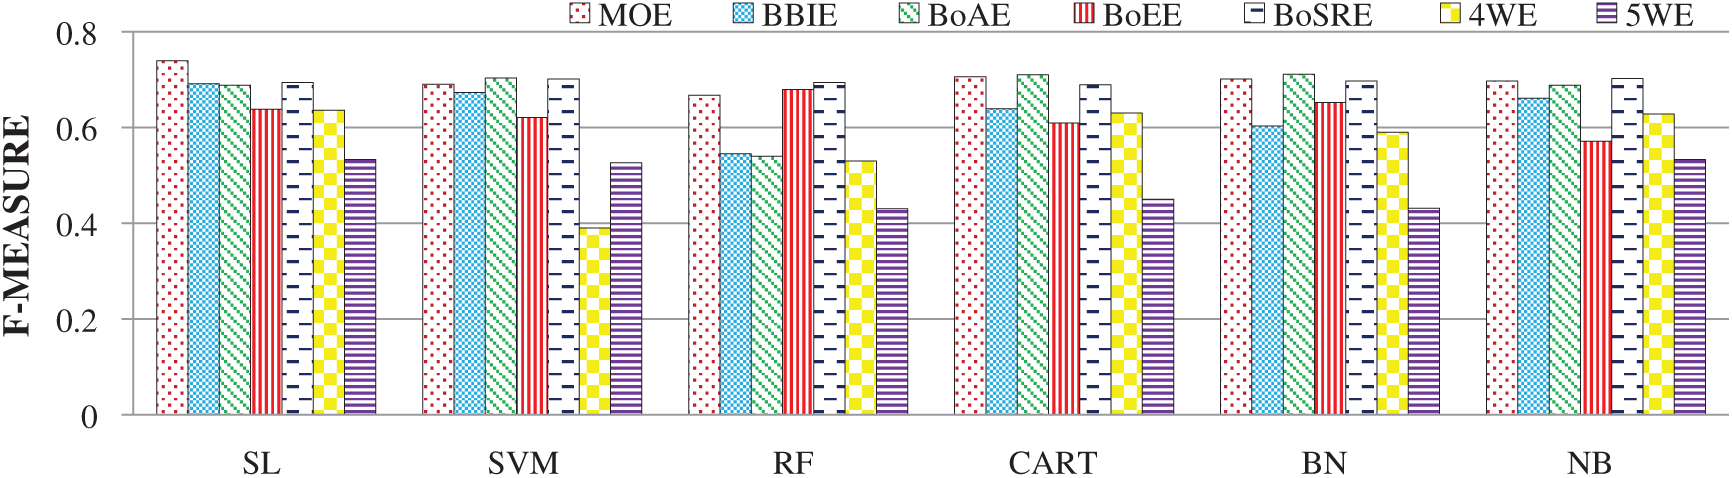
Figure 3: F-measure analysis of individual features using the bowling dataset
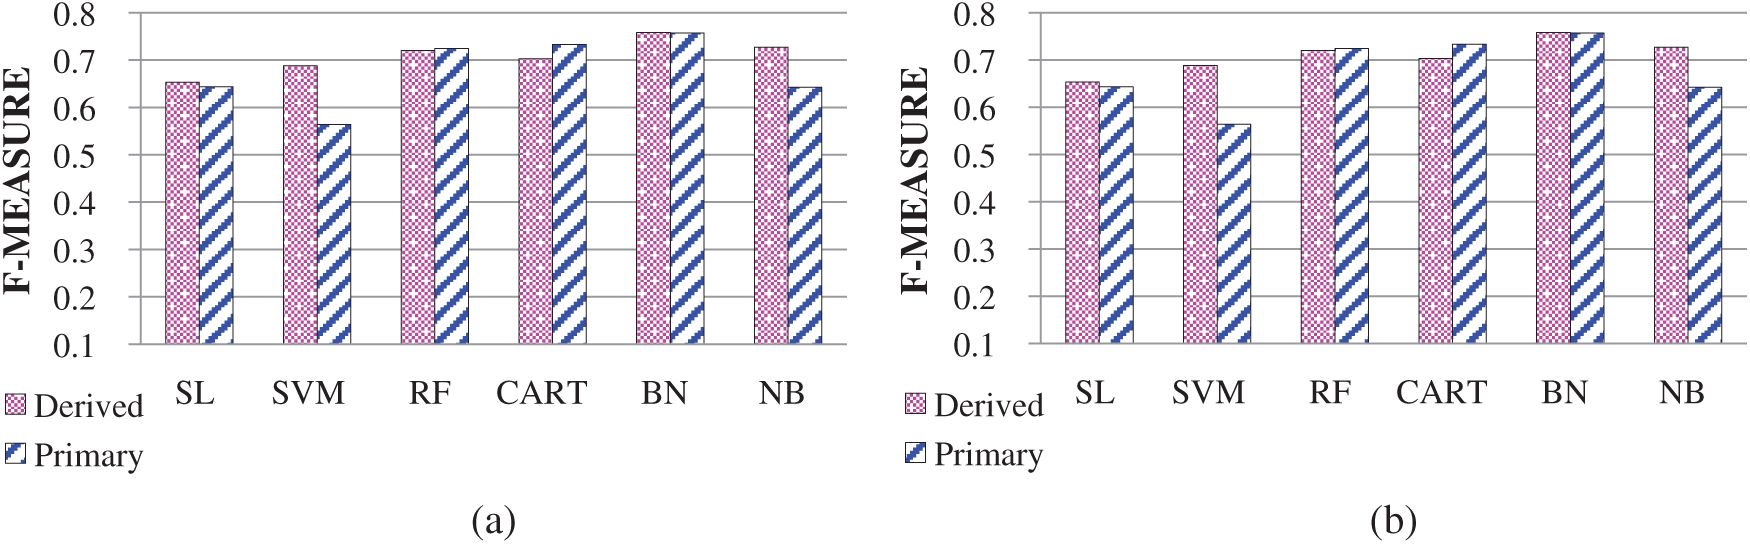
Figure 4: (a) Category-wise analysis of batting. (b) Category-wise analysis of bowling
The features BBoE, BoAE, BoSRE and BoEE were included in the ‘derived’ category because these features were derived while incorporating the other metrics. The primary category comprised MOE, 4WE and 5WE. Contrary to the batting domain, in the bowling domain, the ‘derived’ feature category provided promising results, attaining an average F-measure score of 75.8%, as depicted in Fig. 4b. Therefore, the ‘derived’ feature category was better for SCP in the bowling domain than the ‘primary’ category. For the ‘derived’ category, learning accuracies of 75.8%, 72.7%, 72%, 70.3%, 68.8% and 65.3% were obtained by applying BN, NB, RF, CART, SVM and SL, respectively. In the overall evaluation of learning the SCP, the most promising results were provided by NB. The precedence order of the remaining classifiers based on the average F-measure score for the bowling dataset was as follows: CART, RF, SL, NB and SVM.
7.5 Analysis of Incorporated SML Models
The proposed feature set was evaluated for SCP, and all the state-of-the-art SML models provided promising results (Fig. 5). Every classifier achieved an accuracy of at least 93% on various testing instances. However, in the overall evaluation, the best results were produced by SVM, yielding an accuracy of 86.59% for 10–100 instances. The second-best results were attained by NB, which generated an accuracy of 85.81%. For BN, SL, RF and CART, the accuracies were 84.6%, 82.9%, 82.3% and 80.8%, respectively. As a group, the Bayesian-based SML classifiers provided promising results for this dataset, with an average score of 85.23%. The function-based SML classifiers ranked second, with an average of 84.78%. The decision-tree-based SML classifiers were ranked last, even with a good average score of 81.59%. This analysis reveals that learning accuracy is affected by the number of training instances, and an increase in training instances somehow decreases accuracy. The anticipated reason behind this effect is that only top players contend in top rankings and are nominated as stars. In general, the proposed feature set can be further generalized and used for SCP.
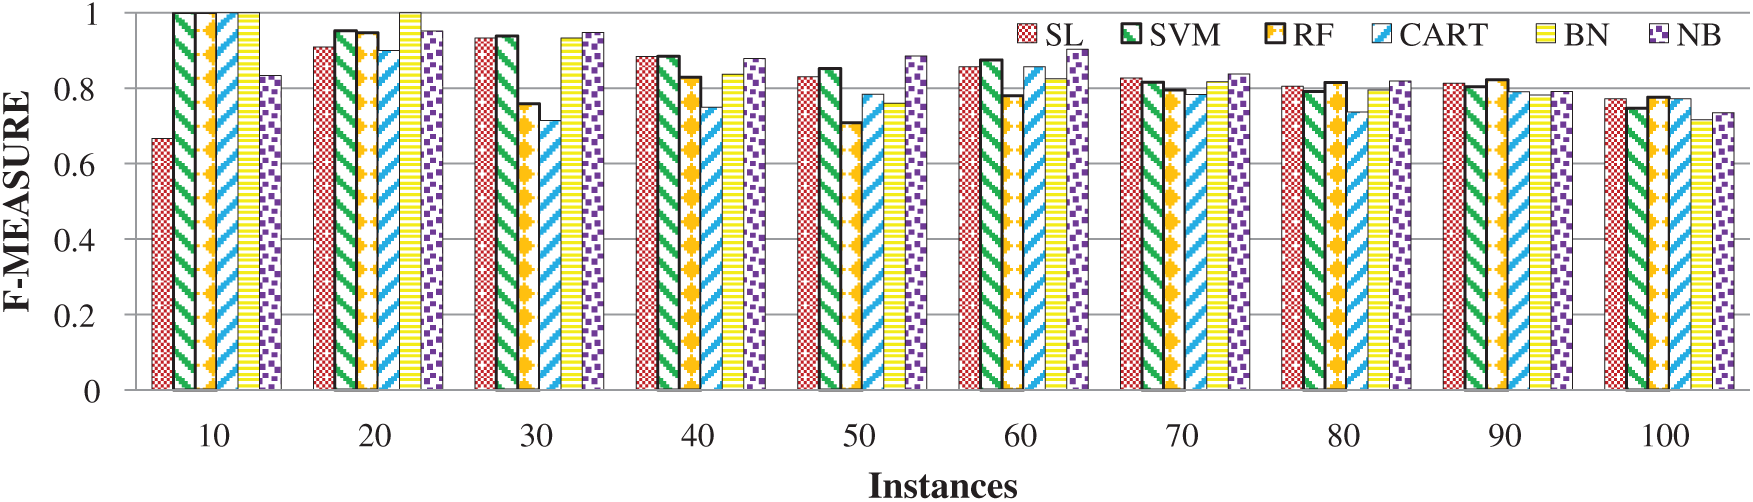
Figure 5: Model-wise evaluation of feature sets on the batting dataset
The influence of all features was examined for SCP, and the state-of-the-art ML classifiers provided promising results (Fig. 6). NB and CART outperformed all the other models in the bowling dataset, producing an accuracy of 88.9%. Maximum accuracies of 84.2%, 83.3%, 81.1% and 78.1% were achieved with the RF, BN, SL and SVM models, respectively. In the overall evaluation, NB outperformed all the other classifiers, yielding an average accuracy of 80.09% for 10–100 learning instances. The CART model generated the second-best results, with an average accuracy of 76.33%. Average accuracies of 75.3%, 74.2%, 73.2% and 73.1% were achieved by RF, SL, BN and SVM, respectively. Overall, as a group, the Bayesian-based SML models provided the best results, with an average of 76.65%. The tree-based SML models were ranked second, with a 75.83% score. The function-based SML models stood last, with an average score of 73.67%. Thus, an increase in the testing dataset somehow decreases accuracy. The reason is that only the top players are nominated as stars. In general, the proposed feature set can be further generalized and used for SCP.
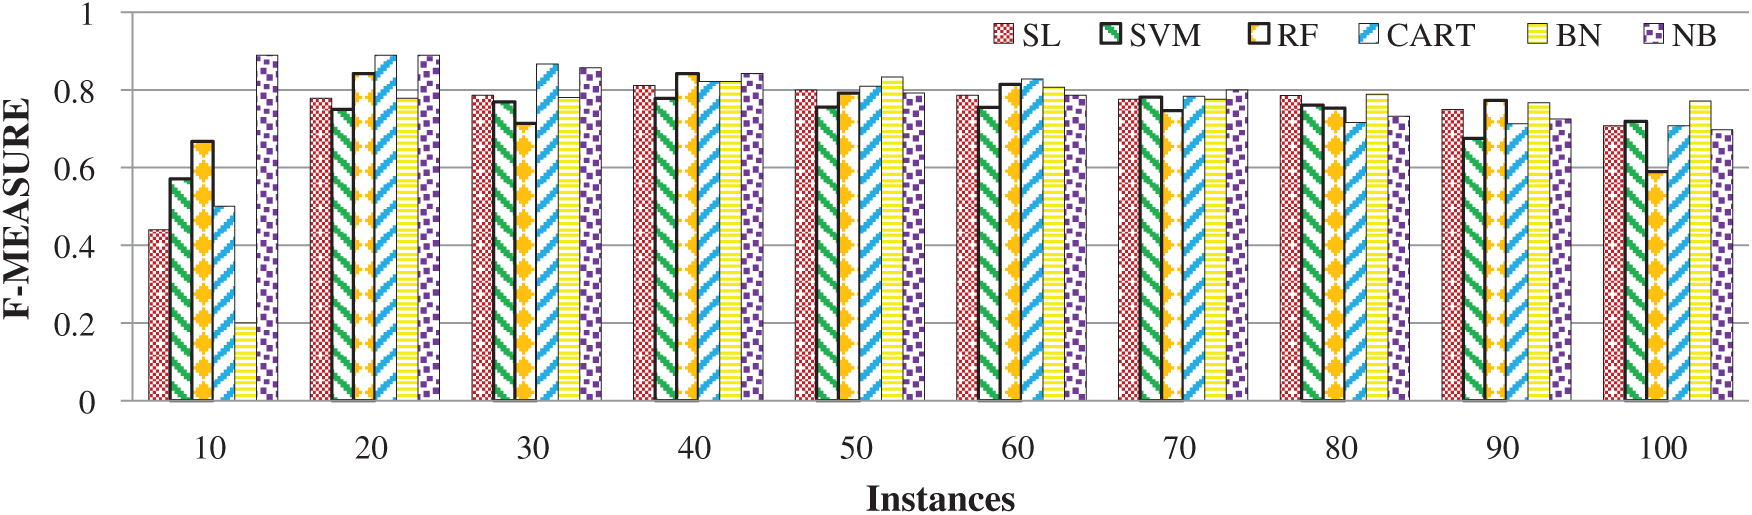
Figure 6: Model-wise analysis of features using the bowling dataset
The top 10 batsmen were identified through PES(Bi)test in the batting domain. The incorporated features for the batsmen were aggregated and are organized in descending order based on the PES(Bi)test score. The 10 highest-ranked SCs are presented in Tab. 3, which shows the players’ names, home countries and the highest rank in the ICC player ranking in 2013–2016. The table shows that the anticipated top 10 batting SCs are also ranked among the top 10 in the ICC player rankings.
Table 3: Batting ranking comparison
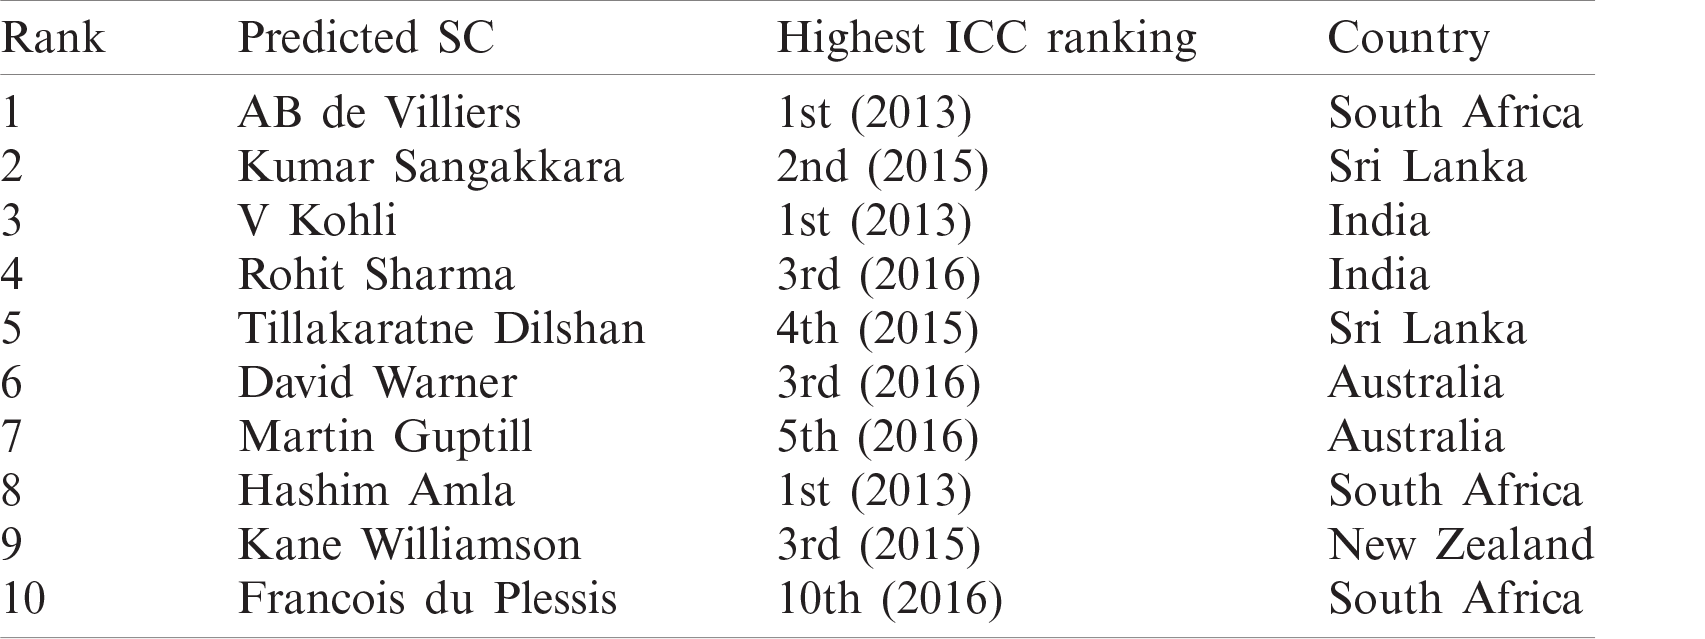
Since the presented ranking is based on performance evolution and covers a long time, it differs from the ICC rankings. For instance, Tillakaratne Dilshan, whose highest ICC ranking is 4th (2015), is in the 5th position in this study; Hashim Amla, who was ranked 1st by the ICC, is ranked 8th by the PES(Bi)test score. A possible reason is that Dilshan had played more matches; therefore, he had more experience to maintain his scores. By contrast, Amla was merely emerging during the studied period; although he was ranked 1st by the ICC, this reflects his recent performance but does not incorporate a long time for checking his evolutionary performance. Similar causes are anticipated with Francois du Plessis; although he was ranked 10th at most by the ICC up to 2016, he was only an emerging player during the considered span (although, in 2017, he was ranked 4th by the ICC). Nevertheless, the ICC player ranking validates that all the predicted SCs in the batting domain are SCs indeed.
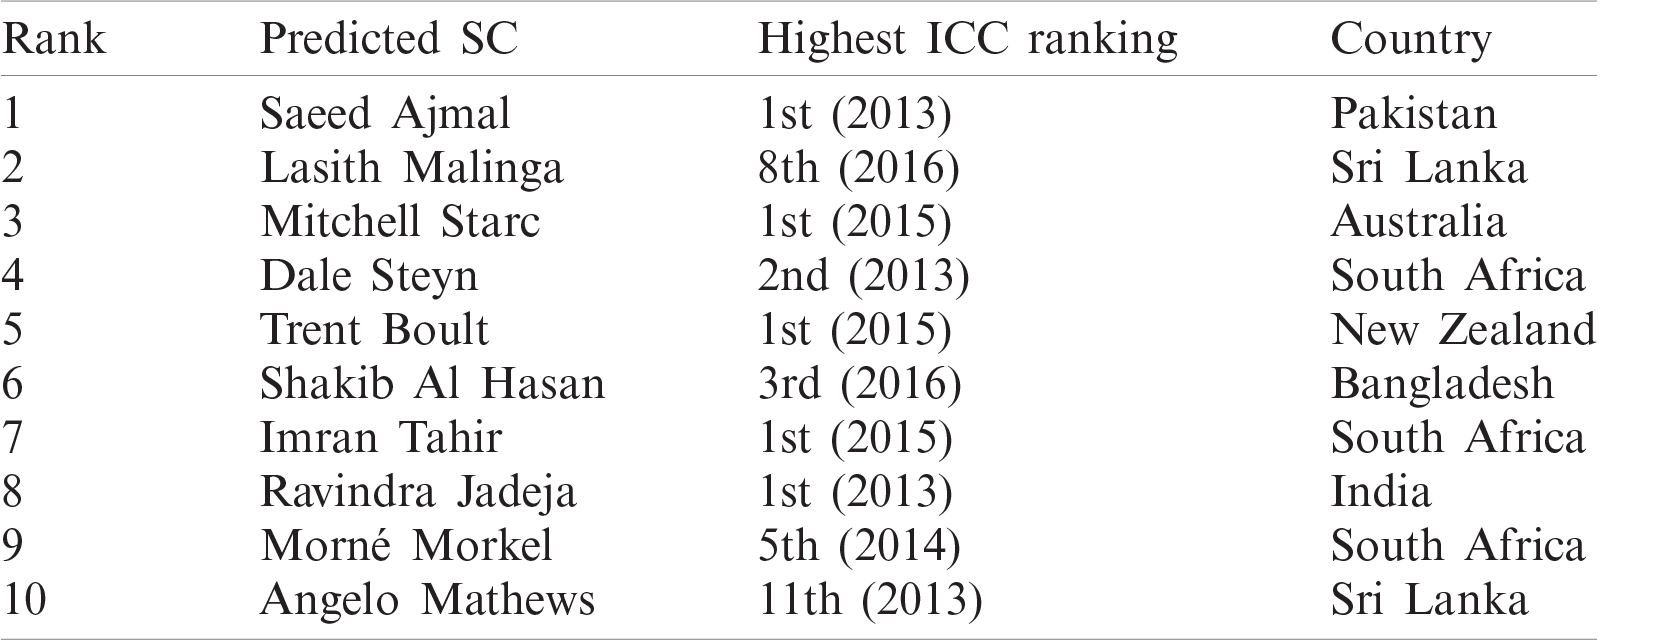
The top 10 SCs are listed in Tab. 4, which lists the players’ names, countries and highest ICC rankings attained in 2013–2016. The predicted top 10 bowling SCs are also ranked among the top 10 in the ICC bowling rankings. Since the presented ranking is based on performance evolution and covers a long time, it differs from the ICC rankings. For instance, the highest ICC ranking of Lasith Malinga is 8th (2016), but he is ranked 2nd in this study; Imran Tahir, who was ranked 1st by the ICC, is ranked 7th by the PES(Bowi)test score. A probable reason is that Malinga had played more matches; thus, he had more experience to maintain his scores. Tahir was an emerging player during the examined period; although he was ranked 1st by the ICC, it only reflects his recent performance and does not include a long time for checking his performance evolution. A similar reason may apply to Angelo Mathews; although his best rank up to 2016 was 11th, he was also an emerging player during this time. Nevertheless, all the predicted bowlers are certainly SCs and validated by ICC bowler rankings.
Table 4: Bowling ranking comparison
Evolution-based performance measures are introduced for both batting and bowling domains, these measures include the performance of peers at the same time. The defined features (derived and primary) are tested using function-based (SL and SVM), decision-tree-based (RF and CART) and Bayesian-based (BN and NB) models. For the batsmen, 4RE suppresses the other defined features; for the bowlers, MOE is the best for SCP. Overall, NB outperforms the other models for SCP. As a group, the Bayesian-based (BN and NB) models outperformed for SCP. Finally, SC rankings based on the performance evolution metrics are presented for both domains. The extracted rankings are compared with the ICC rankings for 2013–2016.
Acknowledgement: The authors acknowledge the Taif University for financial support for this research through the Taif University researchers supporting project (TURSP-2020/231), Taif University, Saudi Arabia.
Funding Statement: This work is financially supported by Universiti Tunku Abdul Rahman, Kampar, Perak, Malaysia. The authors also acknowledge Taif university for financial support for this research through the Taif University researchers supporting project (TURSP-2020/231), Taif University, Saudi Arabia.
Conflicts of Interests: The authors declare that they have no conflicts of interest to report regarding the present study.
2https://stats.espncricinfo.com/ci/engine/records/index.html.
1. M. Lewis, Moneyball: The Art of Winning an Unfair Game, 1st ed., New York, United States: WW Norton & Company, 2004. [Google Scholar]
2. R. P. Schumaker, O. K. Solieman and H. Chen, “Sports knowledge management and data mining,” ARIST, vol. 44, no. 1, pp. 115–157, 2010. [Google Scholar]
3. H. Ahmad, A. Daud, L. Wang, H. Hong, H. Dawood et al., “Prediction of rising stars in the game of cricket,” IEEE Access, vol. 5, no. 1, pp. 4104–4124, 2017. [Google Scholar]
4. G. Demartini, “Finding experts using Wikipedia,” in Proc. of the 2nd Int. Conf. on Finding Experts on the Web with Semantics, Citeseer, vol. 290, pp. 33–41, 2007. [Google Scholar]
5. M. Hall, E. Frank, G. Holmes, B. Pfahringer, P. Reutemann et al., “The WEKA data mining software: An update,” ACM SIGKDD Explorations Newsletter, vol. 11, no. 1, pp. 10–18, 2009. [Google Scholar]
6. G. Panagopoulos, G. Tsatsaronis and I. Varlamis, “Detecting rising stars in dynamic collaborative networks,” Journal of Informetrics, vol. 11, no. 1, pp. 198–222, 2017. [Google Scholar]
7. H. O. Stekler, D. Sendor and R. Verlander, “Issues in sports forecasting,” International Journal of Forecasting, vol. 26, no. 3, pp. 606–621, 2010. [Google Scholar]
8. T. Callaghan, P. J. Mucha and M. A. Porter, “Random walker ranking for NCAA division IA football,” The American Mathematical Monthly, vol. 114, no. 9, pp. 761–777, 2007. [Google Scholar]
9. L. T. Le and C. Shah, “Retrieving rising stars in focused community question-answering,” in Asian Conf. on Intelligent Information and Database Systems, Berlin, Germany: Springer, pp. 25–36, 2016. [Google Scholar]
10. X. L. Li, C. S. Foo, K. L. Tew and S. K. Ng, “Searching for rising stars in bibliography networks,” in Int. Conf. on Database Systems for Advanced Applications, Berlin, Germany: Springer, pp. 288–292, 2009. [Google Scholar]
11. N. Singh, S. B. Singh, E. H. Houssein and M. Ahmad, “COVID-19: Risk prediction through nature-inspired algorithm,” World Journal of Engineering, ahead–of-print, 2020. [Google Scholar]
12. A. Daud, M. Ahmad, M. Malik and D. Che, “Using machine learning techniques for rising star prediction in co-author network,” Scientometrics, vol. 102, no. 2, pp. 1687–1711, 2015. [Google Scholar]
13. J. Davis, H. Perera and T. B. Swartz, “A simulator for twenty20 cricket,” Australian New Zealand Journal of Statistics, vol. 57, no. 1, pp. 55–71, 2015. [Google Scholar]
14. L. Page, S. Brin, R. Motwani and T. Winograd, The PageRank Citation Ranking: Bringing Order to the Web. Stanford InfoLab, 1999. [Google Scholar]
15. M. Ahmad, S. Protasov, A. M. Khan, R. Hussain, A. M. Khattak et al., “Fuzziness-based active learning framework to enhance hyperspectral image classification performance for discriminative and generative classifiers,” PloS One, vol. 13, no. 1, pp. e0188996, 2018. [Google Scholar]
16. A. Daud, F. Muhammad, H. Dawood and H. Dawood, “Ranking cricket teams,” Information Processing Management, vol. 51, no. 2, pp. 62–73, 2015. [Google Scholar]
17. J. S. Croucher, “Player ratings in one-day cricket,” in Proc. of the Fifth Australian Conf. on Mathematics and Computers in Sport, NSW: Sydney University of Technology, pp. 95–106, 2000. [Google Scholar]
18. P. J. Van Staden, “Comparison of cricketers’ bowling and batting performances using graphical displays,” Current Science, vol. 96, no. 6, pp. 764–766, 2009. [Google Scholar]
19. A. B. Manage and S. M. Scariano, “An introductory application of principal components to cricket data,” Journal of Statistics Education, vol. 21, no. 3, pp. 200–217, 2013. [Google Scholar]
20. H. H. Lemmer, “The single match approach to strike rate adjustments in batting performance measures in cricket,” Journal of Sports Science Medicine, vol. 10, no. 4, pp. 415–431, 2011. [Google Scholar]
21. P. J. Bracewell and K. Ruggiero, “A parametric control chart for monitoring individual batting performances in cricket,” Journal of Quantitative Analysis in Sports, vol. 5, no. 3, pp. 987–1000, 2009. [Google Scholar]
22. G. R. Amin and S. K. Sharma, “Measuring batting parameters in cricket: A two-stage regression-OWA method,” Measurement, vol. 53, no. 3, pp. 56–61, 2014. [Google Scholar]
23. A. Daud, A. Hussain, R. A. Abbasi, N. R. Aljohani, T. Amjad et al., “Region-wise ranking of sports players based on link fusion,” in Companion Proc. of the Web Conf. 2018, International World Wide Web Conferences Steering Committee, Republic and Canton of Geneva, Switzerland, pp. 259–266, 2018. [Google Scholar]
24. P. Allsopp and S. R. Clarke, “Rating teams and analyzing outcomes in one day and test cricket,” Journal of the Royal Statistical Society: Series A, vol. 167, no. 4, pp. 657–667, 2004. [Google Scholar]
25. N. Landwehr, M. Hall and E. Frank, “Logistic model trees,” Machine Learning, vol. 59, no. 1–2, pp. 161–205, 2005. [Google Scholar]
26. S. S. Keerthi, S. K. Shevade, C. Bhattacharyya and K. R. K. Murthy, “Improvements to Platt’s SMO algorithm for SVM classifier design,” Neural Computation, vol. 13, no. 3, pp. 637–649, 2001. [Google Scholar]
27. L. Breiman, “Random forests,” Machine Learning, vol. 45, no. 1, pp. 5–32, 2001. [Google Scholar]
28. A. Umair, M. S. Sarfraz, M. Ahmad, U. Habib, M. H. Ullah et al., “Spatiotemporal analysis of web news archives for crime prediction,” Applied Sciences, vol. 10, no. 22, pp. 210–235, 2020. [Google Scholar]
29. N. Friedman, D. Geiger and M. Goldszmidt, “Bayesian network classifiers,” Machine Learning, vol. 29, no. 2–3, pp. 131–163, 1997. [Google Scholar]
30. X. Liu, H. Zhu, R. Lu and H. Li, “Efficient privacy-preserving online medical primary diagnosis scheme on naive bayesian classification,” Peer-to-Peer Networking Applications, vol. 11, no. 2, pp. 334–347, 2018. [Google Scholar]
 | This work is licensed under a Creative Commons Attribution 4.0 International License, which permits unrestricted use, distribution, and reproduction in any medium, provided the original work is properly cited. |