DOI:10.32604/cmc.2021.016614
| Computers, Materials & Continua DOI:10.32604/cmc.2021.016614 | |
| Article |
Mining Software Repository for Cleaning Bugs Using Data Mining Technique
1University Institute of Information Technology, Pir Mehr Ali Shah Arid Agriculture University, Rawalpindi, 46000, Pakistan
2Department of Computer Science, COMSATS University Islamabad, Attock Campus, Attock, 43600, Pakistan
3Department of Software Engineering, Foundation University Islamabad, Islamabad, 44000, Pakistan
4Department of Mathematics and Statistics, Pir Mehr Ali Shah Arid Agriculture University, Rawalpindi, 46000, Pakistan
5Department of Software, Sejong University, Seoul, 05006, Korea
*Corresponding Author: Oh-Young Song. Email: oysong@sejong.edu
Received: 06 January 2021; Accepted: 06 April 2021
Abstract: Despite advances in technological complexity and efforts, software repository maintenance requires reusing the data to reduce the effort and complexity. However, increasing ambiguity, irrelevance, and bugs while extracting similar data during software development generate a large amount of data from those data that reside in repositories. Thus, there is a need for a repository mining technique for relevant and bug-free data prediction. This paper proposes a fault prediction approach using a data-mining technique to find good predictors for high-quality software. To predict errors in mining data, the Apriori algorithm was used to discover association rules by fixing confidence at more than 40% and support at least 30%. The pruning strategy was adopted based on evaluation measures. Next, the rules were extracted from three projects of different domains; the extracted rules were then combined to obtain the most popular rules based on the evaluation measure values. To evaluate the proposed approach, we conducted an experimental study to compare the proposed rules with existing ones using four different industrial projects. The evaluation showed that the results of our proposal are promising. Practitioners and developers can utilize these rules for defect prediction during early software development.
Keywords: Fault prediction; association rule; data mining; frequent pattern mining
Mining software repositories is a procedure for examining data based on software development history. This is a developing field for supporting software development teams in performing daily tasks. Mining software repositories discovers interesting and actionable patterns for software development from the rich data available in the repository. Many open-source software repositories, such as source code control systems, archived communications among project personnel, and fault tracking systems, are available for this purpose. Software engineers and researchers recognize the benefits of mining software repositories for software system maintenance, reuse, and authenticating new ideas and techniques. Numerous approaches to data mining have been implemented in various data-mining applications [1]. The overall objective is to make accurate predictions or classify repositories to improve the decision-making process from data [2]. Data-mining approaches, such as support vector machines, nearest neighbors, neural networks, Naive Bayes, and logistic regression, can provide exact predictions but still be deficient in clarifying the relationship between objects in a class.
The decision tree algorithm builds a tree in which each node of the tree is an input variable and the path that follows a series of nodes leads to a decision-category label [3]. The Apriori algorithm can generate association rules for each category that requires classified features [4] by looking for frequent items in the data with individual category tags. These algorithms can provide comparable classification accuracies and interpretable results. However, the disadvantages are that the models become complicated if the amount of data increases significantly and takes considerable time, which is not effective for timely prediction [5]. Software quality measures are essential to building high-quality software within a time frame and budget [6]. The best predictor is a model that predicts software defects and has been proven to help quality software development [7,8]. The approach that deals with discovering interesting patterns and correlations among the data in software repositories is known as frequent pattern mining; the most important frequent pattern mining application is mining association rules [9].
Association rule mining (ARM) creates associations among variables in repositories [10] and is used to correlate the presence of one set of objects with another set. It generates the rules that follow set criteria with minimal support and confidence. ARM is applied in many fields such as process mining, protein sequencing, logistic regression, scientific analysis, bio-scientific literature, and customer relationship management (CRM) of credit card enterprises. Existing literature describes that the right decision is critical for extracting practicable patterns among information available using different algorithms (e.g., Apriori, Éclat, and FP-growth) [11–14]. Other than ARM algorithm evaluation measures (e.g., support, confidence, and correlation), Jaccard and F-measure are also calculated and evaluated. Correlation can be calculated with the help of the “lift” measure. The values of other evaluation measures can be generated using mathematical and statistical formulas. The value of the F-measure defines the power of the association rules: the greater the F-measure, the stronger are the rules. These algorithms have some challenges in improving the performance and complexity of mining information, as there is a need to cope with large and complex datasets. Some existing algorithms involve using correlation measures [15], and a few existing algorithms use ARM [16,17]. The Apriori algorithm generates an iterative set of rules to locate the frequent pattern in a dataset and avoid unnecessary transactional statistics [13,14]. Frequent extraction of information from relevant repositories requires error-free relevant data to be reused during ARM software development, which is essential for mining bug-free data. This study applies ARM using the Apriori algorithm to extract the rules for defect prediction. There is a need for a mining algorithm that can clean and discover bug-free relevant data from the repository for correct reuse based on the frequently extracted data. Supporting the allocation of resources for software development and maintenance accurately is necessary to predict error-based information.
To maintain high project quality, project managers and engineers must screen faults during software development. Therefore, software defect prediction tasks should classify software modules as faulty or clean using metric-based classification methods, especially ARM. Software modules comprise many characteristic metrics (predictors) that can determine whether a module or class is defective or clean. Software modules and classes can be considered as multidimensional vectors and a software system as a dataset. In the dataset, a record is a software module, and a feature is a software index; rich information can be extracted from the module or class. The main contributions of this study are as follows:
• We analyzed defect data extracted from many projects by applying ARM to determine whether a software entity (class) is defective or clean. Association rules that identify buggy or clean classes are evaluated by different interestingness measures such as lift, support, correlations Jaccard, and F-measure.
• Although there is much work in software defect prediction, more focus is needed on accurate software defect predictors; the limitations of current methods need to overcome. As yet, few studies have been presented based on ARM predictors. Therefore, this study developed an ARM for fault prediction and evaluated its effectiveness through experimental results.
• Evaluating an algorithm using the proposed approach rules identified performance metrics for mining repositories using an experimental study of four industrial projects.
• The results showed that the proposed approach efficiently mines error-free information during development using an ARM-based algorithm and provides software practitioners with a guideline for mining repositories.
The remainder of the paper is organized as follows. Section 2 presents related work. The experimental design is discussed in Section 3, and the research methodology is presented in Section 4. Section 5 presents the results and discussions. Section 6 concludes the paper by offering a direction for future work.
Association rules [18] are commonly implemented in unsupervised scenarios. Numerous classification extensions have been proposed, such as classification based on the association (CBA) method [4], in which class association rules are mined, and the results are class labels. Liu et al. [19] proposed CBA2 to resolve data imbalance issues. Here, the rules have different minimum supports that predict different classes. Ma et al. [4] proposed another CBA2 method to predict faulty modules by performing tests on the NASA dataset [20], and the results were compared with those of other classification models. It was also found that the association rule generated from the data of one project can be used only for similar projects and that cross defect prediction cannot be performed [21]. Kamei et al. [22] proposed a hybrid model based on ARM and logistic regression that checks the rule suitability for a given instance. If suitable, the rules are implemented; if not, then a logistic regression model is implemented to obtain results. In [23], the authors introduced a subgroup discovery (SD) algorithm called the evolutionary decision rules (EDER) for detecting subcategories. This approach depends on evolutionary calculations to generate rules that further describe error-prone modules—tests were conducted on NASA’s dataset. The results of the EDER-SD algorithm were better than those of the three other popular SD algorithms. Analysis of different machine learning (ML) algorithms, such as the naive Bayes classifier, One R, and J48, was carried out by Menzies et al. [20]. The results show that log filtering and the naive Bayes algorithm yield superior results on NASA datasets. A literature review focusing on defect prediction methods shows that clustering, classification, and association mining are commonly used for defect prediction [24].
In another approach [25], prediction models for real-time defect datasets of software [20] were evaluated. The results confirmed that the hybrid model of one-rule classification [26] and instance-based learning produced better results in fault prediction than other models. Haghighi et al. [27] performed a comparative study of 37 models of fault detection systems on the NASA dataset; it was shown that the bagging classifier performed better than other classifiers. ROCUS [28] is a semi-supervised learning model that depends on divergence. The authors tested it on eight datasets of the NASA repository. Results were compared with those of other semi-supervised methods. Semi-supervised learning was used because the amount of labeled data in defect prediction is limited, whereas it is easy to collect unlabeled data. Zhang et al. [29] proposed a semi-supervised learning model based on divergence, called ACoForest. This model only needs to mark a part of the module; it then attempts to mark the remaining modules based on the model built from the marking data. Tests on publicly available datasets show that this method is superior to traditional ML algorithms. In [30], the authors suggested using the random forest method to predict whether a module comprises a defect. They applied the method to NASA datasets, analyzed its performance, and found that, compared with other ML algorithms, random forest performed better and was particularly effective on large datasets. Recently, defect prediction has shifted to method formalization and standardization [31]. For data preprocessing, attribute selection methods consisting of a framework were defined for defect prediction. D’Ambros et al. [32] proposed a standard for predicting defects using public datasets. Menzies et al. [20] studied the instability of the outcomes of prediction systems. They suggested the possible causes and solutions that tend to correct for one project but not for other projects. Ma et al. [21] claim that the area under the curve (AUC) approach provides a more suitable indicator, whereas Gray et al. [33] proved that the accuracy should also be reported. However, almost all approaches agree that accuracy alone is not sufficient when the data is skewed.
This study’s principal objective was to identify software metrics that can serve as suitable predictors of software fault and find the best association rules for fault prediction using the Apriori algorithm. To achieve this, we first needed to decide which metrics to choose and how data would be extracted and mined.
3.1 Selection of Software Metrics
The selection of suitable software metrics was a challenge because there are many metrics available. Several studies have employed Chidamber & Kemere (CK) metrics and fault-proneness prediction. Basili et al. [34] used multivariate linear regression (LR) for fault-prone classes. By contrast, Kanmani et al. [35] used a general regression neural network for the fault ratio and multiple linear regression for the fault ratio applied in [36,37]. In this work, we used the CK metrics to measure object-oriented behavior, which helps in software evolution. They are as follows:
• Weighted methods per class (WMC) are the aggregate complexity of methods, which can predict the time and effort needed for the maturity of a class.
• Depth of the inheritance tree (DIT) uses the maximum distance between a node and the root of a tree to evaluate complexity. A high value indicates high complexity, and a low value shows simplicity.
• Number of children (NOC) is a direct subclass in a class ladder. A low value shows a deficiency in communication, and a high value indicates the need for sophisticated tests.
• Coupling between object classes (CBO) uses the count of classes to which it is attached. Low CBO values show ease in reuse and testing.
• Response for a class (RFC) is a count of class methods and other methods that are called. A high RFC value indicates difficulty in testing and maintenance of the class.
• Lack of cohesion of methods (LCOM) tests the variation of procedures in a class using instance variables. High values indicate complexity.
For this study, we used the GitHub bug database [38] to extract the datasets. This database is useful for working and analyzing defect prediction areas. Java projects were selected with different domains, and features of these projects were mined from the GitHub repository using the SourceMeter tool. Fifteen projects were analyzed to answer different research questions. The SZZ algorithm [39] was used for analyzing commit logs and extracting bug data. Release versions at six-month intervals were used to create a bug database.
This section describes the process for analyzing the selected metrics as the best predictor of software faults for classes, covering steps such as preprocessing, ARM, the Apriori algorithm, receiver operating characteristic curve (ROC) analysis, and rule evaluation. Fig. 1 shows that, first, data extracted from repositories were preprocessed according to the requirements. Next, a data-mining technique was applied to achieve desired objectives. In this study, we applied ARM and generated rules regarding the bugs. Last, the rules were evaluated and tested on the bug dataset of a different project using the GitHub repository.
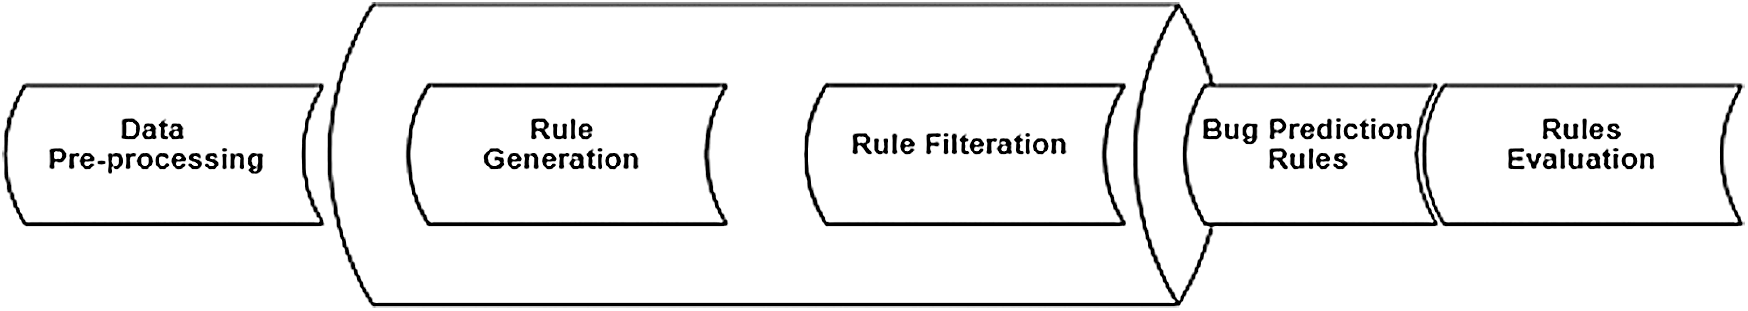
Figure 1: Process to analyze selected metrics
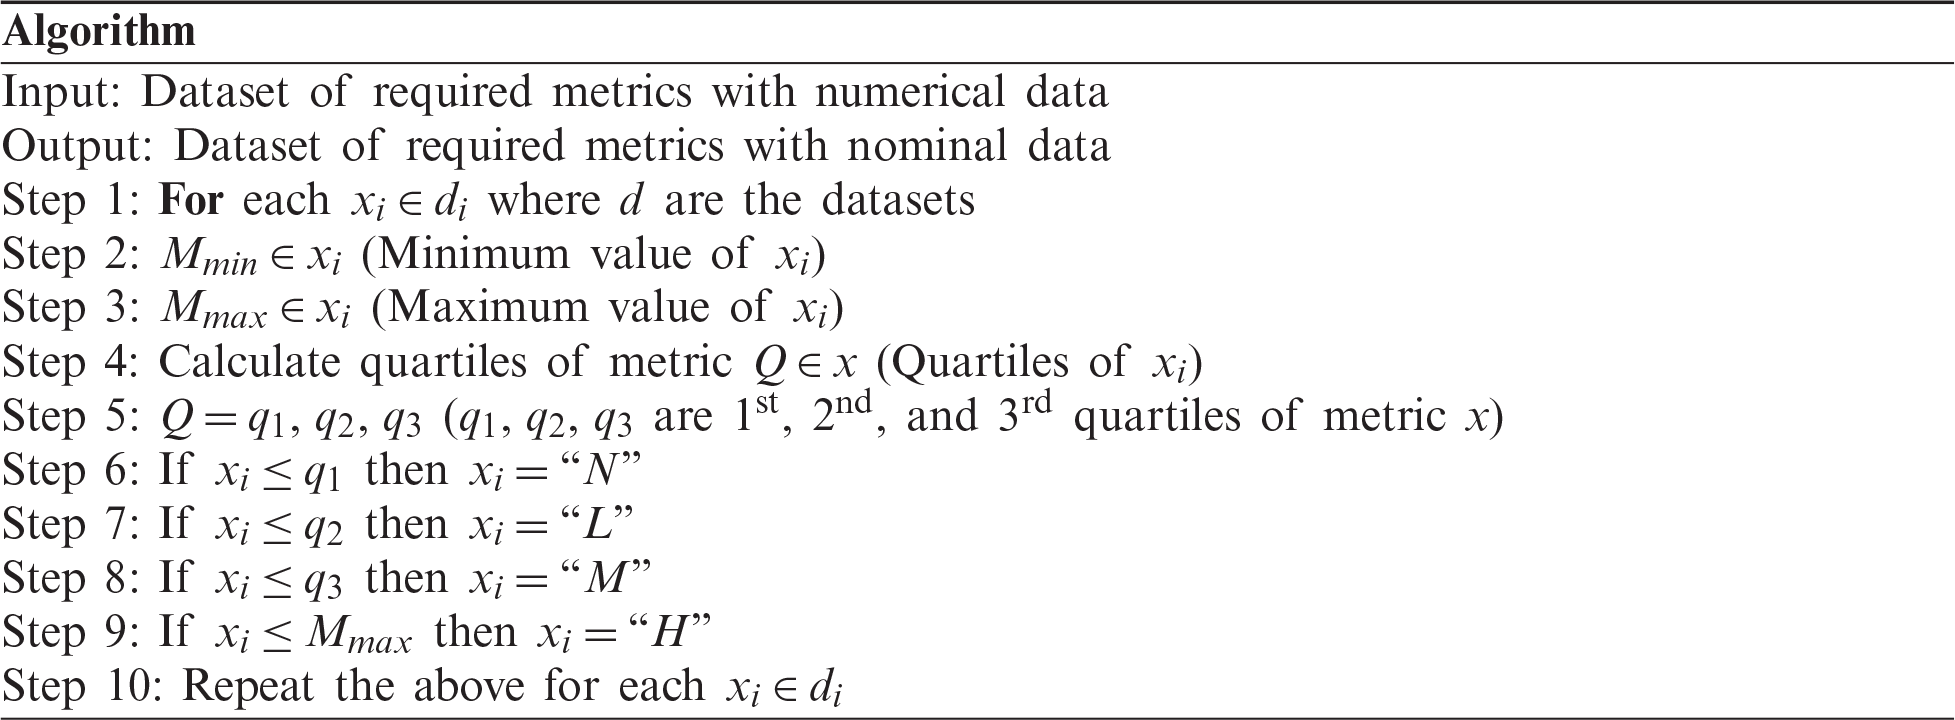
The Apriori algorithm was used to find the best predictor of software faults. This algorithm requires the nominal values of the selected datasets; hence, the quantitative value of data had to be changed to the nominal values by preprocessing for compatibility with the algorithm. The preprocessing algorithm is as follows.
4.2 Association Rule Mining (ARM)
Association rules are the characteristics that often occur in an assumed dataset. An ARM can be stated as
In this study, the Apriori algorithm is used to produce association rules by finding a repeated pattern in the data. An item is regarded as frequent if its support and confidence are higher than the threshold values. The support rate is the frequency of item set x that exceeds its occurrence in the exercise dataset; confidence is the frequency of item set x with z that satisfies the rule and exceeds the rate of item set x.
4.2.2 Why Use Apriori Algorithm
The FP-growth algorithm finds the frequent itemsets using a divide-and-conquer strategy; it then encodes the training data into an FP-tree to represent the frequent itemsets. However, it is expensive to build and may not fit in memory. Prediction using a decision tree starts with the root and proceeds through the nodes until a leaf node (the final class) is found. The drawback of the FP-growth algorithm is that it is easily overfitted. The support vector machine discriminates between classes by creating a separating hyperactive plane or a set of hyperactive schemes in a large dimension space and finds the best hyperactive scheme that attains the maximum margins between the classes. However, it does not work well with many samples and requires many parameters to be tuned. Logistic regression describes the association between the contributing classes and estimates the probabilities for the category-dependent variable using a logit function based on one or more features. Its disadvantages include being prone to overfitting and requiring more training time. The K-nearest neighbor algorithm assigns categories by a majority vote of k neighboring test samples. It uses such similarity measures as distance functions to determine the closeness of the samples. The drawbacks of the algorithm are that it is hard to classify with high dimensionality and that it has weak performance with imbalanced data and large amounts of memory. The Naive Bayes algorithm is successful in a variety of data-mining tasks. It estimates
4.3 Receiver Operating Characteristic (ROC) Curve
The ROC is used as a test of diagnostic accuracy [41]. It is shaped by scheming the true-positive rate contrary to the false-positive rate at multiple predefined values. Thus, the ROC is recalled as a function of fall-out. The ROC is an assessment tool for choosing optimal models and is linked in an ordinary mode to the cost and benefit investigation of analytical results. Initially, the ROC curve was established by electrical and radar engineers to search for opponents on battlefields in the Second World War. ROC studies are now used in medicine, radiology, biometrics, model evaluation, meteorology, ML, and data mining. Its performance through an AUC is assessed as follows: AUC = 0.5, no right category;
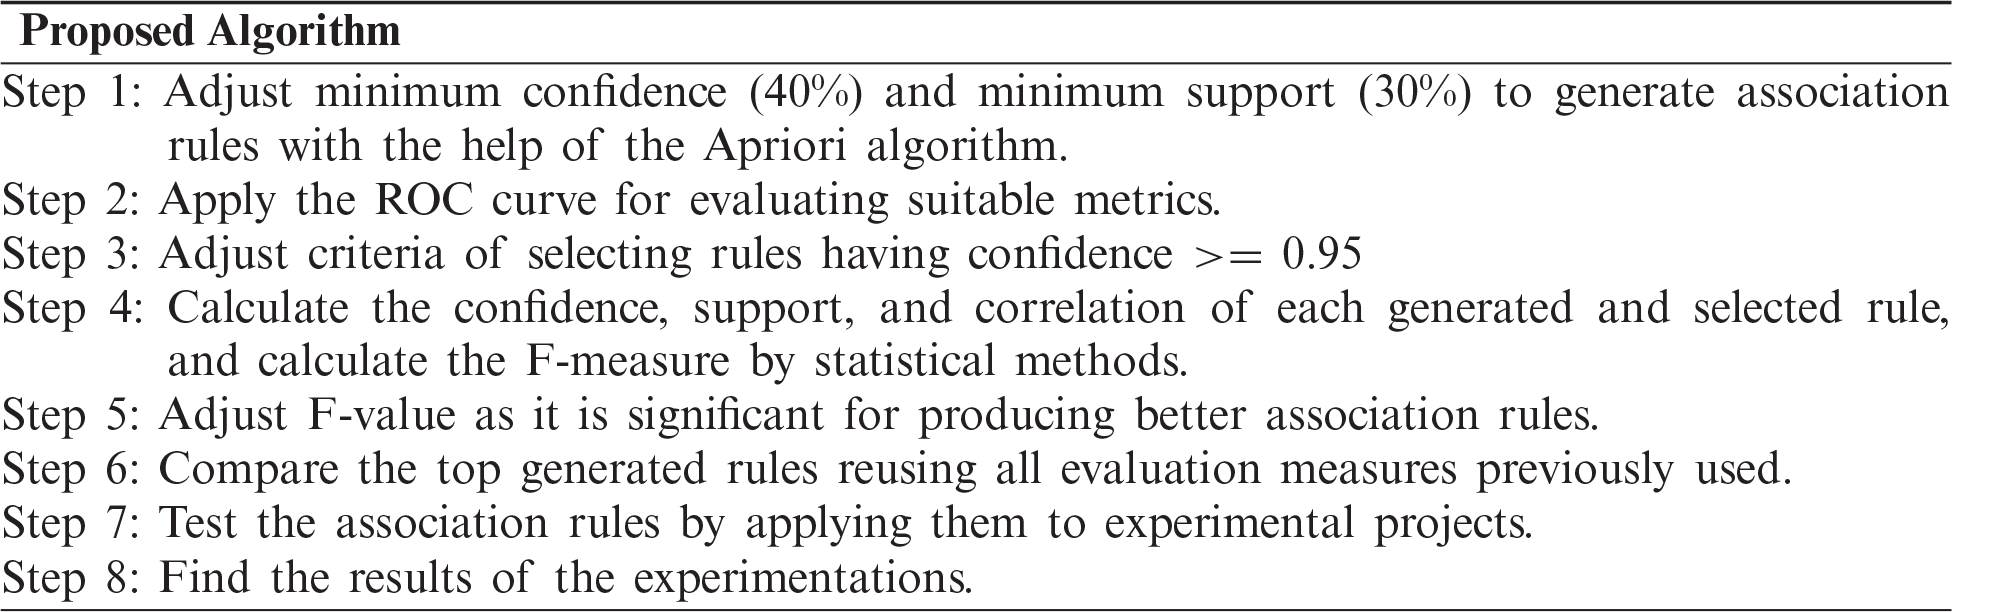
The steps of the proposed algorithm are as follows:
The metrics used for the rules’ evaluation are as follows:
• Recall = (support * lift)/confidence
• F-measure = 2 * (confidence * recall)/(confidence + recall)
• Correlation (X and Z) = (support − P(X) * P(Z))/SQRT(P(X) * P(Z) * (1 − P(X)) * (1 − P(Z)))
• P(X) = support/confidence
• P(Z) = confidence/lift
• Jaccard = support/(P(X) + P(Z) − support)
• Correlation: Correlation analysis deals with the relation between variables. Correlation prunes out the negatively associated rules. Correlation = (support − P(A) * P(B))/SQRT(P(A) * P(B) * (1 − P(A))*(1 − P(B)))
Correlation and F-measure evaluation were used to obtain the best ARM cleaning bugs. The Apriori algorithm was used to produce rules based on support = 30% and confidence = 40%. CK metrics were used for this purpose because they contain the behaviors of cohesion, complexity, coupling, inheritance, and size. Furthermore, we selected the AUC metric to evaluate the predictive power of each CK metric.
5.1 Predictor Analysis in Representative Projects
This section presents the comparative and predictor analysis using three industrial projects employing the aforementioned metrics. The projects were selected because the repositories are mainly used to develop products by reusing their features.
5.1.1 Android Universal Image Loader (AUIL) Project
The Android universal image loader (AUIL) is a library suitable for processing images on an Android device, such as uploading, hiding, and displaying. It delivers many configuration choices and consists of many advanced features for image processing and memory management. Figs. 2–6 show the ROC curve for different versions of the AUIL project.
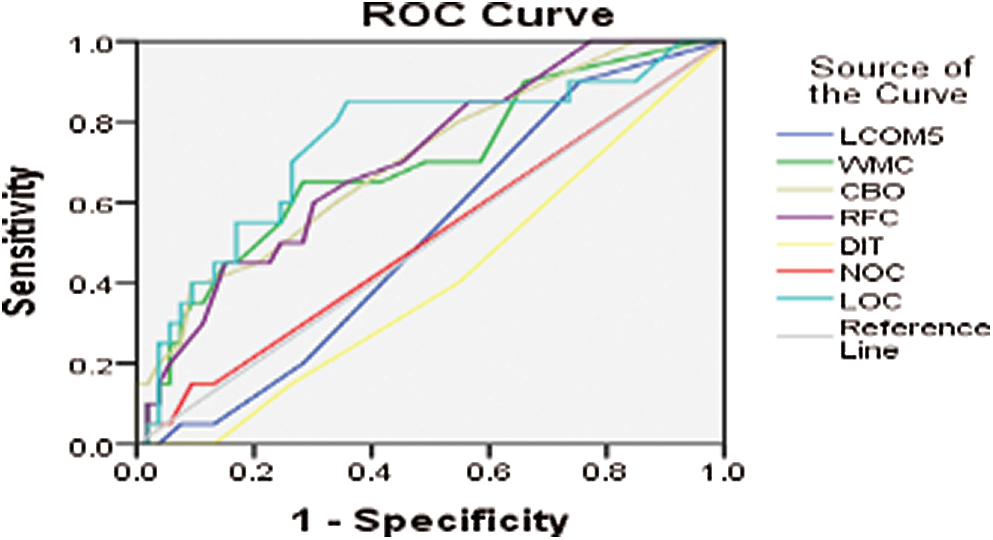
Figure 2: ROC curve for AUIL version 13-1
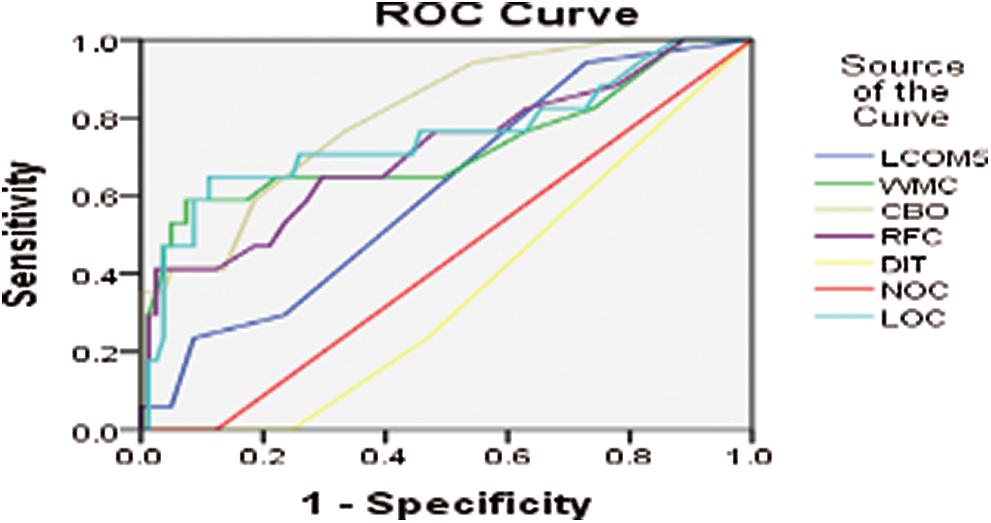
Figure 3: ROC curve for AUIL version 13-7
5.1.2 ANother Tool for Language Recognition (ANTLR) Project
Another tool for language recognition (ANTLR) is a valuable parser that produces organized text and binary files. It is applied in shaping languages, language tools, and language frameworks. ANTLR works by building parse trees from a grammar and generates an interface for ease of acknowledgment expressions of requirements. Figs. 7–11 show the ROC curve for different versions of the ANTLR project.
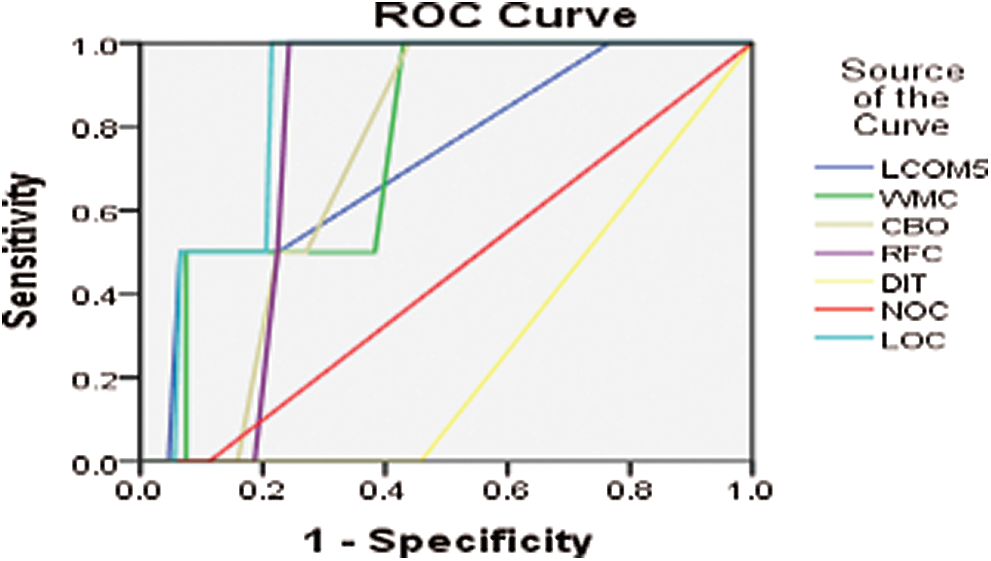
Figure 4: ROC curve for AUIL version 13-12
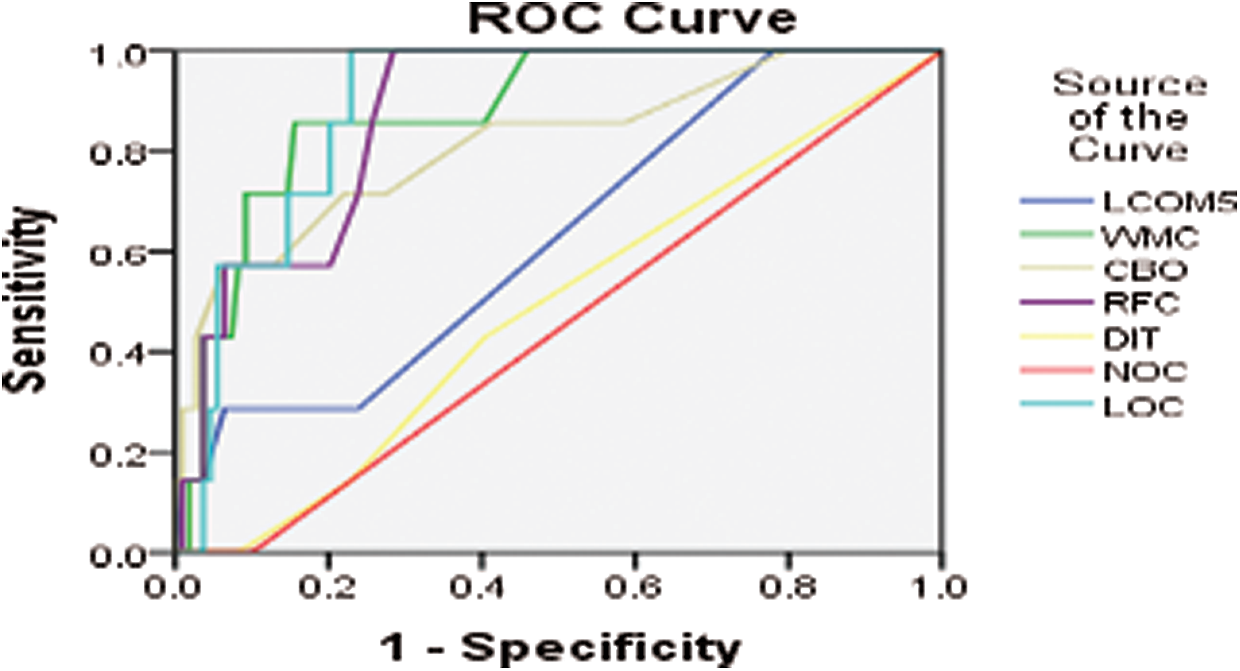
Figure 5: ROC curve for AUIL version 14-05
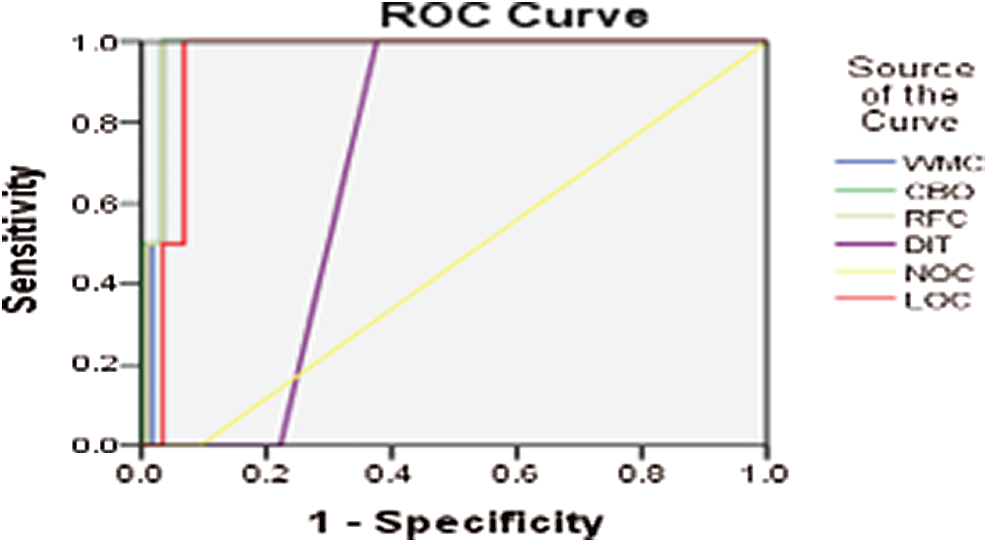
Figure 6: ROC curve for AUIL version 14-09
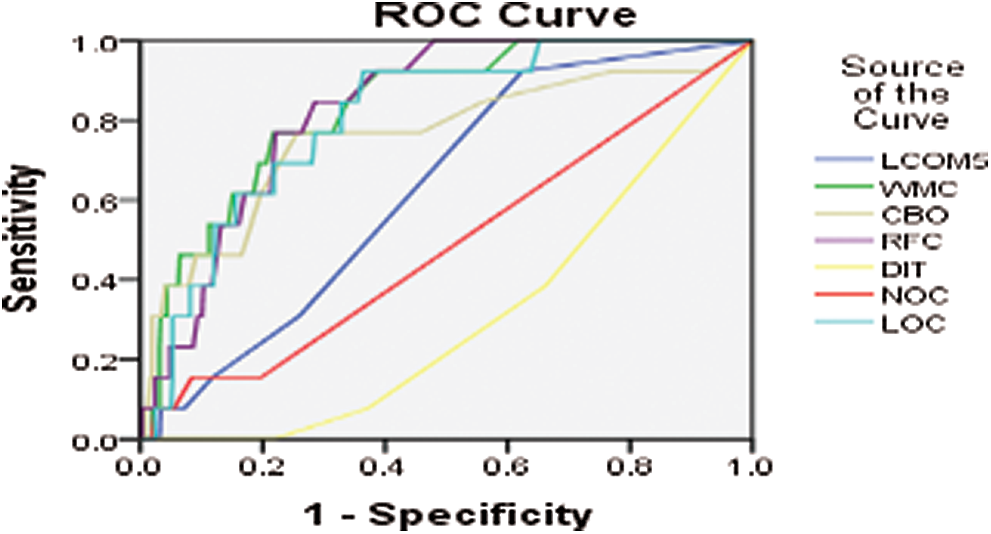
Figure 7: ROC curve for ANTLR4 version 2013-01
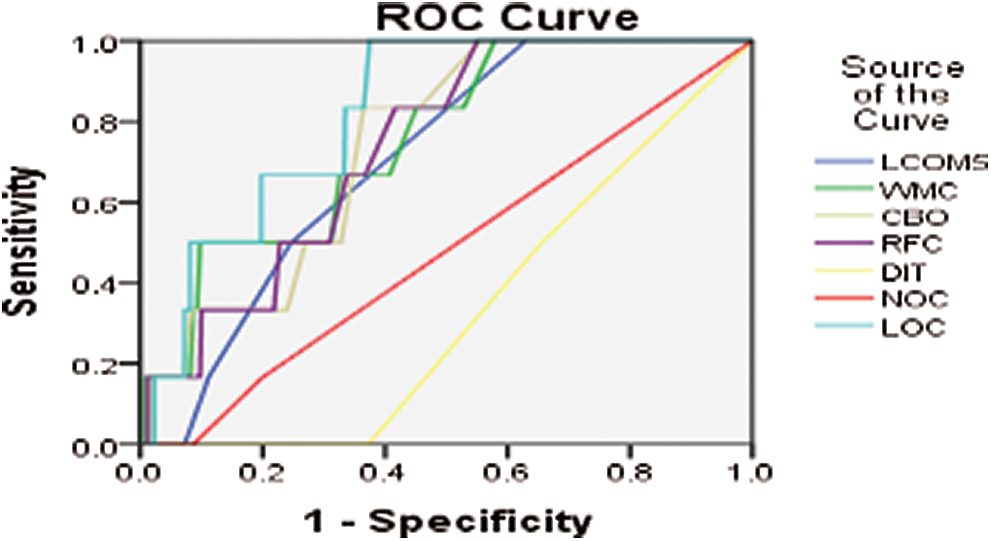
Figure 8: ROC curve for ANTLR4 version 2013-06
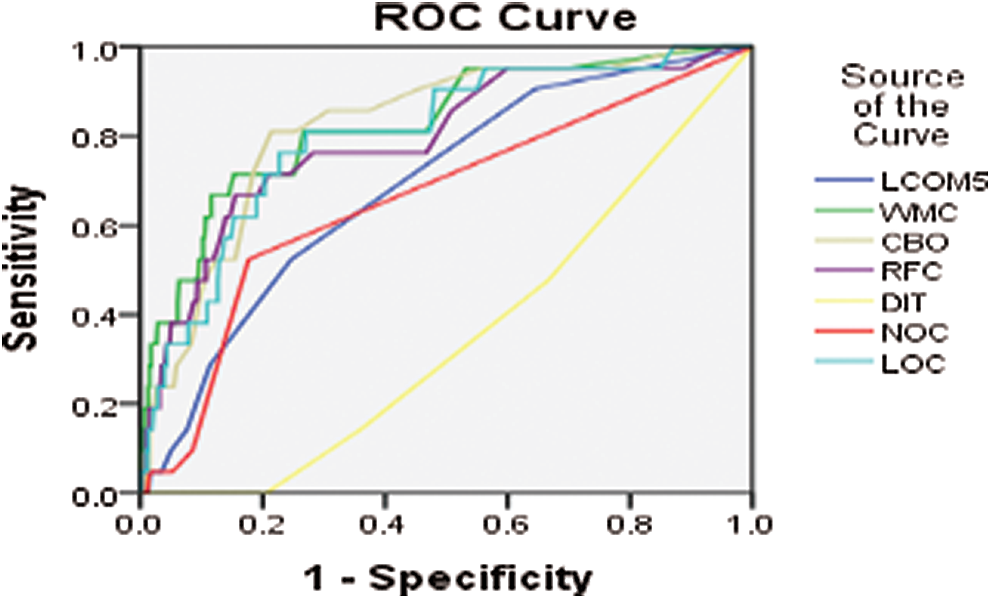
Figure 9: ROC curve for ANTLR4 version 2014-02
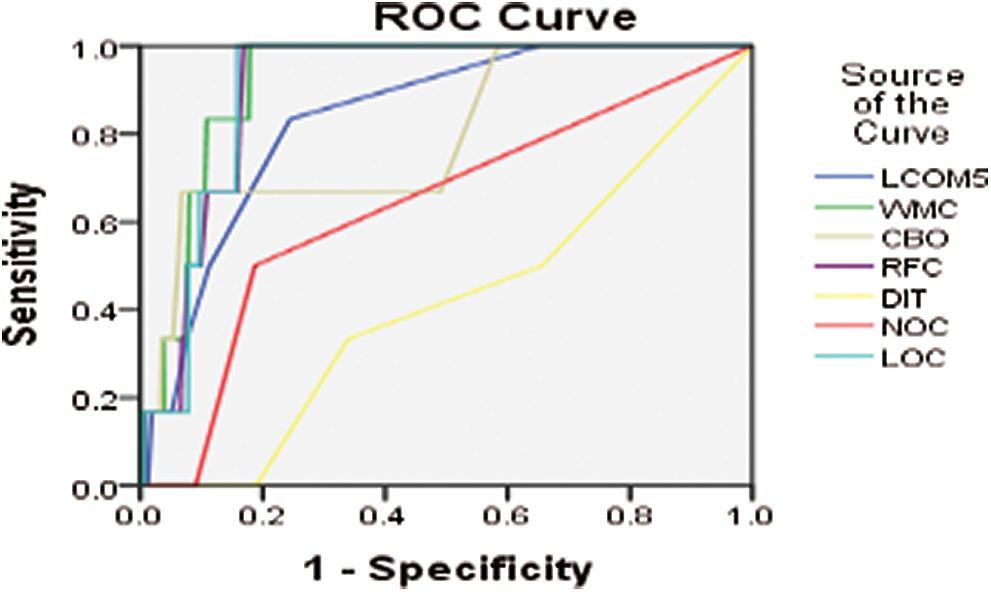
Figure 10: ROC curve for ANTLR4 version 2014-07
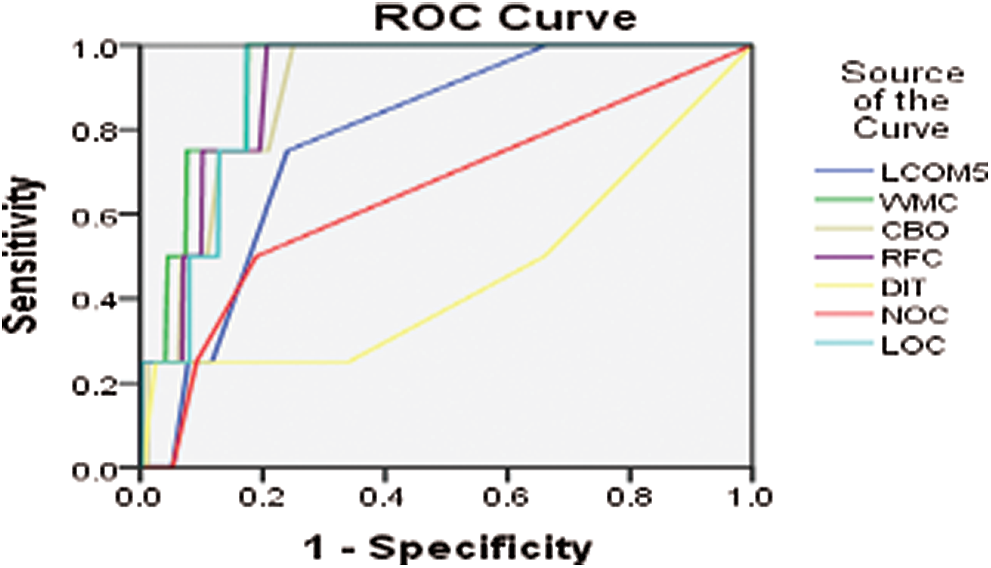
Figure 11: ROC curve for ANTLR4 version 2015-01
5.1.3 Broadleaf Commerce (BC) Project
The Broadleaf Commerce (BC) project is an e-commerce platform written entirely in the Java language. It facilitates the development of commerce-driven websites and provides a robust data model and the required tools. The BC platform is gradually increasing its features for more facilitation. Figs. 12–16 show the ROC curve for different versions of the BC project.
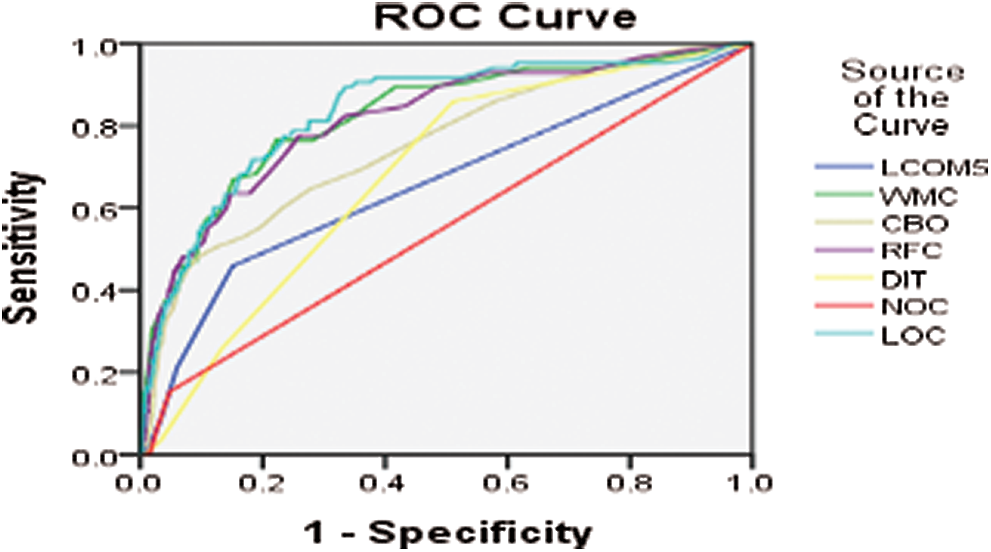
Figure 12: ROC curve for BC version 2013-02
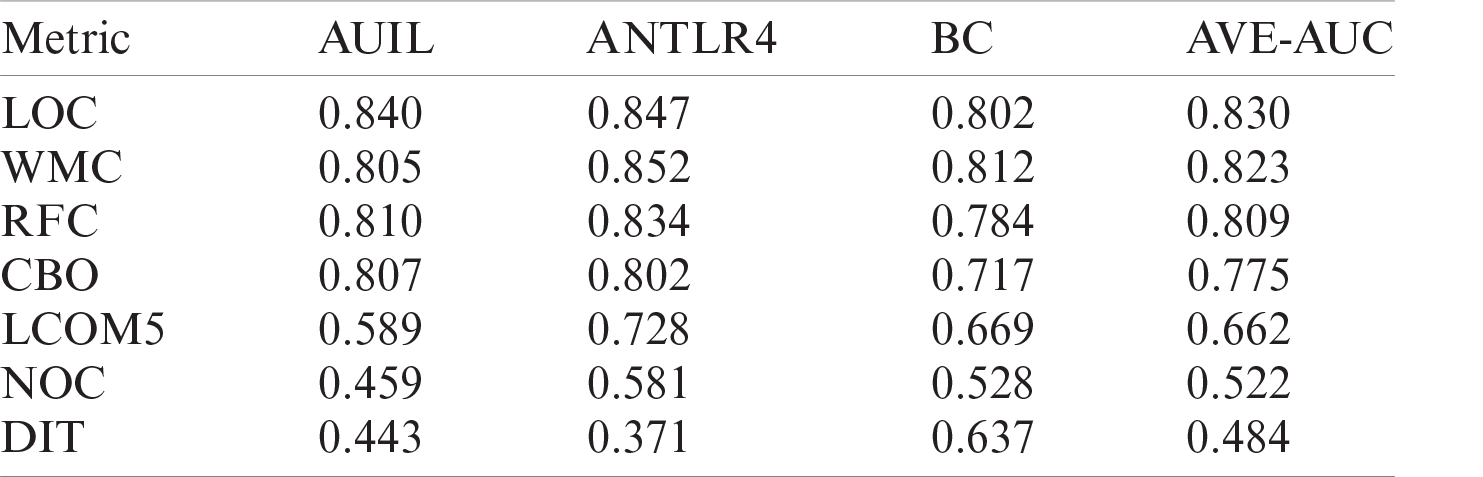
Further, for all the aforementioned three projects (i.e., AUIL, ANTLR4, and BC), the average of averages was calculated for comparison. Tab. 1 shows the average values of metrics for each project as well as the average of the averages. The results show that metrics such as NOC and DIT have a low AUC and are weak predictors, whereas LOC, WMC, RFC, and so on have a comparatively high AUC, and hence are strong predictors. The experiment was performed on three different real-world projects to overcome cross-project variations. Because NOC and DIT are weak predictors, they were excluded from the association rules. Only those metrics were selected for analysis that have high predictive power for defects. For this part, the R tool and rules with a high evaluation value were used. Evaluation measures such as support, confidence, correlation, Jaccard, and F-measure were used. The value of the evaluation of each rule for analysis of each project is given in Tab. 1.
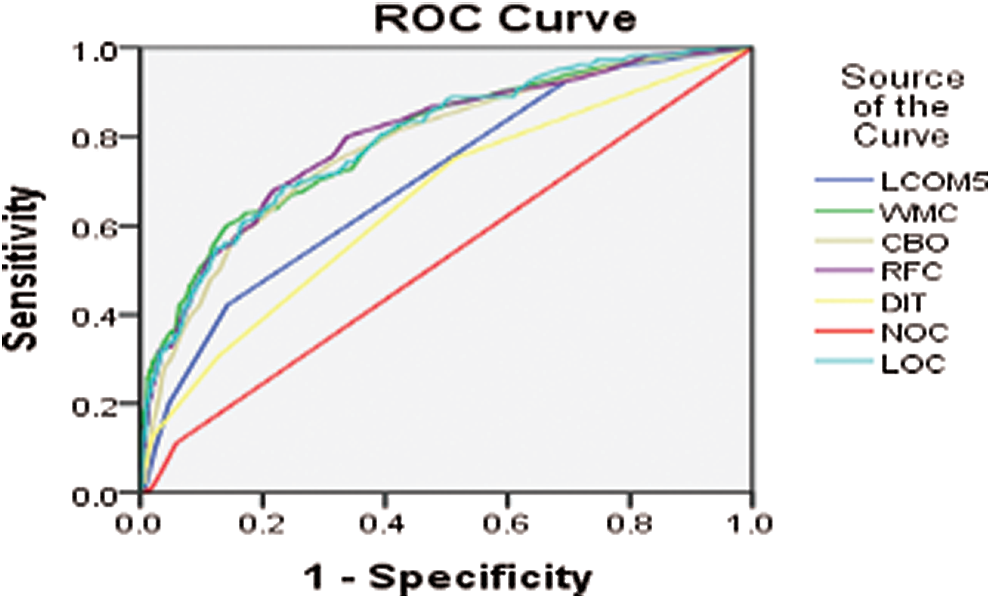
Figure 13: ROC curve for BC version 2013-09
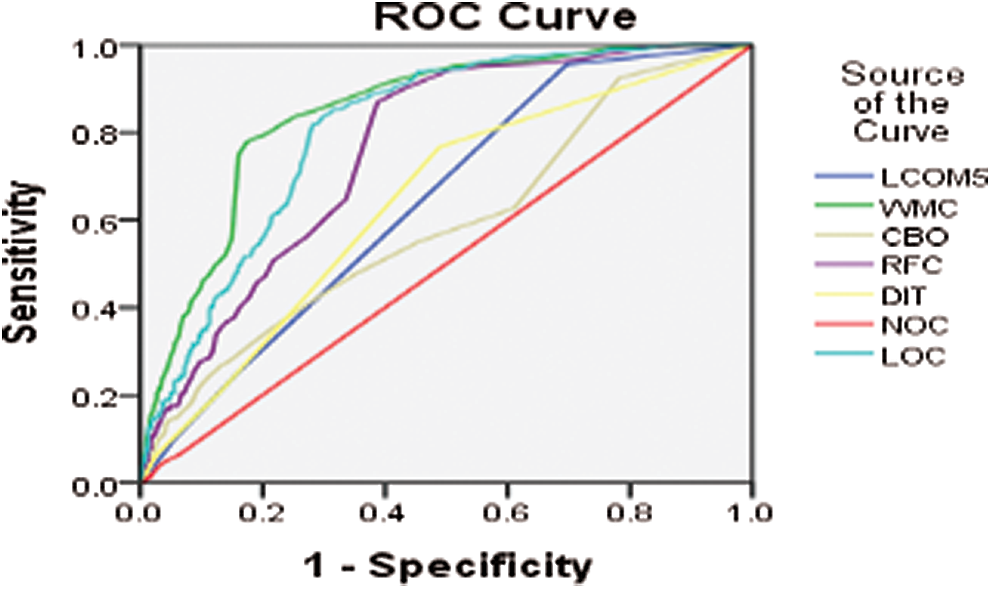
Figure 14: ROC curve for BC version 2014-03
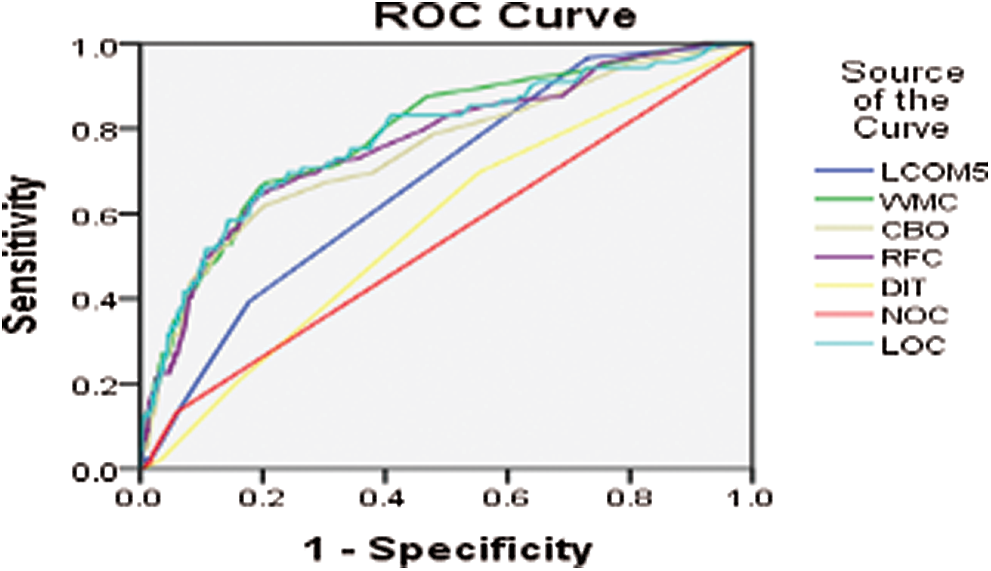
Figure 15: ROC curve for BC version 2014-10
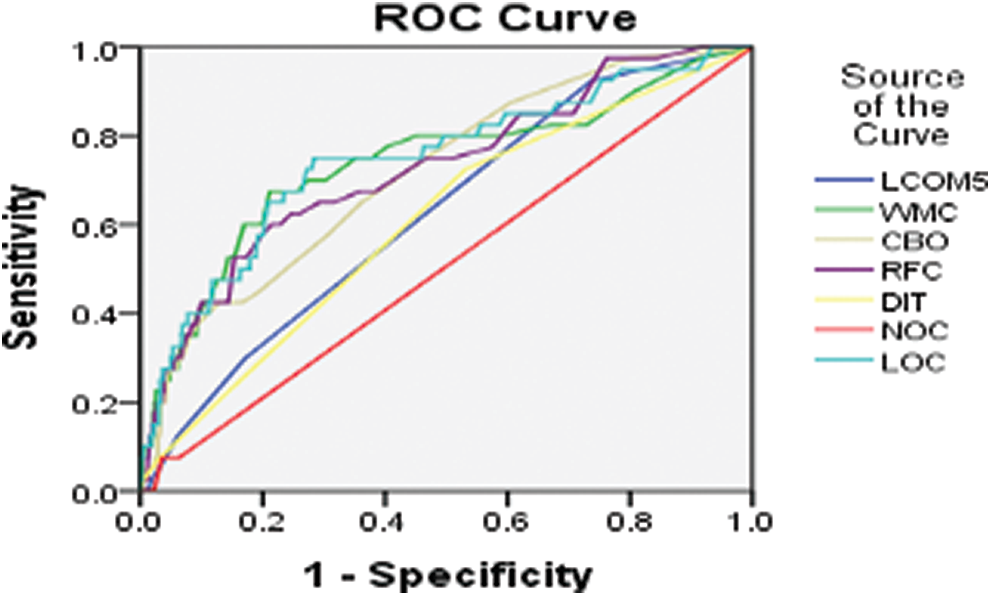
Figure 16: ROC curve for BC version 2015-03
Table 1: Average AUC of all projects
5.2 Analysis of Rules for Cleaning Bugs
This section presents the analysis of rules for cleaning bugs in all projects.
5.2.1 Analysis of Rules for Cleaning Bugs—BC Project
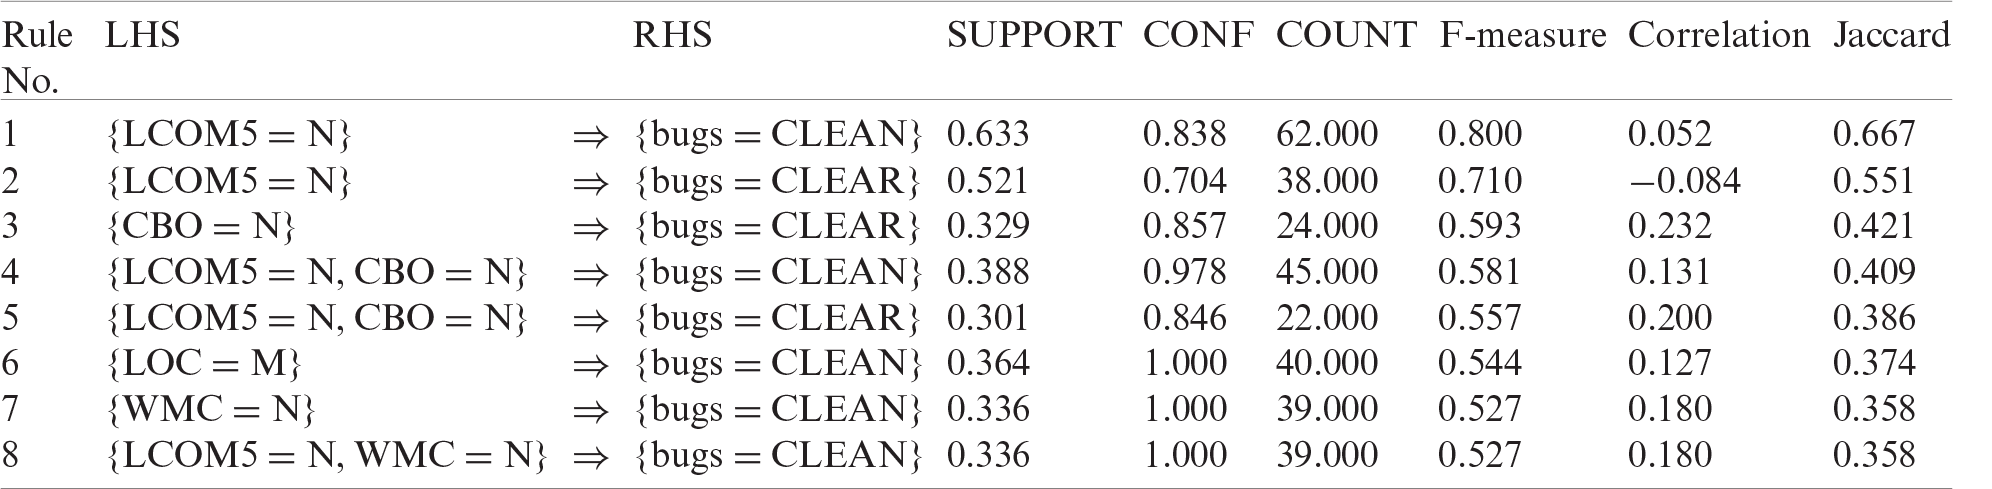
Tab. 2 shows the best rules for bug prediction using data from the BC project. This table shows different evaluation measures for each rule.
Table 2: Analysis of rules for cleaning bugs using BC project data
5.2.2 Analysis of Rules for Cleaning Bugs—AUIL Project
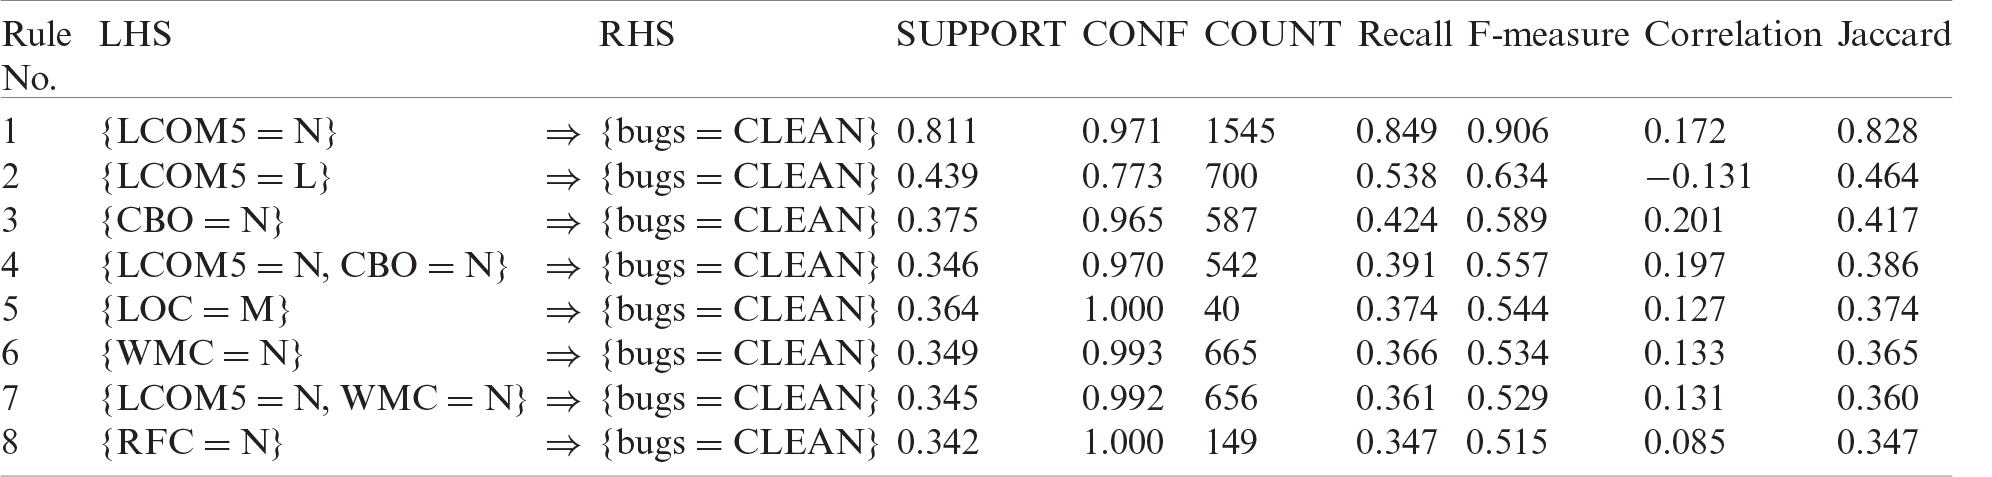
Tab. 3 shows the best rules for bug prediction using data from the AUIL project. This table shows different evaluation measures for each rule.
Table 3: Analysis of rules for cleaning bugs using AUIL project data
5.2.3 Analysis of Rules for Cleaning Bugs—ANTLR4 Project
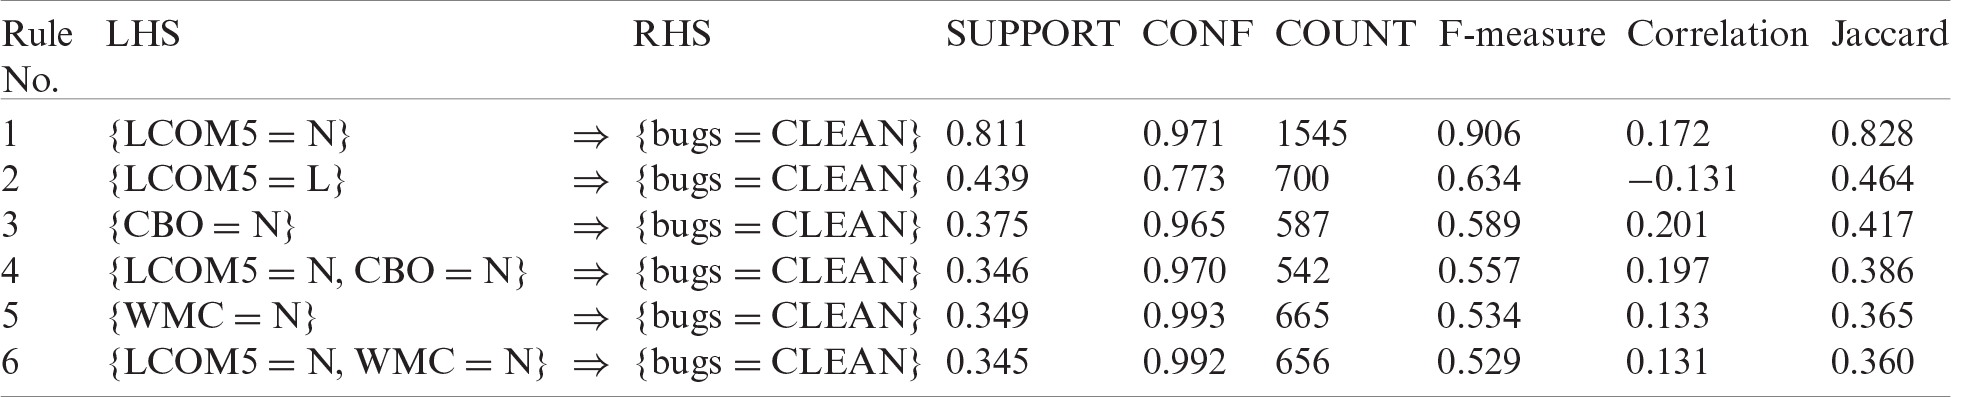
Tab. 4 shows the best rules for bug prediction using data from the ANTLR4 project. In this table, different evaluation measures for each rule are also shown. Tab. 5 lists the best rules for bug prediction by
Table 4: Analysis of rules for cleaning bugs using ANTLR4 project data
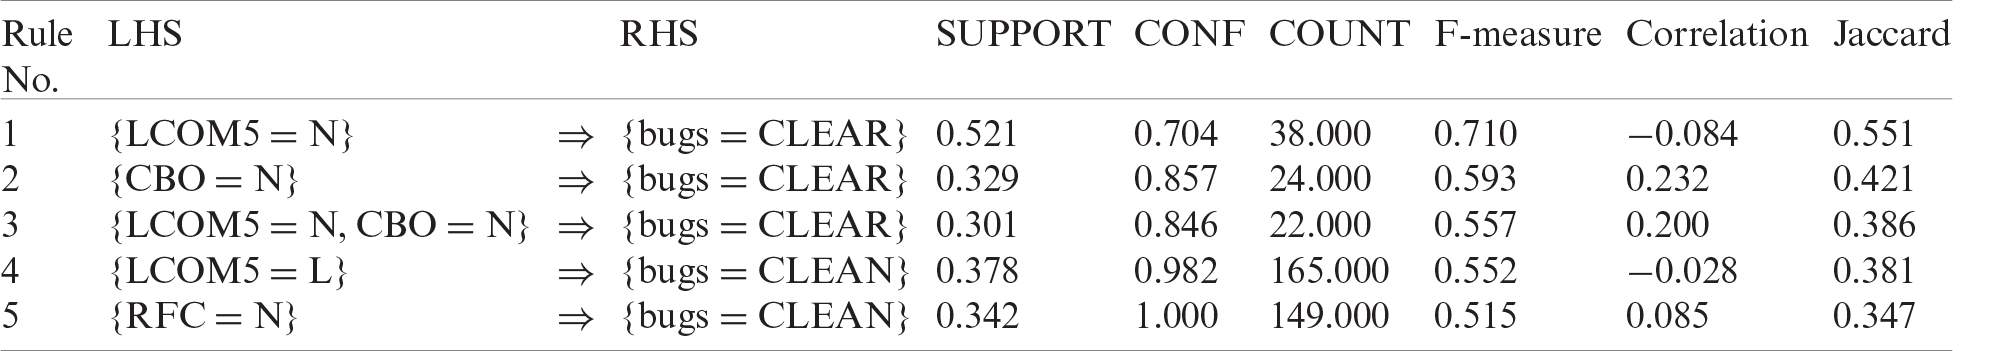
Table 5: Combination of all projects’ rules for cleaning bugs
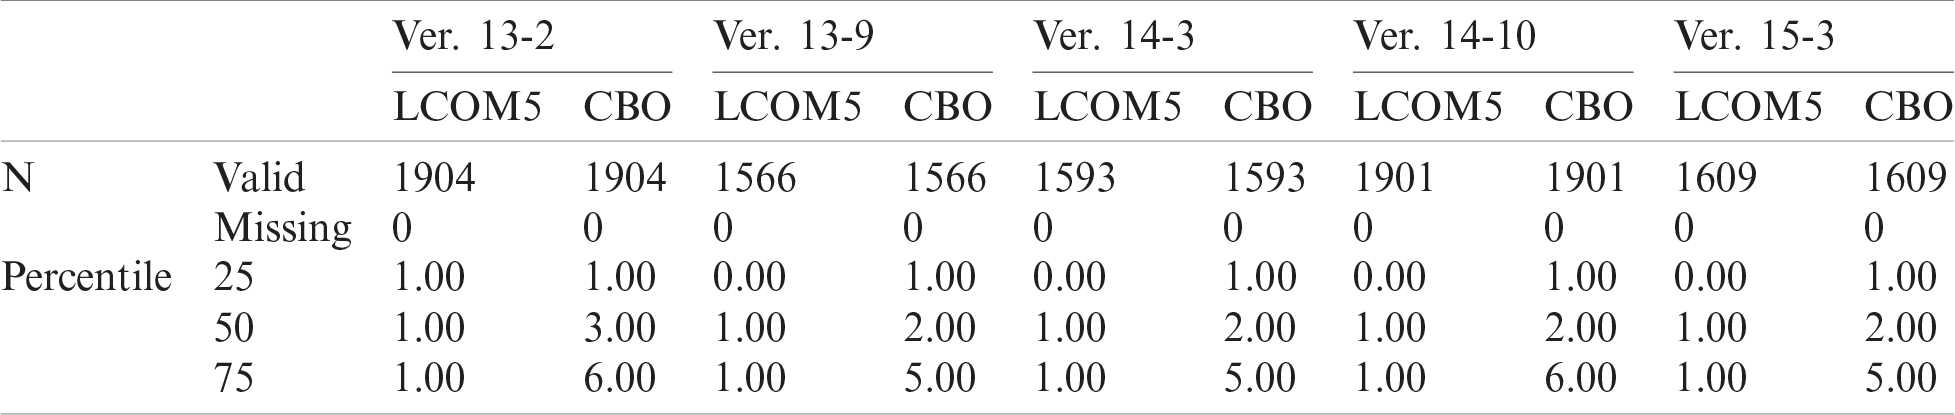
combining the rules for all the projects. This table shows the different evaluation measures for each rule. Rules 1–3 have the top values; hence, they are the best rules of our study. Tabs. 6–8 show the statistics of metrics LCOM5 and CBO for all three representative projects (i.e., AUIL, ANTLR4, and BC).
Table 6: Statistics of LCOM5 and CBO metrics—AUIL project
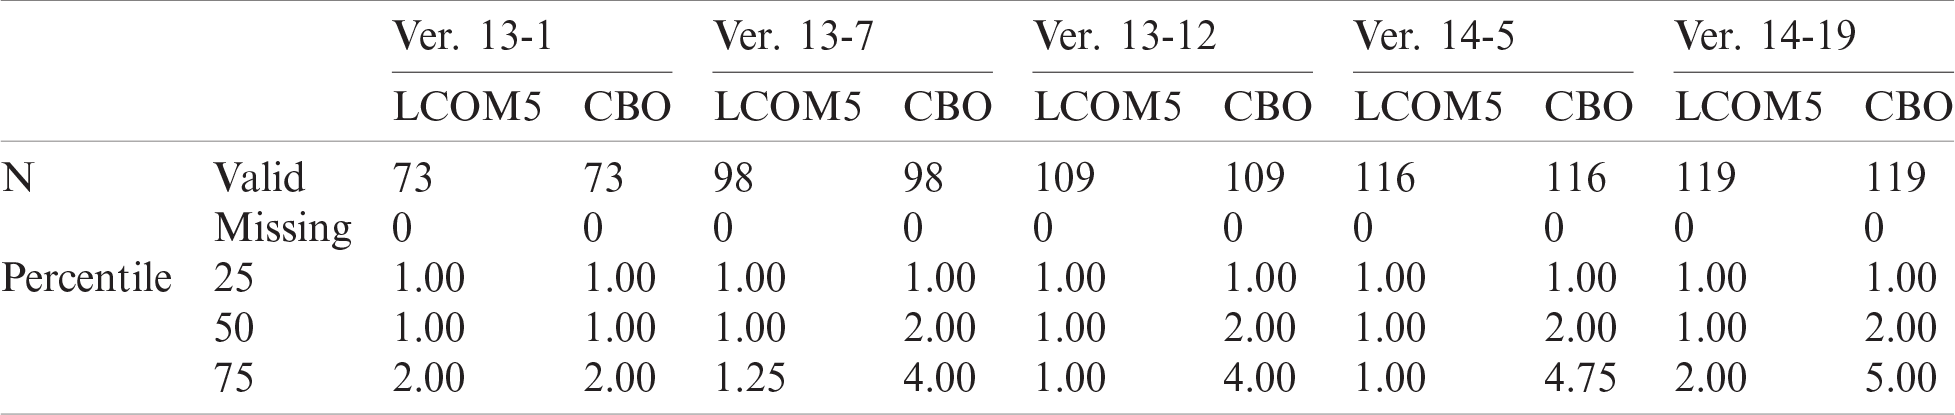
Table 7: Statistics of LCOM5 and CBO metrics—ANTLR4 project
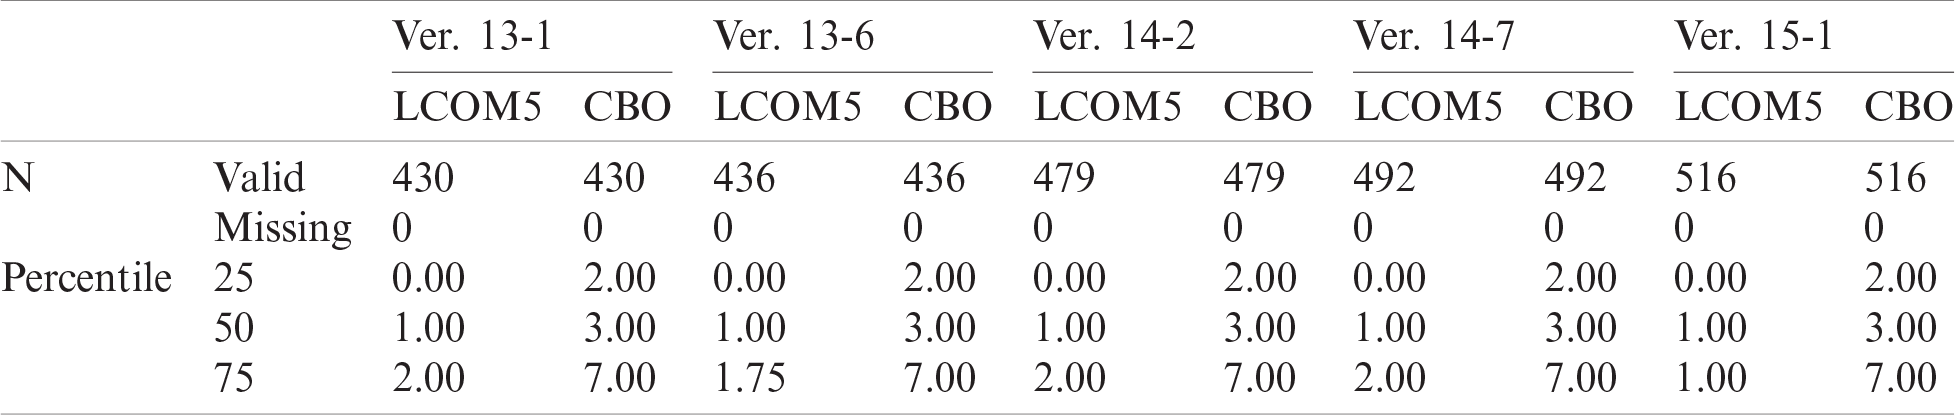
Table 8: Statistics of LCOM5 and CBO metrics—BC project
5.3 Testing of Candidate Rules
The four projects described in this section were compared and analyzed statistically to demonstrate the performance of the best-selected rules.
5.3.1 Test of Ceylon IDE for Eclipse Project
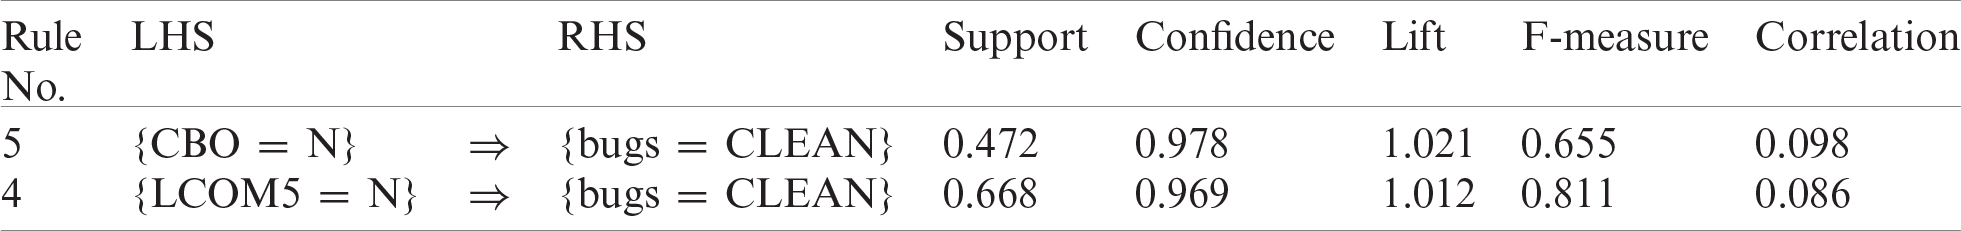
This project is a plugin for Eclipse. David Festal developed it from SERLI, a French software house, and donated it to the Ceylon project. By employing ARM, we extracted the best rules for each project and then filtered them using the selected rules from the previous analysis. Tab. 9 shows the best rules for bug prediction using data from the Ceylon IDE project for Eclipse. These promising results are significant. Tab. 10 shows F-measures and other performance measures for best rules discovered in the Ceylon IDE project for Eclipse. Here, we calculated the F-measure of the selected rules and found that its values were outstanding. The F-measure for rule {LCOM5 = N} is 0.811, which is excellent, and that for {CBO = N} is 0.655, which is very good. The rules are also valid for the Ceylon IDE project.
5.3.2 Test of Elasticsearch Project
Elasticsearch is a dispersed search engine specially made for the cloud environment. It is reliable, real-time, consistent, and easy to use. Other characteristics are a distributed and highly accessible search engine. It is multi-tenanted and supports a variety of APIs. It is also document-oriented and does not need
Table 9: Best rules found from Ceylon IDE project for eclipse
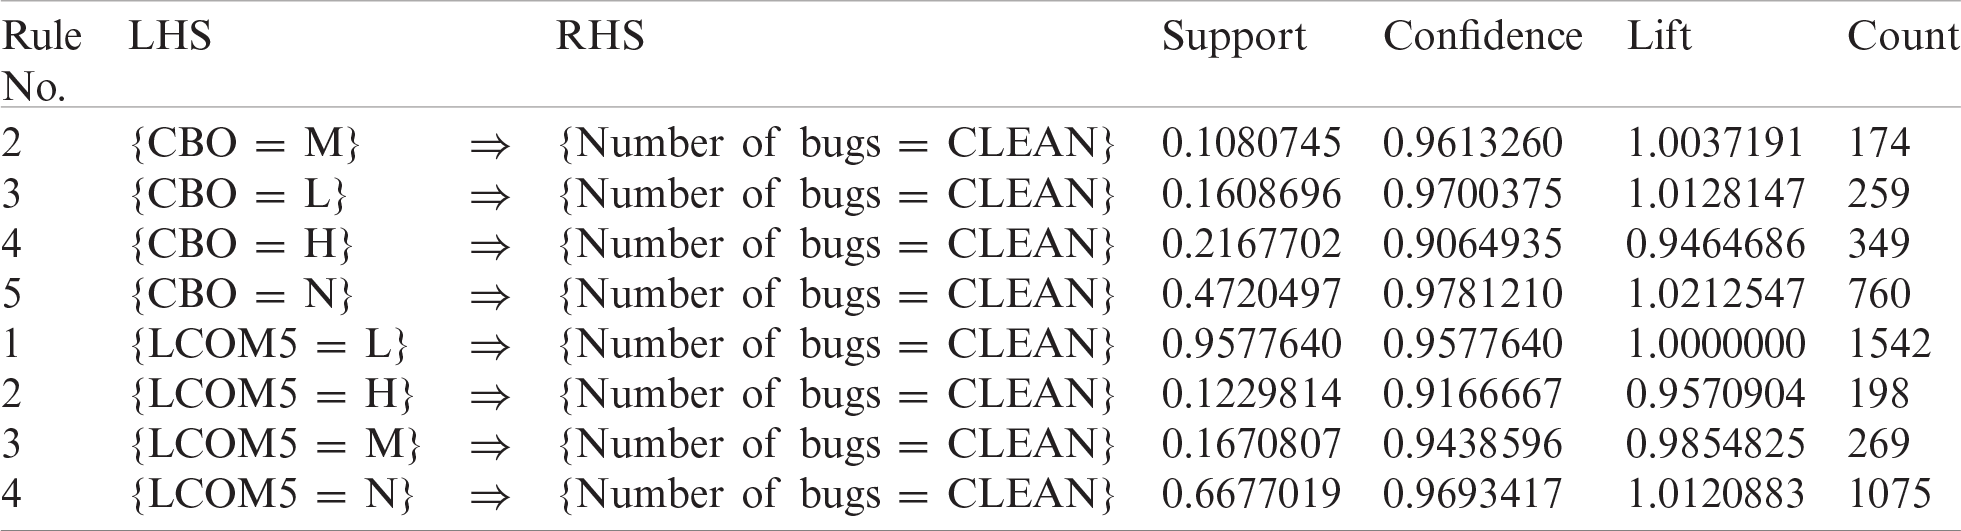
Table 10: Performance measures for best rules from Ceylon IDE project for eclipse
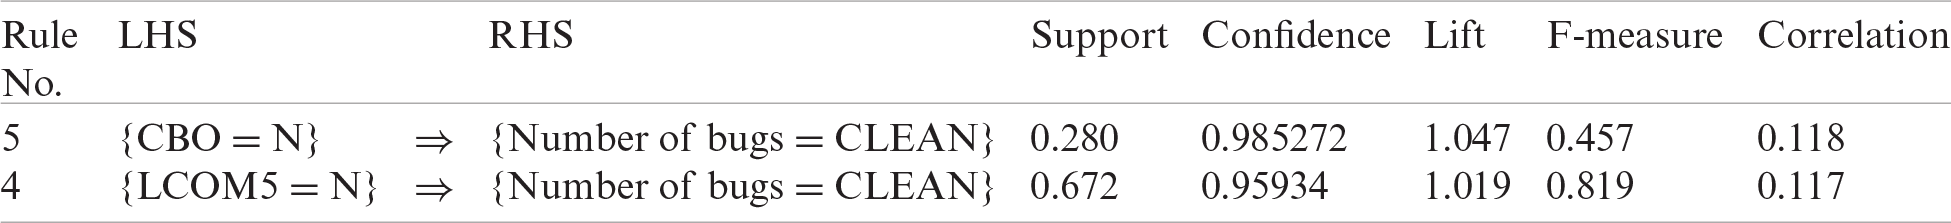
upfront schema definition. Schemas can be defined for customizing the indexing process, asynchronous write-behind for long-term persistency, near real-time search, and operational consistency. Tab. 11 shows the best rules for bug prediction using data from the Elasticsearch project. This table shows the evaluation for each rule using different performance metrics. Tab. 12 shows the F-measure and other performance indicators for the best rules discovered for Elasticsearch. The F-measure value for rule {LCOM5 = N} is 0.819, which is excellent, and for {CBO = N} it is 0.457, which is significant. Hence, these rules are also valid for the Elasticsearch project.
Table 11: Best rules found–elasticsearch project
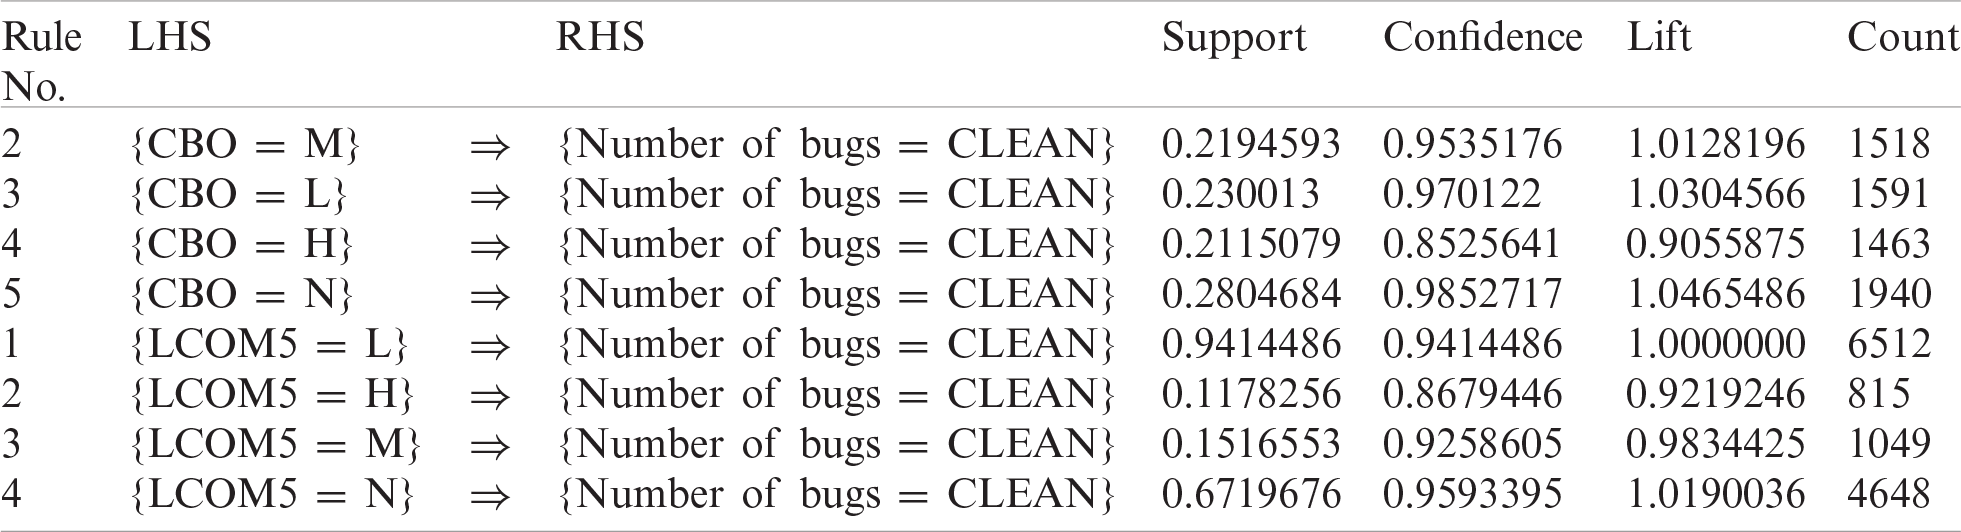
Table 12: Performance measures for best rules–elasticsearch project
5.3.3 Test of Hazelcast Project
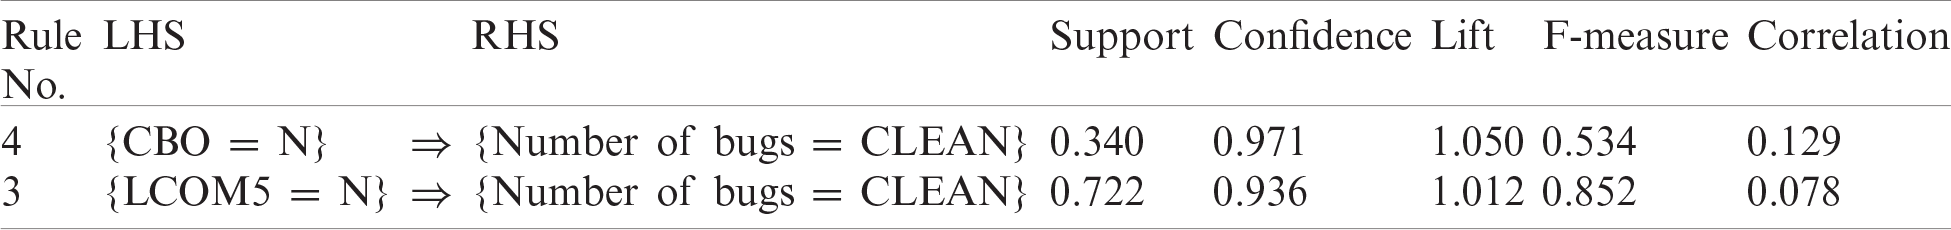
Hazelcast is an open-source distributed in-memory data store and computation platform. It provides a wide variety of distributed data structures and concurrency primitives. Tab. 13 shows the best rules for bug prediction using data from the Hazelcast project. This table shows the different performance metrics evaluated for each rule. Tab. 14 shows the F-measure and other performance measures for best rules discovered for the Hazelcast project. The F-measure for rule {LCOM5 = N} is 0.852, which is excellent, whereas for {CBO = N}, it is 0.534, which is good. Hence, these rules are also valid for Hazelcast.
Table 13: Best rules found—hazelcast project
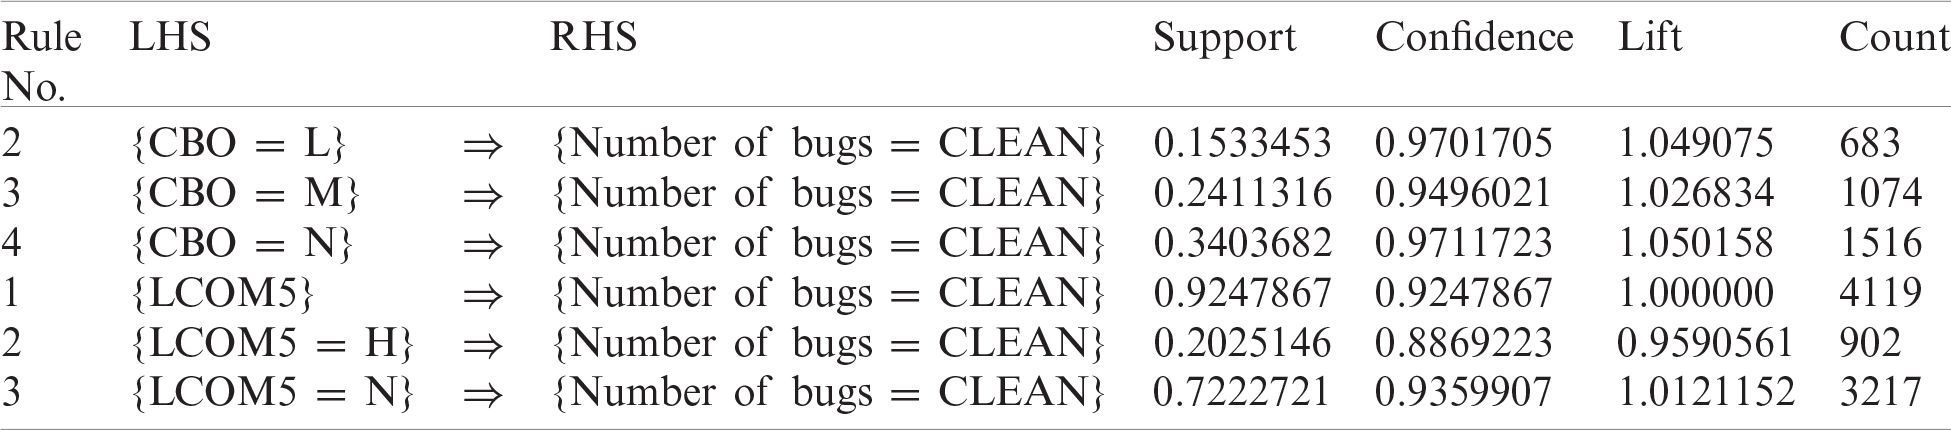
Table 14: Performance measures for best rules—hazelcast project
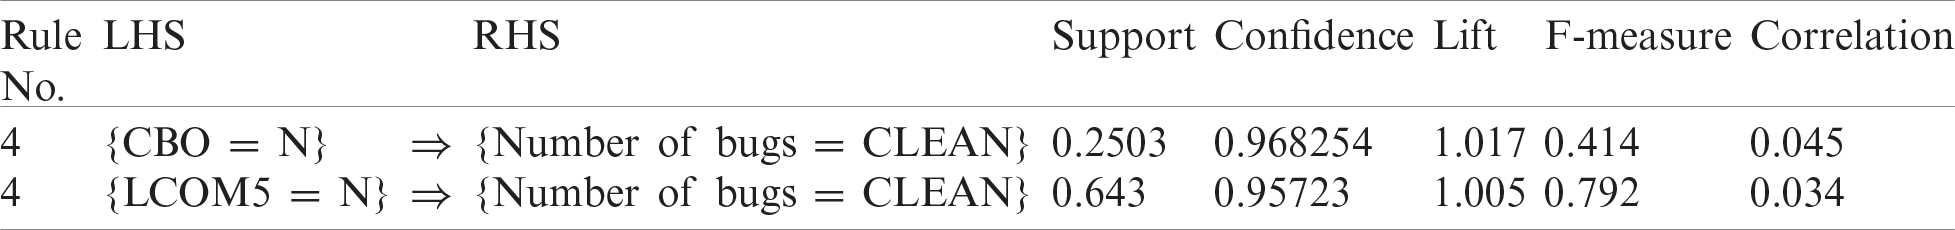
This project is used extensively for testing. Tab. 15 shows the best rules for bug prediction using data from the JUnit project. This table shows the different performance metrics for each rule. Tab. 16 shows the F-measure and other performance measures for the best rules discovered for the JUnit project.
The F-measure for rule {LCOM5 = N} is 0.792, which is excellent, and for {CBO = N}, it is 0.414, which is significant. Hence, these rules are also valid for the JUnit project. The F-measure of the two selected rules for each of the projects selected is very promising. Hence, these rules provide the best guidelines for defect prediction to improve the quality of software projects. We compared the results of the proposed approach with the results of the nearest neighbors and decision tree methods. The comparison shows a significant difference between the F-measure values of the proposed approach (i.e., greater than 60%) and current methods (i.e., less than 60%).
Table 15: Best rules found—JUnit project
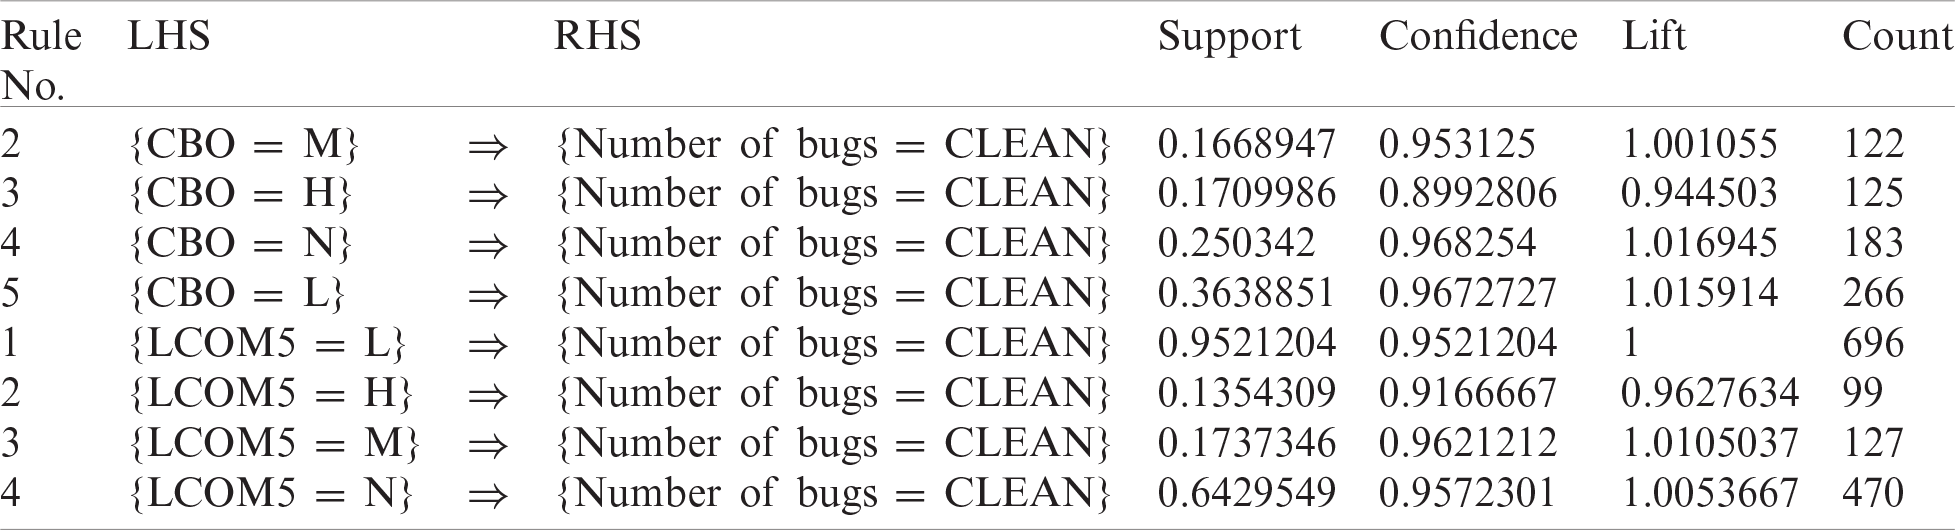
Table 16: Performance measures for best rules—JUnit project
In this study, we applied ARM and statistical analysis to determine whether a software class can be classified as clean or buggy. The rules selected through ARM are further evaluated in terms of their ability to classify the class as either impact error or zero impact error. Using the selected rules to classify classes will help improve software quality and reduce project costs. The rules were extracted from three projects according to their high-value F-measures and then tested on four other projects for their effectiveness. The experimental results demonstrate the applicability of the selected rules. Those metrics with a large AUC are used for extracting rules. This study also proposes a heuristic method for ranking association rules according to four constraints – support, confidence, F-measure, and correlation. The proposed approach produces the top association rules for any type of field. The predictor selected from this method also demonstrated promise in predicting the classes of the software projects selected using the ROC curve. Therefore, the proposed approach is useful for software evolution. For example, a software quality manager can allocate resources for any specific module based on the best association rules to save cost and time. Our method can find commercial and industrial solutions or a solution where the best choice is needed. We would like to extend this approach to future work by incorporating and analyzing more metrics such as complexity, inheritance, coupling, and size.
Funding Statement: This research was financially supported in part by the Ministry of Trade, Industry and Energy (MOTIE) and Korea Institute for Advancement of Technology (KIAT) through the International Cooperative R&D program. (Project No. P0016038) and in part by the MSIT (Ministry of Science and ICT), Korea, under the ITRC (Information Technology Research Center) support program (IITP-2021-2016-0-00312) supervised by the IITP (Institute for Information & communications Technology Planning & Evaluation).
Conflicts of Interest: The authors declare that they have no conflicts of interest to report regarding the present study.
1. P. Rajendran and M. Madheswaran, “Pruned associative classification technique for the medical image diagnosis system,” in Proc. of Second Int. Conf. on Machine Vision, Dubai, UAE: IEEE, pp. 293–297, 2009. [Google Scholar]
2. W. Li, J. Han and J. Pei, “CMAR: Accurate and efficient classification based on multiple class-association rules,” in Proc. of 2001 IEEE Int. Conf. on Data Mining, San Jose, CA, USA, pp. 369–376, 2001. [Google Scholar]
3. P. Rajendran and M. Madheswaran, “Hybrid medical image classification using association rule mining with decision tree algorithm,” Journal of Computing, vol. 2, no. 1, pp. 127–136, 2010. [Google Scholar]
4. B. L. W. H. Y. Ma, B. Liu and Y. Hsu, “Integrating classification and association rule mining,” in Proc. of the Fourth Int. Conf. on Knowledge Discovery and Data Mining, New York, NY, USA, 1998. [Google Scholar]
5. R. Srikant and R. Agrawal, “Mining quantitative association rules in large relational tables,” in Proc. of the 1996 ACM SIGMOD Int. Conf. on Management of Data ACM, Montreal Quebec, Canada, pp. 1–12, 1996. [Google Scholar]
6. N. J. Pizzi, “A fuzzy classifier approach to estimating software quality,” Information Sciences, vol. 241, pp. 1–11, 2013. [Google Scholar]
7. R. H. Chang, X. D. Mu and L. Zhang, “Software defect prediction using non-negative matrix factorization,” Journal of Software, vol. 6, no. 11, pp. 2114–2120, 2011. [Google Scholar]
8. B. Singh and A. Mustafi, “A novel approach to rank association rules using genetic algorithm,” International Journal of Current Engineering and Technology, vol. 4, pp. 850–859, 2014. [Google Scholar]
9. R. Agrawal, T. Imieliński and A. Swami, “Mining association rules between sets of items in large databases,” in Proc. of the 1993 ACM SIGMOD Int. Conf. on Management of Data, Washington D.C., USA, pp. 207–216, 1993. [Google Scholar]
10. M. R. Devi, “Applications of association rule mining in different databases,” Journal of Global Research in Computer Science, vol. 3, no. 8, pp. 30–34, 2012. [Google Scholar]
11. P. N. Tan, V. Kumar and J. Srivastava, “Selecting the right interestingness measure for association patterns,” in Proc. of the Eighth ACM SIGKDD Int. Conf. on Knowledge Discovery and Data Mining, Edmonton Alberta, Canada, pp. 32–41, 2002. [Google Scholar]
12. A. Silberschatz and A. Tuzhilin, “What makes patterns interesting in knowledge discovery systems,” IEEE Transactions on Knowledge and Data Engineering, vol. 8, no. 6, pp. 970–974, 1996. [Google Scholar]
13. M. Shweta and D. K. Garg, “Mining efficient association rules through apriori algorithm using attributes and comparative analysis of various association rule algorithms,” International Journal of Advanced Research in Computer Science and Software Engineering, vol. 3, no. 6, pp. 306–312, 2013. [Google Scholar]
14. J. Singh, H. Ram and D. J. Sodhi, “Improving efficiency of apriori algorithm using transaction reduction,” International Journal of Scientific and Research Publications, vol. 3, no. 1, pp. 1–4, 2013. [Google Scholar]
15. J. Sese and S. Morishita, “Answering the most correlated n association rules efficiently,” in Proc. of European Conf. on Principles of Data Mining and Knowledge Discovery, Helsinki, Finland, pp. 410–422, 2002. [Google Scholar]
16. S. Ghosh, S. Biswas, D. Sarkar and P. P. Sarkar, “Mining frequent itemsets using genetic algorithm,” International Journal of Artificial Intelligence & Applications, vol. 1, no. 4, pp. 133–143, 2010. [Google Scholar]
17. G. Czibula, Z. Marian and I. G. Czibula, “Software defect prediction using relational association rule mining,” Information Sciences, vol. 264, no. 7, pp. 260–278, 2014. [Google Scholar]
18. E. Baralis, L. Cagliero, T. Cerquitelli and P. Garza, “Generalized association rule mining with constraints,” Information Sciences, vol. 194, pp. 68–84, 2012. [Google Scholar]
19. B. Liu, Y. Ma and C. K. Wong, “Classification using association rules: Weaknesses and enhancements,” in Proc. of Data Mining for Scientific and Engineering Applications, Boston, MA, USA, vol. 2, pp. 591–605, 2001. [Google Scholar]
20. T. Menzies, B. Caglayan, E. Kocaguneli, J. Krall, F. Peters et al., “The promise repository of empirical software engineering data,” West Virginia University, Department of Computer Science, USA, 2012. [Online]. Available: http://promise.site.uottawa.ca/SERepository/. [Google Scholar]
21. B. Ma, K. Dejaeger, J. Vanthienen and B. Baesens, “Software defect prediction based on association rule classification,” Available SSRN 1785381, 2011. [Online]. Available: http://dx.doi.org/10.2139/ssrn.1785381. [Google Scholar]
22. Y. Kamei, A. Monden, S. Morisaki and K. I. Matsumoto, “A hybrid faulty module prediction using association rule mining and logistic regression analysis,” in Proc. of the Second ACM-IEEE Int. Symp. on Empirical Software Engineering and Measurement, Kaiserslautern, Germany, pp. 279–281, 2008. [Google Scholar]
23. D. Rodríguez, R. Ruiz, J. C. Riquelme and J. S. Aguilar-Ruiz, “Searching for rules to detect defective modules: A subgroup discovery approach,” Information Sciences, vol. 191, pp. 14–30, 2012. [Google Scholar]
24. W. Zhang, Z. Y. Ma, Q. L. Lu, X. B. Nie and J. Liu, “Research on software defect prediction method based on machine learning,” in Applied Mechanics and Materials. vol. 687. Baech, Switzerland: Trans Tech Publications Ltd., pp. 2182–2185, 2014. [Google Scholar]
25. V. U. B. Challagulla, F. B. Bastani, I. L. Yen and R. A. Paul, “Empirical assessment of machine learning based software defect prediction techniques,” International Journal on Artificial Intelligence Tools, vol. 17, no. 2, pp. 389–400, 2008. [Google Scholar]
26. R. C. Holte, “Very simple classification rules perform well on most commonly used datasets,” Machine Learning, vol. 11, no. 1, pp. 63–90, 1993. [Google Scholar]
27. A. S. Haghighi, M. A. Dezfuli and S. M. Fakhrahmad, “Applying mining schemes to software fault prediction: A proposed approach aimed at test cost reduction,” in Proc. of the World Congress on Engineering, London, U.K, vol. 1, pp. 4–6, 2012. [Google Scholar]
28. Y. Jiang, M. Li and Z. H. Zhou, “Software defect detection with rocus,” Journal of Computer Science and Technology, vol. 26, no. 2, pp. 328–342, 2011. [Google Scholar]
29. M. Li, H. Zhang, R. Wu and Z. H. Zhou, “Sample-based software defect prediction with active and semi-supervised learning,” Automated Software Engineering, vol. 19, no. 2, pp. 201–230, 2012. [Google Scholar]
30. L. Guo, Y. Ma, B. Cukic and H. Singh, “Robust prediction of fault-proneness by random forests,” in Proc. of 15th Int. Symp. on Software Reliability Engineering, Saint-Malo, Bretagne, France, pp. 417–428, 2004. [Google Scholar]
31. Q. Song, Z. Jia, M. Shepperd, S. Ying and J. Liu, “A general software defect-proneness prediction framework,” IEEE Transactions on Software Engineering, vol. 37, no. 3, pp. 356–370, 2010. [Google Scholar]
32. M. D’Ambros, M. Lanza and R. Robbes, “Evaluating defect prediction approaches: A benchmark and an extensive comparison,” Empirical Software Engineering, vol. 17, no. 4–5, pp. 531–577, 2012. [Google Scholar]
33. D. Gray, D. Bowes, N. Davey, Y. Sun and B. Christianson, “Further thoughts on precision,” in Proc. of 15th Annual Conf. on Evaluation & Assessment in Software Engineering, Durham, UK, pp. 129–133, 2011. [Google Scholar]
34. V. R. Basili, L. C. Briand and W. Melo, “A validation of object-oriented design metrics. College Park, MD, 20742 USA: University of Maryland, Dept. of Computer Science, Technical Report, 1995. [Google Scholar]
35. S. Kanmani, V. R. Uthariaraj, V. Sankaranarayanan and P. Thambidurai, “Object oriented software quality prediction using general regression neural networks,” ACM SIGSOFT Software Engineering Notes, vol. 29, no. 5, pp. 1–6, 2004. [Google Scholar]
36. N. Nagappan, L. Williams, M. Vouk and J. Osborne, “Early estimation of software quality using in-process testing metrics: A controlled case study,” ACM SIGSOFT Software Engineering Notes, vol. 30, no. 4, pp. 1–7, 2005. [Google Scholar]
37. H. M. Olague, L. H. Etzkorn, S. Gholston and S. Quattlebaum, “Empirical validation of three software metrics suites to predict fault-proneness of object-oriented classes developed using highly iterative or agile software development processes,” IEEE Transactions on Software Engineering, vol. 33, no. 6, pp. 402–419, 2007. [Google Scholar]
38. Z. Tóth, P. Gyimesi and R. Ferenc, “A public bug database of github projects and its application in bug prediction,” in Proc. of Int. Conf. on Computational Science and Its Applications, Beijing, China, pp. 625–638, 2016. [Google Scholar]
39. C. Williams and J. Spacco, “SZZ revisited: Verifying when changes induce fixes,” in Proc. of the 2008 Workshop on Defects in Large Software System, Seattle Washington, USA, pp. 32–36, 2008. [Google Scholar]
40. D. Kumari and K. Rajnish, “A new approach to find predictor of software fault using association rule mining,” International Journal of Engineering and Technology, vol. 7, no. 5, pp. 1671–1684, 2015. [Google Scholar]
41. M. H. Zweig and G. Campbell, “Receiver-operating characteristic (ROC) plots: A fundamental evaluation tool in clinical medicine,” Clinical Chemistry, vol. 39, no. 4, pp. 561–577, 1993. [Google Scholar]
 | This work is licensed under a Creative Commons Attribution 4.0 International License, which permits unrestricted use, distribution, and reproduction in any medium, provided the original work is properly cited. |