DOI:10.32604/cmc.2021.016495
| Computers, Materials & Continua DOI:10.32604/cmc.2021.016495 | |
| Article |
Locating Famous Tea’s Picking Point Based on Shi-Tomasi Algorithm
1Faculty of Mechanical Engineering & Automation, Zhejiang Sci-Tech University, Hangzhou, 310018, China
2Key Laboratory of Transplanting Equipment and Technology of Zhejiang Province, Hangzhou, 310018, China
3Ingram School of Engineering, Texas State University, San Marcos, Texas, USA
*Corresponding Author: Chuanyu Wu. Email: cywu@zstu.edu.cn
Received: 03 January 2021; Accepted: 24 March 2021
Abstract: To address the difficulty of locating the picking point of a tea sprout during the intelligent automatic picking of famous tea, this study proposes a method to obtain information on the picking point on the basis of the Shi-Tomasi algorithm. This method can rapidly identify a tea sprout’s picking point and obtain its coordinates. Images of tea sprouts in a tea garden were collected, and the G-B component of tea sprouts was segmented using the Otsu algorithm. The region of interest was set with the lowest point of its contour as the center. The characteristics of tea buds and branches in the area were extracted, and the Otsu algorithm was used for a second segmentation of tea sprout images. The tea buds were segmented using the improved Zhang algorithm. The branch feature binary image was used to refine the skeleton, and the Shi-Tomasi algorithm was used to detect the corners of the skeleton and calculate and mark the picking points of the shoots. Sixty sets of samples were tested. The test identified 1,042 effective shoots for tender buds, and 887 picking points were marked, with a success rate of 85.12%, thereby verifying the effectiveness of the method and providing a theoretical reference for the visual positioning of the automatic picking of famous tea.
Keywords: Famous tea; picking location; Zhang algorithm; Shi-Tomasi algorithm
The automatic recognition and positioning of picking points is a key technology enabling modern agricultural robots to achieve automatic and precise picking. Scholars have conducted considerable research on this topic because of the wide application of intelligent picking robots and the development of artificial intelligence recognition [1–5]. Liang et al. [6] calculated the position information of the picking point of tomato fruit bunch stems on the basis of the corner points of the stem skeleton, achieving a success rate of 90%. Yang et al. [7] constructed a recognition and positioning system based on a convolutional neural network and Kinect V2 for a citrus-picking robot. Huang et al. [8] realized the accurate positioning of objects on the basis of SSD detection and built the Kinect V2 three-dimensional measurement model. Xiong et al. [9] used Hough line fitting and the angle constraint method to realize the positioning of disturbed grape picking points, obtaining an accuracy rate of 80%. Wang et al. [10] proposed an apple target picking point location method based on the contour symmetry axis. Luo et al. [11] proposed a grape picking point location method based on improved clustering image segmentation and a minimum distance constraint between points and lines.
“Famous tea” is a general term for high-quality tea, with strict requirements on the growth environment, picking time, picking method, and picking quality of the tea itself. The high-efficiency and high-quality picking of famous tea is desired. Vision-based automatic picking robots have come into use for picking famous teas. The automatic identification and positioning of picking points is a difficulty that limits the development of these robots. Few studies have been conducted on the positioning of famous tea picking points. Zhang et al. [12] proposed a tender shoot positioning method based on active vision. Pei et al. [13] marked the center of the circumscribed rectangle of the tea outline as the picking point.
Famous tea is lightweight; hence it swings easily because of wind or the movement of a picking machine. A tea garden has a complex environment, with tea leaves blocking each other. Light can be too strong or dark, resulting in low-resolution images of tea sprouts and old leaves. Therefore, it is difficult to identify and locate the shoot picking points, which restricts automated picking. To realize the rapid identification and positioning of picking points, ensure the efficiency of picking machines, and meet high quality requirements, this study proposes an automatic identification method for famous tea picking points based on the Shi-Tomasi algorithm.
2 Recognition Algorithm Based on Shi-Tomasi
Fig. 1 shows the algorithm’s flowchart. The original image of tea growth and distribution is collected by an industrial camera. Image preprocessing is performed for raw image noise reduction, and the Otsu algorithm is used to segment the images to obtain a contour map of the tea sprouts. The lowest point of each contour is searched, the region of interest (ROI) of a single sprout is set, and the characteristics of sprouts and their growth branches are extracted. A second image segmentation and morphological processing are performed on these characteristics. The Otsu algorithm is used to binarize the image, and a morphological method is used to remove the noise of the binary image in post-processing. The skeleton of the sprouts and branches is refined using the improved Zhang thinning algorithm, and the Shi-Tomasi algorithm is used to extract the corner point at a bifurcation and obtain their coordinates. A line segment is fitted between the corner point and the lowest point. The center point’s coordinates are calculated as the coordinates of picking points, which are marked in the original image.
3 Target Recognition of Tea Sprouts
3.1 Image Segmentation of Tea Sprouts
The initial segmentation of the tea sprouts is the basis for the accurate positioning of the picking points. We use the Otsu algorithm to perform the initial segmentation of the tea sprouts under the RGB model, and a 3 × 3 convolution kernel for Gaussian filtering of the collected tea image noise. For the tea sprouts shown in Fig. 2a, the differentiation degree between old leaves and tea sprouts is most obvious among the G-B components of the image in Fig. 2b. Thus the G-B component is used as the input source for image segmentation. The segmentation effect is shown in Fig. 2c. Some small, wrong target points or contours still exist because of noise and for other reasons. Morphological procedures facilitate later operations. The result is shown in Fig. 2d. The small contours caused by noise and other factors have been filtered out.
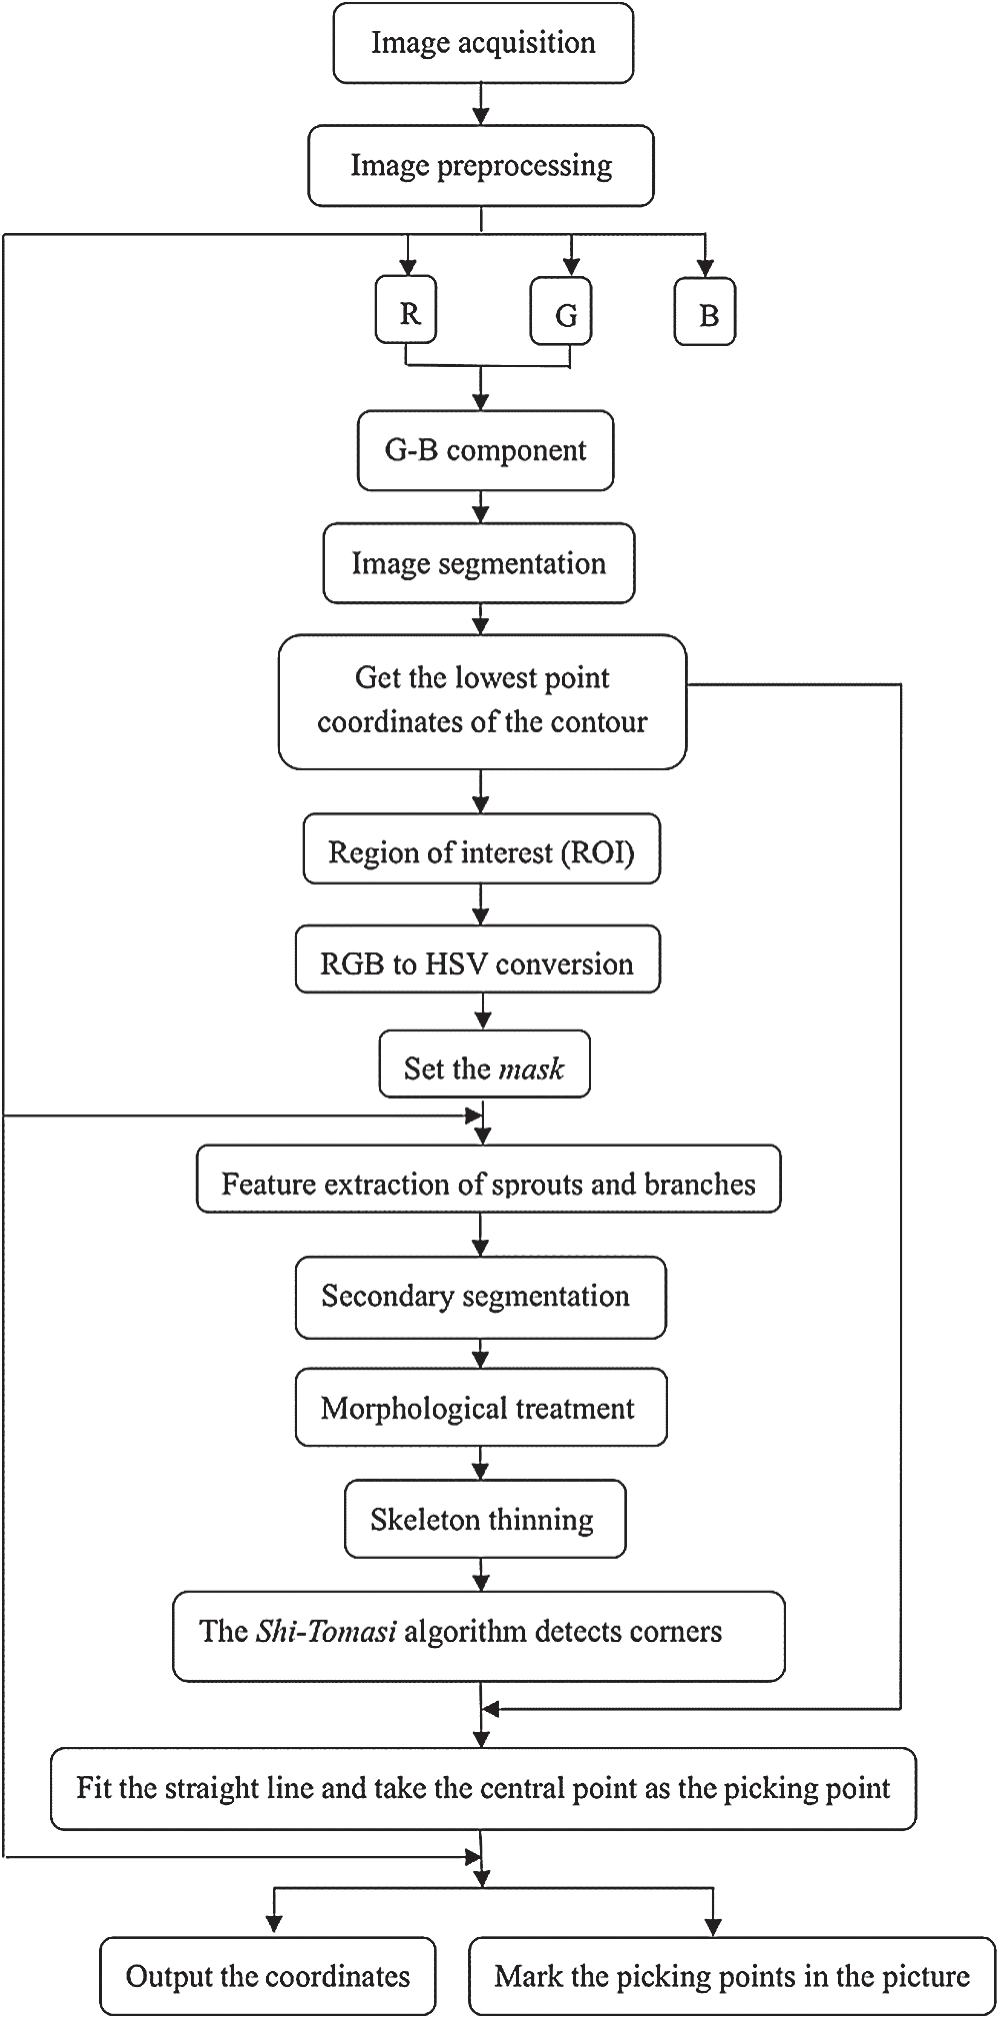
Figure 1: Flowchart of recognition algorithm based on Shi-Tomasi
3.2 Setting the ROI of Tea Sprouts
To reduce the influence of factors irrelevant to the picking point, and to reduce the number of pixels and improve the real-time performance of image processing, each sprout in image acquisition has its own ROI. Only this region is regarded as the target when identifying the picking point object. Based on research and experiments, the following search algorithm for setting the ROI with the lowest point of the contour of tea sprouts as the center is proposed.
(1) The edge points of each contour, as shown in Fig. 2c, are traversed. The lowest and highest points of contours are found, with coordinates set as
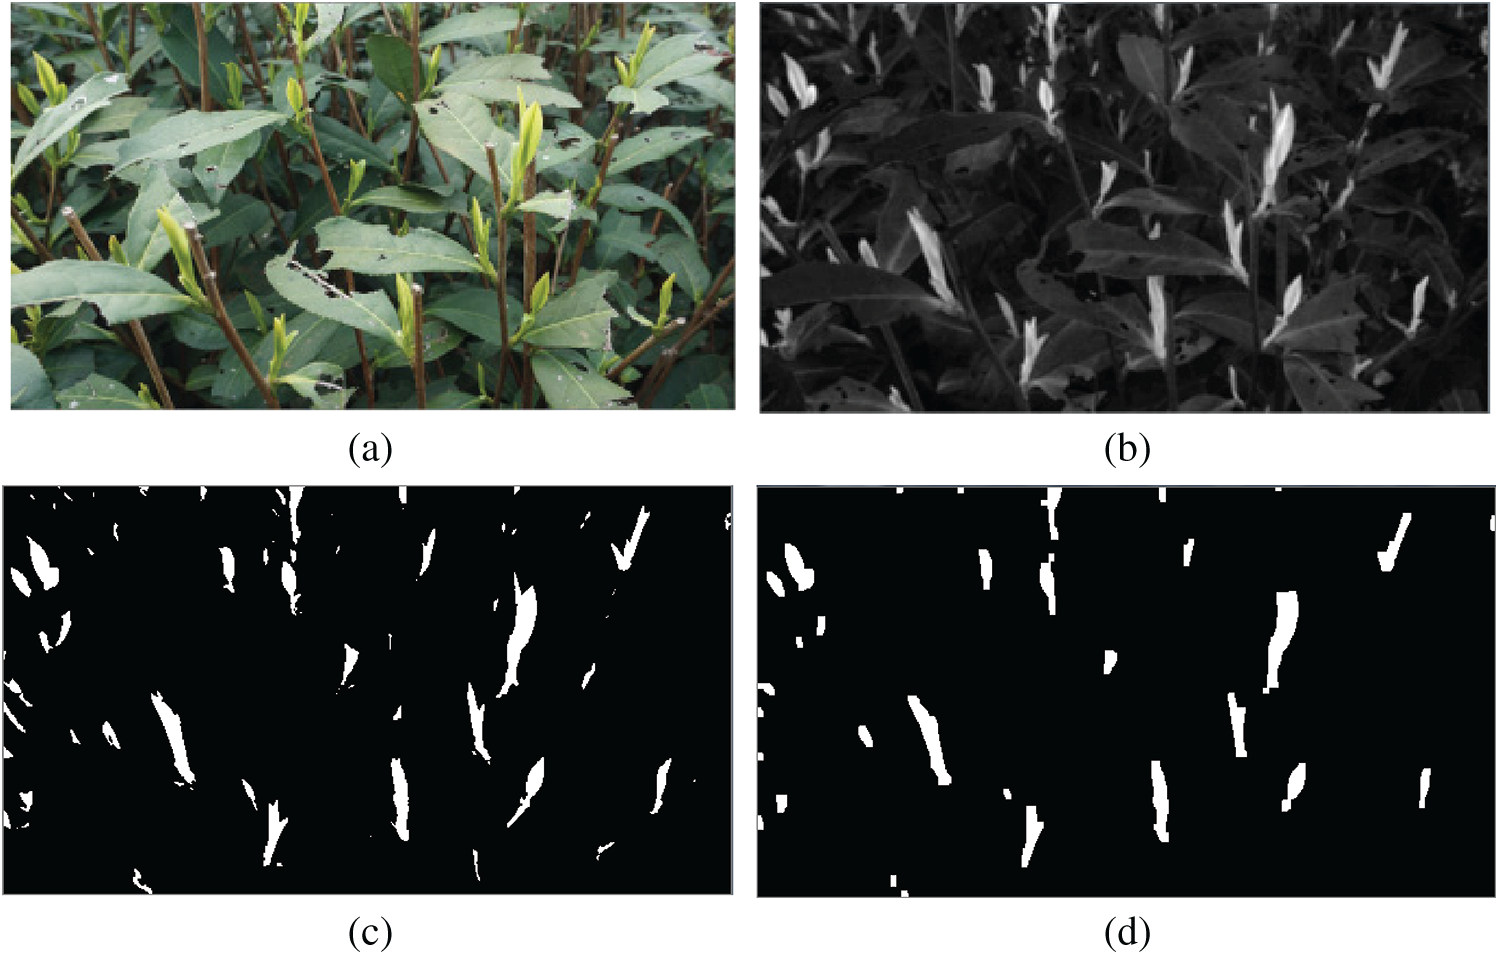
Figure 2: Image segmentation process. a. Original image b. G-B component c. Image segmentation d. Morphological operation
(2) The contour height filter parameters are set to filter out some sprouts that are too small in the visible area because of occlusion and for other reasons. When the straight line between the highest and lowest points has length greater than or equal to a preset value D, the contour number i is entered in the list to be processed, list[]; otherwise, it is discarded and recorded as
(3) With the lowest point
where
The ROI setting result is shown in Fig. 3. The red point is the lowest point of the contour of the sprout for first-time segmentation. Some points deviate from the actual picking point.
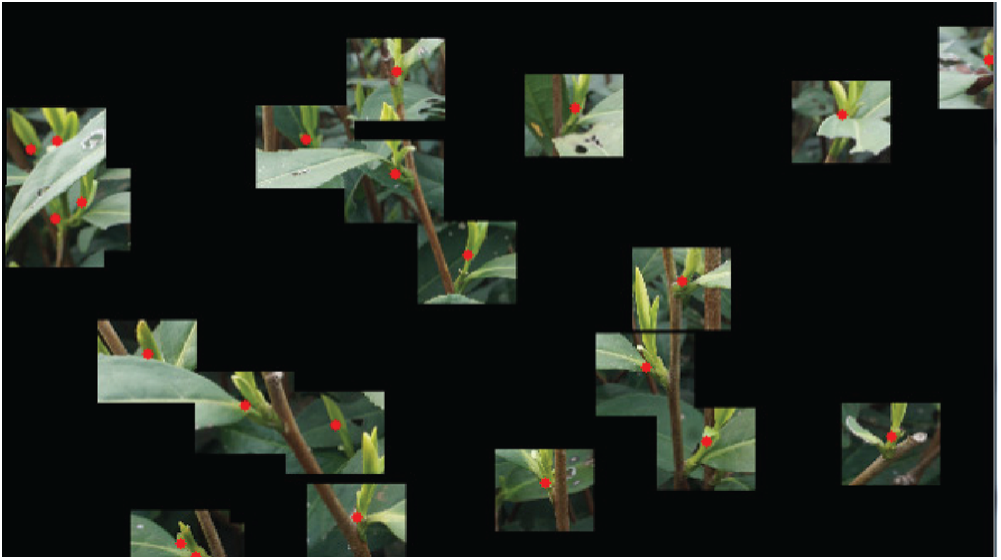
Figure 3: ROI
4 Picking Point Identification and Positioning
The quality requirements of famous tea make it necessary to ensure the integrity of sprouts and to limit the extraction of the petiole during picking. The growth characteristics of the tea suggest that its sprouts grow diagonally upward. The tea picking point calculation model is shown in Fig. 4. The growth point area of the sprouts on the branches is extracted to obtain the corner point position and picking point direction, and a straight line fits the corner point and lowest point. The coordinates of the picking point in the ideal area are calculated through a process combined with agronomic technology.
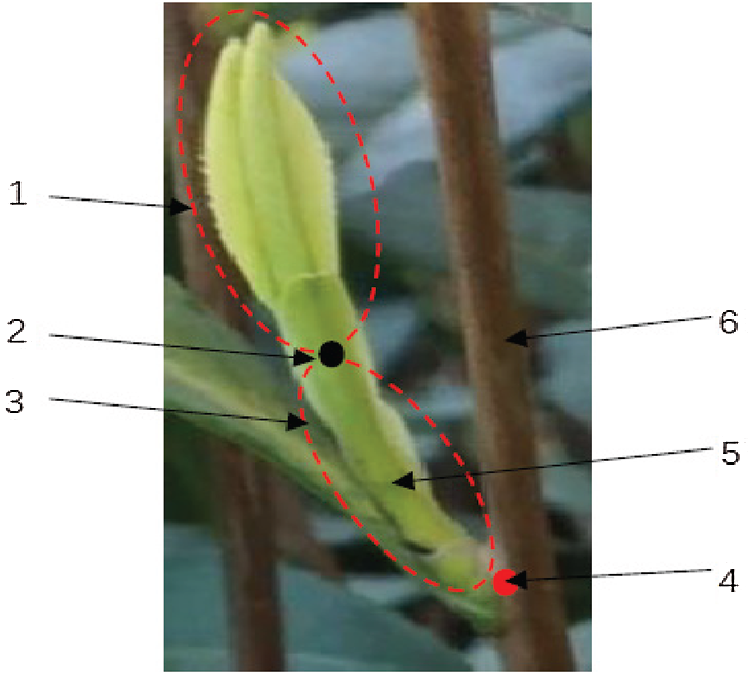
Figure 4: Picking point calculation model. 1. Tea sprout; 2. Lowest point of contour; 3. Ideal area for picking; 4. Corner point; 5. Petiole; 6. Branches
Fig. 5a shows the HSV color space of the ROI, from which the characteristics of the sprouts and their growth points are extracted, as follows.
(1) The H, S, and V channels are separated from the ROI of the HSV space. The upper and lower limits of the pixel values of the H, S, and V channels are set. The area where the sprouts and branches are located is selected, and a mask as large as the original image is set as
where src, min, and max are the pixel value and its lower and upper limits, respectively. The treatment results are shown in Figs. 5b–5d. In the HSV color space, the color difference of tea sprouts, old leaves, and branches is mainly manifested in their H channel values. After experimental comparison, the value ranges of the channels are set as H = [80,150], S = [35,250], and V = [35,250].
(2) The sprouts and branches are extracted by the bitwise AND operation of ROI and mask in the RGB space. As shown in Fig. 5e, the results highlight the characteristics of tea sprouts and branches.
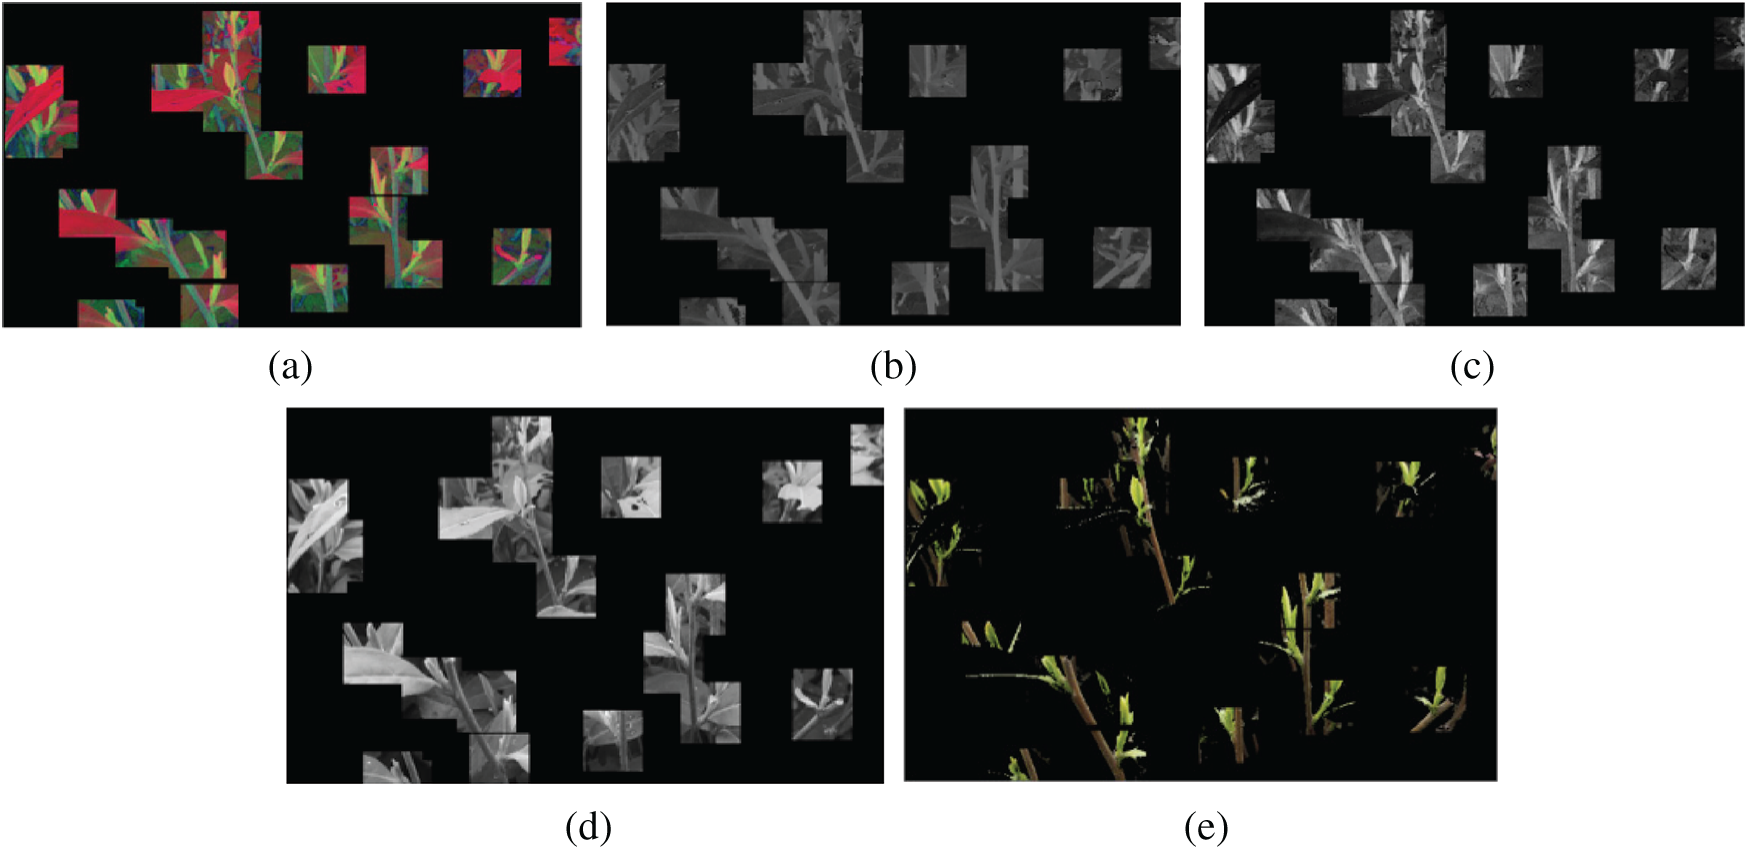
Figure 5: Extraction of sprout and branch features. a. HSV color space, b. H channel, c. S channel, d. V channel, e. Characteristics of sprouts and branches
The Otsu algorithm is used to binarize the image in Fig. 5e, and morphological manipulation corrosion is applied to remove small areas in the binarized image. Fig. 6 shows the result of binary and morphological processing.
The Zhang thinning algorithm is fast and can maintain the curve characteristics of the original image, with fewer burrs after thinning [14–15]. However, the thinning skeletons of sprouts and branches are incomplete, and all the curves cannot be kept as a single pixel. We apply an improved Zhang thinning algorithm [16]. A pixel at the boundary of a binary image is denoted as P1, and eight neighboring pixels are denoted clockwise as P2, P3, …, P8, P9. P2 is directly above P1. The steps of the algorithm are as follows.
(1) Boundary points that meet the following conditions are marked simultaneously:
1)
2)
3)
4)
(2) Boundary points that meet the following conditions are deleted simultaneously:
1)
2)
3)
4)
where N(P1) is the number of nonzero neighbors of P1, and S(P1) is the number of times the value changes from 0 to 1. When P2, P3, …, P8, P9 is the order, B(P1) is the binary coded value of the P1 eight-neighborhood point
Iteration continues until all points meet the above conditions. The tea images’ skeleton refinement results are shown in Fig. 7. The original tea branches and sprouts’ growth features are retained, and a single-pixel skeleton is generated.

Figure 6: Secondary segmentation result
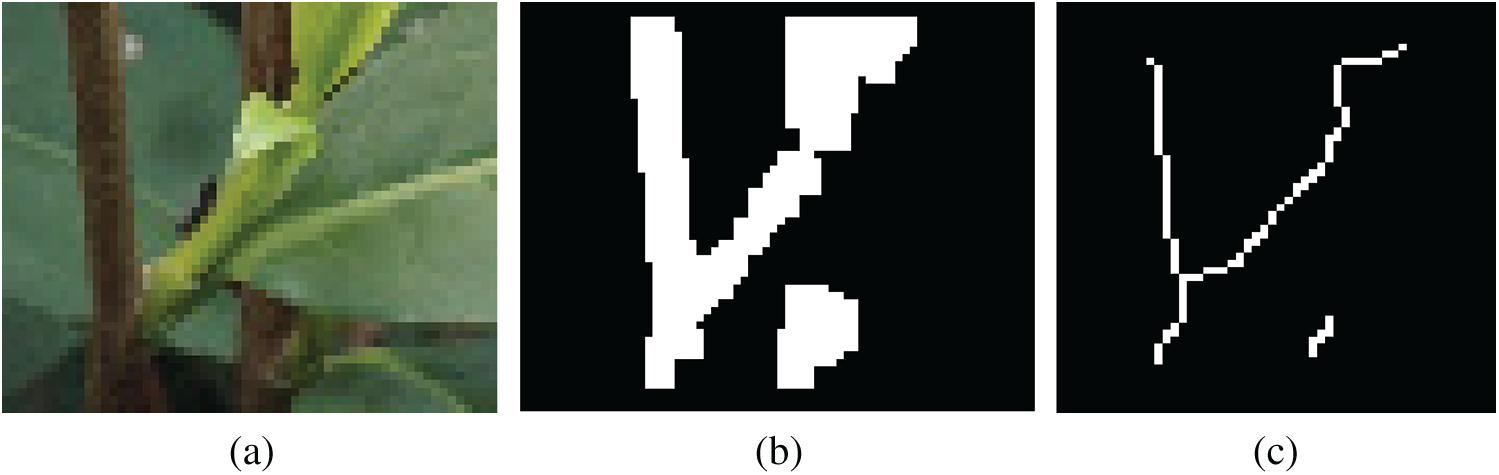
Figure 7: Skeleton thinning process and results. a. Original image b. Binarization c. Skeleton refinement
4.3 Corner Extraction of Skeleton
After refining, the bifurcation points of sprouts and branches must be determined as corner points. There are many corner detection methods, such as Harris corner detection algorithm and Shi-Tomasi corner detection [17–22]. The latter is used in this study.
Suppose the pixel coordinates of a point in the window are
where the window function
The Taylor formula (4) is expanded, and the higher-order terms are omitted:
where
where
The corner response function is defined as
where
When R exceeds the threshold T0 and is a local maximum in its neighborhood, the point is a Shi-Tomasi characteristic corner point, and its coordinates
Fig. 8 shows the results of corner detection using the Harris and Shi-Tomasi algorithms, respectively. Harris is easily affected by the environment, and the number of detected wrong corner points (yellow dots in Fig. 8a) is high. Shi-Tomasi detects only one of the best points (the red dot in Fig. 8b); it is not easily affected by the environment, and it has a stronger adaptive ability. This method can avoid clustering. Shi-Tomasi is more suitable for complex and changeable tea sprout picking situations.

Figure 8: Corner detection. a. Harris, b. Shi-Tomasi
4.4 Calculation of Picking Point
The lowest and corner points of the tea branches and sprouts’ contours are fitted to a straight-line segment, and the center point is taken as the picking point, with horizontal and vertical coordinates expressed as
respectively.
5 Experimental Results and Analysis
Tea samples were collected from the Shengzhou tea plantation base on March 11, 2020. We used an FLIR BFS-U3-16S2C industrial color area scan camera with a shooting angle of 45° from horizontal orientation. There were 60 groups of samples, and each group was run three times. The original image size was 1670 × 3000. The experimental process was conducted in the Python-OpenCV 4.1.1.26 algorithm environment on a BIS-6670 industrial computer (North China). The experimental results of the marked partial picking points are shown in Fig. 9, where a–d show partially marked successful picking points, and e–h are partially marked picking points that failed. The black points in the figure represent the lowest point of the initial segmentation contour, red dots indicate marked picking points, and blue dots are detected corners.
5.2 Analysis of Experimental Results
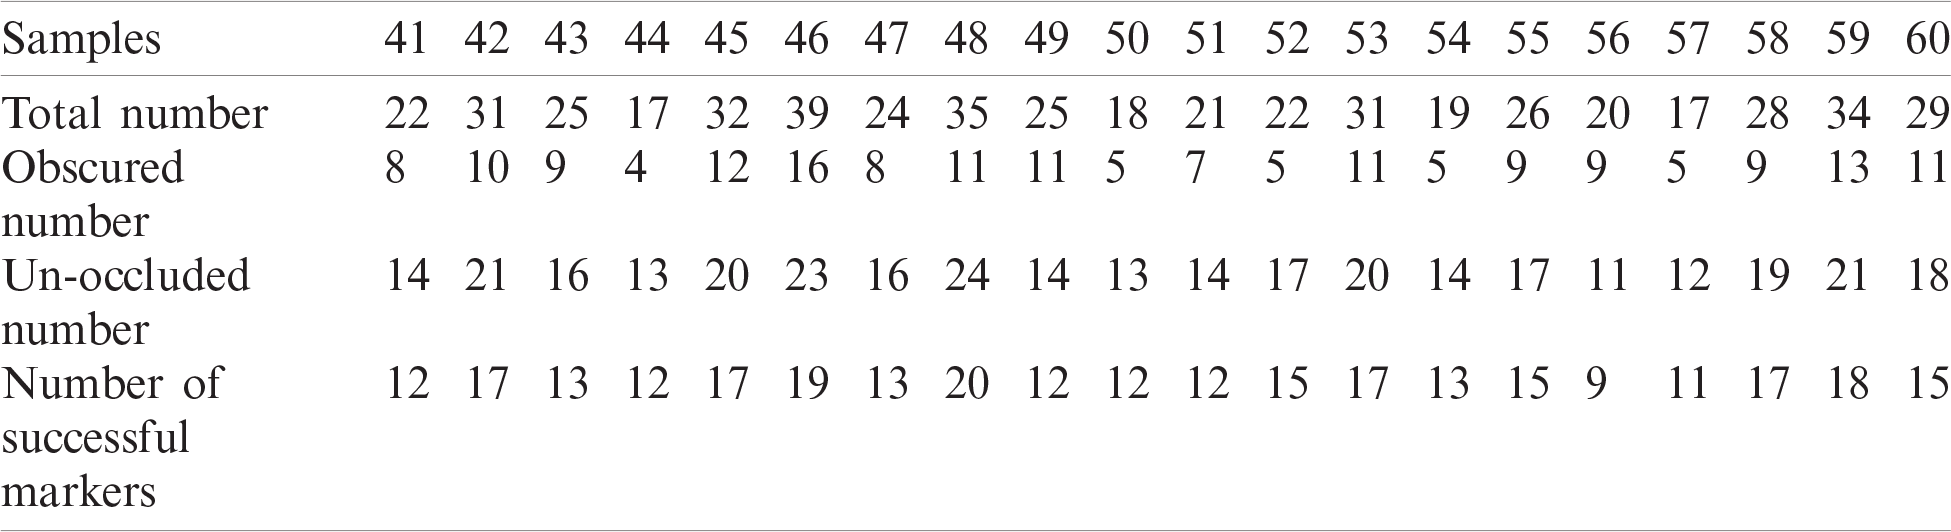
For tea sprouts with growth points hidden by branches and leaves, the red dot lies between the black and blue dots, and is in the ideal area of the tea petiole. The tea sprout’s picking point is marked successfully; otherwise, it is recorded as a mark failure. The statistics of the identification of 60 groups of samples are shown in Tabs. 1–3.
The tables show that 1,545 tea sprouts were effectively identified in 60 groups of tea samples. Among them, 503 corner points were hidden and failed to be marked by default. The other 1,042 corner points were not hidden. Among the unhidden points, 887 corner points were successfully marked. The effective marking success rate (ES) and overall marking success rate (RS) are defined as
where S is the number of successfully marked sprouts, N is the number of unobstructed sprouts, and T is the total number of identified sprouts. The effective labeling success rate and overall labeling success rate of the 60 groups of samples are shown in Fig. 10.
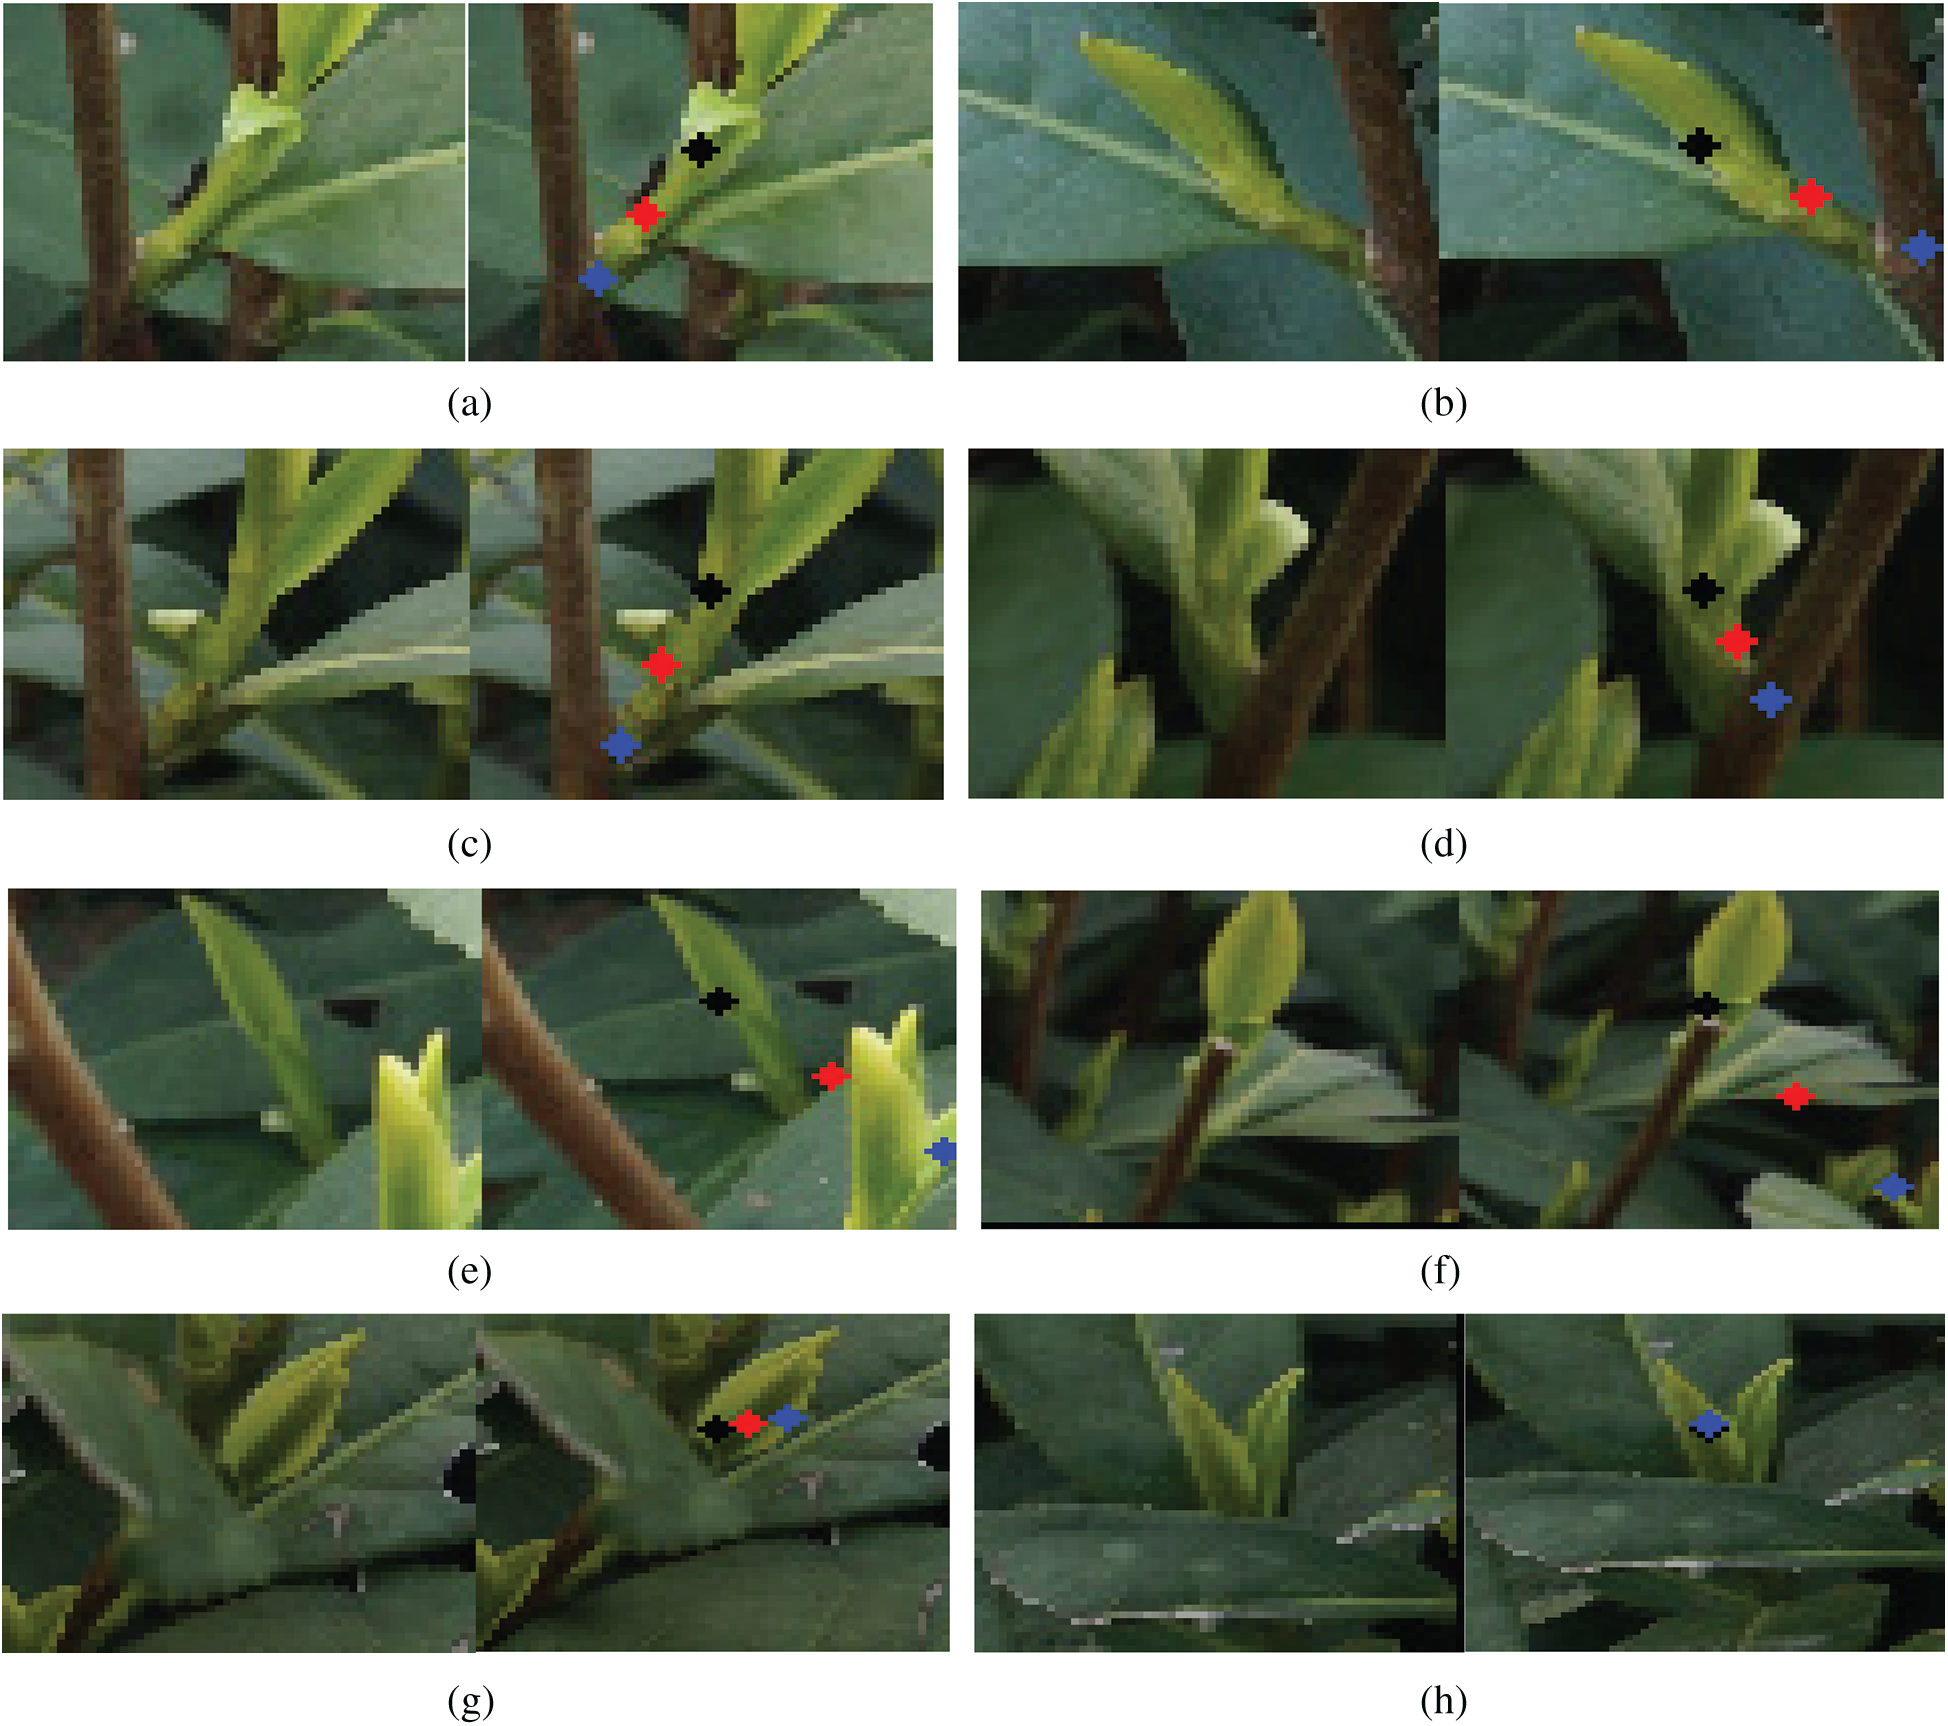
Figure 9: Marked results of picking points. a. Sprout 1, b. Sprout 2, c. Sprout 3, d. Sprout 4, e. Sprout 5, f. Sprout 6, g. Sprout 7, h. Sprout 8
Table 1: Data statistics 1 of test results
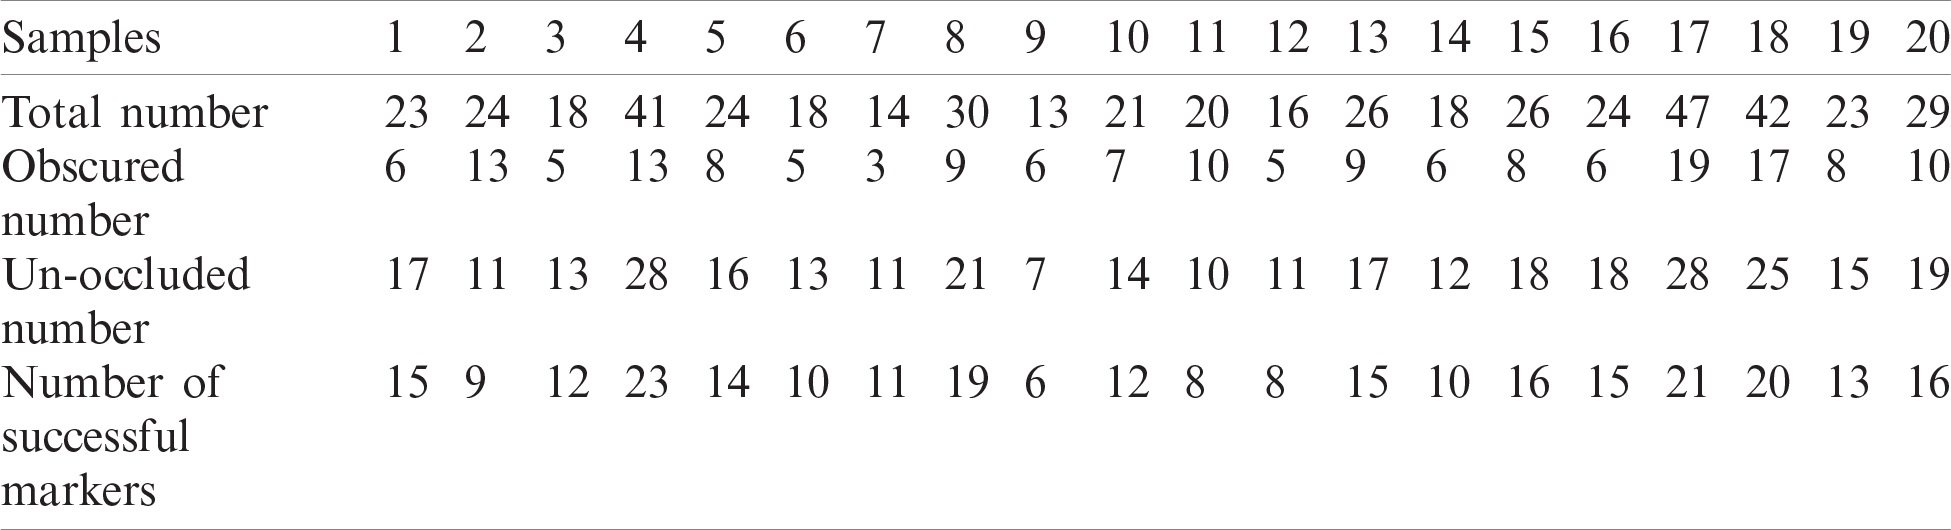
Table 2: Data statistics 2 of test results

Table 3: Data statistics 3 of test results
In the 60 groups of samples, the overall labeling success rate was 50%–65%, and the effective labeling success rate was 75%–90%. The average overall labeling success rate was 57.41%, and the average effective labeling success rate was 85.12%. The low success rate of overall labeling was mainly caused by a large proportion of tea sprouts hidden by old leaves, branches, or other objects, thereby making their identification impossible. Considering that the sprouts are picked and the camera moved during the picking process, the picking point of the hidden sprouts will be re-identified and positioned. The low success rate of effective labeling is mainly due to the complicated growth environment of tea sprouts and the interlacing of multiple branches in the ROI, which leads to deviations in corner monitoring and affects the accurate positioning of picking points. The corner points of two or more tea sprouts are very close, and the petiole parts may overlap. This phenomenon leads to positioning errors of tea sprouts. Some sprouts bend greatly, thereby causing the positioning point to deviate from the petiole itself. The environmental light may be too strong or too dark while the tea images were obtained, thereby causing inaccurate segmentation of some tea sprouts. As a result, deviations occurred in the calculation of the coordinates of tea sprout picking points.
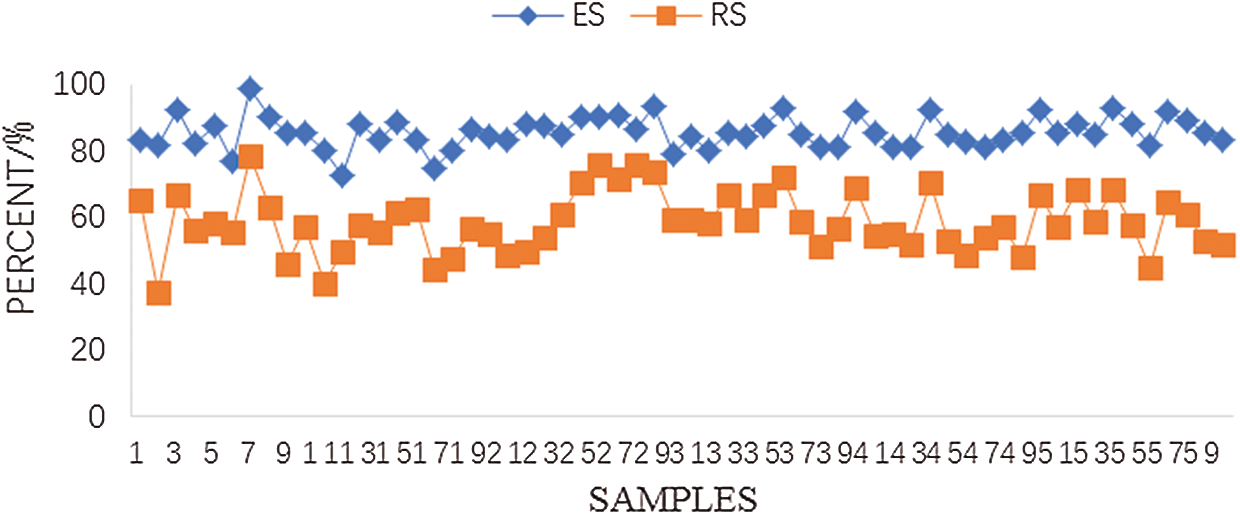
Figure 10: Effective marking success rate and overall marking success rate
We calculated the effective mark success rate of the picking points of sprouts, based on whether the picking point fell on the petiole. Sprouts whose marked picking point fell within a certain range around the petiole could also be obtained. Thus the actual effective picking rate obtained by this algorithm must have been higher than the labeling success rate of 85.12%.
We proposed a famous tea sprout automatic segmentation and positioning method based on the Otsu algorithm, improved Zhang thinning algorithm, and Shi-Tomasi algorithm. The Otsu algorithm was first used to segment the tea sprouts, and the ROI with the lowest point on its contour was set as the center. The characteristics of the sprouts and branches were extracted on the basis of the HSV space H channel, and the sprouts were segmented again with the Otsu algorithm. The sprouts’ single-pixel feature was refined, and the Shi-Tomasi algorithm was used to detect the corner points of the sprouts on the branches. The line segment between the corner point and the lowest point was fitted, and the center point was taken as the picking point. The proposed algorithm effectively solved the problem of low accuracy of tea sprout automatic segmentation and positioning. The effectiveness of this algorithm was verified by using 60 sets of samples and by conducting marked experiments on 1,545 sprouts’ picking points across these 60 sets. The reasons for the failed marking of picking points were analyzed from multiple aspects, thereby providing certain ideas for subsequent research on automatic picking of tea sprouts by robots. The proposed method had an effective marked success rate of 85.12% for the picking points of tea sprouts, thereby meeting the picking requirements of famous tea. This study provides a reference for the realization of mechanized automatic picking of famous tea.
Funding Statement: The authors gratefully acknowledge the financial support provided by the Special Fund for the Construction of Modern Agricultural Industrial Technology Systems (CARS-19) in China.
Conflicts of Interest: The authors declare that they have no conflicts of interest to report regarding the present study.
1. A. Renugambal and K. S. Bhuvaneswari, “Image segmentation of brain MR images using OTSU’s based hybrid WCMFO algorithm,” Computers, Materials & Continua, vol. 64, no. 2, pp. 681–700, 2020. [Google Scholar]
2. B. T. Hu and J. W. Wang, “Deep learning for distinguishing computer generated images and natural images: A survey,” Journal of Information Hiding and Privacy Protection, vol. 2, no. 2, pp. 37–47, 2020. [Google Scholar]
3. D. Chaves, M. Trujillo, E. Garcia, J. Barraza, E. Lester et al., “Automated inspection of char morphologies in colombian coals using image analysis,” Intelligent Automation & Soft Computing, vol. 26, no. 3, pp. 397–405, 2020. [Google Scholar]
4. E. M. Abdelkader, O. Moselhi, M. Marzouk and T. Zayed, “A multi-objective invasive weed optimization method for segmentation of distress images,” Intelligent Automation & Soft Computing, vol. 26, no. 4, pp. 643–661, 2020. [Google Scholar]
5. G. H. Yu, H. H. Fan, H. Y. Zhou, T. Wu and H. J. Zhu, “Vehicle target detection method based on improved SSD model,” Journal on Artificial Intelligence, vol. 2, no. 3, pp. 125–135, 2020. [Google Scholar]
6. X. F. Liang, C. Q. Jin, M. D. Ni and Y. W. Wang, “Acquisition and experiment on location information of picking point of tomato fruit clusters,” Transactions of the CSAE, vol. 34, no. 16, pp. 163–169, 2018. [Google Scholar]
7. C. H. Yang, Y. P. Liu and Y. Wang, “Research and experiment of recognition and location system for citrus picking robot in natural environment,” Transactions of the Chinese Society of Agricultural Engineering, vol. 50, no. 12, pp. 14–22, 2019. [Google Scholar]
8. L. T. Huang, B. Wang, T. Ni, H. Miao and Y. Li, “Research on robotic grasping system based on Kinect camera,” Transactions of the Chinese Society for Agricultural Machinery, vol. 50, no. 1, pp. 390–399, 2019. [Google Scholar]
9. J. T. Xiong, Z. L. He, L. Y. Tang, R. Lin and Z. Liu, “Visual localization of disturbed grape picking point in non-structural environment,” Transactions of the Chinese Society for Agricultural Machinery, vol. 48, no. 4, pp. 29–33, 2017. [Google Scholar]
10. D. D. Wang, Y. Xu, H. B. Song and D. J. He, “Localization method of picking point of apple target based on smoothing contour symmetry axis algorithm,” Transactions of the CSAE, vol. 31, no. 5, pp. 167–174, 2015. [Google Scholar]
11. L. F. Luo, X. J. Zou, J. T. Xiong, Y. Zhang, H. X. Peng et al., “Automatic positioning for picking point of grape picking robot in natural environment,” Transactions of the CSAE, vol. 31, no. 2, pp. 14–21, 2015. [Google Scholar]
12. H. Zhang, Y. Chen, W. Wang and G. L. Zhang, “Positioning method for tea picking using active computer vision,” Transactions of the Chinese Society for Agricultural Machinery, vol. 45, no. 9, pp. 61–65, 2014. [Google Scholar]
13. W. Pei and X. L. Wang, “The two-dimension coordinates extraction of tea shoots picking based on image information,” Acta Agriculturae Zhejiangensis, vol. 28, no. 3, pp. 522–527, 2016. [Google Scholar]
14. M. W. Liu and L. X. Gu, “A fast LUT-based airway skeleton extraction algorithm for virtual bronchoscopy,” Journal of Harbin Institute of Technology, vol. 49, no. 5, pp. 134–140, 2017. [Google Scholar]
15. Q. L. Han, Y. Zhao, Y. D. Zhao, X. J. Pan, Y. Peng et al., “Skeleton extracting algorithm for soil pore based on thinning method,” Transactions of the Chinese Society of Agricultural Engineering, vol. 50, no. 9, pp. 229–234, 2019. [Google Scholar]
16. S. M. Mu, H. Y. Du, P. Su, X. H. Zha and G. Y. Chen, “A new improved fast parallel thinning algorithm,” Mircoelectronics & Computer, vol. 30, no. 1, pp. 53–55.60, 2013. [Google Scholar]
17. Q. S. Liu, X. F. Xie and X. Z. Zhang, “Checkerboard corner detection algorithm for calibration of the focused plenoptic camera,” Acta Optica Sinica, vol. 40, no. 14, pp. 1–14, 2020. [Google Scholar]
18. Y. H. Li, Y. R. He and W. C. Zhang, “Image corner detection using recursively maximum point-to-chord distance,” Journal of Image and Graphics, vol. 24, no. 7, pp. 1148–1159, 2019. [Google Scholar]
19. W. C. Zhang, X. N. Kong and W. Song, “Review of image corner detection algorithms,” Acta Electronica Sinica, vol. 43, no. 11, pp. 2315–2321, 2015. [Google Scholar]
20. Y. X. Xing, D. Y. Zhang, J. H. Zhao, M. G. Sun and W. Y. Jia, “Robust fast corner detector based on filled circle and outer ring mask,” IET Image Processing, vol. 10, no. 4, pp. 314–324, 2016. [Google Scholar]
21. X. Y. Lin, C. Zhu, Y. P. Liu and Q. Zhang, “Geometric mesh corner detection using triangle principle,” Electronics Letters, vol. 53, no. 20, pp. 1354–1356, 2017. [Google Scholar]
22. Y. Li, J. Xu, R. Xia, Q. Huang, W. Xie et al., “Extreme-constrained spatial spectral corner detector for image-level hyperspectral image classification,” Pattern Recognition Letters, vol. 10, no. 9, pp. 110–119, 2018. [Google Scholar]
 | This work is licensed under a Creative Commons Attribution 4.0 International License, which permits unrestricted use, distribution, and reproduction in any medium, provided the original work is properly cited. |