DOI:10.32604/cmc.2021.015655
| Computers, Materials & Continua DOI:10.32604/cmc.2021.015655 | |
| Article |
Classification and Categorization of COVID-19 Outbreak in Pakistan
1Department of Computer Science, Kinnaird College for Women, Lahore, 54000, Pakistan
2Department of Cyber Security, Air University, Islamabad, Pakistan
3School of Information Technology and Engineering, Vellore Institute of Technology, Tamil Nadu, India
4Raytheon Chair for Systems Engineering, Advanced Manufacturing Institute, King Saud University, Riyadh, 11421, Saudi Arabia
5Industrial Engineering Department, College of Engineering, King Saud University, Riyadh, 11421, Saudi Arabia
*Corresponding Author: Mustufa Haider Abidi. Email: mabidi@ksu.edu.sa
Received: 01 December 2020; Accepted: 05 February 2021
Abstract: Coronavirus is a potentially fatal disease that normally occurs in mammals and birds. Generally, in humans, the virus spreads through aerial droplets of any type of fluid secreted from the body of an infected person. Coronavirus is a family of viruses that is more lethal than other unpremeditated viruses. In December 2019, a new variant, i.e., a novel coronavirus (COVID-19) developed in Wuhan province, China. Since January 23, 2020, the number of infected individuals has increased rapidly, affecting the health and economies of many countries, including Pakistan. The objective of this research is to provide a system to classify and categorize the COVID-19 outbreak in Pakistan based on the data collected every day from different regions of Pakistan. This research also compares the performance of machine learning classifiers (i.e., Decision Tree (DT), Naive Bayes (NB), Support Vector Machine, and Logistic Regression) on the COVID-19 dataset collected in Pakistan. According to the experimental results, DT and NB classifiers outperformed the other classifiers. In addition, the classified data is categorized by implementing a Bayesian Regularization Artificial Neural Network (BRANN) classifier. The results demonstrate that the BRANN classifier outperforms state-of-the-art classifiers.
Keywords: COVID-19; pandemic; neural network; BRANN; machine learning
The COVID-19 outbreak that appeared in Wuhan, China at the end of December 2019 was initially considered a pneumonia based on etiology. The virus soon spread worldwide at a rapid rate [1]. On January 30, 2020, the World Health Organization (WHO) declared the COVID-19 outbreak a Public Health Emergency of International Concern [2,3]. This virus has affected people in more than 209 nations around the world. The overheads of the coronavirus outbreak are continually increasing. When this virus first started to spread, there were approximately 600 confirmed cases in China. Globally, the number of people who have died because of this virus has been increasing daily [4]. The WHO determined that the most common symptoms of this virus are tiredness, fever, and dry cough [5]. Most people with these symptoms can recover without extraordinary treatment or prescriptions. However, some patients have more severe symptoms, such as a runny nose, sore throat, nasal congestion, and general or severe pain. Typically, 80% of people who became infected have severe symptoms [6]. In the United Kingdom, the National Health Service (NHS) has reported cases with more severe side effects, including high fever and persistent cough. The NHS recommends that anybody with these sorts of symptoms should self-quarantine for 7 to 14 days [7]. The infection spreads between individuals in close contact who are exposed to respiratory aerosol droplets that are emitted, primarily when an infected person coughs or sneezes, or shouts, sings, or talks.
For the most part, the droplets do not travel significant distances. Typically, they fall to the ground or onto immediate surfaces. Transmission may also occur through little droplets that can remain suspended in the air for longer periods of time [8]. People may become infected by touching a contaminated surface and then touching their face [9]. Outbreaks and rapid spread are highly expected, even before symptoms are noticeable, and from individuals who do not possess any symptoms of being infected by the virus, but they carry it [10]. Fig. 1 represents the worldwide spread of this coronavirus. It is believed that the virus did not spread in Pakistan the way it spread in other countries, like China, the USA, and Italy. Pakistan, with permeable borders, is sandwiched between two focal points of this coronavirus (China and Iran).

Figure 1: Worldwide spread of COVID-19
Recently, Pakistan has reinforced their precautions against COVID-19 by various strategies, such as detailing the use of national crisis readiness, compulsory thermal screenings at all entry points, observation of regional spread, contact tracing, and information assortment through various sources. Testing has been reinforced by bringing in Polymerase Chain Reaction units for SARS-COV-2 diagnostics [11]. Assets have been deployed to setup quarantine centers in preparation of expected cases. Locations for these stations include a few urban areas, emergency clinics, and reconnaissance units that have been actuated to track the contacts of affirmed cases, as suggested by the WHO [10]. The COVID-19 infection has spread to more than 213 nations, and as of April 17, 2020, there were 1,995,983 confirmed cases and 131,037 deaths [12].
Pakistan revealed its initial two positive cases on February 26, 2020. These cases were connected to travel to Iran [13]. The number of positive cases across the nation rose to 7,025 on April 17th, 2020: 3,276 positive cases and 135 deaths in Punjab, 2,008 cases in Sindh, 993 cases in Khyber Pakhtunkhwa, 303 cases in Balochistan, 237 cases in Gilgit Baltistan, 154 cases in Islamabad Capital Territory (ICT), and 46 cases in Azad Jammu Kashmir [14].
The number of positive cases is rising rapidly every day. In fact, in most countries, the number of cases is probably much higher than recorded, due to limited testing [14,15]. Fig. 2 shows the number of total coronavirus cases in Pakistan. The exponential increase in cases has driven the Government to force total and severe lockdowns in numerous urban areas [16].

Figure 2: COVID-19 cases in Pakistan
Fig. 3 shows the total number of COVID-19 cases, the total number of deaths, and the total number of recovered cases in different regions of Pakistan.

Figure 3: Total recovered cases, deaths, and confirmed cases in Pakistan
Deaths due to COVID-19 are increasing day by day in Pakistan. The nature of the COVID-19 outbreak differs in various countries. For example, in China, Iran, and France, COVID-19 outbreak is characterized by extremely high numbers and severe cases. The outbreak severity can be detected through an increase in the number of deaths. Thus, in this research, the nature of the outbreak is detected with the help of the COVID-19 dataset for the past few months in Pakistan collected by the Government. If the nature of the COVID-19 outbreak can be detected from the past months’ death rate, then with the help of standard operating procedure and precautionary measures, the death rate can be reduced in the coming months in Pakistan. For outbreak detection, the COVID-19 dataset is first classified with machine learning (ML) classifiers. Then the classified dataset is categorized into severe and normal COVID-19 outbreaks, using the Bayesian regularized artificial neural network (BRANN) classifier.
1.2 Motivation and Contribution
The COVID-19 death rate is high and is increasing day by day globally [17]. This research is intended to classify and categorize the nature of the outbreak in Pakistan using machine learning classifiers. In this study, a dataset of COVID-19 patients from different regions (primarily populated regions) of Pakistan is preprocessed and then classified to understand the nature of the virus and its outbreak in Pakistan. Machine learning classifiers: Decision Tree (DT), Naive Bayes (NB), Support Vector Machine (SVM), and Logistic Regression (LR) are implemented, and results are compared based on performance measures (i.e., accuracy, precision, and recall). The comparison of machine learning classifiers indicates that the DT and NB classifiers return 100% accuracy. Classified data is input to the BRANN to categorize the COVID-19 outbreak in Pakistan to determine if the nature of the outbreak will be normal or severe.
The remainder of this paper is organized as follows. Section 2 discusses the related work. Section 3 provides the proposed methodology to classify and categorize COVID patients. Section 4 provides the experimental analysis and results. Conclusions and suggestions for future work are presented in Section 5.
COVID-19 virus was initially discovered in December 2019 in the population of Wuhan, China. Later, it spread to other regions of China and other parts of the world [18]. Various papers and studies have applied different techniques on COVID-19 datasets. In this section, several studies that investigate the application of machine learning algorithms on different diseases are discussed.
SVM and Mutual Information techniques have been applied to classify genes [19]. In that study, the authors claimed that the SVM classifier achieved the best mean accuracy rate. In addition, the fuzzy KNN approach has been used on a Parkinson’s dataset to help generate a diagnostic system that will make better clinical diagnostic decisions [20]. Here, researchers utilized different machine learning techniques to propose a novel method. They computed significant features by implementing machine learning techniques to improve the accuracy rate of predicting cardiovascular disease. Their prediction model gives 88.7% accuracy [21]. In 2015, a combination of SVM and fuzzy logic was applied for the risk classification of diabetes. Fuzzy reasoning was used to predict the risk factors of (Type-II) diabetes, and an SVM was used to generate fuzzy rules from the Pima diabetes dataset [22].
Other researchers used the NB classifier to improve the accuracy of predicting heart disease [23]. Different machine learning techniques, such as Artificial Neural Network (ANN), random forest (RF), and K-means clustering techniques were implemented to predict diabetes. The ANN technique provided the best accuracy rate (75.7%) in the prediction of diabetes [24]. Some researchers also implemented machine learning techniques to predict hypertension outcomes based on medical data. In that study, the researchers evaluated four classifiers, i.e., SVM, DT, RF, and XGBoost, to meet the desired accuracy level of the prediction system. XGBoost produced the best results among the four classifiers and provided a system accuracy of 94.36%. [25,26].
Other researchers used histopathological data patients who had a lung lobectomy to treat adenocarcinoma. For both “accidental” models, adjacent to malignancies, the lungs show edema and fundamental proteinaceous exudates as huge protein globules [27]. The researchers documented vascular joins with blazing gatherings of fibrinoid content, multinucleated goliath cells, and pneumocyte hyperplasia. In addition, some researchers used the ANFIS model to estimate landslide susceptibility and to develop a model to predict landslides. The ANFIS model was used to train and validate the dataset [28]. Different ML classifiers have been used to develop predictive models [29,30]. In 2017, researchers proposed an SVM and fuzzy logic-based system automatically block pornographic content on the web. SVMs have also been used in statistical learning approaches to classify hypothesis test data and compute the error rate using the Gaussian-density function [31,32].
Machine learning classifiers, DT, NB, LR, and SMV, are used to classify and categorize the COVID-19 outbreak in different regions of Pakistan. The proposed system is shown in Fig. 4.

Figure 4: Proposed system for COVID-19 data classification and prediction
The “Corona-Virus Pakistan Dataset 2020” was downloaded from Kaggle [33]. The dataset contains 13 features that represent the lab tests of suspected, confirmed, and fatal COVID-19 cases per day in the most populated regions of Pakistan (Tab. 1). The dataset features are listed in Tab. 2. The dataset has 315 rows and 13 columns, i.e., 11089 data items. The dataset was checked for null and missing values of categorical features; none were found. The data distribution of categorical features, such as Date and Province, are shown in Fig. 5.
Table 1: Selected regions of Pakistan in dataset
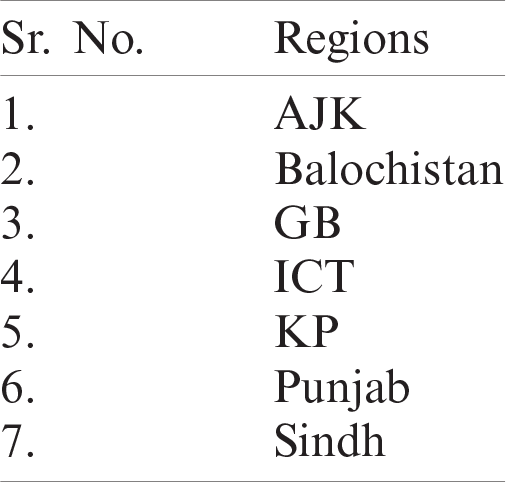
Table 2: Features of COVID-19 dataset


Figure 5: Data distribution of categorical features
Preprocessing is necessary to avoid misclassified results and errors [34,35]. Data preprocessing involved data preparation, data exploration, data distribution, and replacing categorical features. Preprocessing resulted in a clean dataset suitable for classification. This preprocessed dataset is fed to the machine learning classifiers to produce classified results [36].
4 Experimental Analysis and Results
For the classification of the dataset, Google Colab was used for python coding, and dataset categorization was implemented through MATLAB. The dataset was split into training (70%) and testing (30%) sets. The metrics used in this work are as follows.
The COVID-19 dataset was classified using the DT ID3 classifier. The results are shown in Tab. 3. As can be seen, this classifier achieved 100% accuracy, precision, and recall. The confusion matrix for the DT classifier is plotted in Fig. 6a.
Table 3: Results achieved for decision tree classifier
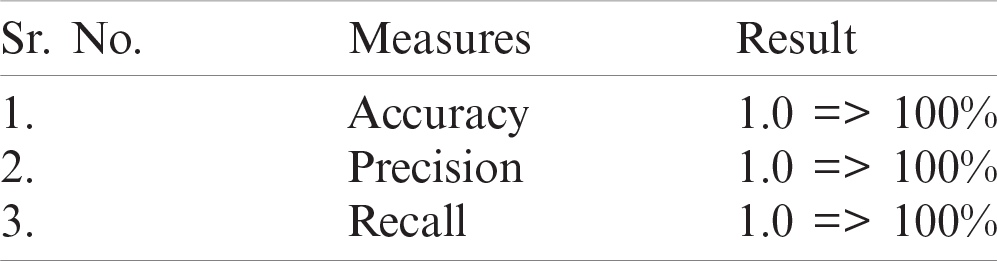
The NB Classifier is implemented on the COVID-19 dataset because it is a continuous dataset. The NB classifier also achieved 100% accuracy (Tab. 4). The confusion matrix for this classifier is shown in Fig. 6b.
4.3 Logistic Regression Classifier
The LR classifier has been used successfully to predict various diseases [37,38]. The testing data is predicted for the first 25 entries. The histogram of the predictions is shown in Fig. 7. Figs. 8a and 8b depict the confusion matrices for LR and SVM classifiers respectively. The Receiver Operating Characteristics (ROC) plot for the COVID19 dataset, based on true positive rate and false positive rate, is shown in Fig. 9a. The LR ROC curve covers 91% of the area. The results obtained for LR are listed in Tab. 5.
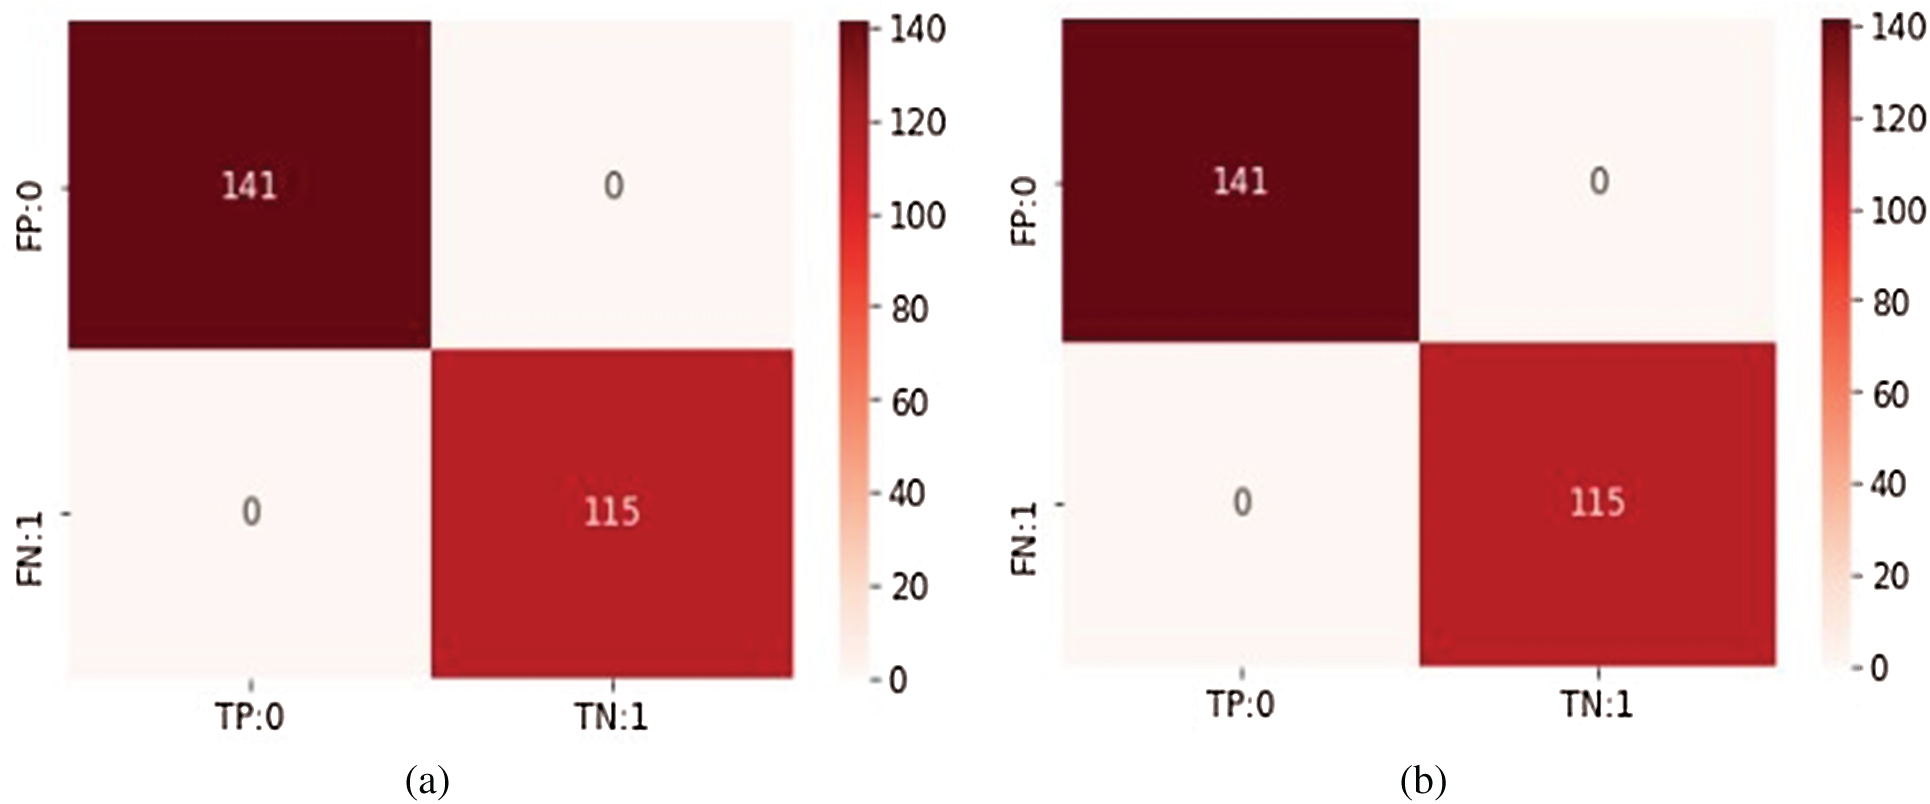
Figure 6: Confusion matrices for both classifiers (a) Decision tree classifier (b) Naive Bayesian classifier
Table 4: Results achieved for Naive Bayesian classifier


Figure 7: Histogram of predicted probabilities
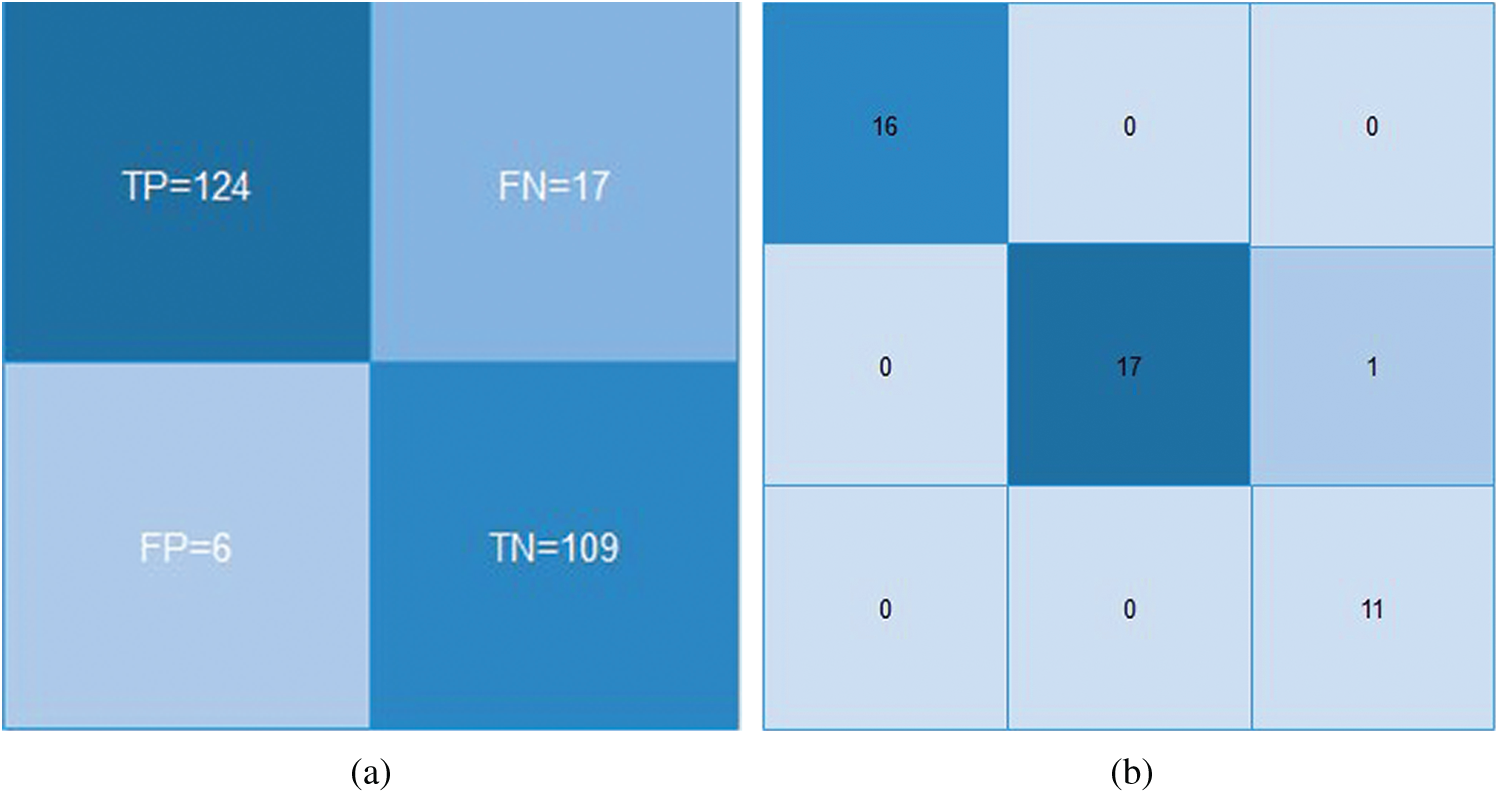
Figure 8: Confusion matrices for (a) LR and (b) SVM classifiers
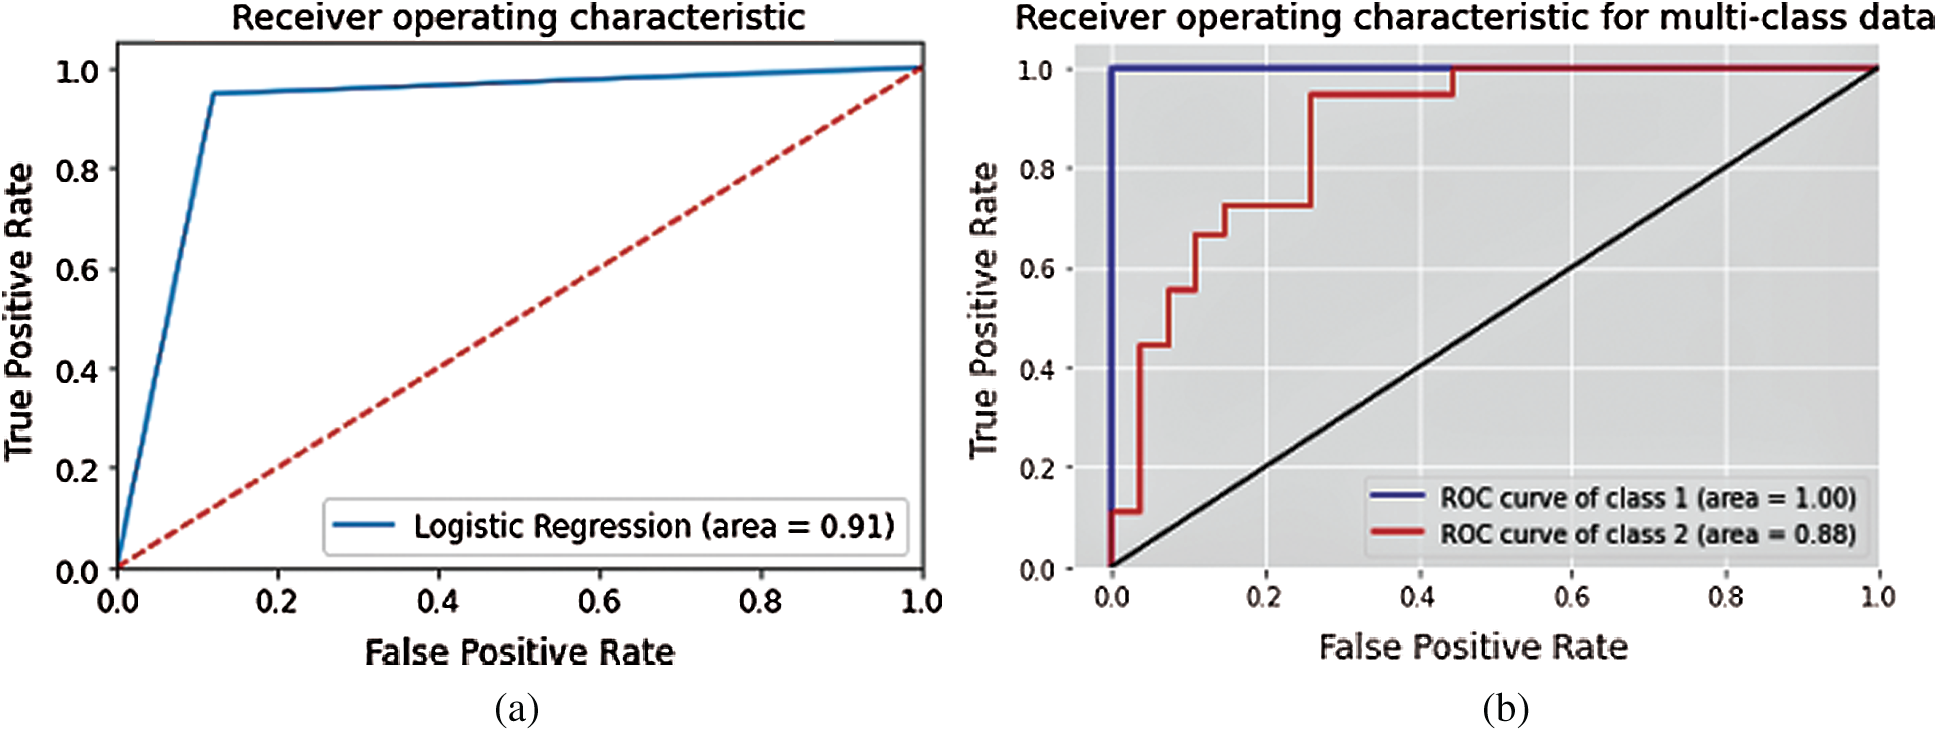
Figure 9: ROC Curve for (a) LR and (b) SVM classifiers
Table 5: Results achieved for logistic regression classifier

4.4 Support Vector Machine Classifier
The linear SVM classifier achieved precision of 98%. The ROC curve for multiclass SVM is depicted in Fig. 9b. It shows that the ROC curve for class-1 covers 100% of the area, while class-2 covers 88% of the area. Tab. 6 lists the SVM results using formulas (1–3).
Table 6: Results achieved for SVM classifier

DT and NB classifiers yielded 100% accuracy for this dataset. Tab. 7 shows the results for the DT, NB, LR, and SVM classifiers. The classified dataset is input to an ANN (Section 4.5) for data categorization.
Table 7: Comparison of classification results

In the Artificial Neural Network training classifier, Bayesian regularization is used to categorize the search space into two classes: normal outbreak and severe outbreak. This classifier is used to categorize the nature of the COVID-19 outbreak in Pakistan based on data collected from various regions. Fig. 10 shows the COVID-19 dataset simulation architecture.

Figure 10: COVID-19 dataset simulation architecture

The output is labeled 0 or and 1, where 0 represents a normal outbreak and 1 represents a severe outbreak. The output is labeled based on input parameter values. Tab. 8 shows the classified, important ranking features of the dataset as inputs selected for the neural network. The Error Histogram and Regression values are given in Tab. 9.
Table 8: Selected inputs of COVID-19 dataset

In Tab. 9, from the 852 dataset entries, 596 instances are selected for training, 128 are selected for validation, and 128 are selected for testing. Furthermore, 50 hidden neurons with one epoch are used for the neural network. The confusion matrix results demonstrated that the actual class predicts the predicted class with 99.88% accuracy. This indicates that the BRANN classifier predicts the results accurately for this dataset. Tab. 9 shows that the BRANN classifier correctly categorized 128 data items for the validation and testing process.
Table 9: Bayesian regularization results


Figure 11: Error histogram of Bayesian regularization ANN algorithm

Figure 12: Bayesian regularization regression plot
From Fig. 11, it is evident BRANN has 0 errors. This indicates that the neural network fits the data perfectly. Fig. 12 shows how accurately a neural network determines the function for regression to analyze the dataset. The actual network details are shown in comparison with the target output. How accurately a model fits the data is represented through this colored line shown in the Fig. 12. This line should closely intersect the real output from the left to the right corner of the regression plot. The above figure shows that the COVID-19 dataset closely fits in the BRANN model.
Fig. 13 shows the training state of the BRANN (gradient, mu, parameters, the sum of squared parameters, and validation checks). They all achieve 1000 epochs, which indicates the good performance of the dataset. Fig. 14 represents the mean square error of the BRANN. The blue and red training lines represents the testing mean square, and the dotted line represents the 1000 epochs. The figure listed below shows the best training performance of the BRANN.
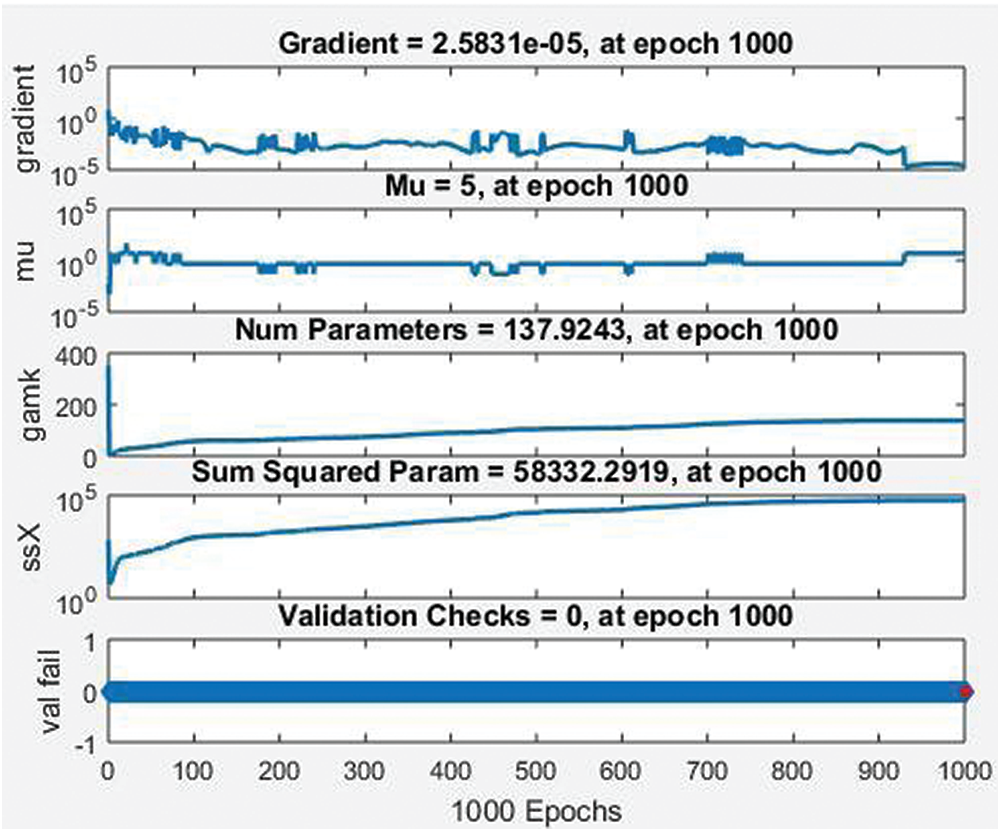
Figure 13: Training state of BRANN
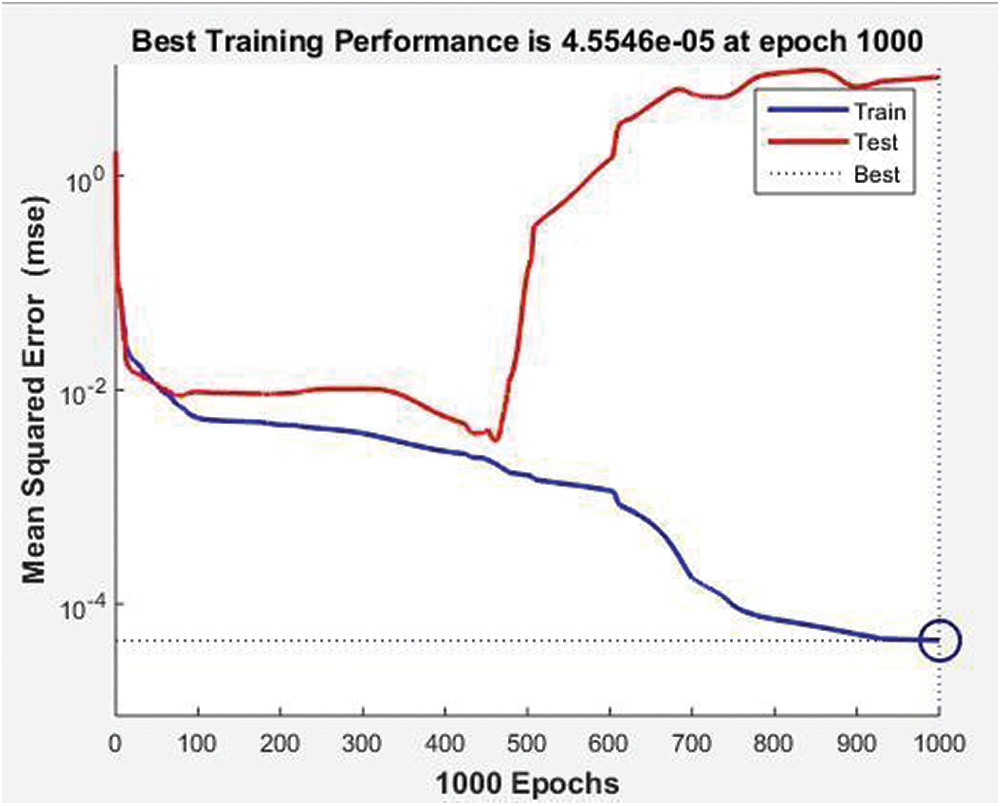
Figure 14: Mean square error of neural network BRANN
Fig. 15 is the confusion matrix of the BRANN classifier. The BRANN classifier gives 99.88% accuracy for training, testing, and validation of the classifier on the COVID dataset for Pakistan. The outcome of the dataset is divided into two classes 0 and 1, where 0 denotes that the outbreak is normal, and 1 represents that the outbreak is severe. Five potential features are selected as input according to their importance that is classified through ML classifiers.
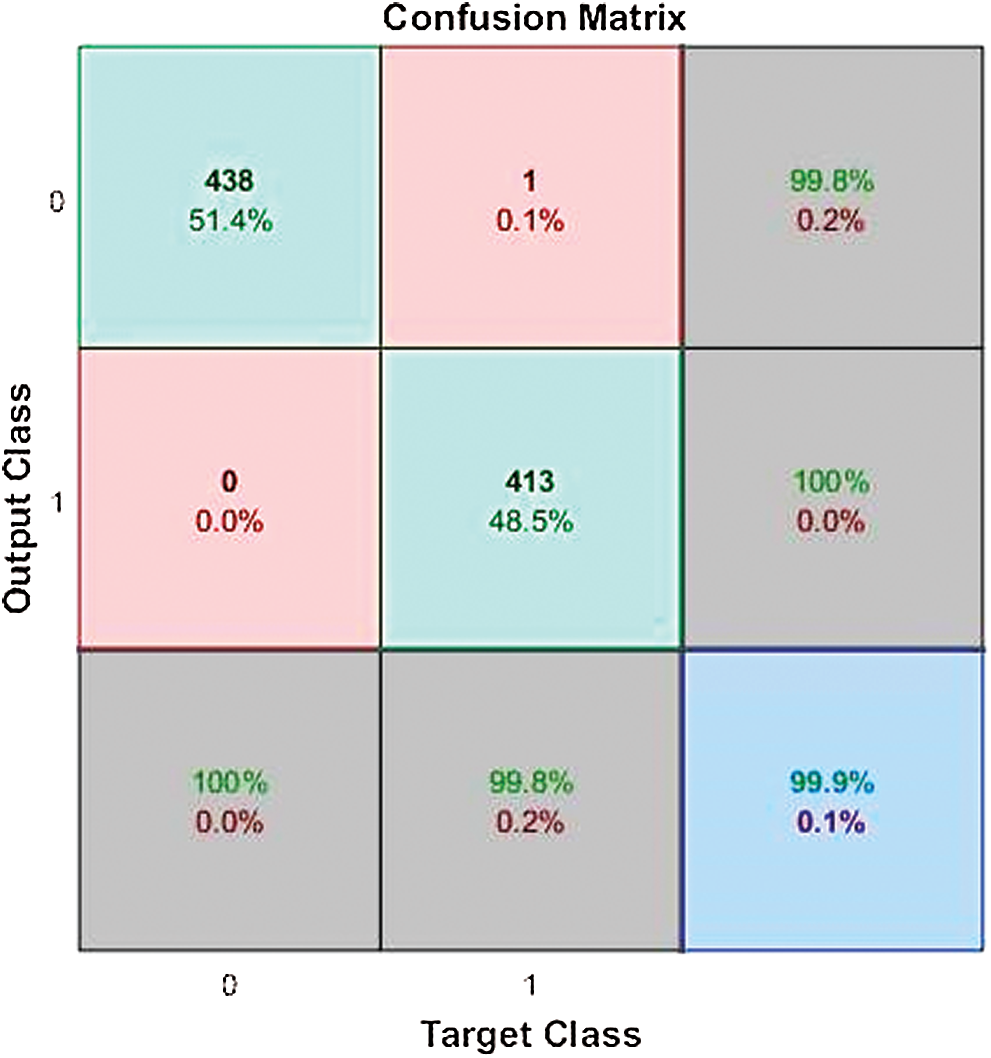
Figure 15: BRANN confusion matrix
The COVID-19 dataset for Pakistan is classified through machine learning techniques, and their accuracy results are compared. The results show that the NB classifier gives 100% accuracy for this dataset. Therefore, the BRANN best fits the dataset and categorizes the dataset into a normal class and severe class for the COVID-19 outbreak in Pakistan.
The proposed system categorizes the COVID-19 outbreak in Pakistan based on a dataset collected in different regions of Pakistan. Machine learning classifiers play a vital role in the classification, categorization, and prediction of dangerous diseases such as COVID-19. With the help of various machine learning techniques, the loss from COVID19 can be minimized in the upcoming months in Pakistan. First, we classified the COVOD-19 dataset using different machine learning classifiers. Then, the BRANN classifier was used to categorize the nature of outbreak as normal or severe. The experiments show that the BRANN provides a best fit regression plot with minimal error rate. In future, the proposed model can be further tested on a larger dataset [39,40] to test its scalability.
Funding Statement: The authors are grateful to the Raytheon Chair for Systems Engineering for funding.
Conflicts of Interest: The authors declare that they have no conflicts of interest to report regarding the present study.
1. W. H. Organization, “Health topics. Coronavirus,” Coronavirus: Symptoms, World Health Organization, 2020. [Online]. Available: https://www.who.int/healthtopics/coronavirus#tab=tab_3. [Google Scholar]
2. K. Karim, S. Guha and R. Beni, “Globalism after covid-19 pandemic: A turning point in the separation of social and economic aspects,” Voice of the Publisher, vol. 6, no. 2, pp. 7–17, 2020. [Google Scholar]
3. N. N. Thilakarathne, M. K. Kagita, T. R. Gadekallu and P. K. R. Maddikunta, “The adoption of ict powered healthcare technologies towards managing global pandemics,” arXiv e-prints, arXiv: 2009.05716, 2020. [Google Scholar]
4. B. G. Ali, T. Announce and G. Amr, “The day after tomorrow: Cardiac surgery post-covid-19,” Authorea Preprints, 2020. https://doi.org/10.22541/au.159284828.87817861. [Google Scholar]
5. J. M. Read, J. R. Bridgen, D. A. Cummings, A. Ho and C. P. Jewell, “Novel coronavirus 2019-ncov: Early estimation of epidemiological parameters and epidemic predictions,” MedRxiv, 2020. https://doi.org/10.1101/2020.01.23.20018549. [Google Scholar]
6. A. Wnuk, T. Oleksy and D. Maison, “The acceptance of covid-19 tracking technologies: The role of perceived threat, lack of control, and ideological beliefs,” PLoS One, vol. 15, no. 9, pp. e0238973, 2020. [Google Scholar]
7. K. B. Mitchell and S. R. Weinstein, “Concerns regarding the article entitled âsafe handling of containers of expressed human milk in all settings during the sars-cov-2 (covid-19),” Journal of Human Lactation, vol. 36, no. 3, pp. 542, 2020. [Google Scholar]
8. L. Bourouiba, “Turbulent gas clouds and respiratory pathogen emissions: Potential implications for reducing transmission of covid-19,” JAMA, vol. 323, no. 18, pp. 1837–1838, 2020. [Google Scholar]
9. M. Begum, M. S. Farid, S. Barua and M. J. Alam, “Covid-19 and Bangladesh: Socio-economic analysis towards the future correspondence,” Asian Journal of Agricultural Extension, Economics & Sociology, pp. 143–155, 2020. https://doi.org/10.20944/preprints202004.0458.v1. [Google Scholar]
10. N. Noreen, S. Dil, S. Niazi, I. Naveed, N. Khan et al., “Covid 19 pandemic & Pakistan; limitations and gaps,” Global Biosecurity, vol. 1, no. 4, pp. 1–11, 2020. [Google Scholar]
11. U. Ramzan, “Coronavirus diagnostic kits arrived in Pakistan_ace news,” ACE News, 2020. https://acenews.pk/coronavirus-diagnostic-kits-arrived-in-pakistan/. [Google Scholar]
12. Pakistan Government, “Covid-19 situation,” 2020. [Online]. Available: http://covid.gov.pk/ [Last accessed 16 September 2020]. [Google Scholar]
13. N. Noreen, S. Dil, S. U. K. Niazi, I. Naveed, N. U. Khan et al., “COVID 19 Pandemic & Pakistan; limitations and gaps,” Global Biosecurity, vol. 2, no. 1, 1–11, 2020. [Google Scholar]
14. S. Montanari, “Japan has a remarkably low number of coronavirus cases that experts worry may lead to a false sense of security, pp. 1–6, 2020. https://www.businessinsider.com/why-japan-cases-of-corona virus-are-so-low-2020-3. [Google Scholar]
15. J. M. Goraya, “Testing people for covid,” 2020. [Online]. Available: https://www.geo.tv/latest/279454-is-pakistan-testing-enough-people-for-covid-19 [Last accessed 16 September 2020]. [Google Scholar]
16. M. MK, G. Srivastava, S. R. K. Somayaji, T. R. Gadekallu, K. Reddy et al., “An incentive-based approach for COVID-19 using blockchain technology,” arXiv preprint arXiv: 2011.01468, 2020. [Google Scholar]
17. S. Bhattacharya, P. K.Reddy, Q. Pham, T. R. Gadekallu, C. Chowdhary et al., “Deep learning and medical image processing for coronavirus (COVID-19) pandemic: A survey,” Sustainable Cities and Society, vol. 65, p. 102589, 2021. https://doi.org/10.1016/j.scs.2020.102589. [Google Scholar]
18. F. Times, “Coronavirus tracked: The latest figures as the pandemic spreads,” Financial Times, 2020. https://www.ft.com/content/a2901ce8-5eb7-4633-b89ccbdf5b386938. [Google Scholar]
19. N. Jafarpisheh and M. Teshnehlab, “Cancers classification based on deep neural networks and emotional learning approach,” IET Systems Biology, vol. 12, no. 6, pp. 258–263, 2018. [Google Scholar]
20. Z. Cai, J. Gu, C. Wen, D. Zhao, C. Huang et al., “An intelligent parkinsonâs disease diagnostic system based on a chaotic bacterial foraging optimization enhanced fuzzy knn approach,” Computational and Mathematical Methods in Medicine, vol. 2018, Article ID 2396952, 2018. https://doi.org/10.1155/2018/2396952. [Google Scholar]
21. C. Iwendi, A. K. Bashir, P. Atharv, R. Sujatha, J. M. Chatterjee et al., “COVID-19 patient health prediction using boosted random forest algorithm,” Frontiers in Public Health, vol. 8, pp. 357, 2020. [Google Scholar]
22. T. T. Ramanathan and D. Sharma, “An SVM-fuzzy expert system design for diabetes risk classification,” International Journal of Computer Science and Information Technologies, vol. 6, no. 3, pp. 2221–2226, 2015. [Google Scholar]
23. C. B. C. Latha and S. C. Jeeva, “Improving the accuracy of prediction of heart disease risk based on ensemble classification techniques,” Informatics in Medicine Unlocked, vol. 16, no. 6, pp. 100203, 2019. [Google Scholar]
24. S. Vyas, R. Ranjan, N. Singh and A. Mathur, “Review of predictive analysis techniques for analysis of diabetes risk,” in 2019 Amity Int. Conf. on Artificial Intelligence, Dubai, United Arab Emirates, IEEE, pp. 626–631, 2019. [Google Scholar]
25. W. Chang, Y. Liu, Y. Xiao, X. Yuan, X. Xu et al., “A machine-learning-based prediction method for hypertension outcomes based on medical data,” Diagnostics, vol. 9, no. 4, pp. 178, 2019. [Google Scholar]
26. R. C. Lacson, B. Baker, H. Suresh, K. Andriole, P. Szolovits et al., “Use of machine-learning algorithms to determine features of systolic blood pressure variability that predict poor outcomes in hypertensive patients,” Clinical Kidney Journal, vol. 12, no. 2, pp. 206–212, 2019. [Google Scholar]
27. S. Tian, W. Hu, L. Niu, H. Liu, H. Xu et al., “Pulmonary pathology of early phase 2019 novel coronavirus (covid-19) pneumonia in two patients with lung cancer,” Journal of Thoracic Oncology, vol. 15, no. 5, pp. 700–704, 2020. [Google Scholar]
28. A. Jaafari, M. Panahi, B. T. Pham, H. Shahabi, D. T. Bui et al., “Meta optimization of an adaptive neuro-fuzzy inference system with grey wolf optimizer and biogeography-based optimization algorithms for spatial prediction of landslide susceptibility,” Catena, vol. 175, no. 3, pp. 430–445, 2019. [Google Scholar]
29. E. Kirkos, C. Spathis and Y. Manolopoulos, “Support vector machines, decision trees and neural networks for auditor selection,” Journal of Computational Methods in Sciences and Engineering, vol. 8, no. 3, pp. 213–224, 2008. [Google Scholar]
30. D. R. Amancio, C. H. Comin, D. Casanova, G. Travieso, O. Martinez Bruno et al., “A systematic comparison of supervised classifiers,” PLoS One, vol. 9, no. 4, pp. 1–13, 2014. [Google Scholar]
31. J. M. Górriz, J. Ramírez, J. Suckling, I. A. Illán, A. Ortiz et al., “Case-based statistical learning: A non-parametric implementation with a conditional-error rate SVM,” IEEE Access, vol. 5, pp. 11468–11478, 2017. [Google Scholar]
32. A. Al-Nasheri, G. Muhammad, M. Alsulaiman, Z. Ali, K. H. Malki et al., “Voice pathology detection and classification using auto-correlation and entropy features in different frequency regions,” IEEE Access, vol. 6, pp. 6961–6974, 2017. [Google Scholar]
33. Mesum RazaHemani, “Coronavirus Pakistan dataset 2020,” [Online]. Available:https://www.kaggle.com/mesumraza/coronavirus-pakistan-dataset-2020?select=COVID_ FINAL_DATA.xlsx [Last accessed 16 September 2020]. [Google Scholar]
34. T. Reddy, M. P. K. Reddy, K. Lakshmana, R. Kaluri, D. S. Rajput et al., “Analysis of dimensionality reduction techniques on big data,” IEEE Access, vol. 8, pp. 54776–54788, 2020. [Google Scholar]
35. T. Reddy, S. Bhattacharya, P. K. R. Maddikunta, S. Hakak, W. Z. Khan et al., “Antlion re-sampling based deep neural network model for classification of the imbalanced multimodal dataset,” Multimedia Tools and Applications, pp. 1–25, 2020. https://doi.org/10.1007/s11042-020-09988-y. [Google Scholar]
36. C. Iwendi, Celestine, S. A. Moqurrab, A. Anjum, S. Khan et al., “N-Sanitization: A semantic privacy-preserving framework for unstructured medical datasets,” Computer Communications, vol. 161, pp. 160–171, 2020. [Google Scholar]
37. B. Tripathy, M. Parimala and G. T. Reddy, “Innovative classification, a regression model for predicting various diseases,” in Data Analytics in Biomedical Engineering and Healthcare, Academic Press, pp. 179–203, 2020. https://doi.org/10.1016/B978-0-12-819314-3.00012-4. [Google Scholar]
38. T. R. Gadekallu, N. Khare, S. Bhattacharya, S. Singh, P. K. R. Maddikunta et al., “Deep neural networks to predict diabetic retinopathy,” Journal of Ambient Intelligence and Humanized Computing, 2020. https://doi.org/10.1007/s12652-020-01963-7. [Google Scholar]
39. N. Deepa, Q. V. Pham, D. C. Nguyen, S. Bhattacharya, T. R. Gadekallu et al., “A survey on blockchain for big data: Approaches, opportunities, and future directions,” arXiv preprint arXiv: 2009.00858, 2020. [Google Scholar]
40. M. Tang, M. Alazab and Y. Luo, “Big data for cybersecurity: Vulnerability disclosure trends and dependencies,” IEEE Transactions on Big Data, vol. 5, no. 3, pp. 317–329, 2017. [Google Scholar]
 | This work is licensed under a Creative Commons Attribution 4.0 International License, which permits unrestricted use, distribution, and reproduction in any medium, provided the original work is properly cited. |