DOI:10.32604/cmc.2021.017905
| Computers, Materials & Continua DOI:10.32604/cmc.2021.017905 | |
| Article |
A Secure Intrusion Detection System in Cyberphysical Systems Using a Parameter-Tuned Deep-Stacked Autoencoder
College of Computer Science and Information Technology, University of Tabuk, Tabuk, Saudi Arabia
*Corresponding Author: Nojood O. Aljehane. Email: noaljohani@ut.edu.sa
Received: 16 January 2021; Accepted: 17 March 2021
Abstract: Cyber physical systems (CPSs) are a networked system of cyber (computation, communication) and physical (sensors, actuators) elements that interact in a feedback loop with the assistance of human interference. Generally, CPSs authorize critical infrastructures and are considered to be important in the daily lives of humans because they form the basis of future smart devices. Increased utilization of CPSs, however, poses many threats, which may be of major significance for users. Such security issues in CPSs represent a global issue; therefore, developing a robust, secure, and effective CPS is currently a hot research topic. To resolve this issue, an intrusion detection system (IDS) can be designed to protect CPSs. When the IDS detects an anomaly, it instantly takes the necessary actions to avoid harming the system. In this study, we introduce a new parameter-tuned deep-stacked autoencoder based on deep learning (DL), called PT-DSAE, for the IDS in CPSs. The proposed model involves preprocessing, feature extraction, parameter tuning, and classification. First, data preprocessing takes place to eliminate the noise present in the data. Next, a DL-based DSAE model is applied to detect anomalies in the CPS. In addition, hyperparameter tuning of the DSAE takes place using a search-and-rescue optimization algorithm to tune the parameters of the DSAE, such as the number of hidden layers, batch size, epoch count, and learning rate. To assess the experimental outcomes of the PT-DSAE model, a series of experiments were performed using data from a sensor-based CPS. Moreover, a detailed comparative analysis was performed to ensure the effective detection outcome of the PT-DSAE technique. The experimental results obtained verified the superior performance on the applied data over the compared methods.
Keywords: Cyberphysical system; intrusion detection system; autoencoder; cybersecurity
In general, sensors are embedded in cyberphysical systems (CPSs) to monitor anomalies and manage intrusions and hazards. To predict and prevent abnormalities, anomaly detection systems (ADSs) have been applied. Therefore, ADSs experience false positives (FPs, false alarms) and false negatives (FNs, missed predictions), which result in performance limitations in CPS domains. In particular, FPs tend to recover unwanted information, whereas FNs tend to recover essential data only. These prediction errors result in imbalanced values, which are forwarded to the controller and result in nonoptimal destabilizing control solutions that compromise the system performance. For instance, prediction errors result in catastrophic actions, such as reactor dispersion in process control systems, pollution in water distribution systems, and traffic control in smart transportation networks [1].
CPS networks are comprised of sensors, actuators, and networking modules, which are suitable in the fields of power, automation, development, civil structure, and medicine, among others. Generally, a CPS is a difficult system in which external operations and cyber applications are supported in a combined fashion. Although information and communications technology (ICT) is extremely progressed in CPSs, cybersecurity is still considered a vital issue in several sectors. One of the complicated vulnerabilities in CPSs is intrusion hazards. In the past few decades, close attention has been paid to the enhancement of CPS security. Intrusion detection (ID) is one of the important applications for maximizing the integrity of CPSs. Intrusion detection systems (IDSs) are usually applied to effectively prevent attacks. In 1980, Anderson presented the notion of basic ID, which was later followed by a massive number of studies on IDSs.
In general, IDS approaches are categorized into two major classes: misuse and anomaly prediction. Initially, features of well-known attacks are applied for misuse prediction. At this point, the audited data are related to a database and reported as an intrusion. Although misuse detectors generate the minimum FPs, these detectors have massive limitations. For example, with these detectors, developing and maximizing a comprehensive database represent a tedious operation, and well-known attacks are expected. Many models have been developed for misuse prediction. For example, Abbes et al. established a new protocol analysis to enhance the performance of pattern matching. In [2], the authors estimated ID-based pattern matching. A rule-based expert method has been used for misuse prediction. Moreover, a genetic algorithm (GA) has been employed for computing misuse detection. Recently, data mining (DM) schemes have been used to develop misuse prediction approaches. An extensive review of ID by GAs and DM is available in [3]. However, only a few efforts were made to classify and predict system intrusions under the application of colored Petri nets. Anomaly detectors shape the general behavior of a network. An intrusion is defined as considerable degradation from general system operation. One of the major benefits of these detectors is their ability to identify attacks, which is traditionally unknown. Unlike classical models, this model yields FPs, although its accuracy is low.
Some prediction approaches depend on clustering models. Recently, several artificial learning methods have been extensively applied in anomaly prediction. Currently, the only anomaly detection (AD) technologies available are neural networks (NNs), GAs, and wavelet. Previous works on IDS have assumed misuse detection and anomaly prediction. Conventionally, misuse and anomaly prediction approaches have both major advantages and disadvantages. Previous IDSs have been applied only for the identification of misuse or anomaly attacks, whereas concurrent misuse and anomaly IDSs have been developed to address limitations.
In this study, we introduce a new parameter-tuned deep-stacked autoencoder based on deep learning (DL), called PT-DSAE, for the IDS in CPSs. The proposed model comprises preprocessing to eliminate the noise present in the data. Next, a DL-based DSAE model is applied to detect anomalies in the CPS. In addition, hyperparameter tuning of the DSAE is performed by a search-and-rescue (SAR) optimization algorithm to tune the number of hidden layers, batch size, epoch count, and learning rate. To evaluate the experimental outcomes of the PT-DSAE model, a series of experiments were performed on data from a sensor-based CPS.
Different types of detectors have been introduced with machine learning (ML) and NNs. Goh et al. [4] established an unsupervised method for anomaly prediction in CPS-based recurrent neural networks (RNNs) as well as a cumulative sum approach. Kosek [5] implied a contextual AD technology for smart grids based on NNs. Krishnamurthy et al. [6] used a secondary method called Bayesian networks, which provides a means for learning causal correlations and temporal relations in cyber and external parameters from unlabeled data using Bayesian systems. Such modules are employed to predict abnormalities and isolate root causes. Jones et al. [7] developed a method based on formal ones to compute AD in CPSs. This model is equipped with model-free, unsupervised learning, which tends to create signal temporal logic (STL) from the final outcomes collected in common operations. Next, anomalies are predicted by a flagging method that does not satisfy the learned function. Kong et al. [8] described a scheme based on formal methods for supervised anomaly learning.
Chibani et al. [9] investigated the problems faced while creating fault detection filters in fuzzy systems, which assume errors and failures in discrete-time polynomial fuzzy systems. Moreover, AD is employed in security intrusions to predict the CPS over the intrusions. Urbina et al. [10] used a physics-based prediction of stealthy intrusions through industrial control systems. Conventional works are defined with prediction principles, which does not restrict the influence of stealthy attacks. Next, a new measure was utilized to measure the impacts, demonstrating attacks distinguished with better configuration. Unlike former schemes, Kleinmann et al. [11] considered predictive attacks over industrial control networks on the basis of cyber anomalies, and various modalities have been considered for forecasting errors projected in traffic networks.
Lu et al. [12] recommended a former work in AD of traffic sensors that, according to the level of data used, categorizes detection methods into three phases: macroscopic, mesoscopic, and microscopic. In general, several data correction approaches have provided practical guidelines for AD in traffic networks. Zygouras et al. [13] developed three methods based on Pearson’s correlation, cross-correlation, and multivariate ARIMA to examine failed traffic values. They also employed crowdsourcing to resolve indefinite values in faulty sensors. Finally, Robinson [14] applied a sample based on the correlation between flows at close sensors to detect faulty loop detectors.
3 The Proposed Parameter-Tuned Deep-Stacked Autoencoder Model
Fig. 1 shows the process involved in the proposed PT-DSAE model. As depicted, the input data are first preprocessed to remove noise. Then, DSAE-based classification is performed, in which the parameters are optimized using an SAR optimization algorithm.
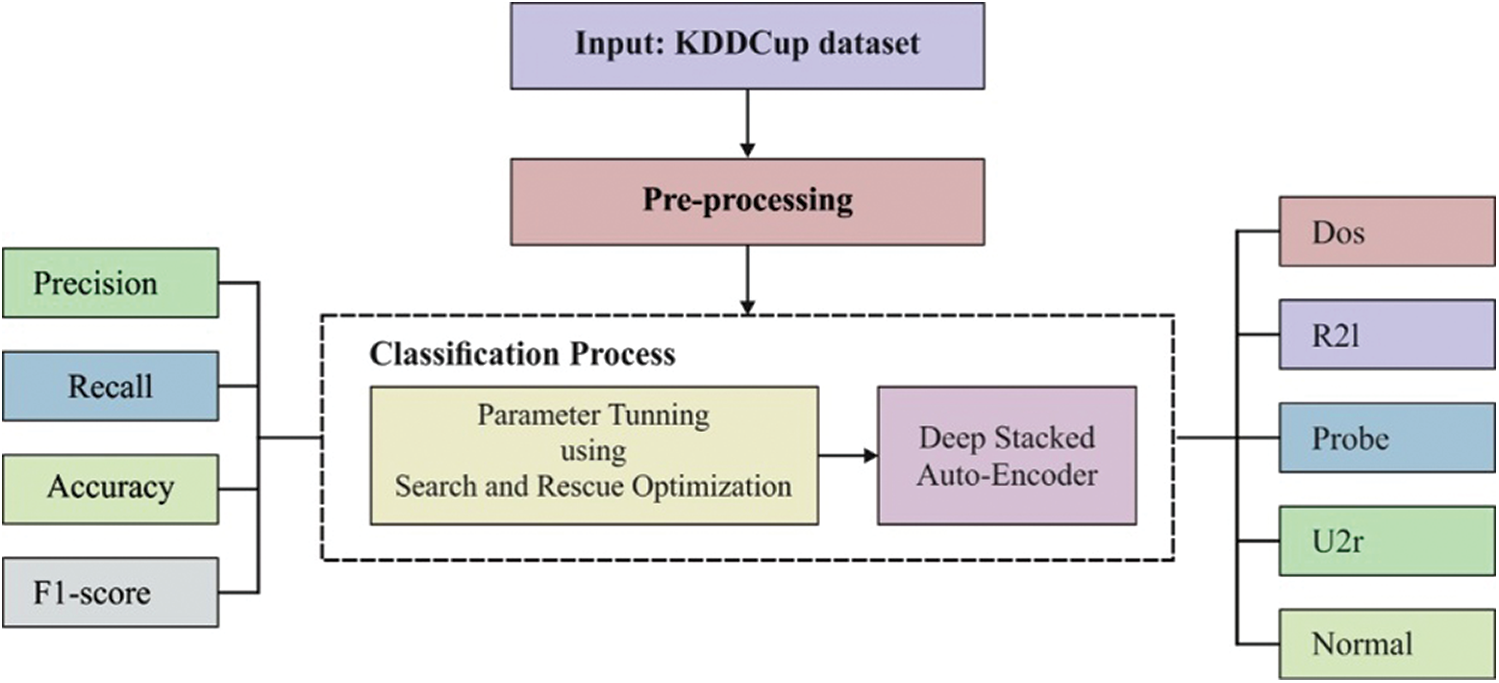
Figure 1: Steps followed in the proposed model
It should be noted that the stacked autoencoder (SAE) applied in this study was developed using various autoencoder (AE) and logistic regression (LR) layers, as depicted in Fig. 2. The AE is a fundamental unit of the SAE classification method. It is composed of an encoding step (Layers 1 to 2) and a decoding or reconstruction step (Layers 2 to 3). This process is depicted in Eqs. (1) and (2), where W and WT (transpose of W) are weight matrices of modes b and b′ are 2 various bias vectors of this mode; s is defined as a nonlinearity function, like the applied sigmoid function; y denotes latent parameter implication of the input layer x; and z is viewed as a prediction of x given y, which has a similar shape to that of x:
Various AE layers are jointly stacked in the unsupervised pretraining phase (Layers 1 to 4). Then, the secondary representation ‘y’ processed by the AE is applied as an input to the upcoming AE layer. The layer then undergoes training as an AE by reducing the reconstruction error, which has simultaneously been computed [15]. Then, the reconstruction error (loss function
Importantly, the reconstruction failure is limited when a gradient descent (GD) model is applied. Hence, the weights in Eqs. (1) and (2) should be upgraded on the basis of Eqs. (4)–(6), where 0 implies a learning rate:
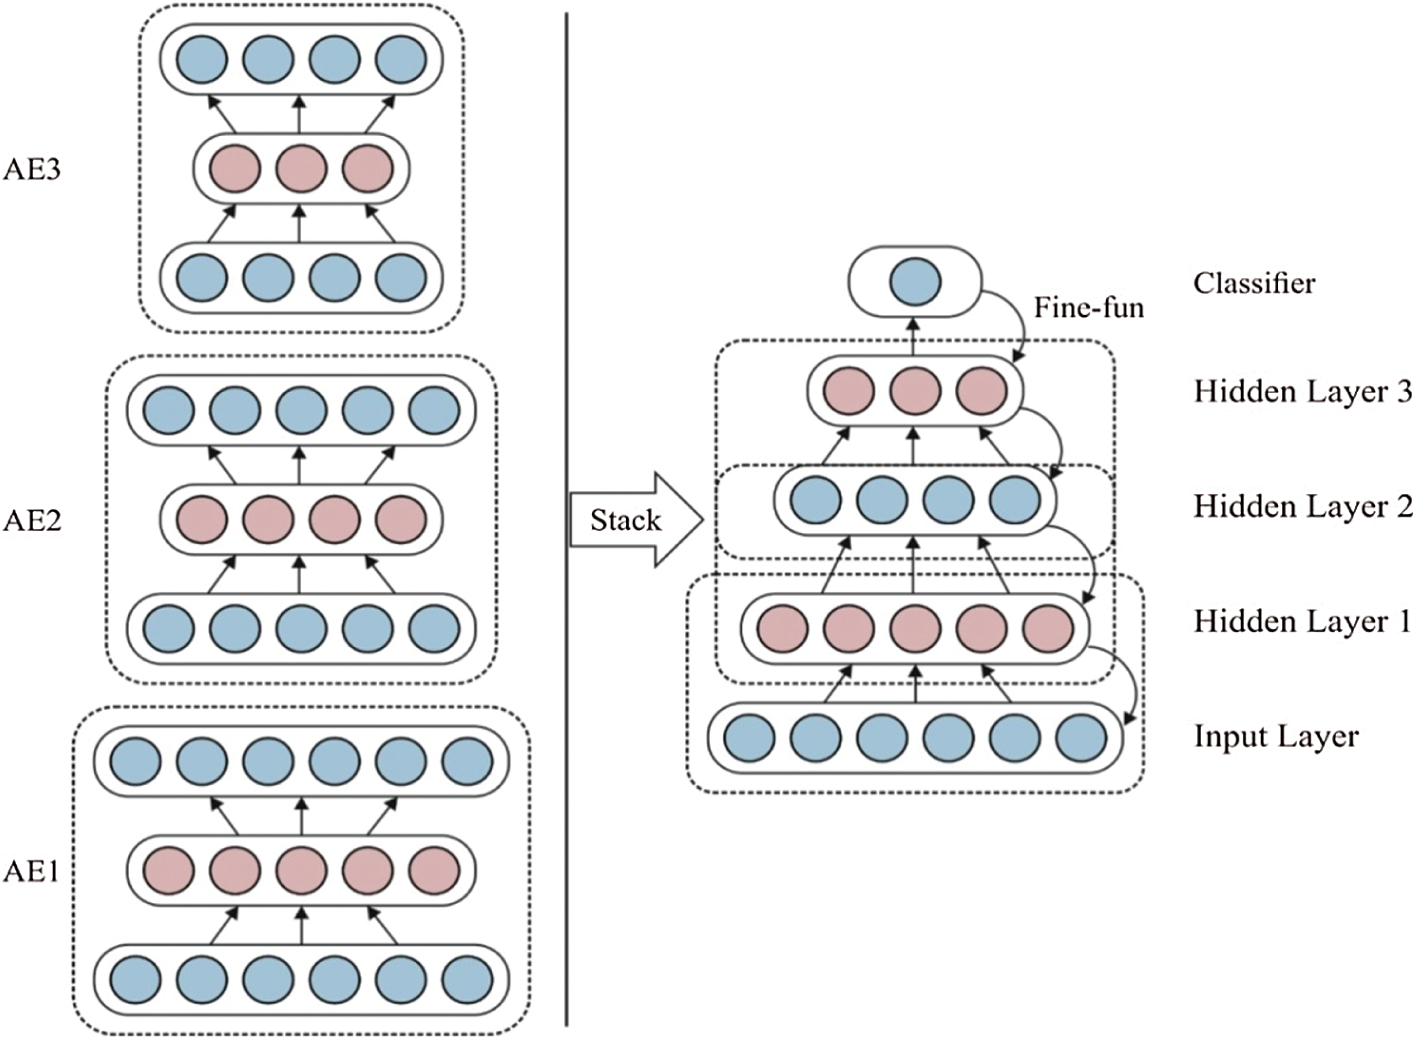
Figure 2: Stacked autoencoder (SAE) structure
Once the layers are pretrained, the system is supervised at a fine-tuning stage. Then, from the supervised fine-tuning stage, an LR layer is included in an output layer at an unsupervised pretraining phase. In this work, the probability with input vector x (Layer 4) comes under class i as illustrated in formula (7), where y defines a predicted class of input vector
3.2 Parameter Optimization of a Deep-Stacked Autoencoder
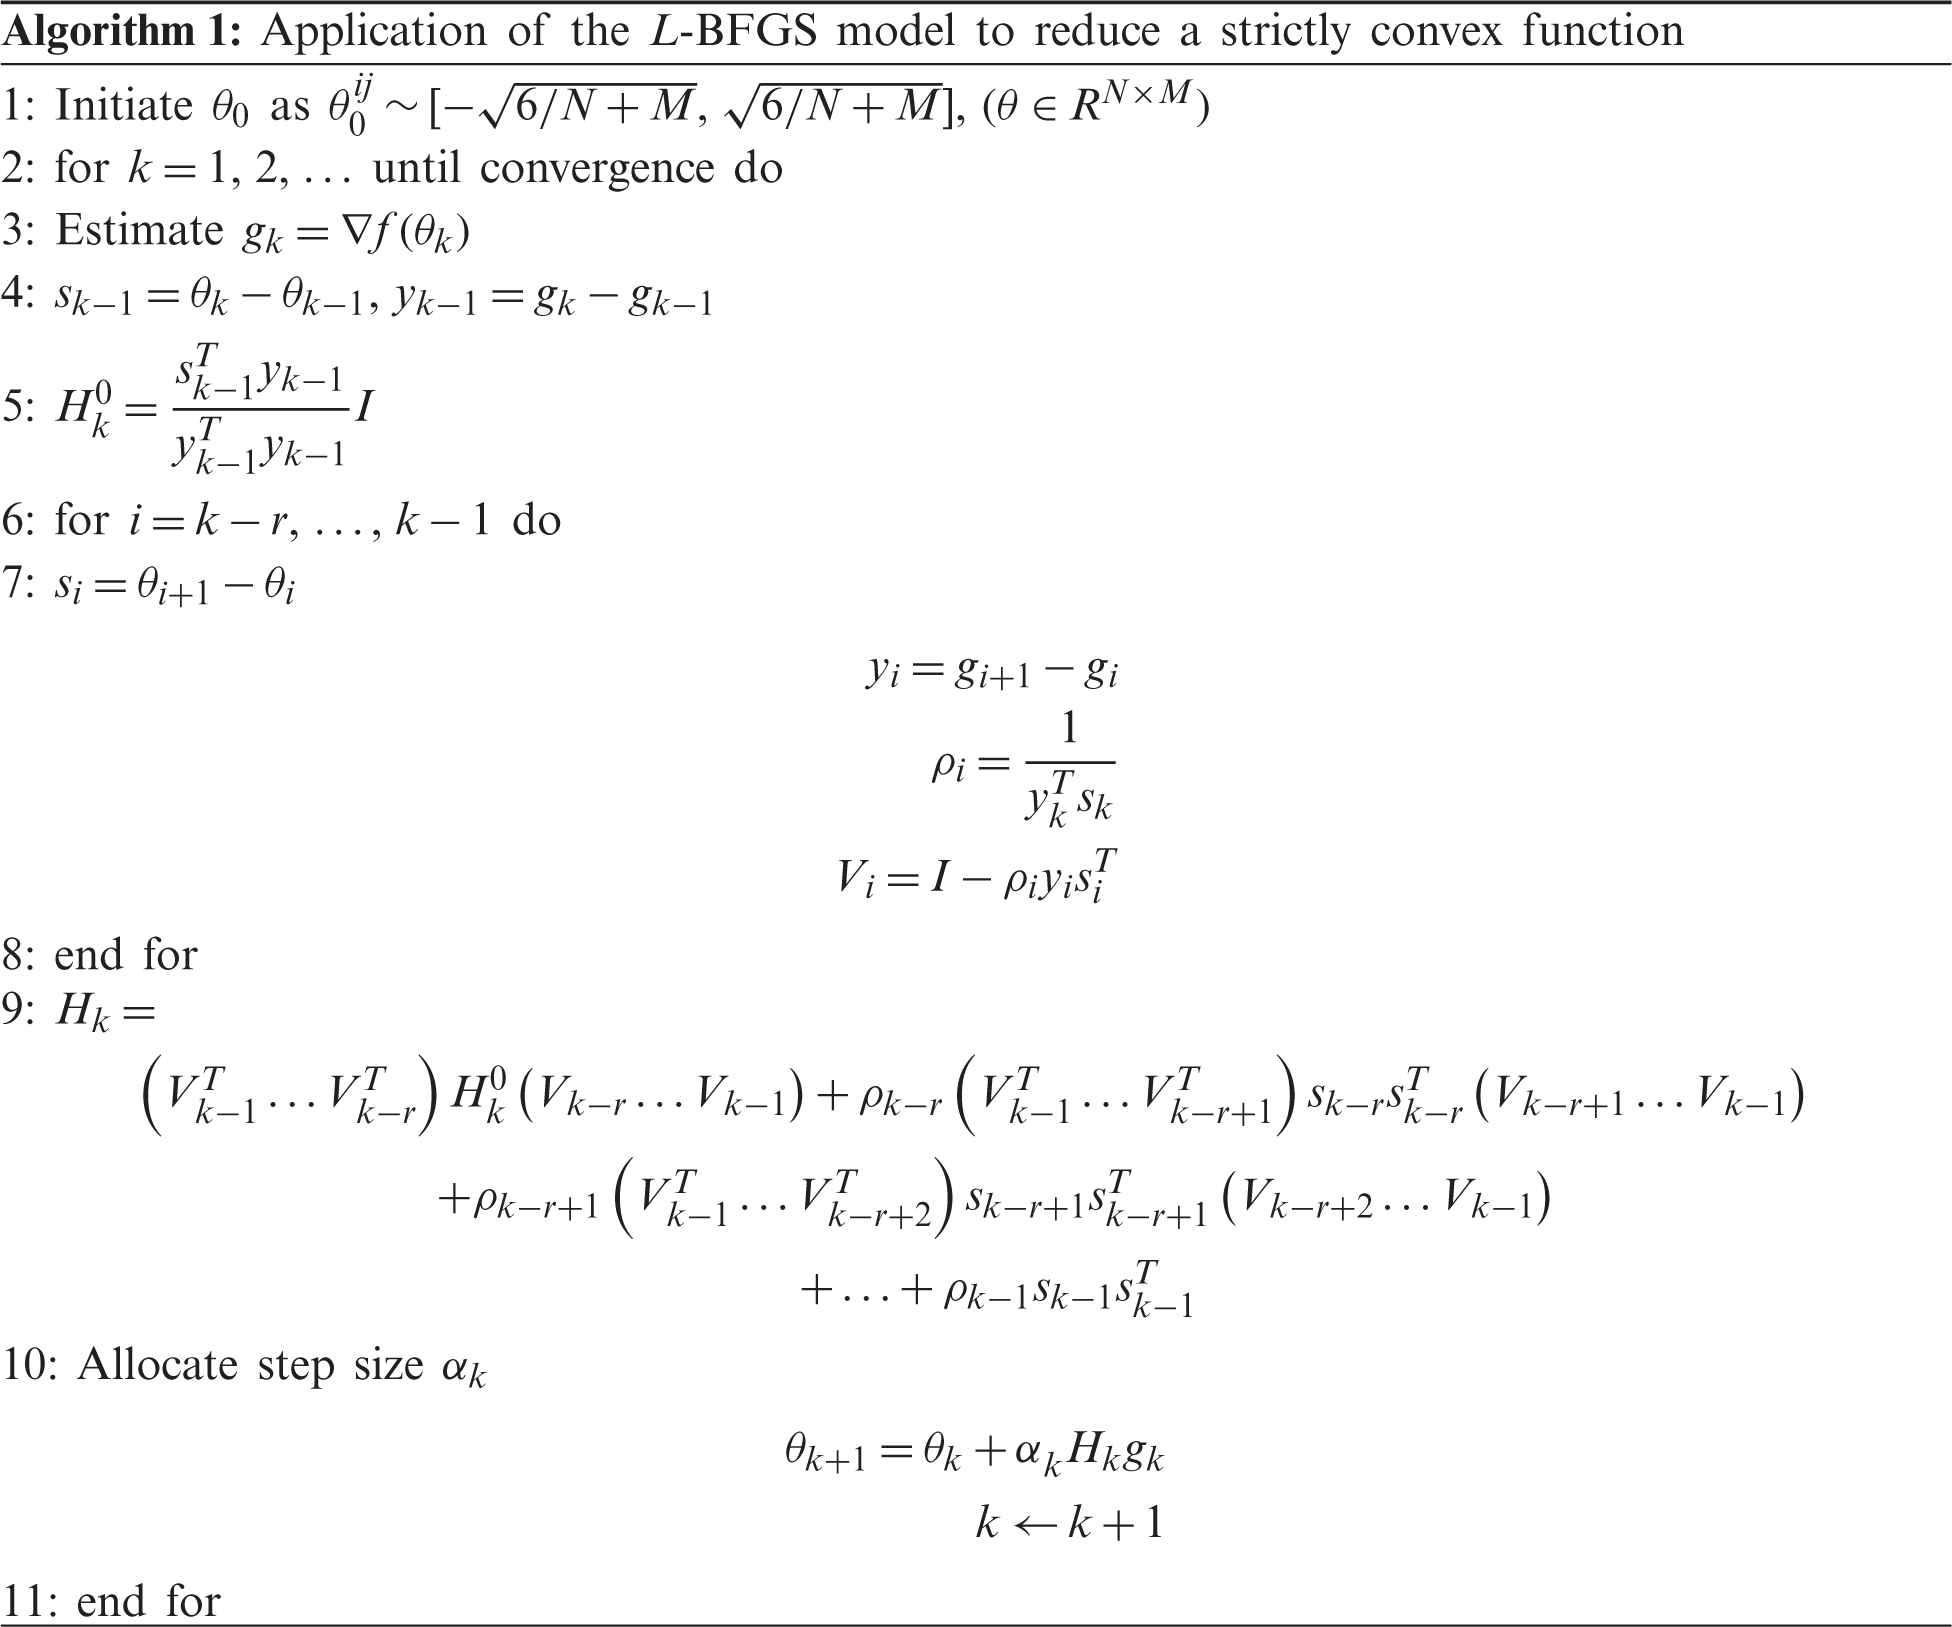
In SAE networks, the pretraining layer is essential to gain the best weights with the help of an optimization model, and this is applied as initial variables for deep AE systems. Then, optimal attributes are applied to achieve the best detection accuracy. One of the effective models applied in this approach is backpropagation (BP), which depends on GD. However, this model has some deficiencies in large data sets, such as a low convergence speed and probability to fall into a local extremum. Here, the L-BFGS method is applied for initial parameter examination. This is one of the significant limited-memory quasi-newton mechanisms that can be applied in large-scale data optimization issues. It can also be applied to search global optima with the maximum convergence speed. The procedure of L-BFGS is defined in
3.3 A Deep-Stacked Autoencoder Model Based on Search and Rescue
To enhance the training process of the L-BFGS model, a SAR optimization algorithm is employed. In SAR, the humans’ places are similar to the solutions attained for optimization issues, and the volume of clues identified in these positions refers to an objective function for such solutions [16]. Fig. 3 shows the flowchart of SAROA.
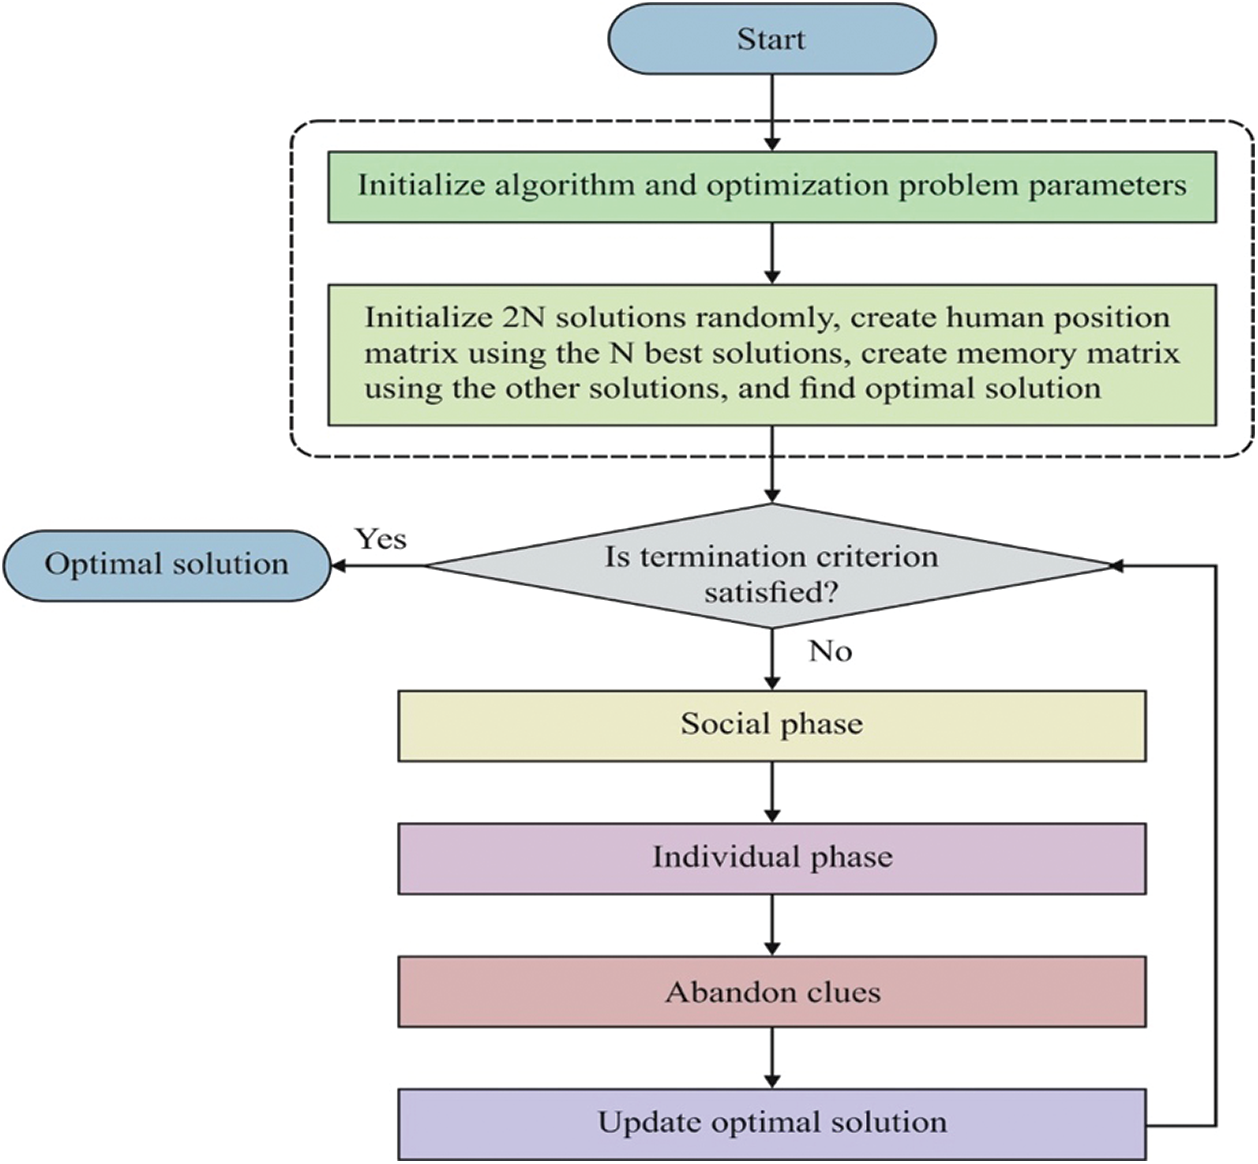
Figure 3: Process of SAROA
Group variants collect clue data in the search, and only a few clues are left after identifying the optimal clues in alternate positions; however, this information is applied to enhance the searching task. In this approach, the places of the remaining clues are recorded in a memory matrix (matrix M), whereas intrusions are assumed in a position matrix (matrix X). The dimensions of matrix M are similar to those of X. In
where M and X refer to the memory and intrusion of a CPS, respectively, and XN1 denotes the place of the first dimension for the Nth value. Additionally, M1D represents the location of the Dth dimension for the first memory. These modules have two phases, a social phase and an individual phase, as shown in the following.
From the given statement, a random clue was considered to find the searching direction using the given expression:
where
Importantly, the search process should be computed when the group members are identified. However, the dimensions of Xi remain the same in Eq. (11). This condition is applied using a binomial crossover operator. Moreover, a defined clue is optimal when compared with clue based on recent position, the regions from SDi direction as well as place of a clue is identified (Area 1); otherwise, a search task is processed in the present location with SDi direction (Area 2). Finally, the given function is applied in a social phase:
where
In the individual phase, intrusions are identified by the present clues applied in the social phase used for the searching process. Unlike in the social phase, the dimensions of Xi are modified in an individual phase. Hence, the intrusion of the ith objective is obtained by the given derivations:
where k and m represent random integer values ranging from 1 to 2N. To eliminate movement with other clues, k and m are selected in
In metaheuristic approaches, solutions should be placed in a solution space. When the solution exceeds the considered solution space, then it needs to be changed. Thus, when an IDS is processed from a solution space, the following equation is applied to change the new position:
where
In all iterations, the group members find two stages in which the measure of the objective function at position X(f(X)) is higher than the existing one (f(Xi)). The traditional position (X) is saved randomly from a memory matrix (M) with the help of Eq. (15) and is approved as a novel place with the help of Eq. (16); otherwise, it is left and the memory remains the same:
where Mn denotes the place of the nth clue saved in the memory matrix and n defines a random integer value from 1 to N. This allows memory updates to enhance the diversity of a model and the capability of this model to identify a global optimum.
In the case of an SAR process, time is considered a significant factor, because when people get wounded, any delay by the SAR teams prevents them from finding these people. Hence, the process defined above is computed with a massive space and limited time duration. In general, the unsuccessful search number (USN) is fixed as 0 for all human beings. When an intrusion is examined, the USN is set as 0; otherwise, it is changed to 1, as shown below:
where USNi shows the time of human i was not applicable to identify optimal clues. If the USN is higher than the maximum unsuccessful search value (MU), then a random position is selected in a search space by Eq. (18), and USNi is fixed as 0:
where r4 refers to a random value with a uniform distribution ranging from 0 to 1, which differs from one dimension to another.
Generally, SAR is composed of two control variables: social effect (SE) and MU. The SE is applied to manage the impact of group members in the social phase. This attribute falls in the range
For an experimental analysis, a series of experiments were performed on the NSL-KDD dataset, which includes samples under five attack types. This dataset contains a total of 45,927 samples under denial-of-service (DoS) attack, 995 samples under R21 attack, 11,656 samples under probe attack, 52 samples under U2r attack, and 67,343 samples under normal attack, as shown in Tab. 1. Fig. 4 presents details related to this dataset.
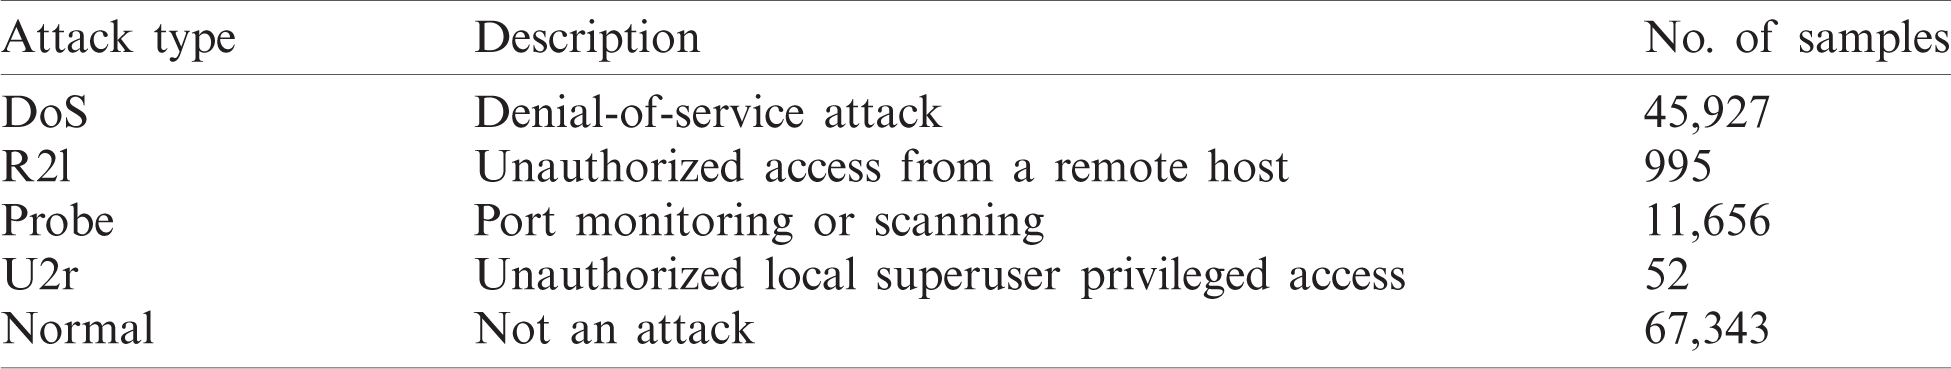
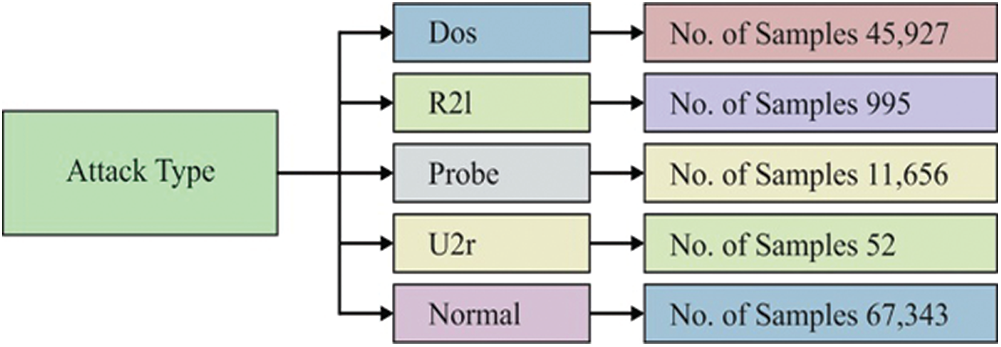
Figure 4: Types of attacks in the NSL-KDD dataset
Both Tab. 2 and Fig. 5 show the performance of the PT-DSAE model in the identification of intrusions in a CPS. The figure shows that the PT-DSAE model has detected DoS attacks with a precision of 0.9702, recall of 0.9837, F-measure of 0.9778, and accuracy of 0.9787; R21 attacks with a precision of 0.9806, recall of 0.9861, F-measure of 0.9872, and accuracy of 0.9867; probe attacks with a precision of 0.9895, recall of 0.9922, F-measure of 0.9933, and accuracy of 0.9918; U2r attacks with a precision of 0.9793, recall of 0.9863, F-measure of 0.9851, and accuracy of 0.9842; normal attacks with a precision of 0.9758, recall of 0.9840, F-measure of 0.9851, and accuracy of 0.9842; and intrusions with a average precision of 0.9791, recall of 0.9865, F-measure of 0.9860, and accuracy of 0.9849.
Table 2: Result analysis of the proposed PT-DSAE method
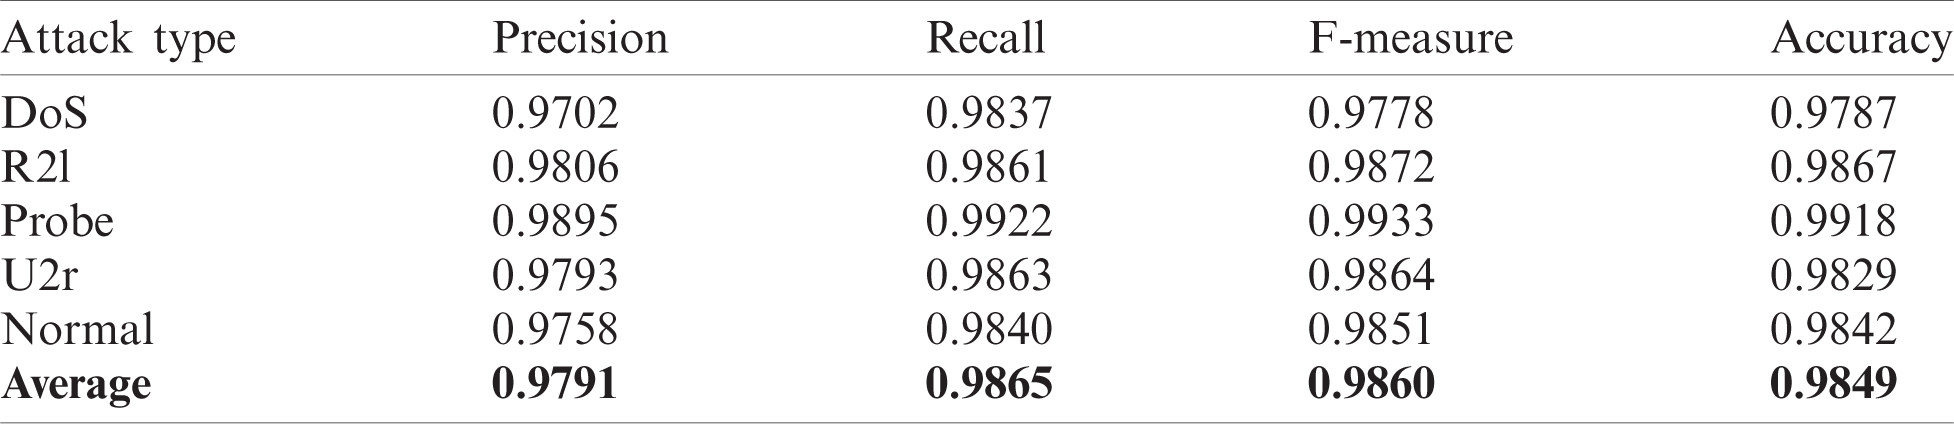
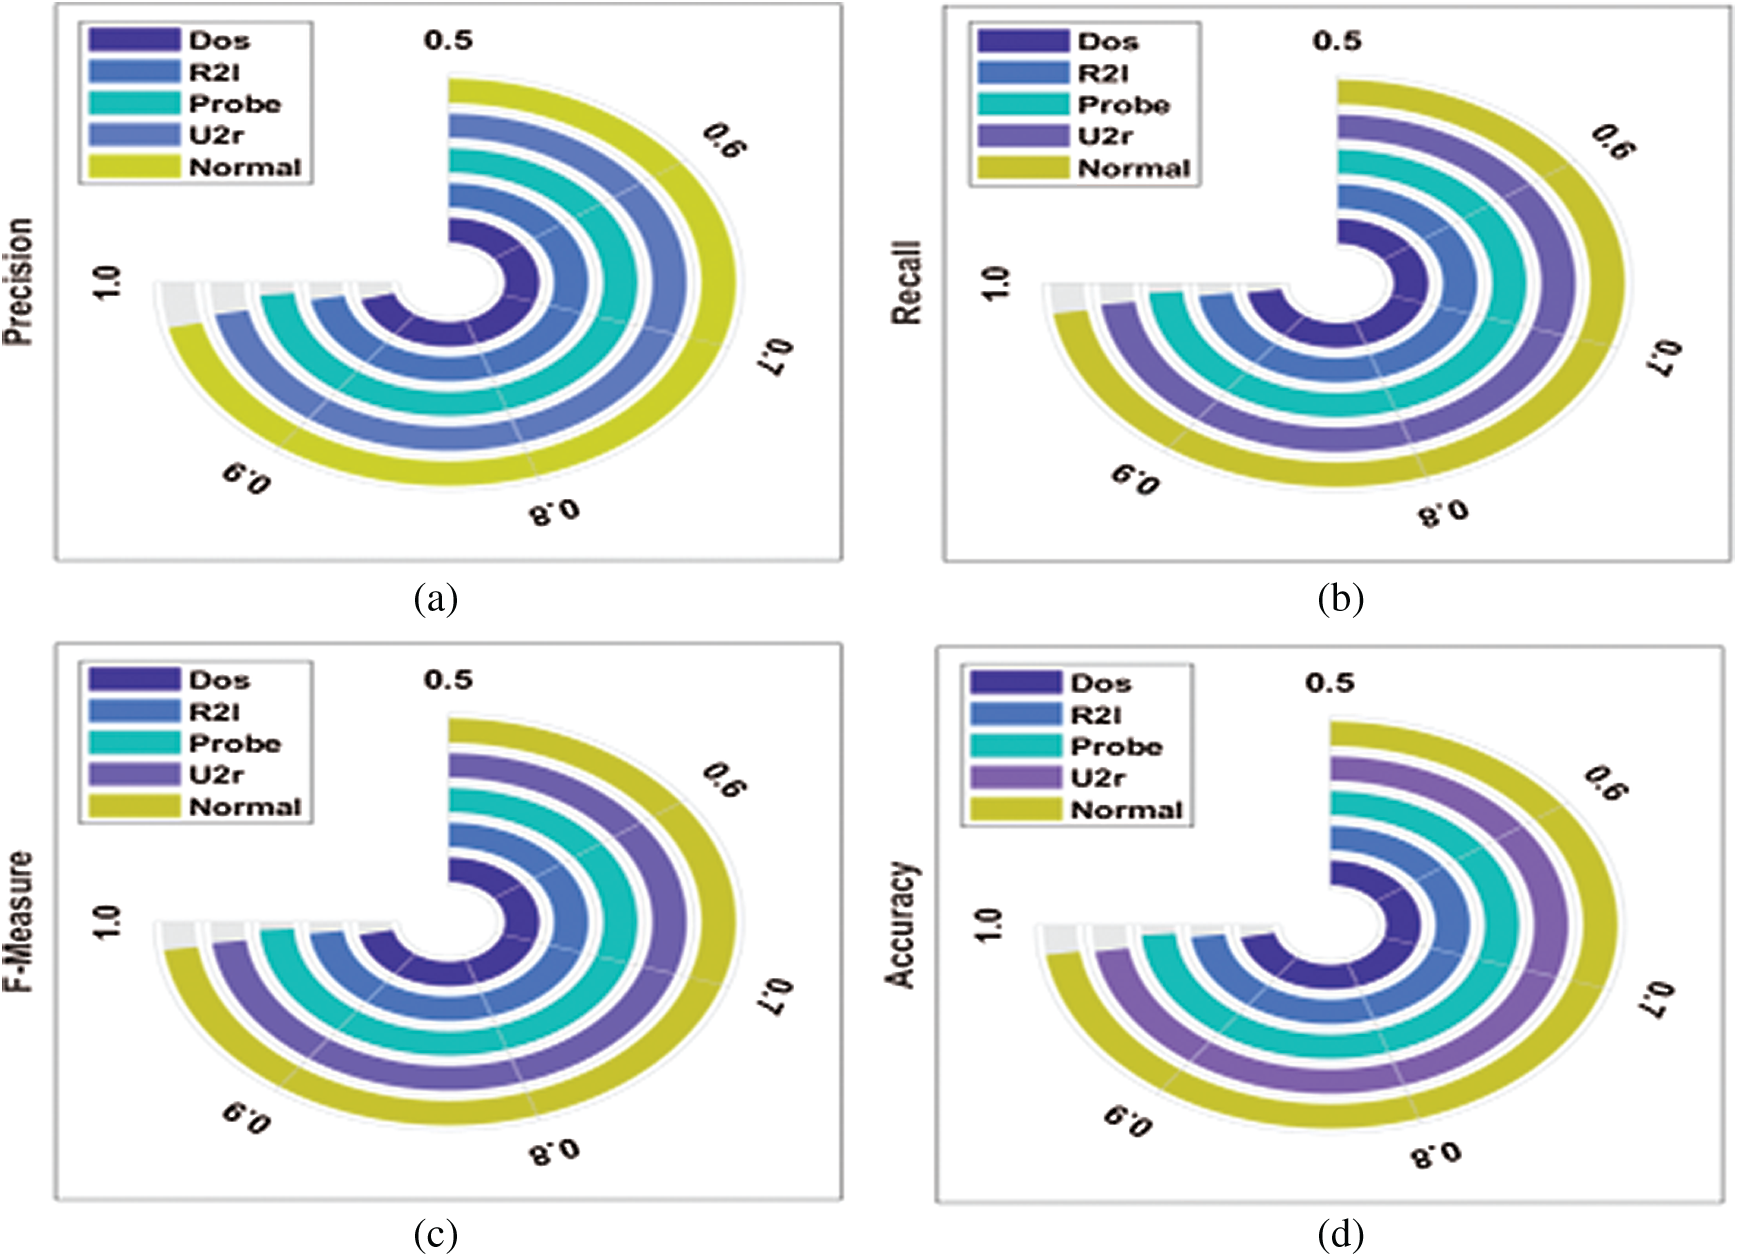
Figure 5: Result analysis of the PT-DSAE method with different measures (a) Precision; (b) Recall; (c) F-measures and (d) Accuracy
Tab. 3 and Figs. 6 and 7 show a comparative result analysis of the PT-DSAE model with existing models with respect to distinct measures [17–21]. Regarding classifier results with respect to precision, the figure shows that the IDBN model yielded a poor classifier outcome with the least precision of 0.904. At the same time, the AK-NN model surpassed the IDBN model with a precision of 0.9219. Likewise, the DL model attained a precision of 0.9354, while an even better precision of 0.9512 was attained by the DPC-DBN model. Moreover, the DT model attained a moderate precision of 0.9659, while the AdaBoost, T-SID, random forest (RF), and SVM models attained close precision values of 0.9742, 0.9751, 0.9756, and 0.9774, respectively. However, it was observed that the proposed PT-DSAE model attained a maximum precision of 0.9791.
Table 3: Result analysis of existing models with the proposed PT-DSAE method
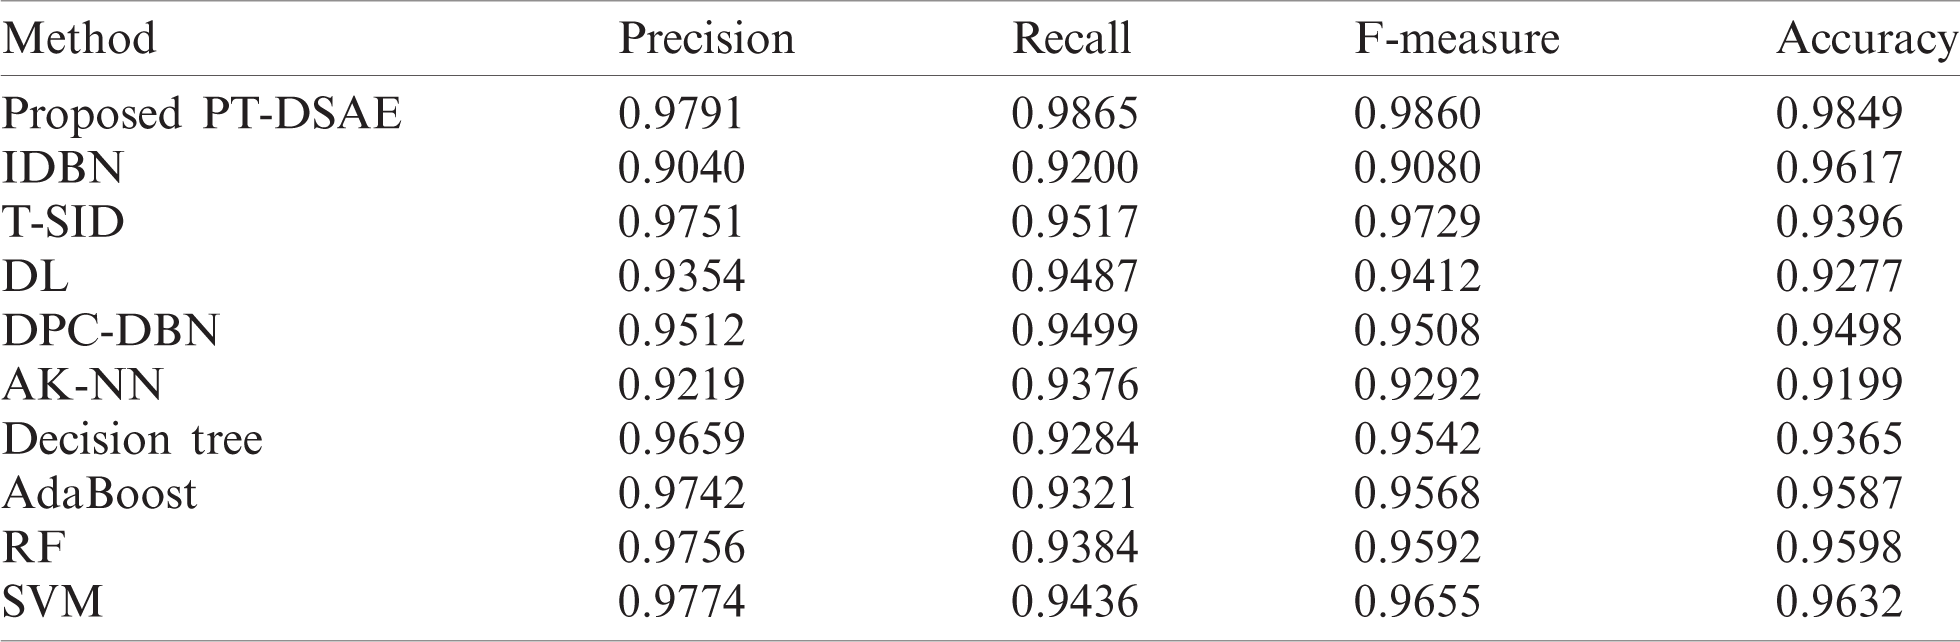
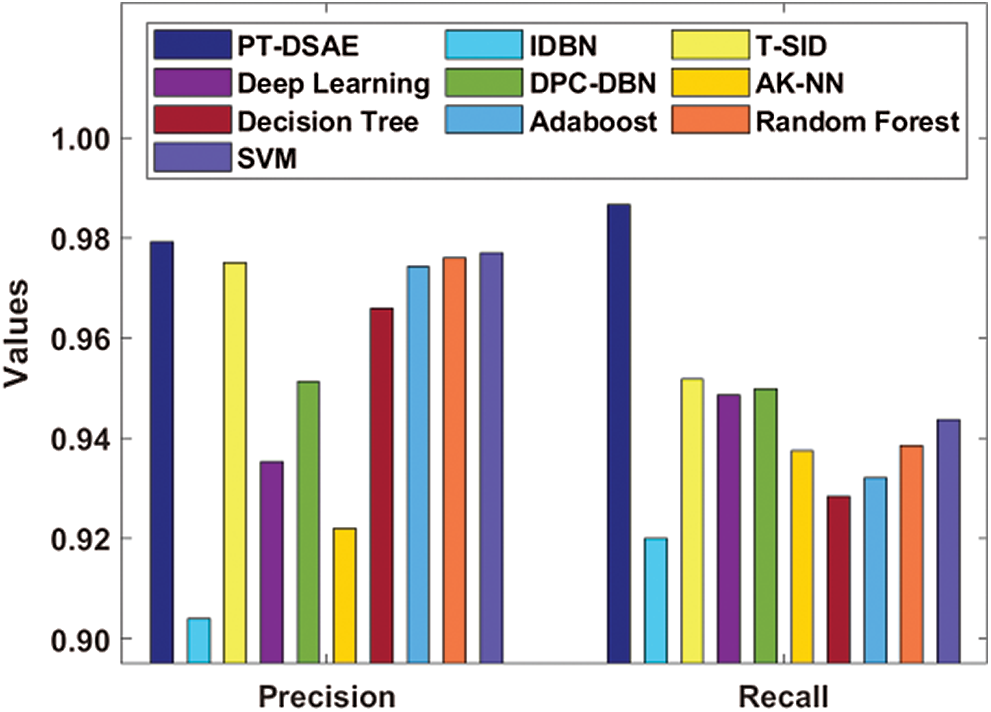
Figure 6: Comparative analysis of the PT-DSAE model in terms of precision and recall
With regard to the computation of the classifier outcomes by means of recall, the Fig. 6 shows that the IDBN method attained an inferior classifier result with a minimum recall of 0.92. Simultaneously, the DT framework outperformed the IDBN model with a recall value of 0.9284. Similarly, the AdaBoost approach generated a recall value of 0.9321, while a moderate recall value of 0.9376 was generated by the AK-NN scheme. In line with this, the RF technology attained a considerable recall value of 0.9384, and the SVM, DL, DPC-DBN, and T-SID methods yielded close recall values of 0.9436, 0.9487, 0.9499, and 0.9517, respectively. Similarly, with regard to the evaluation of the classifier results in terms of F-measure, the Fig. 7 shows that the IDBN method has attained an insignificant classifier outcome with a low F-measure of 0.908. Moreover, the AK-NN technology surpassed the IDBN method with an F-measure of 0.9292. In line with this, the DL approach generated an F-measure of 0.9412, while an acceptable F-measure of 0.9508 was generated by the DPC-DBN framework. Likewise, the DT scheme attained a reasonable F-measure of 0.9542, followed by the AdaBoost, RF, SVM, and T-SID methods, which attained close F-measure values of 0.9568, 0.9592, 0.9655, and 0.9729, respectively. Importantly, it was observed that the proposed PT-DSAE technique attained an optimal F-measure of 0.986.
Figure 7: Comparative analysis of the PT-DSAE model in terms of F-measure and accuracy
With regard to the measurement of the classifier results in terms of accuracy, the Fig. 7 shows that the AK-NN approach yielded an ineffective classifier outcome with a minimal accuracy of 0.9199. Concurrently, the DL scheme performed quite better than the AK-NN model with an accuracy of 0.9277. Moreover, the DT method generated an accuracy of 0.9365, while a reasonable accuracy of 0.9396 was attained by the T-SID model. Similarly, the DPC-DBN scheme yielded a considerable accuracy of 0.9498, whereas the AdaBoost, RF, IDBN, and SVM approaches exhibited close accuracy values of 0.9587, 0.9598, 0.9617, and 0.9632, respectively. Importantly, it was observed that the newly proposed PT-DSAE scheme yielded a superior accuracy of 0.9849.
In this study, we developed an effective IDS using DL models for CPSs. First, input data were preprocessed to remove noise, and then a DSAE-based classification process was performed, in which the parameters were optimized using a SAR optimization algorithm. In SAE networks, the pretraining layer is essential to obtain the best weights with the help of an optimization model, and this is applied as initial variables for deep AE systems. To improve the training process of the L-BFGS model, a SAR optimization algorithm was employed. For an experimental analysis, a series of experiments were performed on the NSL-KDD dataset, which includes samples under five attack types. From the experimental results, it was observed that the PT-DSAE model identified intrusions with an average precision of 0.9791, recall of 0.9865, F-measure of 0.9860, and accuracy of 0.9849. Therefore, it can be applied as an effective tool for intrusion detection in CPSs. In the future, hybrid optimization algorithms can be used to improve the performance.
Funding Statement: The author(s) received no specific funding for this study.
Conflicts of Interest: The authors declare that they have no conflicts of interest to report regarding the present study.
1. T. Abbes, A. Bouhoula and M. Rusinowitch, “Protocol analysis in intrusion detection using decision tree,” in Int. Conf. on Information Technology: Coding and Computing. Proc. ITCC, Las Vegas, Nevada, vol. 1, pp. 404–408, 2004. [Google Scholar]
2. S. Antonatos, K. Anagnostakis and E. Markatos, “Generating realistic workloads for network intrusion detection systems,” in ACM SIGSOFT Software Engineering Notes, vol. 29. New York, United States: ACM, pp. 207–215, 2004. [Google Scholar]
3. V. Kshirsagar, S. Tidke and S. Vishnu, “Intrusion detection system using genetic algorithm and data mining: An overview,” International Journal of Computer Science and Informatics ISSN (PRINT), vol. 2231, pp. 5292, 2012. [Google Scholar]
4. J. Goh, S. Adepu, M. Tan and Z. Lee, “Anomaly detection in cyber physical systems using recurrent neural networks,” in Proc. of the 2017 IEEE 18th Int. Symp. on High Assurance Systems Engineering, Hangzhou, China, pp. 140–145, 2017. [Google Scholar]
5. A. Kosek, “Contextual anomaly detection for cyber-physical security in smart grids based on an artificial neural network model,” in Proc. of the 2016 Joint Workshop on Cyber-Physical Security and Resilience in Smart Grids, Vienna, Austria, pp. 1–6, 2016. [Google Scholar]
6. S. Krishnamurthy, S. Sarkar and A. Tewari, “Scalable anomaly detection and isolation in cyber-physical systems using bayesian networks,” in Proc. of the ASME, 2014 Dynamic Systems and Control Conf. American Society of Mechanical Engineers, San Antonio, Texas, USA, pp. V002T26A006, 2014. [Google Scholar]
7. A. Jones, Z. Kong and C. Belta, “Anomaly detection in cyber-physical systems: A formal methods approach,” in Proc. of the 2014 IEEE 53rd Annual Conf. on Decision and Control, Los Angeles, CA, USA, pp. 848–853, 2014. [Google Scholar]
8. Z. Kong, A. Jones and C. Belta, “Temporal logics for learning and detection of anomalous behavior,” IEEE Trans, vol. 62, pp. 1210–1222, 2017. [Google Scholar]
9. A. Chibani, M. Chadli, S. Ding and N. Braiek, “Design of robust fuzzy fault detection filter for polynomial fuzzy systems with new finite frequency specifications,” Automatica, vol. 93, no. 7, pp. 42–54, 2018. [Google Scholar]
10. D. Urbina, J. Giraldo, A. Cardenas, N. Tippenhauer, J. Valente et al., “Limiting the impact of stealthy attacks on industrial control systems,” in Proc. of the 2016 ACM SIGSAC Conf. on Computer and Communications Security, Kungliga Tekniska Högskolan, pp. 1092–1105, 2016. [Google Scholar]
11. A. Kleinmann and A. Wool, “Automatic construction of statechart-based anomaly detection models for multi-threaded industrial control systems,” ACM Trans. Intell. Syst. Technol., vol. 8, no. 55, pp. 1–21, 2017. [Google Scholar]
12. X. Lu, P. Varaiya, R. Horowitz and J. Palen, “Faulty loop data analysis/correction and loop fault detection,” in Proc. of the 15th World Congress on Intelligent Transport Systems, Datacite, pp. 16–20, 2008. [Google Scholar]
13. N. Zygouras, N. Panagiotou, N. Zacheilas, L. Boutsis, V. Kalogeraki et al., “Towards detection of faulty traffic sensors in real-time,” in Proc. of the 2nd Int. Conf. on Mining Urban Data, Lille, France, pp. 53–62, 2015. [Google Scholar]
14. S. P. Robinson, “The development and application of an urban link travel time model using data derived from inductive loop detectors,” Ph.D. Thesis. University of London, London, UK, 2006. [Google Scholar]
15. W. Li, H. Fu, L. Yu, P. Gong, D. Feng et al., “Stacked autoencoder-based deep learning for remote-sensing image classification: A case study of African land-cover mapping,” International Journal of Remote Sensing, vol. 37, no. 23, pp. 5632–5646, 2016. [Google Scholar]
16. A. Shabani, B. Asgarian, S. A. Gharebaghi, M. A. Salido and A. Giret, “A new optimization algorithm based on search and rescue operations,” Mathematical Problems in Engineering, vol. 2019, no. 2, pp. 1–23, 2019. [Google Scholar]
17. J. Li, Z. Zhao, R. Li and H. Zhange, “AI-based two-stage intrusion detection for software defined IoT networks,” IEEE Internet of Things Journal, vol. 6, no. 2, pp. 2093–2102, 2018. [Google Scholar]
18. A. Diro and N. Chilamkurti, “Distributed attack detection scheme using deep learning approach for internet of things,” Future Generation Computer Systems, vol. 82, no. 6, pp. 761–768, 2018. [Google Scholar]
19. Y. Yang, K. Zheng, C. Wu, X. Niu and Y. Yang, “Building an effective intrusion detection system using the modified density peak clustering algorithm and deep belief networks,” Appl. Sci., vol. 9, no. 2, pp. 23844, 2019. [Google Scholar]
20. Y. Djenouri, A. Belhadi, J. Lin and A. Cano, “Adapted k-nearest neighbors for detecting anomalies on spatio-temporal traffic flow,” IEEE Access, vol. 7, pp. 10015–10027, 2019. [Google Scholar]
21. R. Mansour and E. M. Abdelrahim, “An evolutionary computing enriched RS attack resilient medical image steganography model for telemedicine applications,” Multidim. Syst. Sign Process, vol. 30, no. 4, pp. 791–814, 2019. [Google Scholar]
 | This work is licensed under a Creative Commons Attribution 4.0 International License, which permits unrestricted use, distribution, and reproduction in any medium, provided the original work is properly cited. |