DOI:10.32604/cmc.2021.016828
| Computers, Materials & Continua DOI:10.32604/cmc.2021.016828 | |
| Article |
Outlier Behavior Detection for Indoor Environment Based on t-SNE Clustering
1School of Games, Hongik University, Sejong, 30016, Korea
2Department of Computer Engineering, Jeju National University, Jeju, 63243, Korea
*Corresponding Author: Soo Kyun Kim. Email: kimsk@jejunu.ac.kr
Received: 13 January 2021; Accepted: 28 February 2021
Abstract: In this study, we propose a low-cost system that can detect the space outlier utilization of residents in an indoor environment. We focus on the users’ app usage to analyze unusual behavior, especially in indoor spaces. This is reflected in the behavioral analysis in that the frequency of using smartphones in personal spaces has recently increased. Our system facilitates autonomous data collection from mobile app logs and Google app servers and generates a high-dimensional dataset that can detect outlier behaviors. The density-based spatial clustering of applications with noise (DBSCAN) algorithm was applied for effective singular movement analysis. To analyze high-level mobile phone usage, the t-distributed stochastic neighbor embedding (t-SNE) algorithm was employed. These two clustering algorithms can effectively detect outlier behaviors in terms of movement and app usage in indoor spaces. The experimental results showed that our system enables effective spatial behavioral analysis at a low cost when applied to logs collected in actual living spaces. Moreover, large volumes of data required for outlier detection can be easily acquired. The system can automatically detect the unusual behavior of a user in an indoor space. In particular, this study aims to reflect the recent trend of the increasing use of smartphones in indoor spaces to the behavioral analysis.
Keywords: Outlier detection; trajectory clustering; behavior analysis; app data; smartphone
Recent advances in sensor technology have facilitated the collection of data that had not been previously possible in various industrial sectors. This is because of the miniaturization of sensors and the development of related wireless communication technologies. In particular, with the widespread usage of mobile phones, various data-based industries have emerged. Because mobile phones contain multimodal information, such as camera information, GPS location information, and app usage history, it is possible to provide novel services [1].
In this study, we propose a platform that can easily analyze outlier behavior in indoor spaces at a low cost using personal app logs of mobile phones. Our research uses only spatial information of mobile phones, thus a separate sensor to collect spatial information is not required; moreover, if the consent of the user is obtained, our proposed system has the advantage of being able to collect an enormous amount of data. This ease of data collection helps in increasing the accuracy of machine learning networks and can significantly simplify the procedure of the existing analysis. Previously, spatial analysis [2–4] attempted to propose a methodology similar to ours but it mainly focused on customer analysis for marketing. In addition, various specific human behavioral analyses [5–9] have been proposed based on multimodal data analysis in the real world. However, there have been no studies on indoor spatial behavioral analysis based on trajectory and app analysis.
This study has distinctive advantages from previous studies in that it utilized high-dimensional behavioral data acquired from smartphones for spatial analysis. In particular, we focused on analyzing the interior space of an apartment. Compared to previous studies, our study has the following characteristics:
1. Data labeling for analysis of outlier behaviors: Data collection and automatic labeling techniques are applied for the analysis of outlier behaviors in indoor environments.
2. Outlier behavior clustering algorithms: t-distributed stochastic neighbor embedding (t-SNE)/density-based spatial clustering of applications with noise (DBSCAN)-based behavior clustering algorithms were used for the analysis of outlier behavior.
Our study is related to spatial analysis platforms and behavior clustering. Previous studies related to each subject are described in the following sub-section.
Various platforms that use information collected from small sensors for spatial analysis have been proposed. MobiTrack [10] collected comprehensive data from actual environments of users measured at the point of convergence. This approach has three types of data: behavioral measurements, contextual surveys, and web surveys. The authors collected mobile contextual data by installing a software on a mobile device. Kang et al. [11] proposed an analysis system for behavioral patterns using various data in smartphones. The authors developed a mobile application using an Android platform to collect log data. A complex dataset comprising SMS, picture views, GPS, pictures, weather, calls, battery, MP3, and other data types was used. Harman et al. [12] proposed an application data mining from the use of software repository mining. In addition, they employed pricing information and customer reviews to detect feature information that combines available information more readily to analyze business, apps’ technical, and customer aspects.
Chaix et al. [13] presented the visualization and evaluation of route itineraries, travel destinations, and activity spaces, which is an interactive web mapping application that can geographically locate routes and activities of individuals. Kelly et al. [14] attempted to analyze human location behavior using mobile phone data and investigated how regional behavioral patterns are related to demographics. In addition, they included the social characteristics of individuals. Hamka et al. [15] segmented the mobile service market using log data gathered through a smartphone survey. They presented a method of combining behavioral segmentation with log data that included demographic segmentation and psychographs based on survey data. Mafrur et al. [16] presented an approach for building behavioral models that can be used for human identification using a lifelog. They used 19 types of data sensors, such as location, Wi-Fi, Bluetooth, battery, call log, and SMS logs. The authors reported that when the proposed behavioral recognition system was applied to human identification, a recognition accuracy of 80% was achieved.
Jalali et al. [17] used the concept of lattice-based data fusion for recognizing events. In addition, they showed a framework that extracts frequent co-occurrence patterns as parallel and sequential relations among their events from some event streams. Yamamoto et al. [18] presented a technique for estimating the stress level using a smartphone log. They created a physiologically assessed dataset using associated smartphone logs. Lee et al. [19] presented methods for segmenting smartphone users using app usage sequences collected from smartphone logs. They showed a variant of sequence-to-sequence architecture that combined the features of previous deep neural networks. Fukazawa et al. [20] presented a technique that can detect a co-occurring combination of a user’s real-world and online behavioral features that convert raw sensor data into categorical features. Sarker et al. [21] presented a method to identify the optimal period of recent log data using changes observed in an individual’s behavior. They showed a recency-based method that better predicts an individual’s phone usage behavior than previous baseline models.
The clustering-based behavioral analysis technique is advantageous because it does not require manual data annotations for outlier detection. Yang et al. [22] detected three features from customers’ network behavior, which were divided into different categories, including downloading shared resources, browsing news, and real-time communications. In addition, a support vector machine was used to conduct clustering. Perdisci et al. [23] introduced a scalable network-level behavioral malware clustering system that clustered malware samples following the structural similarities in their HTTP traffic. Bauckhage et al. [24] presented the use of an advanced spatial clustering method to evaluate player behaviors. They also addressed the problem of spatial clustering in multiple Z-level planes and three-dimensional (3D) games with complex map geometries. Drachen et al. [25] presented a range of unsupervised methods that are supported by combining archetypal analysis to create behavioral clusters from playtime data of 70,014 (World of Warcraft players), covering a five-year interval.
De Leoni et al. [26] presented a framework and general solution that unifies several methods for correlation analysis proposed in the literature. Farhan et al. [27] presented a method for analyzing smartphone sensing data to detect differential behavioral features that are associated with depression measurements, such as the patient health questionnaire. Wang et al. [28] proposed an evaluation of a practical design, and scalable clickstream tool for user behavioral analysis. Their system employed similarity metrics between clickstreams to generate similarity graphs that capture behavioral patterns between users. Peach et al. [2] proposed an unsupervised methodology that allows the analysis of raw-time series collected from the engagement of learners. They demonstrated the use of a distributed clustering method to study the online behavior of users with big data. Ahmed et al. [29] proposed a rapid adaptive learning framework for streaming object detection. Huu et al. [30] introduced a 3D residual unit to detect spatio-temporal features in a crowd video.
Compared to previous works, our study proposed a low-cost spatial analysis system that can easily collect large-scale data using mobile app logs, which is the easiest to access among all the existing spatial analysis techniques. Furthermore, clustering techniques that are useful for spatial analysis using the collected data are proposed.
3 Behavioral Outlier Detection System
Our system analyzed user outlier behavior via a three-step process. Fig. 1 depicts the overall process.
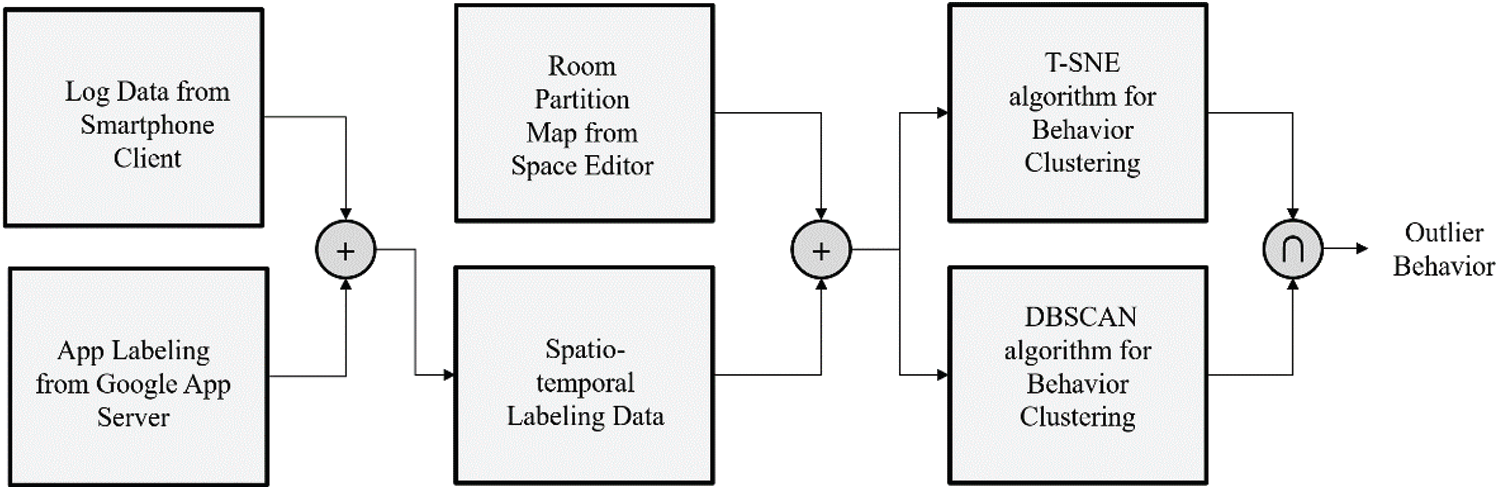
Figure 1: System process
The first step in our proposed method was to collect data from the area to be analyzed. Because there is a threat of privacy invasion in a living space, it is difficult to attach different sensors and collect camera-based data. However, as we used location data and app usage history, which are mainly used in everyday life, we had accessibility to residents of our targeted living space. We used the system proposed in our prior study [31] for data collection. The system comprised web servers and app client structures. The mobile phone app periodically sends GPS information and a list of active apps to the server. This is stored in the server as time-series data. The server communicates with the Google app server to obtain the category value of the app currently in use. It records the currently executed app categories in the database. This was used to determine the category to which the app belongs in the process of data analysis and to understand the intention of the user’s actions. If the user is using a communication tool on the sofa, it is assumed that the user is attempting to communicate with other users on the sofa. Therefore, if the user does most of the communication on the sofa, but rarely communicates in the warehouse, the system attempts to classify this communication into a specific behavioral section. Accordingly, the data must be stored as a time-series data based on the user’s characteristic behavioral parameters.
Consequently, we integrated the trajectory data of users, secondary parameters derived from trajectory data, and app usage details, and used them as a high-dimensional data required for clustering. Tab. 1 lists the dataset used in the experiment. Representative app categories are summarized for these tasks. By 2020, the app categories in the Google Play Store comprised 32 sub-categories; the game category consisted of 17 genres. We reclassified these 17 app genres into eight app categories that are closely related to users’ lifestyles (information, communication, entertainment, news, education, shopping, finance, and telephone).
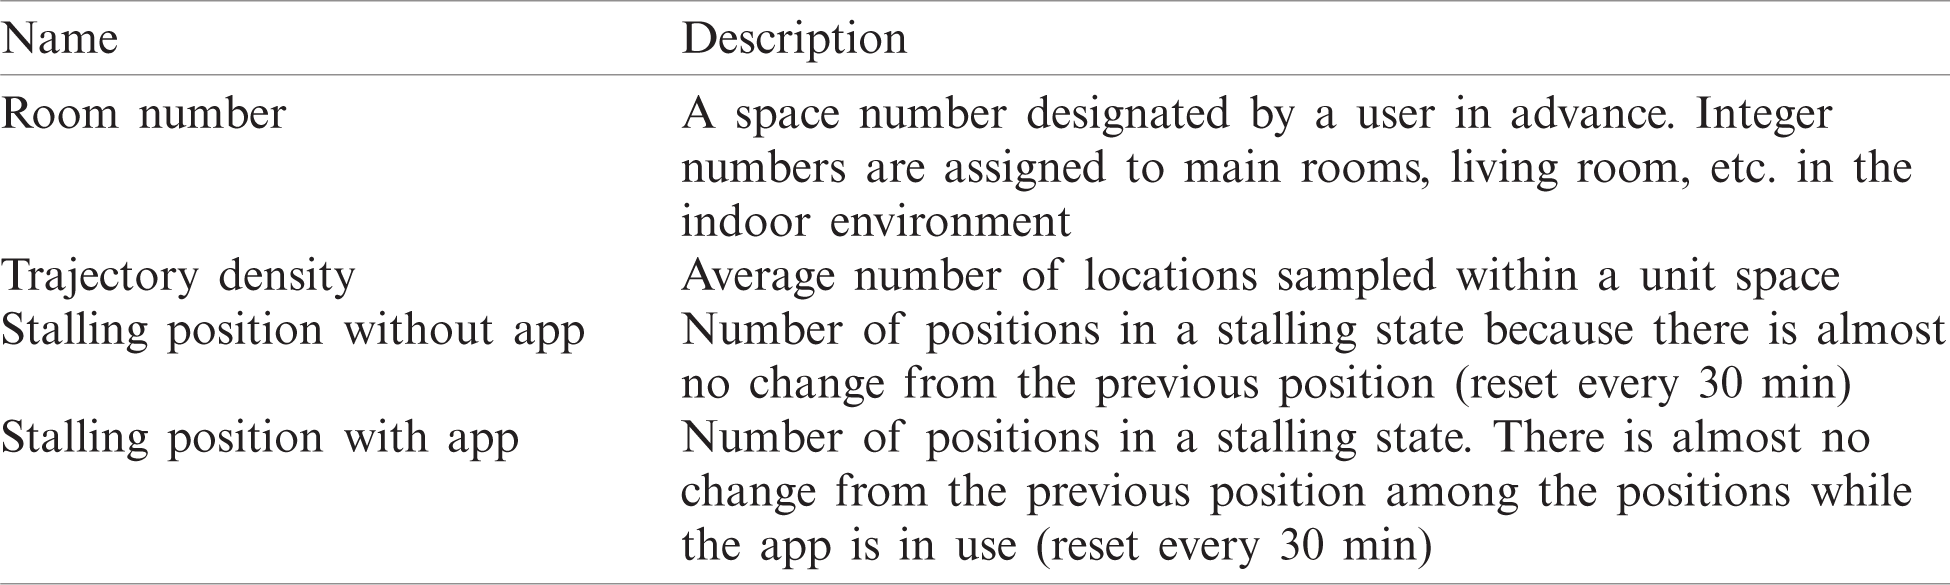
Before applying the spatio-temporal clustering algorithm to the collected data, additional meaningful data labeling was performed. In general, living spaces are divided into several independent spaces. Because this information is essential for spatial analysis, additional labeling information may be helpful. Therefore, we developed a separate square-painting-based labeling tool. Users can use this tool to input spatial information as integer values in a two-dimensional array. Moreover, we calculated additional secondary parameters from the accumulated motion information and stored them in a two-dimensional array. This facilitates the detection of unusual behavior as the properties of the movement line are input in the corresponding space of the movement line data. Tab. 2 lists the spatial information used.
Table 1: Trajectory and app information
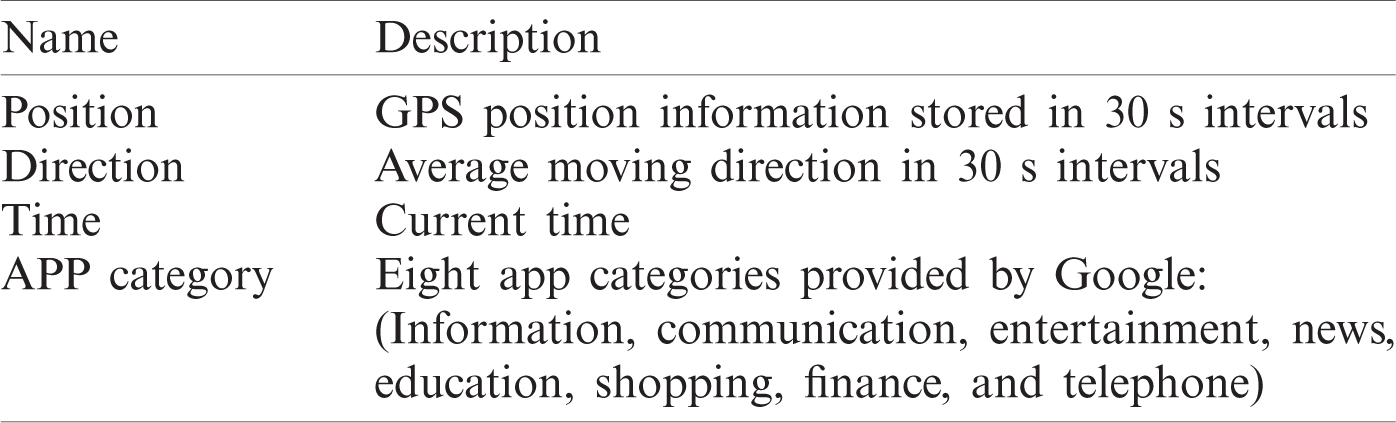
Table 2: Additional spatial information
The third step was the detection of outlier behavior. In this study, two techniques were applied for fusion. The t-SNE algorithm [32] has been verified for its stability in natural language processing; it is a frequently used algorithm for vector visualization. It expresses high-dimensional data as a two-dimensional map by learning a two-dimensional embedding vector that preserves the neighbor structure between data represented by high-dimensional vectors. As mentioned earlier, t-SNE exhibits more stable embedding learning results than other vector visualization algorithms. This is because it converts the distance between data into a stochastic probability, which is controlled by perplexity. t-SNE does not accurately distinguish between nearest neighbors that are considerably affected by the embedding process and points that are not. Instead, it serves to define the extent to which the influence is strengthened by adjusting the perplexity value. The t-SNE formula is as follows:
The parameter p in the first equation indicates the probability that the j-th neighbor
Although t-SNE is excellent at reducing high-dimensional data, it reflects the characteristics of app usage and not those of the trajectory data. Thus, to reflect the characteristics of the trajectory data, we applied a density-based clustering algorithm with the trajectory data only, the DBSCAN algorithm [34]. The algorithm clusters moving points within a moving line based on density; therefore, the moving speed is reflected in the clustering. This is based on the fact that the speed of movement of several characteristic behaviors within an indoor space differ. The final outlier behavior was set as the intersection between the t-SNE and DBSCAN-applied clusters. The trajectory lines in this set can be interpreted as an action section that shows outlier behavior during app usage and reveals a large difference in the movement speeds. Users can adjust the ratio of the two algorithms. If the observer actively uses the app, more weight can be placed on high-dimensional behavioral clustering through t-SNE. If the observer rarely uses the app, the weight of the DBSCAN clustering centered on the trajectory line can be increased. The final outlier behavior
Experiments on outlier behavior have been conducted using smartphones in indoor structures. We selected a studio structure as the experimental space. The three test participants recorded their daily activities for one week in a log. Based on this log, behavioral analyses were performed. This experiment investigated the differences in specific behaviors according to individual life patterns in a single room.
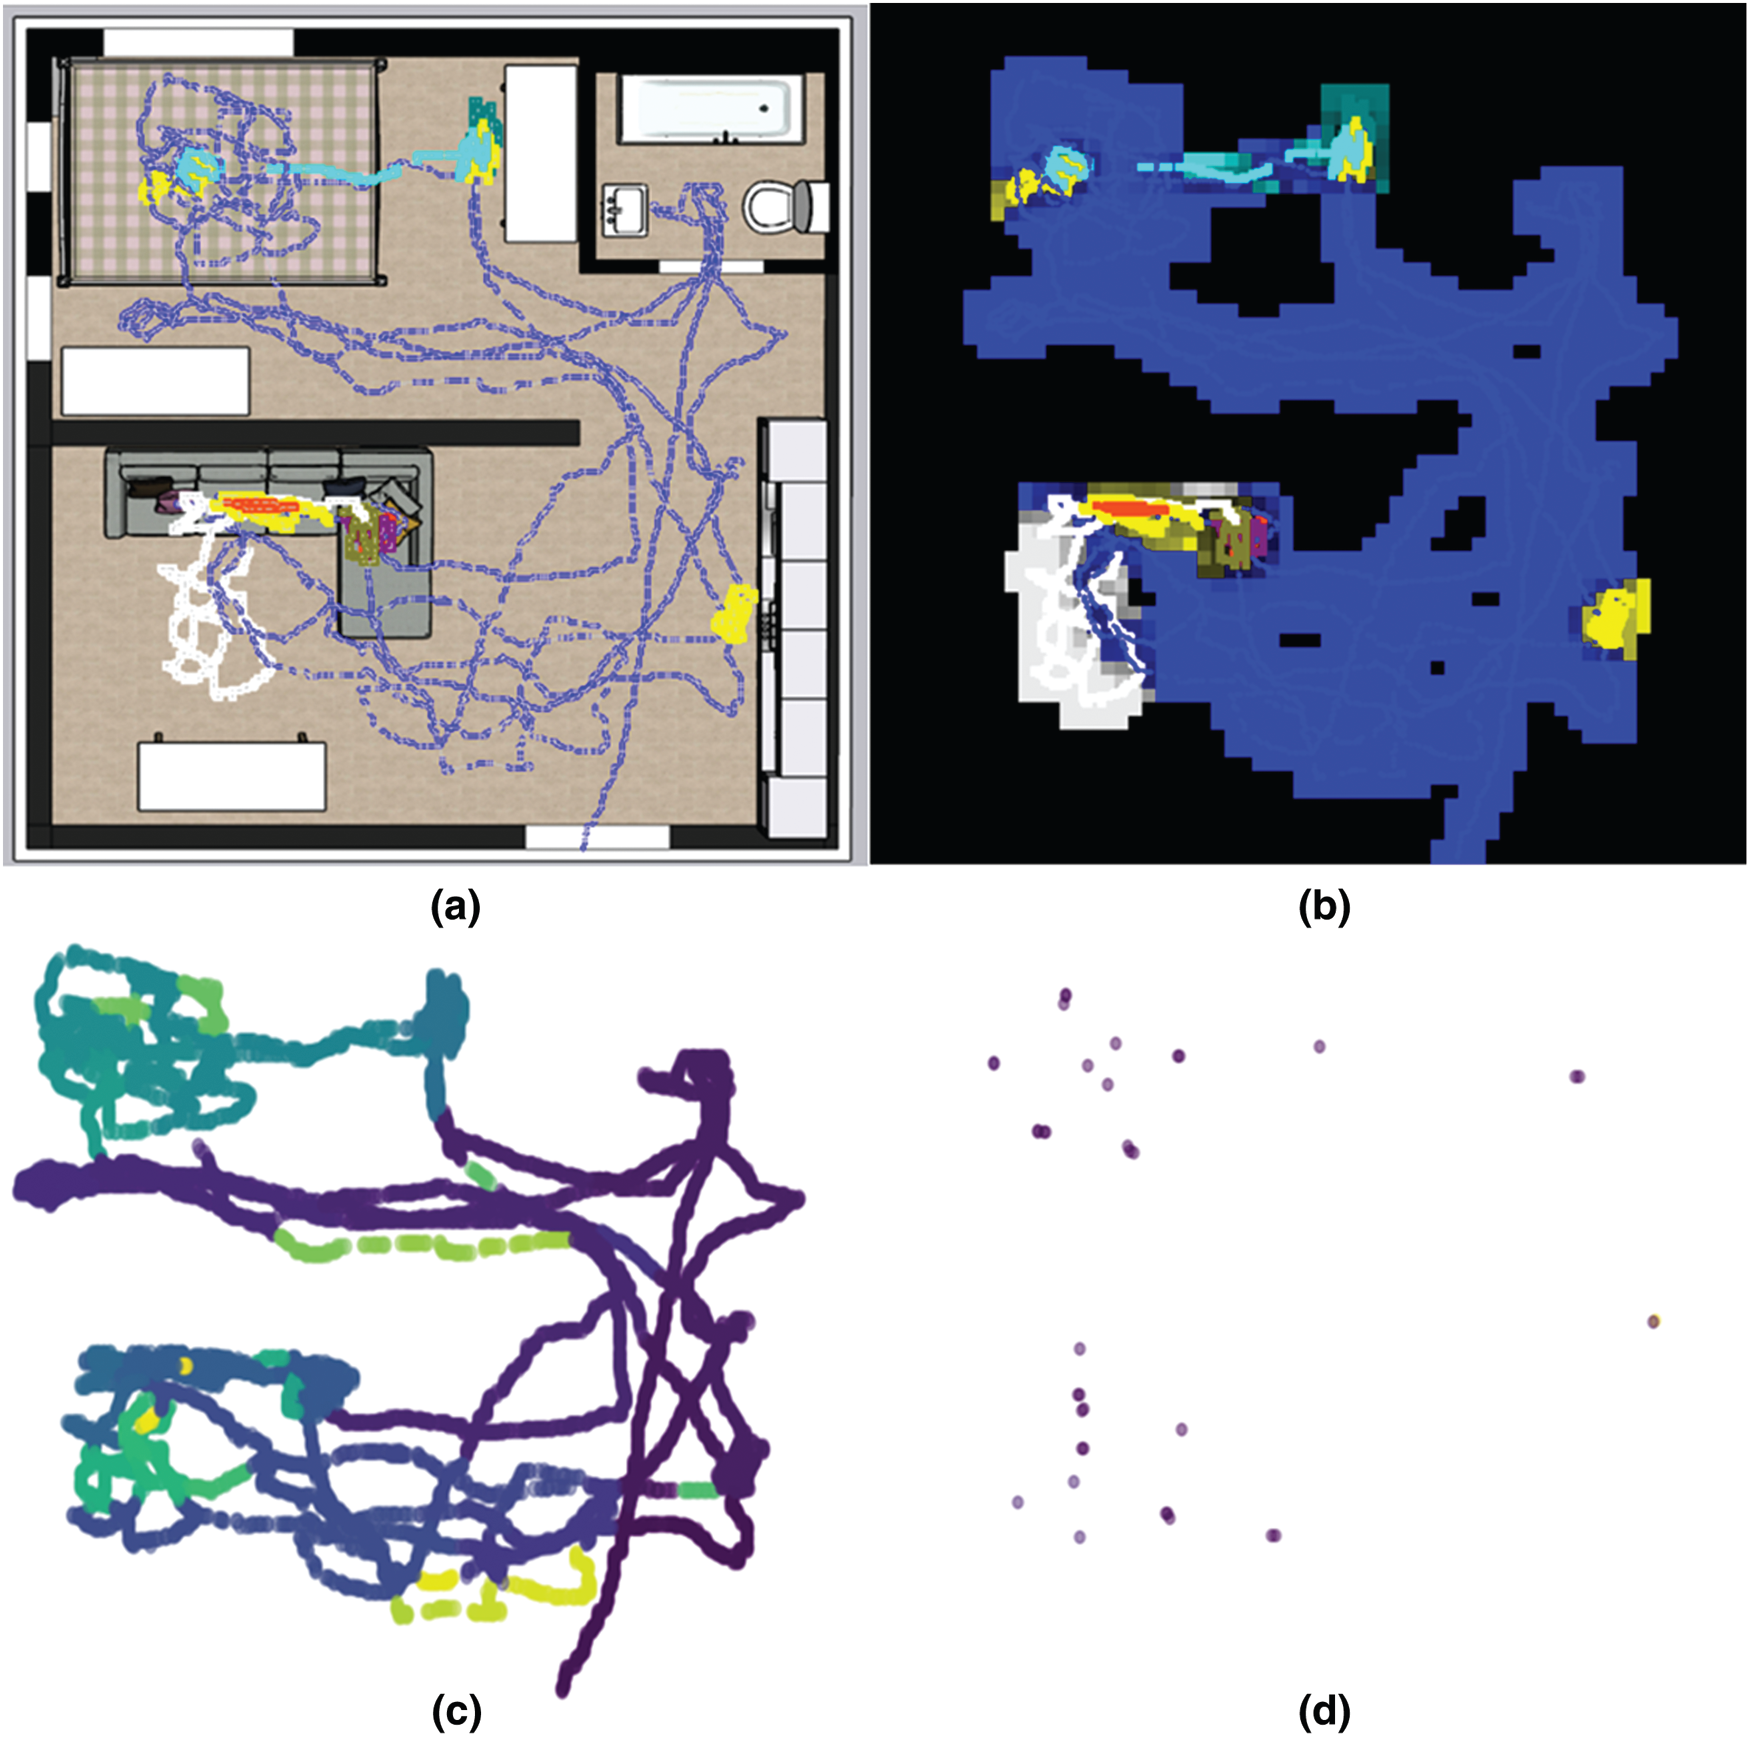
Figure 2: Experimental results of test participant #1 ((a) trajectory data with app usage, (b) discretized trajectory data, (c) clustering map, and (d) outlier behavior positions)
Fig. 2 shows the results of the unusual behavior detected by our system. This is a record of test participant #1’s movement after work. Fig. 2a shows the results of collecting the trajectory lines. Typically, a moving line that has moved without using a smartphone is displayed in blue. When a mobile phone is used, the app is classified into one of the nine categories and marked with a color corresponding to the category. Fig. 2b shows the influence of each app: the more the number of apps in a specific field used in a region, the greater is the influence on the region. Fig. 2c depicts the t-SNE clustering result, most of which is presumed to be a moving line. Furthermore, it can be seen that a partial cluster is formed in the two spaces where core app activities occur. Fig. 2d depicts the outlier action section detected by the system. In a single room, users frequently use smartphones while performing daily activities, which seem to be related to the properties of the furniture at that location. Outlier behaviors were confirmed to be detected when using an app different from the usual app in the area or when there was a difference in the movement speed.

Figure 3: Experimental results of test participant #2 ((a) trajectory data with app usage, (b) discretized trajectory data, (c) clustering map, and (d) outlier behavior positions)
Fig. 3 shows a screen of the log result analysis of test participant #2 after leaving the office. The overall movement shows that the movement radius in the residence is wider than that in test participant #1. Compared to test participant #1, the utilization rate of the bed in the upper left corner is low, whereas the utilization rate of the desk in front of the bed and that of the sofa in the lower left corner is high. The results of the clustering of trajectory lines show that clustering occurs around the desk and sofa area. The movement lines in the lower right area (bright green and yellow in Fig. 3c) show poor clustering, and many outlier behavior locations are detected in this area. Through interviews with the test participants, we found that this movement was caused by cleaning actions. In general, there is a difference in the speed, a change in direction speed, and app use, among others than it is for cleaning movements. As the frequency does not occur daily, our system detected this as an outlier behavior.
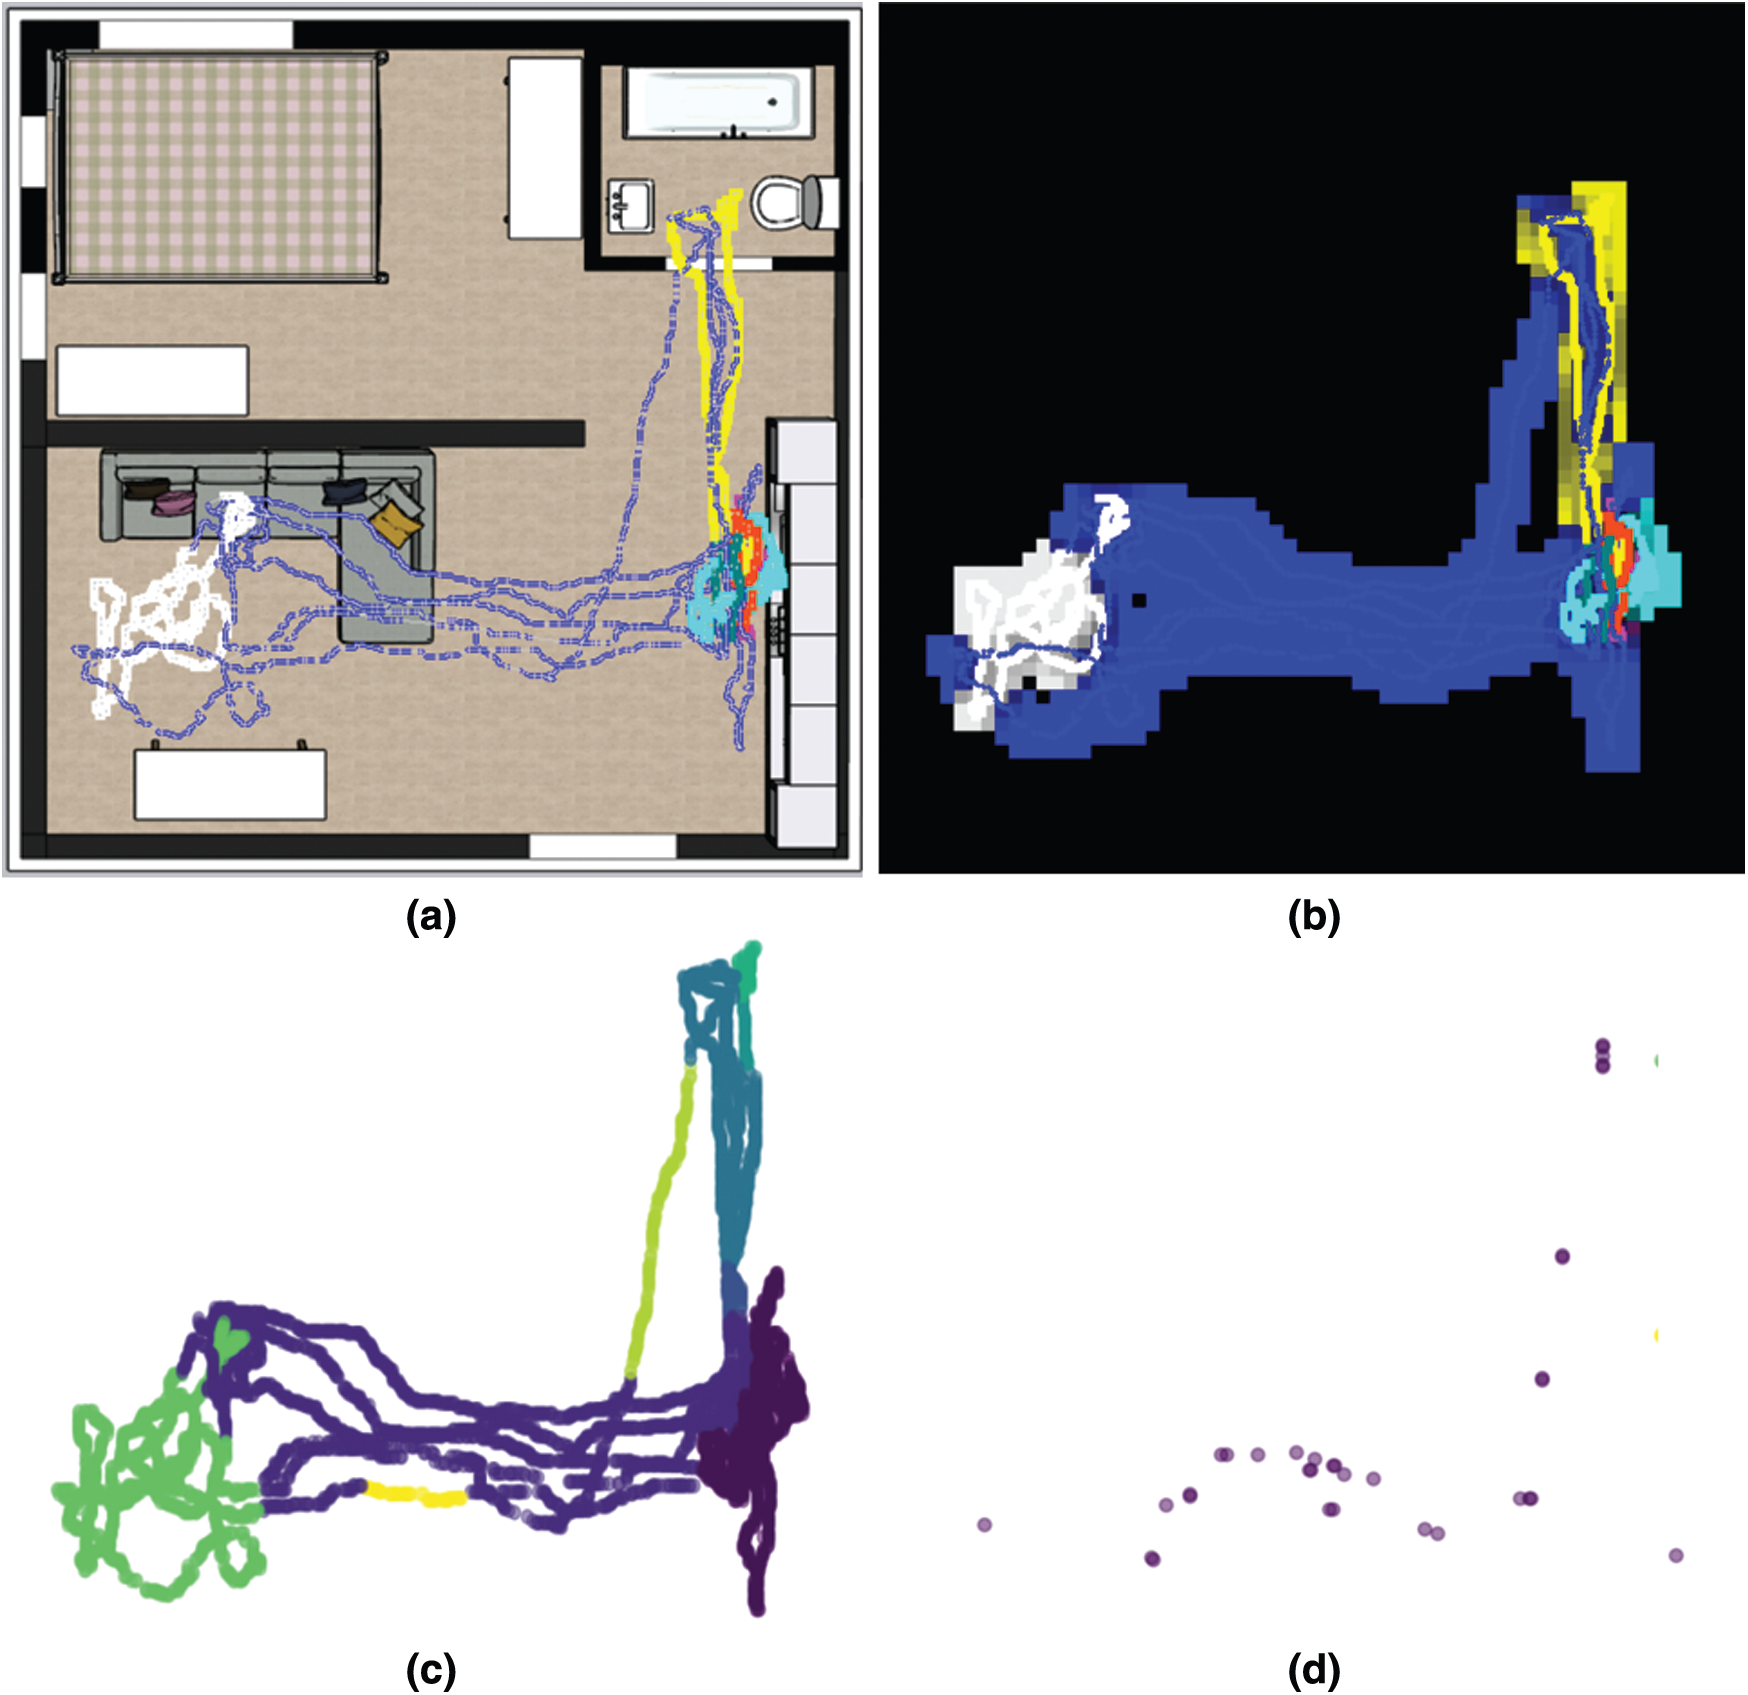
Figure 4: Experimental results of test participant #3 ((a) trajectory data with app usage, (b) discretized trajectory data, (c) clustering map, and (d) outlier behavior positions)
Fig. 4 shows a screen of the log result analysis of test participant #3 after leaving the office (9–10 PM). Compared to test participants #1 and #2, the movement is concentrated on the sofa in the lower left and the kitchen area in the lower right. The results of observations showed that the test participants primarily used the call function of smartphones on the sofa, whereas various apps were used in the kitchen area. Owing to this behavior, approximately four clusters were formed (lower left green, center moving line, right kitchen section, and upper left toilet). Through an interview with the test participant, we confirmed that the test participant made a phone call from the sofa and used various apps while standing in the kitchen and acting. The outlier behavior mainly occurred in the moving area. Our system distinguished outlier behavior from trajectory lines that show different movements than usual. This implies that our system can detect the case of not using any app and moving in a different path as an unusual behavior compared to the behaviors accompanied by the clustered app.
To evaluate the proposed method, we used the Silhouette, Calinski Harabasz, and Davies–Bouldin index scores [35]. Because our result has no labeled value, we confirmed the effectiveness of outliers with the density of each clustering. The results of our experiment showed that the t-SNE and DBSCAN Silhouette scores were 0.35 and 0.38, respectively. The t-SNE and DBSCAN maximum Calinski Harabasz scores were 1040.2, and 380.13, respectively, and the Davies–Bouldin Index scores were 0.89, and 0.93, respectively. The results show that even though clustering was performed with real-world in-wild data, they were effective and well formed.
This study proposed a technique for outlier behavior detection using trajectories and app data in indoor environments using DBSCAN and t-SNE algorithms. Our system offers the possibility of detecting various outlier behaviors in indoor environments using the log data of a simple smartphone. We can provide information that can improve the spatial structure by analyzing the user’s indoor behavior in a highly dense residence. Such an app use-based behavioral analysis technique may be more effective for one-person household residents with high app usage within the residential area when relationships with other residents are not considered. Our experimental results showed some significant clustering results, but there is still scope for further enhancement of the clustering quality. In our dataset, there were frequent overlapping points at the same position. In addition, because the trajectory clustering is concave, the clustering difficulty is very high compared to the convex-shaped data. This distorts the evaluation index of the general clustering algorithm. For follow-up studies in the future, we plan to use a spatial segmentation algorithm to reduce the number of convex-shaped data and conduct further segmentation of the behavioral classification for trajectories. Moreover, we aim to apply the results from these behavioral analyses to spatial optimization.
Funding Statement: The authors received no specific funding for this study.
Conflicts of Interest: The authors declare that they have no conflicts of interest to report regarding the present study.
1. R. Du, P. Santi, M. Xiao, A. V. Vasilakos and C. Fischione, “The sensable city: A survey on the deployment and management for smart city monitoring,” IEEE Communications Surveys and Tutorials, vol. 21, no. 2, pp. 1533–1560, 2018. [Google Scholar]
2. R. L. Peach, S. N. Yaliraki, D. Lefevre and M. Barahona, “Data-driven unsupervised clustering of online learner behavior,” NPJ Science of Learning, vol. 4, no. 1, pp. 14, 2019. [Google Scholar]
3. B. Guo, Z. Wang, P. Wang, T. Xin, D. Zhang et al., “Understanding customer behaviors in unmanned stores,” IT Professional, vol. 22, no. 3, pp. 55–63, 2020. [Google Scholar]
4. H. Du, Z. Yu, B. Guo, Q. Han and C. Chen, “GroupShop: Monitoring group shopping behavior in real world using mobile devices,” Journal of Ambient Intelligence and Humanized Computing, vol. 10, no. 12, pp. 1–15, 2020. [Google Scholar]
5. Y. B. Kim, S. J. Kang, S. H. Lee, J. Y. Jung, H. R. Kam et al., “Efficiently detecting outlying behavior in video-game players,” PeerJ, vol. 3, pp. e1502, 2015. [Google Scholar]
6. H. Liu, X. Li, J. Li and S. Zhang, “Efficient outlier detection for high-dimensional data,” IEEE Transactions on Systems, Man, and Cybernetics: Systems, vol. 48, no. 12, pp. 2451–2461, 2017. [Google Scholar]
7. S. Kang, D. Kim and Y. Kim, “A visual-physiology multimodal system for detecting outlier behavior of participants in a reality TV show,” International Journal of Distributed Sensor Networks, vol. 15, no. 7, pp. 1–13, 2019. [Google Scholar]
8. M. Munoz-Organero, “Outlier detection in wearable sensor data for human activity recognition (HAR) based on DRNNs,” IEEE Access, vol. 7, pp. 74422–74436, 2019. [Google Scholar]
9. K. Yun, Y. Kwon, S. Oh, J. Moon and J. Park, “Vision-based garbage dumping action detection for real-world surveillance platform,” ETRI Journal, vol. 41, no. 4, pp. 494–505, 2019. [Google Scholar]
10. H. Verkasalo, “Analysis of smartphone user behavior,” in Proc. ICMB-GMR, Athens, Greece, pp. 258–263, 2010. [Google Scholar]
11. J. M. Kang, S. S. Seo and J. W. K. Hong, “Usage pattern analysis of smartphones,” in Proc. APNOMS, Taipei, Taiwan, pp. 1–8, 2011. [Google Scholar]
12. M. Harman, Y. Jia and Y. Zhang, “App store mining and analysis: MSR for app stores,” in Proc. MSR, Zurich, Switzerland, pp. 108–111, 2012. [Google Scholar]
13. B. Chaix, Y. Kestens, C. Perchoux, N. Karusisi, J. Merlo et al., “An interactive mapping tool to assess individual mobility patterns in neighborhood studies,” American Journal of Preventive Medicine, vol. 43, no. 4, pp. 440–450, 2012. [Google Scholar]
14. D. Kelly, B. Smyth and B. Caulfield, “Uncovering measurements of social and demographic behavior from smartphone location data,” IEEE Transactions on Human-Machine Systems, vol. 43, no. 2, pp. 188–198, 2013. [Google Scholar]
15. F. Hamka, H. Bouwman, M. De Reuver and M. Kroesen, “Mobile customer segmentation based on smartphone measurement,” Telematics and Informatics, vol. 31, no. 2, pp. 220–227, 2014. [Google Scholar]
16. R. Mafrur, I. G. D. Nugraha and D. Choi, “Modeling and discovering human behavior from smartphone sensing life-log data for identification purpose,” Human-Centric Computing and Information Sciences, vol. 5, no. 1, pp. 31, 2015. [Google Scholar]
17. L. Jalali, H. Oh, R. Moazeni and R. Jain, “Human behavior analysis from smartphone data streams,” in Proc. HBU, Amsterdam, The Netherlands, pp. 68–85, 2016. [Google Scholar]
18. N. Yamamoto, K. Ochiai, A. Inagaki, Y. Fukazawa, M. Kimoto et al., “Physiological stress level estimation based on smartphone logs,” in Proc. ICMU, Auckland, New Zealand, pp. 1–6, 2018. [Google Scholar]
19. Y. Lee, I. Park, S. Cho and J. Choi, “Smartphone user segmentation based on app usage sequence with neural networks,” Telematics and Informatics, vol. 35, no. 2, pp. 329–339, 2018. [Google Scholar]
20. Y. Fukazawa, T. Ito, T. Okimura, Y. Yamashita, T. Maeda et al., “Predicting anxiety state using smartphone-based passive sensing,” Journal of Biomedical Informatics, vol. 93, no. 1, pp. 103151, 2019. [Google Scholar]
21. I. H. Sarker, A. Colman and J. Han, “Recencyminer: Mining recency-based personalized behavior from contextual smartphone data,” Journal of Big Data, vol. 6, no. 1, pp. 49, 2019. [Google Scholar]
22. Z. Yang and X. Su, “Customer behavior clustering using SVM,” Physics Procedia, vol. 33, no. 2–3, pp. 1489–1496, 2012. [Google Scholar]
23. R. Perdisci, D. Ariu and G. Giacinto, “Scalable fine-grained behavioral clustering of http-based malware,” Computer Networks, vol. 57, no. 2, pp. 487–500, 2013. [Google Scholar]
24. C. Bauckhage, R. Sifa, A. Drachen, C. Thurau and F. Hadiji, “Beyond heatmaps: Spatio-temporal clustering using behavior-based partitioning of game levels,” in Proc. CIG, Dortmund, Germany, pp. 1–8, 2014. [Google Scholar]
25. A. Drachen, C. Thurau, R. Sifa and C. Bauckhage, “A comparison of methods for player clustering via behavioral telemetry,” Proc. Arxiv, vol. 1407, pp. 3950, 2014. [Google Scholar]
26. M. De Leoni, W. M. P. van der Aalst and M. Dees, “A general process mining framework for correlating, predicting and clustering dynamic behavior based on event logs,” Information Systems, vol. 56, no. 1, pp. 235–257, 2016. [Google Scholar]
27. A. A. Farhan, J. Lu, J. Bi, A. Russell, B. Wang et al., “Multi-view bi-clustering to identify smartphone sensing features indicative of depression,” in Proc. CHASE, Washington, DC, USA, pp. 264–273, 2016. [Google Scholar]
28. G. Wang, X. Zhang, S. Tang, H. Zheng and B. Y. Zhao, “Unsupervised clickstream clustering for user behavior analysis,” in Proc. CHI, San Jose, California, USA, pp. 225–236, 2016. [Google Scholar]
29. M. Ahmed, Y. H. Kim and P. K. Rhee, “EER-ASSL: Combining rollback learning and deep learning for rapid adaptive object detection,” KSII Transactions on Internet and Information Systems, vol. 14, no. 12, pp. 4776–4794, 2020. [Google Scholar]
30. P. N. Huu and Q. T. Minh, “An ANN-based gesture recognition algorithm for smart-home applications,” KSII Transactions on Internet and Information Systems, vol. 14, no. 5, pp. 1967–1983, 2020. [Google Scholar]
31. S. J. Kang, Y. B. Kim and S. K. Kim, “Automated spatiotemporal classification based on smartphone app logs,” Electronics, vol. 9, no. 5, pp. 755, 2020. [Google Scholar]
32. L. V. D. Maaten and G. Hinton, “Visualizing data using t-SNE,” Journal of Machine Learning Research: JMLR, vol. 9, pp. 2579–2605, 2008. [Google Scholar]
33. S. Kullback and R. A. Leibler, “On information and sufficiency,” Annals of Mathematical Statistics, vol. 22, no. 1, pp. 79–86, 1951. [Google Scholar]
34. T. Caliński and J. Harabasz, “A dendrite method for cluster analysis,” Communications in Statistics—Theory and Methods, vol. 3, no. 1, pp. 1–27, 1974. [Google Scholar]
35. L. Rokach, “A survey of clustering algorithms,” in Data Mining and Knowledge Discovery Handbook, Boston, MA: Springer, pp. 269–298, 2009. [Google Scholar]
 | This work is licensed under a Creative Commons Attribution 4.0 International License, which permits unrestricted use, distribution, and reproduction in any medium, provided the original work is properly cited. |