DOI:10.32604/cmc.2021.016766
| Computers, Materials & Continua DOI:10.32604/cmc.2021.016766 | |
| Article |
CARM: Context Based Association Rule Mining for Conventional Data
1Faculty of Engineering & Information Technology, Foundation University, Islamabad, Pakistan
2Department of Computer Science, Barani Institute of Information Technology, Rawalpindi, Pakistan
*Corresponding Author: Muhammad Shaheen. Email: dr.shaheen@fui.edu.pk
Received: 11 January 2021; Accepted: 14 March 2021
Abstract: This paper is aimed to develop an algorithm for extracting association rules, called Context-Based Association Rule Mining algorithm (CARM), which can be regarded as an extension of the Context-Based Positive and Negative Association Rule Mining algorithm (CBPNARM). CBPNARM was developed to extract positive and negative association rules from Spatio-temporal (space-time) data only, while the proposed algorithm can be applied to both spatial and non-spatial data. The proposed algorithm is applied to the energy dataset to classify a country’s energy development by uncovering the enthralling interdependencies between the set of variables to get positive and negative associations. Many association rules related to sustainable energy development are extracted by the proposed algorithm that needs to be pruned by some pruning technique. The context, in this paper serves as a pruning measure to extract pertinent association rules from non-spatial data. Conditional Probability Increment Ratio (CPIR) is also added in the proposed algorithm that was not used in CBPNARM. The inclusion of the context variable and CPIR resulted in fewer rules and improved robustness and ease of use. Also, the extraction of a common negative frequent itemset in CARM is different from that of CBPNARM. The rules created by the proposed algorithm are more meaningful, significant, relevant and insightful. The accuracy of the proposed algorithm is compared with the Apriori, PNARM and CBPNARM algorithms. The results demonstrated enhanced accuracy, relevance and timeliness.
Keywords: Association rules; context; CBPNARM; non-spatial data; CPIR; support; confidence; interestingness
It is an information age as all is transferred to computers and the use of the information system has become a necessity of life. Knowledge extraction from data takes place through the data mining process. Data mining is a step-by-step process that begins with data analysis, classification/prediction and finding trends and patterns [1,2]. A variety of data mining techniques are used for classifying, extracting association rules, clustering, and regression analysis. The accumulation of data in databases using different devices produces a pool of data that serves as a foundation for knowledge generation. The Size of the data and the reliability of knowledge extraction are directly proportional to one another. With the advent of internet technologies and community applications, millions and trillions of users are generating data every minute and the growth of the repositories storing this data is exponential. As a result, human dependence on data has also increased. Numerous challenges in text mining, web analytics and knowledge discovery have emerged [3]. The discovery of knowledge from databases is a non-trivial process in identifying logical, understandable and innovative patterns from the data [4]. Knowledge extracted through data mining can take different forms, such as rules, clusters, decision trees, classes, rough sets and many others [5–7].
Data mining prepares the data for processing by recovering the erroneous and blank data fields that are then stored in the warehouse and finally applying algorithms to it [1]. Data mining leads to classes, clusters, rules and predictions [8]. It can be applied to different datasets, including educational data [9,10], spatial data [7], satellite data [2,11], scientific experiments [12], biological data [13]. Association rule mining is used to discover the fascinating interdependencies between the set of variables and reveals a hidden pattern in the set of data and variables concomitant with high frequencies. A comprehensive review of the association rule extraction algorithms is provided by AI et al. [14]. Wu et al. [5] emphasized the importance of negative association rules which were not taken into consideration in the mining of association rules before that. A typical association rule of shape (
Shaheen et al. [7] introduced a variable called context that can essentially be used to mine valid positive and negative association rules. The context variable can produce valid but false rules that qualify the support value criteria and are included in the final rule set. For example, the higher selling rate of sanitisers in summer produce a rule (
The CBPNARM algorithm was developed for the extraction of Spatio-temporal association rules, which was applied only to spatial data. Spatial data differs from conventional data in that it relates directly or indirectly to a location on earth. Spatial data attributes combine to represent an image that is drawn on the geographic information system (GIS) or other similar information systems [20]. Attributes that are not spatial are represented by non-spatial attributes and are known as characteristic data. A context-based algorithm for non-spatial data is also required which can be applied to non-spatial GIS data and any other dataset established through conventional data procedures. Apriori algorithm is the one most commonly used for exploring positive association rule mining on these datasets.
Apriori algorithm proposed by Agarwal et al. [21] is used to derive the relationship between frequent items of transactional databases. An Apriori association rule is written as (
The proposed algorithm is implemented for sustainable energy development indicators. Sustainability in the energy sector is the primary need of almost every country in the world. The commission on sustainable development has provided a list of indicators [23] that were refined by the International Atomic Energy Agency (IAEA) for its use in evaluating sustainable energy development [24]. These sustainability indicators are used in many studies to assess energy development [8], energy security [25], environmental impacts [26], energy poverty [27], energy consumption and relationships with one another [28]. A classification mechanism for a country’s energy development is developed by Shaheen et al. [8] using only quantifiable indicators. The algorithm proposed in this study is also implemented for the same dataset. The algorithm applied to the sustainable energy indicators returned association rules which defined the covarying sustainability metrics. Depending on the value and extent of the covariance between these indicators, a decision-maker can develop an optimum plan to ensure the sustainability of the energy sector.
This paper is intended to develop an algorithm for exploring positive and negative context-based association rules for conventional/characteristic data as an extension to the CBPNARM algorithm. The accuracy of the proposed methodology is compared with Apriori, CBPNARM at the methodological level and is also compared to sustainable energy development, categorized at the application level. The contribution made in this study is given below:
1. CBPNARM algorithm was designed for spatial data only. CARM is the algorithm proposed in this paper which can be applied to non-spatial or conventional numeric and ordinal data.
2. The algorithm is applied to energy datasets to mining rules for energy sustainability.
3. CPIR is not used in the CBPNARM algorithm as the complexity of CBPNARM became greater after CPIR when the results were not remarkable. CPIR is added to the proposed algorithm.
4. The extraction of negative frequent items in the CARM differs from that of CBPNARM.
5. Four CARM algorithm cases given in the pseudo-code differ from CBPNARM.
2 Indicators for Sustainable Energy Development
The importance of energy is vigorous in eliminating scarcity and elevating the standard of human life [29]. The world has acknowledged that sustainable energy development is important. In 2005, the Commission for Sustainable Development (CSD) recognized the role of the energy sector in the sustainable development of a country [23]. A list of 30 energy sustainability indicators was finalized. These indicators are classified into three categories that are essential ingredients for sustainability; (1) social domain (2) economic domain and (3) ecological domain. The social domain of sustainability indicators is divided into equity and health as shown in Tab. 1. Equity is about equitable access and the availability of all the energy resources at an affordable price. Health covers safe access to energy by caring for accidents in the fuel cycle and eradicating problems related to air pollutants, etc. The social domain indicators selected for this study are placed in the first section of Tab. 1.
Table 1: Indicators for sustainable energy development [23]
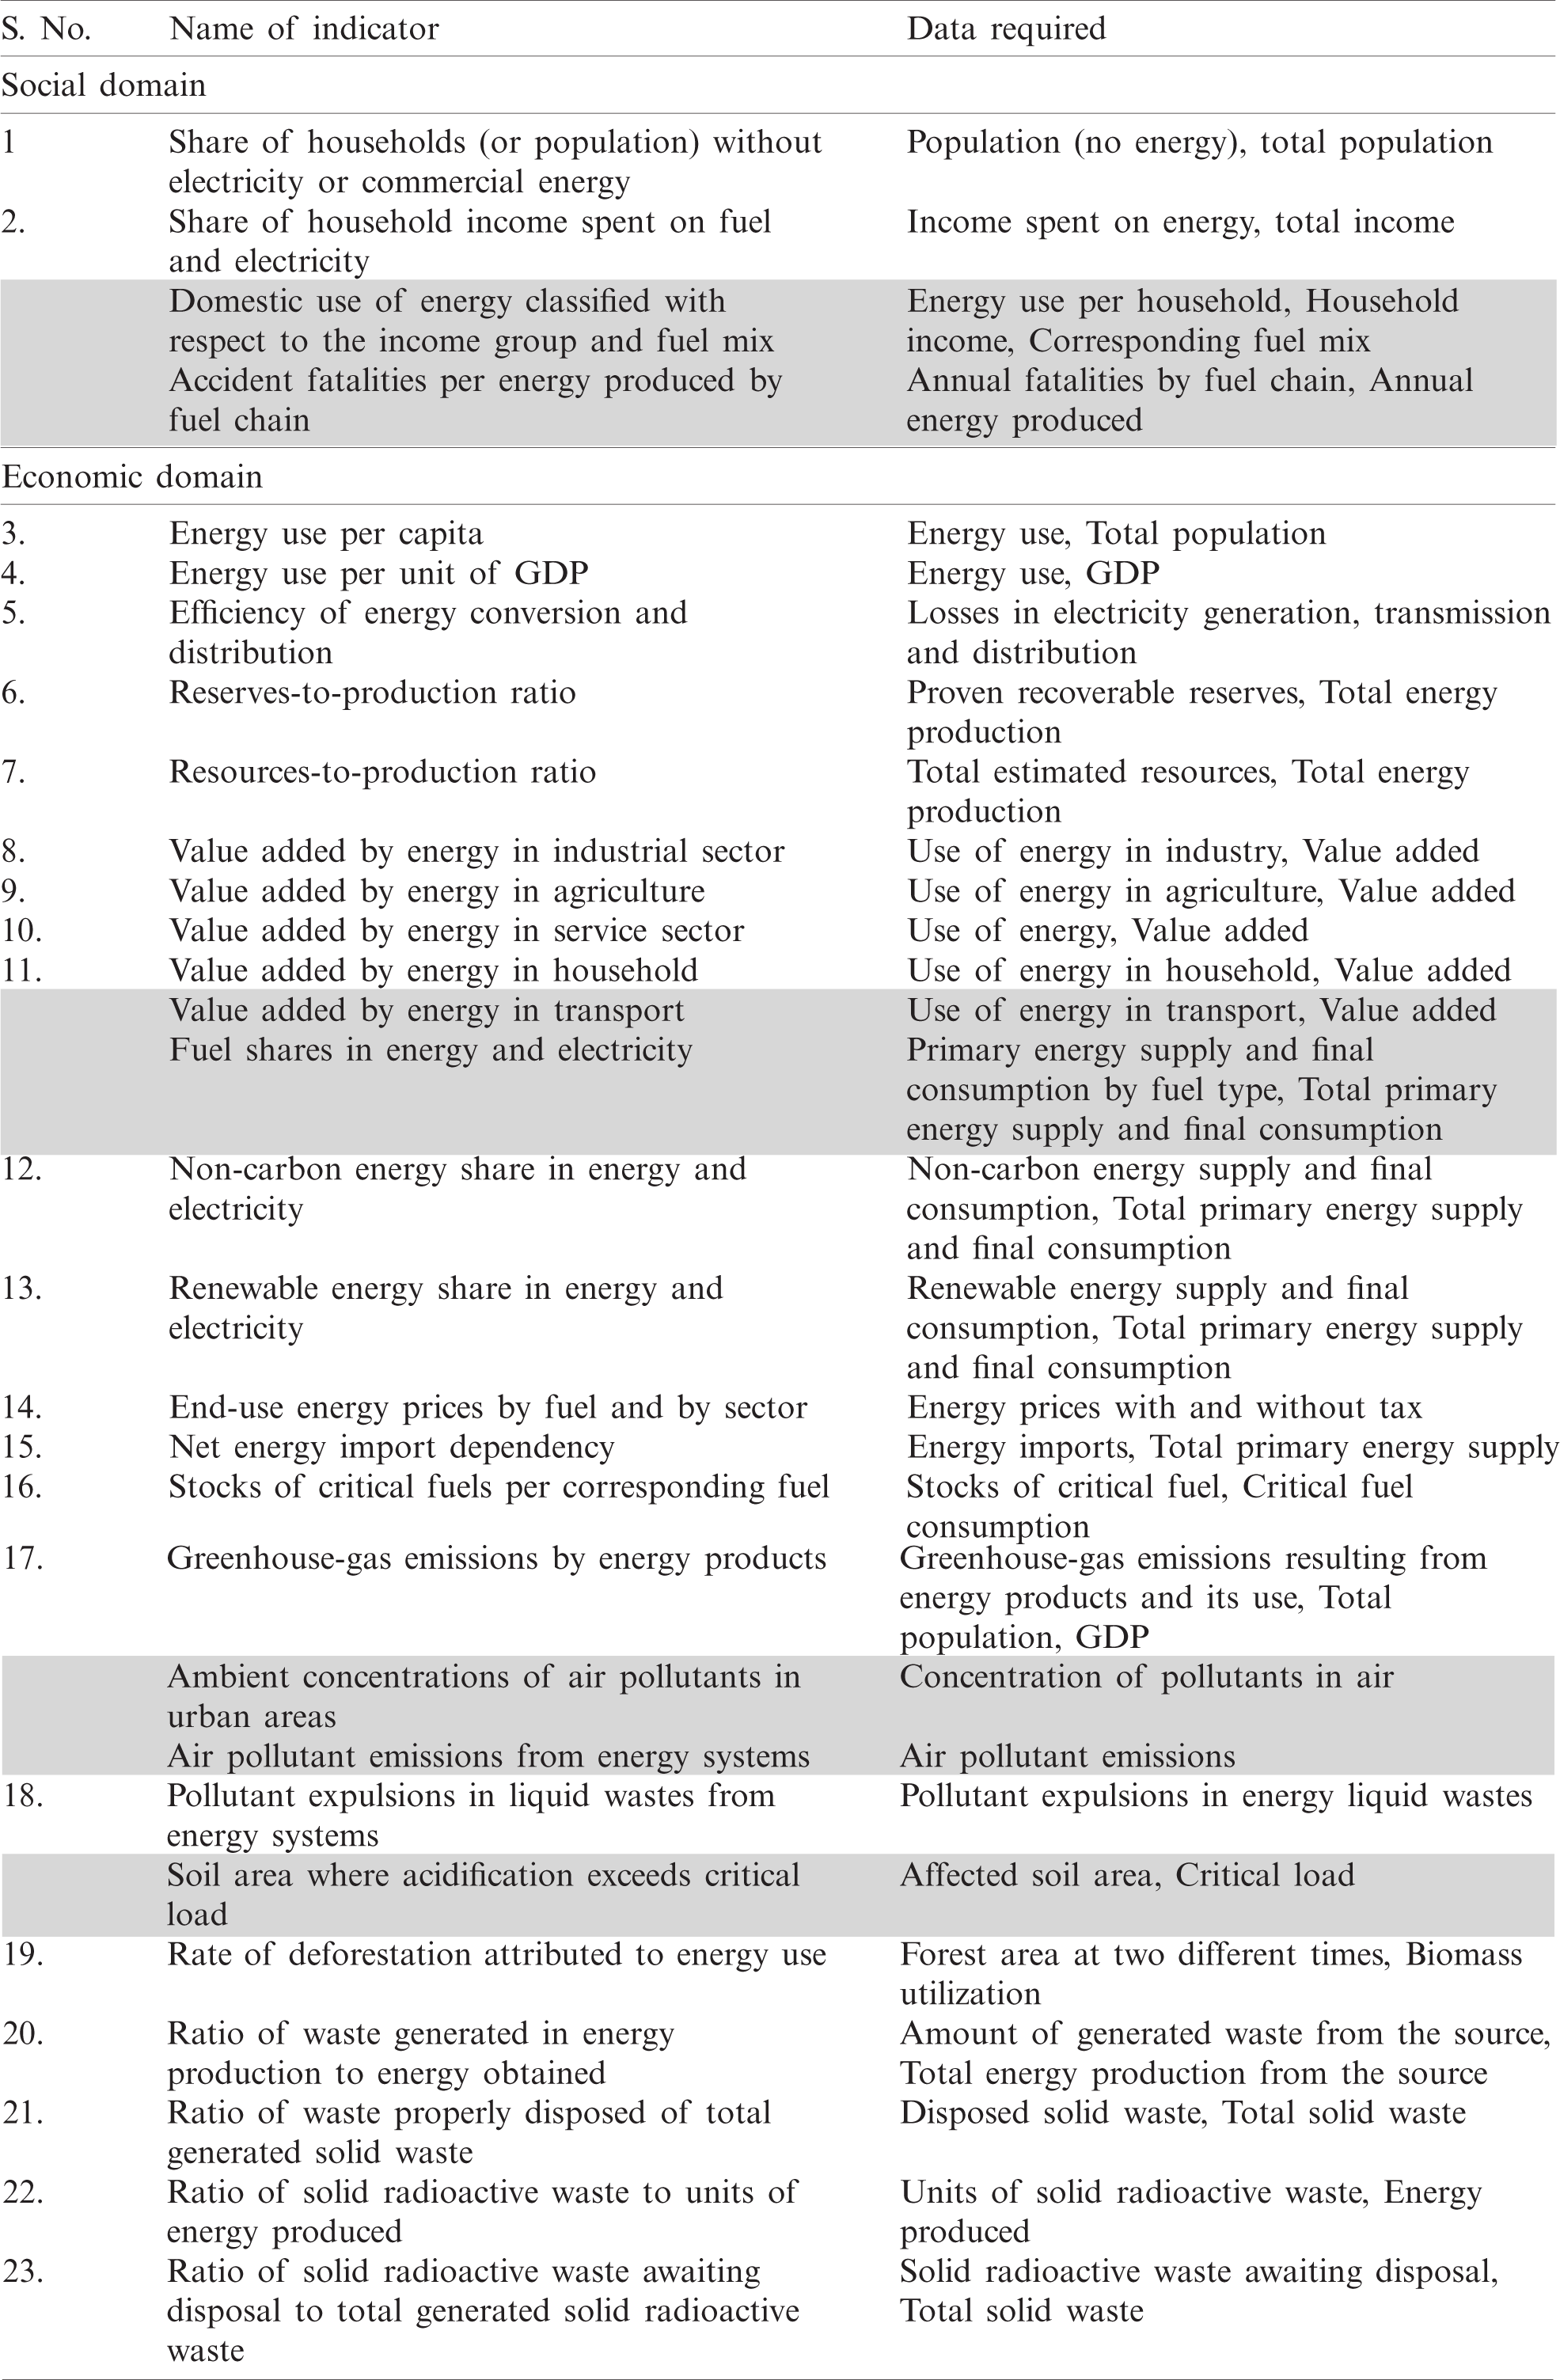
The economic domain of sustainability indicators can be divided into consumption, production patterns and security of supply. The indicators related to the consumption and production of energy include energy use per GDP per capita, energy supply efficiency, energy production, etc. The ecological domain covers the impacts of energy-related indicators of atmosphere, water and land [30]. IAEA [23] did not consider the institutional dimension of sustainability because the data associated with this aspect was unquantifiable. The report also suggested some auxiliary statistics that measure demographics, wealth, economic development, transportation, urbanization, etc. These measures include GDP per capita, population, shares of sectors in GDP, distance travelled per capita, freight transport, income inequality, floor area per capita and manufacturing value. The commission also recommended the analysis of time-series data, the preparation of data for analysis and the interpretation of the discourse of the data collected for that purpose. This study specifically followed the recommendations of the report and proposed an algorithm for such an assessment. CBPNARM being specifically for spatiotemporal data mining does not adapt exactly, the need for the problem.
The basis for the selection of energy sustainability indicators for this study is identical to that proposed by Shaheen et al. [8], where quantifiable and available indicators were selected. In this study, only indicators for which data are available on online energy portals are selected. The list of selected sustainability indicators is given in Tab. 1. The data for the marked attributes in the grey-shaded boxes in Tab. 1 was not available where such attributes were excluded from the database. Data for 16 of the other 23 attributes was readily available, while the remaining data was derived from the available datasets.
Support is a measure of finding the frequency of an itemset in the database [31,32]. The support of an association rule
Confidence is an indication of how often a rule is true [32,33]. The confidence of an association rule
Lift is used to measure the correlation value of the antecedent and consequent of an association rule [31,32]. Lift of an association rule
Interestingness is a measure used to find potentially positive and potentially negative item sets from a dataset. A rule
The conditional-probability increment ratio (CPIR) of a rule is computed based on the dependence of the antecedent and consequent. In an association rule
Context is the state of the entity, environment or action that can affect the results of association rule mining. The value of the context variable must be within the normal range to make a matching rule valid. For example, the change in vegetation color in the surrounding area may indicate an emergency below the earth’s surface. If the value of the “waterflood” context variable is not normal and is not in normal ranges, then the change in vegetation color may indicate the presence of a volcano. The color, in this example, was changed due to the waterflood so that the waterflood, which in this case is a context variable, whose value for this rule was over the normal range [7]. The value change of the context variable can have four cases that are addressed in [7].
The method proposed for extracting positive and negative association rules in conventional data sets is named CARM and is dependent on support, confidence, interestingness, CPIR and the value of the context variable. This method fetches the rules from the non-spatial datasets. CBPNARM [7] is developed as an extension of [5,34] and is used in some successful studies [12,35]. The proposed algorithm is an extended CBPNARM. A positive association rule  Y OR X → Y OR X → is valid if
Table 2: Variants of context variables with remedial statistical adjustments (
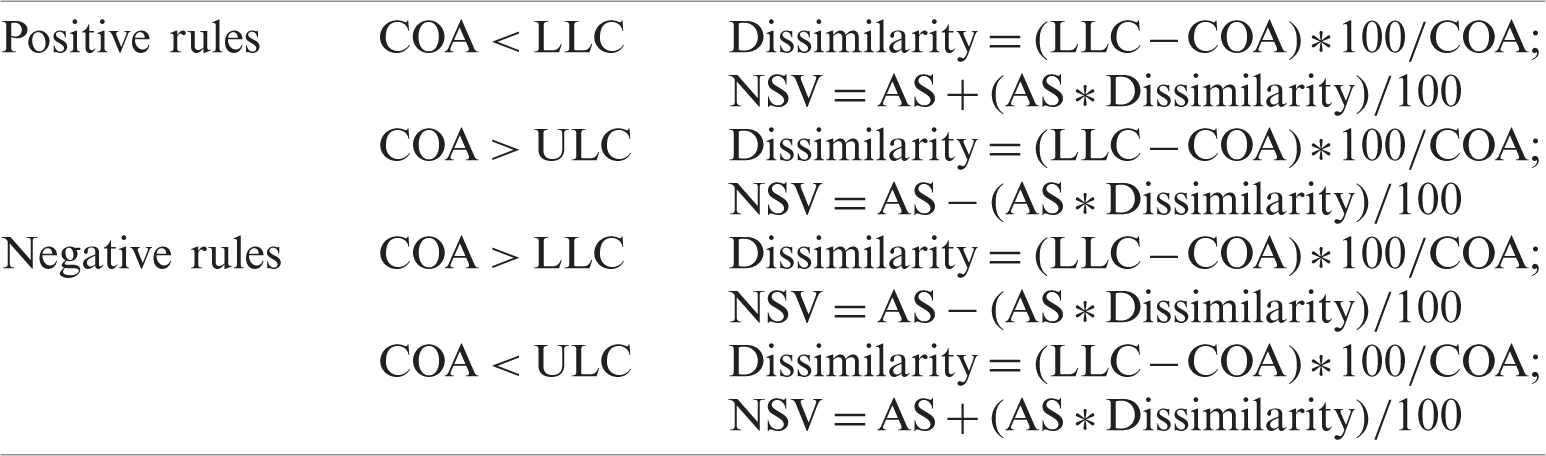
The aforementioned mathematical procedures generate a large number of positive and negative association rules. The measure of Interestingness measure proposed by [5] is used to apply first level pruning. The interestingness of the rules can be calculated using Eq. (4). After applying the first level pruning through an interestingness measure, the second-level pruning is applied to further reduce the number of rules. The second level pruning measure is the CPIR, which is defined in Eq. (5). All rules that are positively and negatively dependent are eligible to be included in the final rule set. In this level of pruning, only the rules in which antecedent and consequent are independent of one another are omitted. The values of the context variable are then taken into account to evaluate the validity of the rules included in the final rule set. Four possible cases for the context variable as given in Tab. 2 are then applied. Rules that are wrongly added to the final list due to the out-of-range value of the context variable are omitted. Rules that are erroneously omitted on these grounds will be added to the final list.
The proposed algorithm for context-based association rule mining is given in the section below:
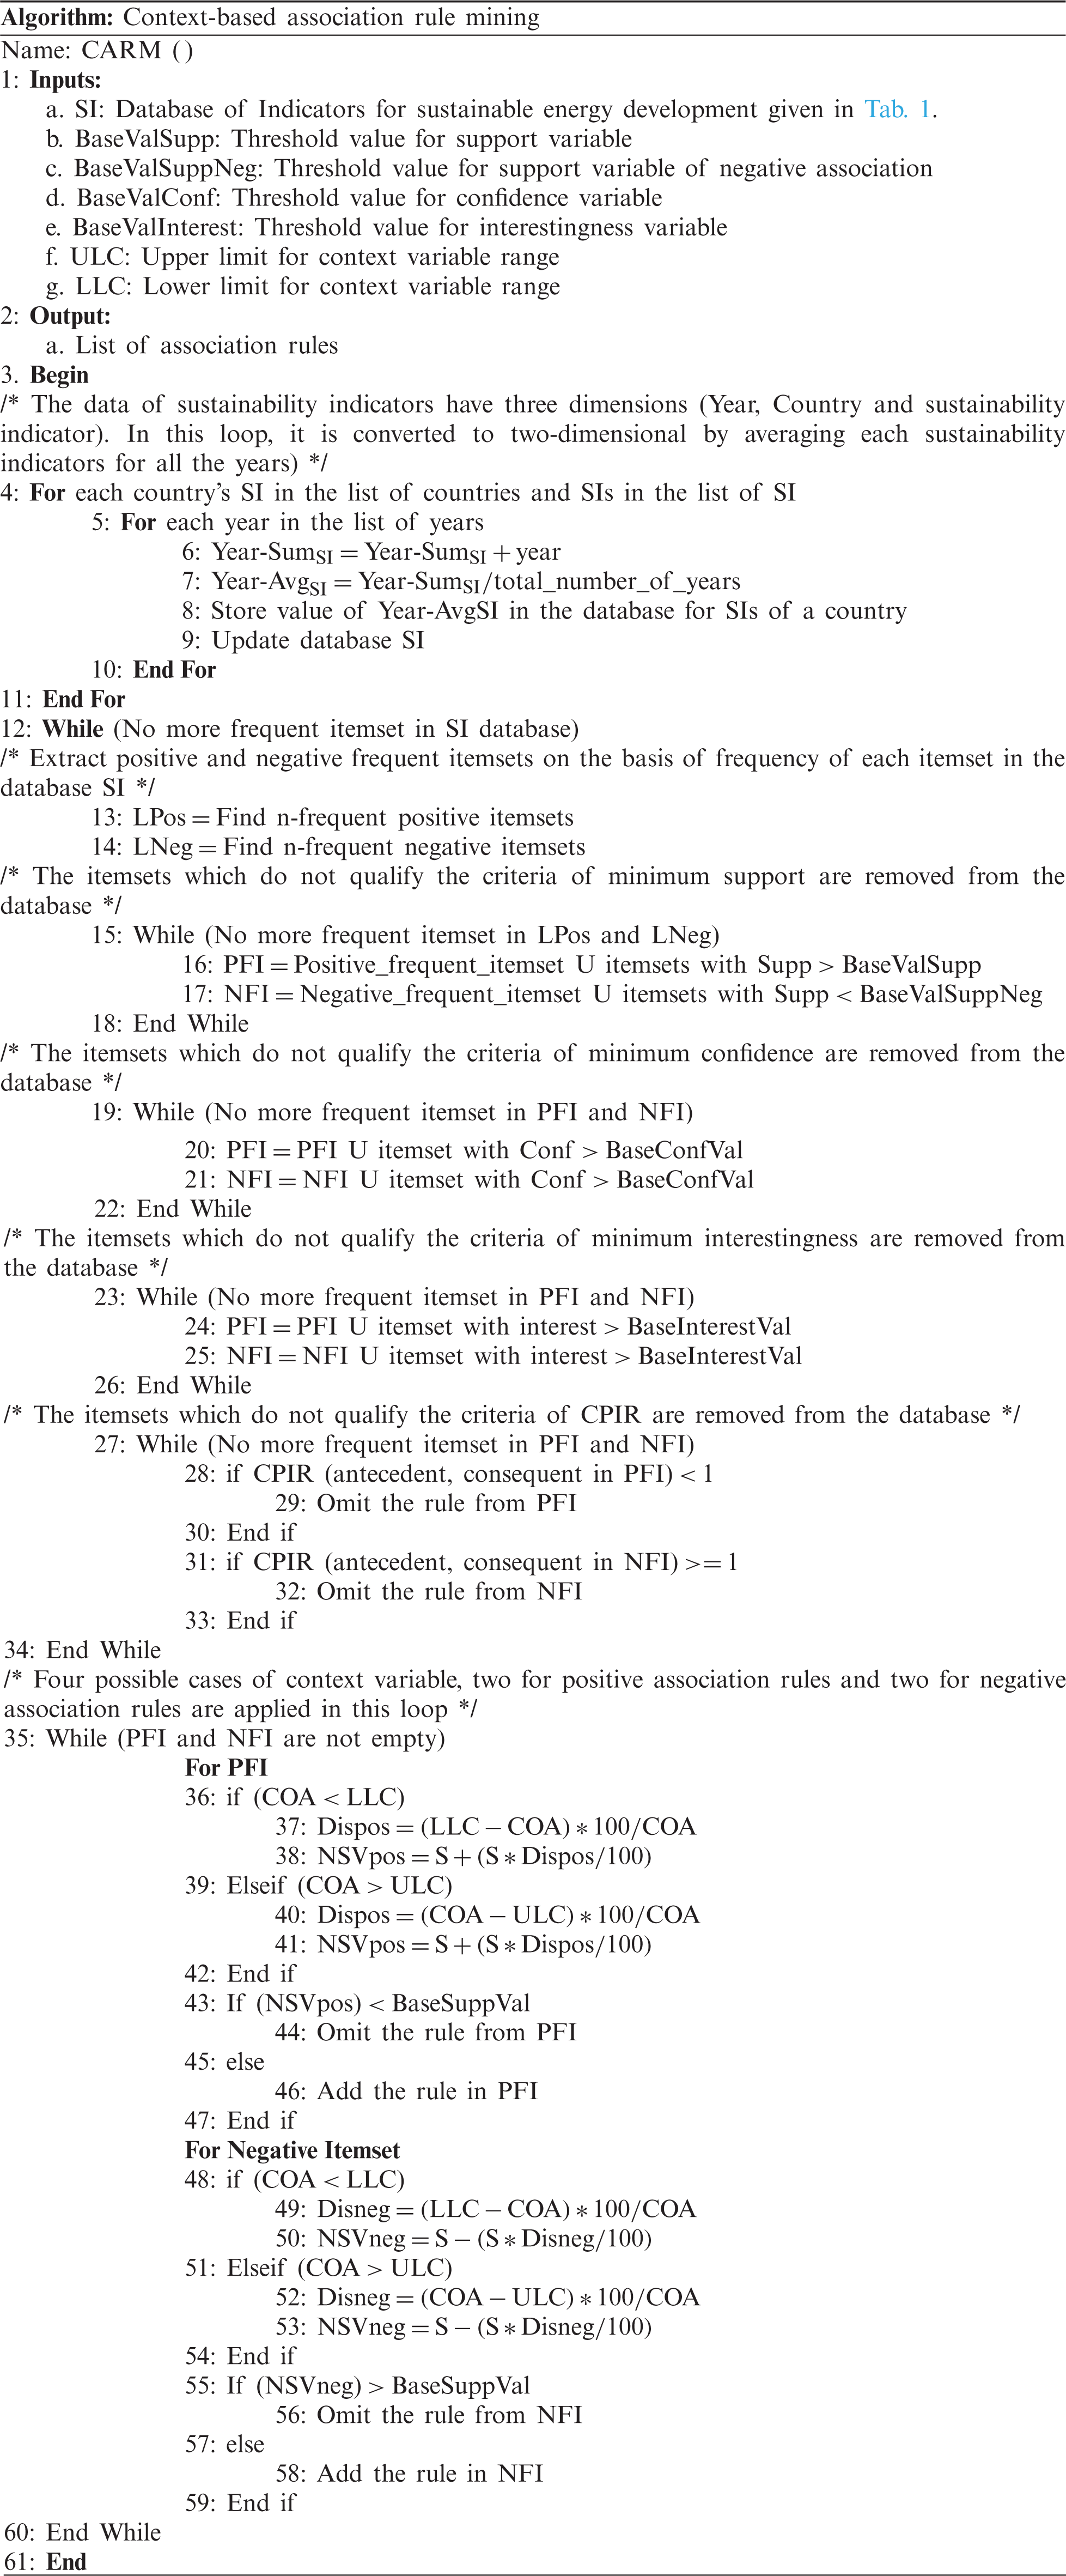
The time complexity of the proposed algorithm is O(N2) if one looks at the years and the number of countries. However, if the number of countries is set at its maximum, the time complexity is O(N), where N represents the number of years. The working of the proposed method is given in Fig. 1 below. In Fig. 1, the values of energy indicators are stored in a database that is then discretized to convert the data from conventional numeric format to ordinal format. A frequent itemset is obtained from the dataset based on support, confidence, interestingness and CPIR thresholds. The positive and negative association rules are then mined and evaluated using the values of context variables. The context variable in each dataset is selected by the user/ domain expert. Possibilities/cases in the context are also given in Fig. 1, the details of which appear in the algorithm above.
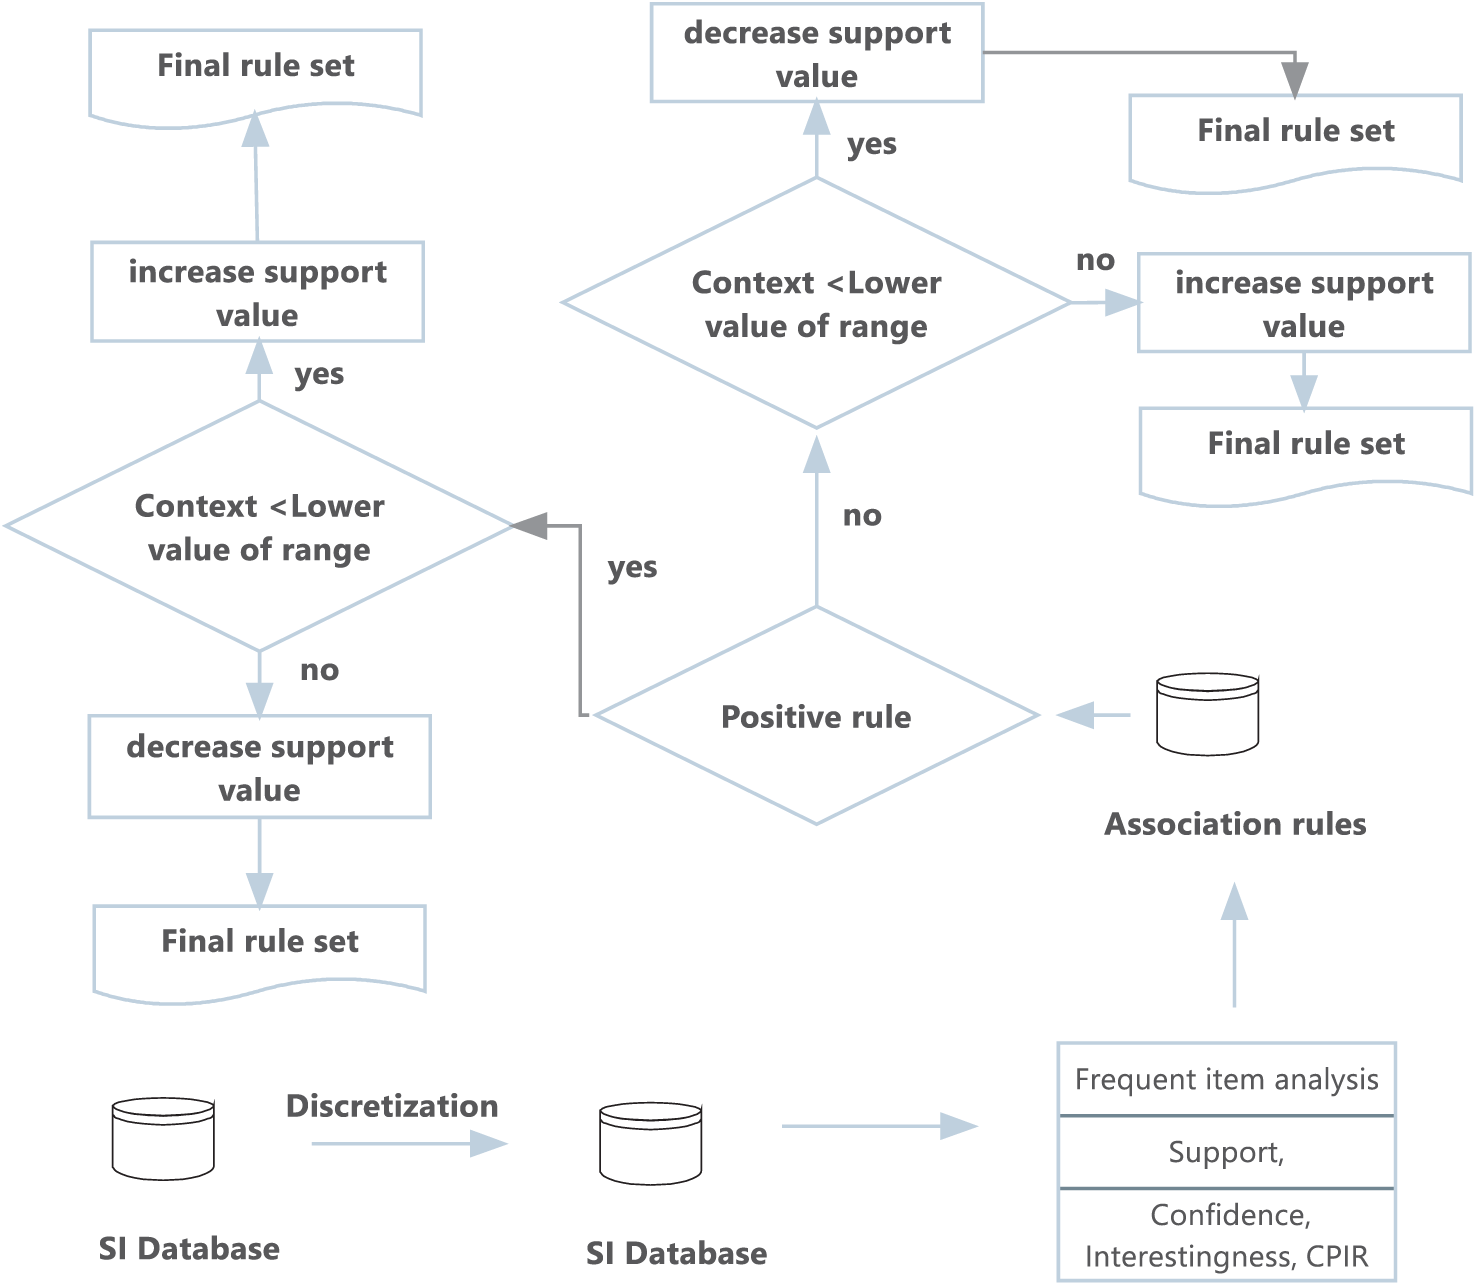
Figure 1: Proposed algorithm and its application in energy database
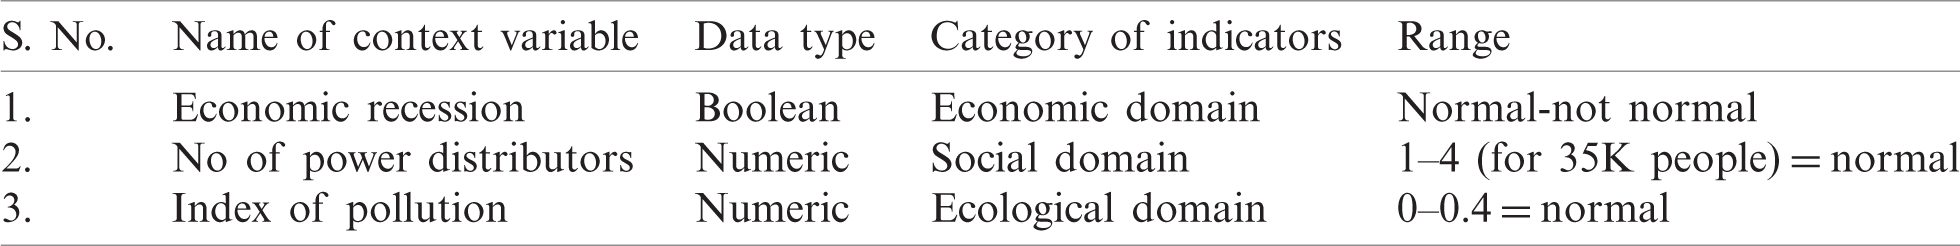
The algorithm proposed in the present document is encoded in python Jupyter notebook which is an open-source programming language. The experiment is performed on a machine with an i7-2.11 GHz Processor, 16 GB RAM and 500 GB hard disk installed with all necessary network conditions required for the Windows 10 operating system. Data for 23 sustainable energy development indicators are collected from 28 countries over 25 years from 1990 to 2015. All data is collected from the online energy data portals. Energy sustainability indicators contain quantifiable and unquantifiable attributes from which quantifiable attributes are used in this study. Data for the 30 attributes were not available in the online sources, and 23 of the 30 attributes are included in the final database. There were some attributes for which data were not available through online sources but they could be derived from the available attributes. The context variables taken into consideration for the study of sustainable energy development are presented in Tab. 3.
Table 3: Context variables and their normal value ranges
The data from the first phase of the experiment are averaged and discretized to produce significant associations. As there were three dimensions of the data, the value of sustainability indicator, country and year, so for the discretization, it was necessary to convert the data into two dimensions. The values of each indicator were averaged over 25 years to obtain one value. The process of discretization was straightforward. Range values are determined for all data attributes on which data has been converted from values to ranges. An example of three indicators can be found in Fig. 2.
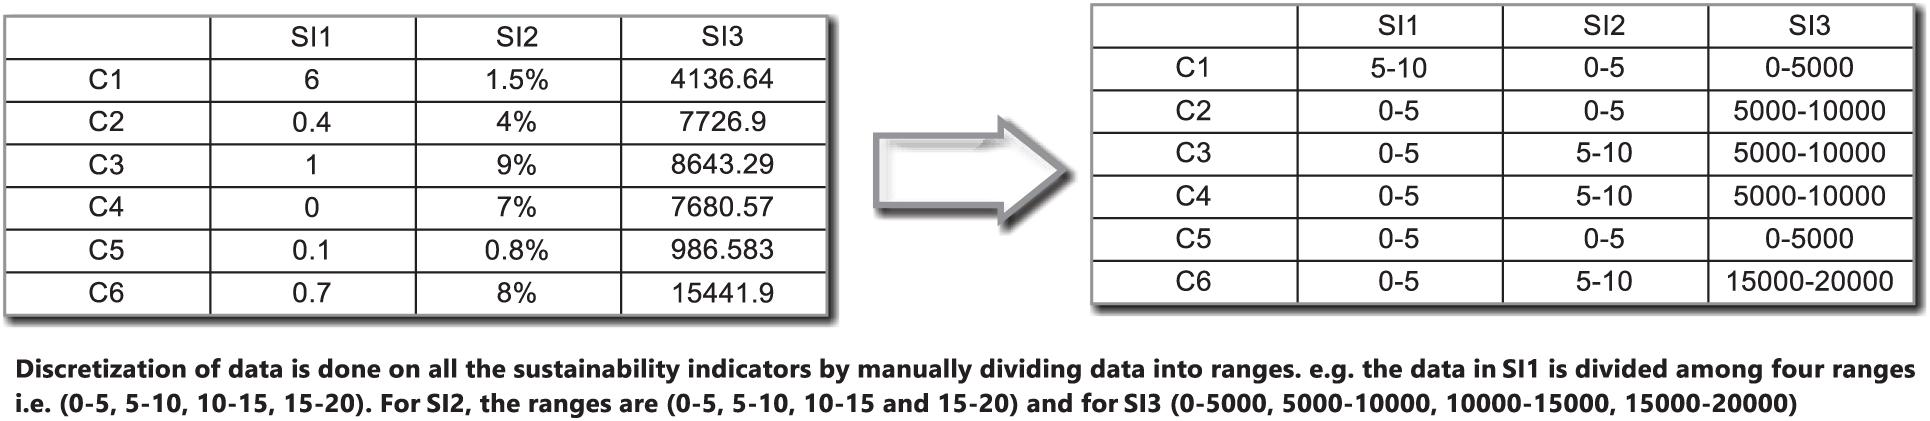
Figure 2: Discretization of data values (
In Fig. 2, an example of discretization of sustainability indicators for different countries from C1 to C6 is provided. The table on the left shows the non-discretized value that is converted in the table on the right illustrated in Fig. 2. For example, the SI2 value of C1 is converted in the interval 0–5 after discretization. The results shown in Fig. 2 show the relationship between the various energy SIs. The covariance of SI17 with SI19 shows that the greenhouse gas emissions caused by energy products have a strong association with the rate of deforestation caused by the energy products. Based on this pattern, energy decision-maker can build an optimal plan for sustainable energy development in the future. Another issue that the decision-maker can raise relates to the extent of covariance between SI17 and SI19. This can be calculated by using CPIR, interestingness, support and confidence measures.
A significant number of positive and negative association rules were extracted from the dataset using the CARM algorithm. It was nearly impossible to learn from these many rules. Different level of pruning’s strategies as described in the proposed method is used. Some of the final rules extracted after pruning are given in Fig. 3 and the detailed reduction in the number of rules after each pruning level is given in Tab. 4.
In Fig. 3, a snapshot of the extracted rules is given. SI in the figure represents the sustainability indicator and C represents one country.
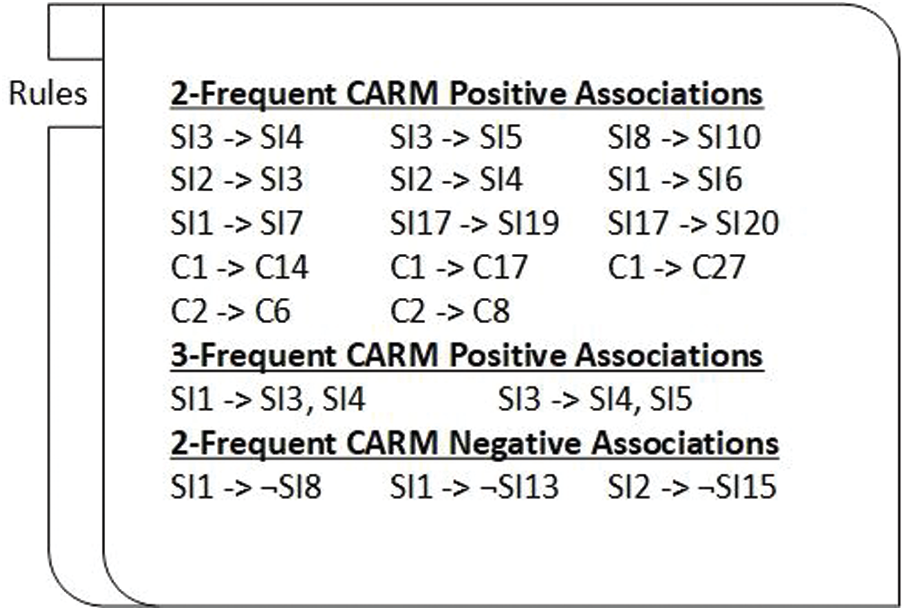
Figure 3: A snapshot of final set of association rules obtained through CARM based on three context variables
Table 4: Number of association rules extracted after applying different levels of pruning (

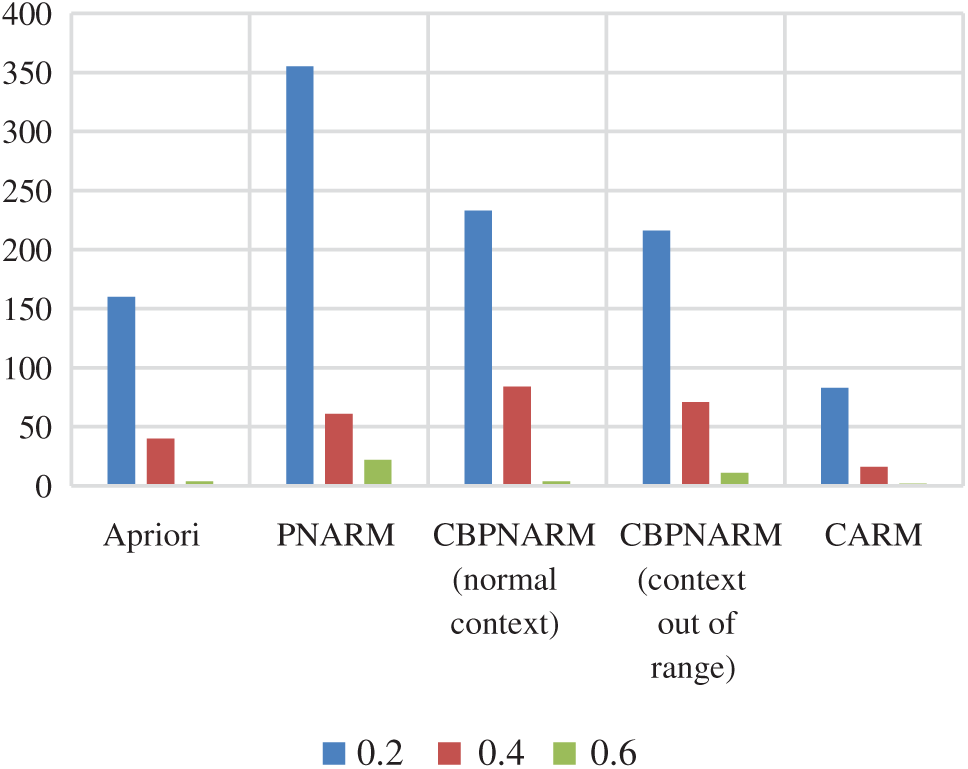
Figure 4: Plot of number of rules for Apriori, PNARM, CBPNARM (normal context), CBPNARM (context out of range), and CARM
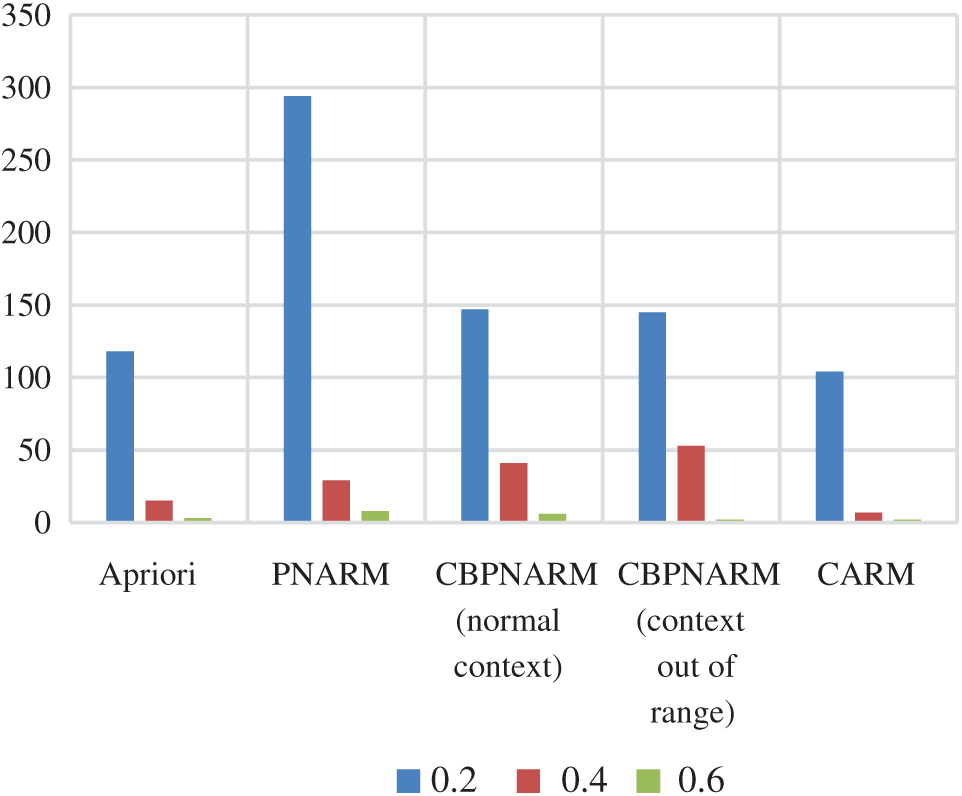
Figure 5: Plot of number of rules after pruning for Apriori, PNARM, CBPNARM (normal context), CBPNARM (context out of range), and CARM
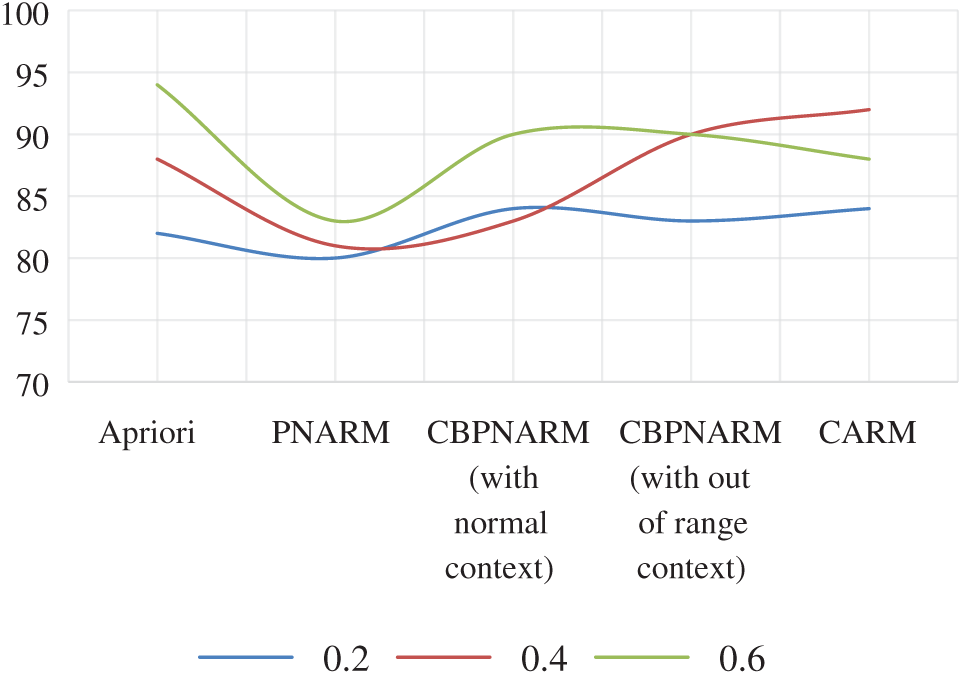
Figure 6: Plot of average confidence for Apriori, PNARM, CBPNARM (normal context), CBPNARM (context out of range), and CARM
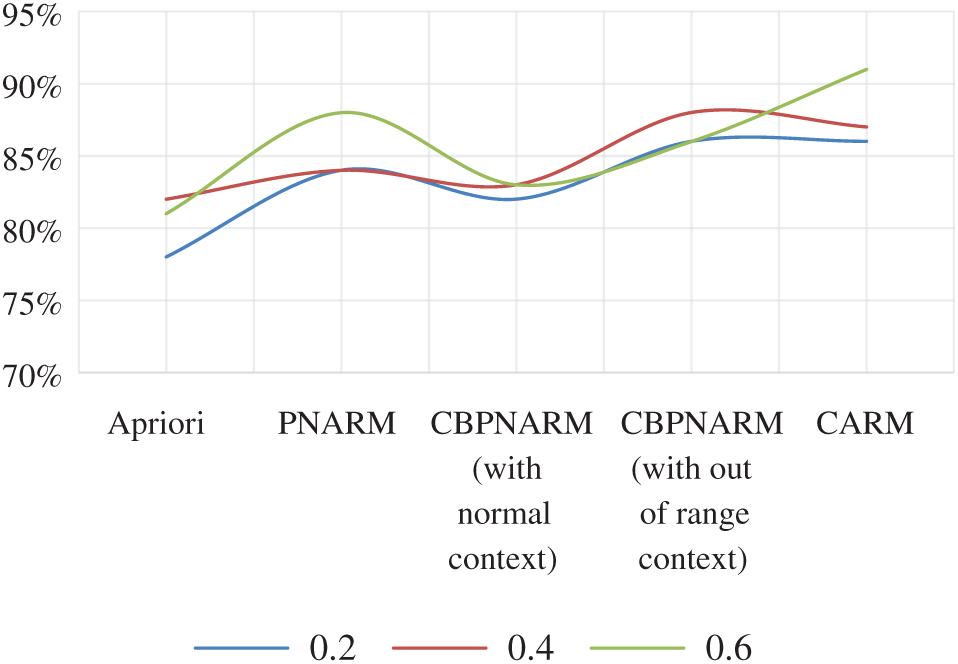
Figure 7: Plot of average confidence after pruning for Apriori, PNARM, CBPNARM (normal context), CBPNARM (context out of range), and CARM
The average confidence graphs for the unpruned and pruned rules extracted through all algorithms are given in Figs. 6 and 7 respectively. The average confidence of the proposed algorithm is greater in most cases. For support values 0.2 and 0.4, it is practically equal to CBPNARM. This is because the context variable value for the sustainability indicators dataset was normal in most cases for which the net impact on the final association rule set was too low. Rules confidence is a predictor of the CARM algorithm producing rules with higher certainty. The higher average confidence value for CARM indicates that the rules extracted are not unfamiliar. There is a higher co-occurrence of antecedent and consequent and the consequent is less escorted by any other antecedent. This proves the certainty about the rules extracted from the database. The average dependence plots are almost the same with pruning and without pruning for which a single plot is given in Fig. 8. PNARM performed best over the given dataset because the PNARM algorithm is intended to maintain rule dependence by interestingness, dependence and CPIR. The proposed algorithm applied interestingness and CPIR for the curve are in the lower domain of PNARM but higher in comparison with the rest. Fig. 9 illustrates the execution time of all algorithms. After integrating all pruning techniques, the execution time of the proposed algorithm is inferior to PNARM and CBPNARM and superior to the Apriori algorithm. The reason is obvious because the Apriori algorithm mine frequent items only and level-1 pruning is only done in Apriori. PNARM, CBPNARM and CARM are all considering various pruning measures where their execution time is expected to be at the top end. The execution time of CARM is less than CBPNARM because CBPNARM was developed for spatial data that is a pseudo form of image data.
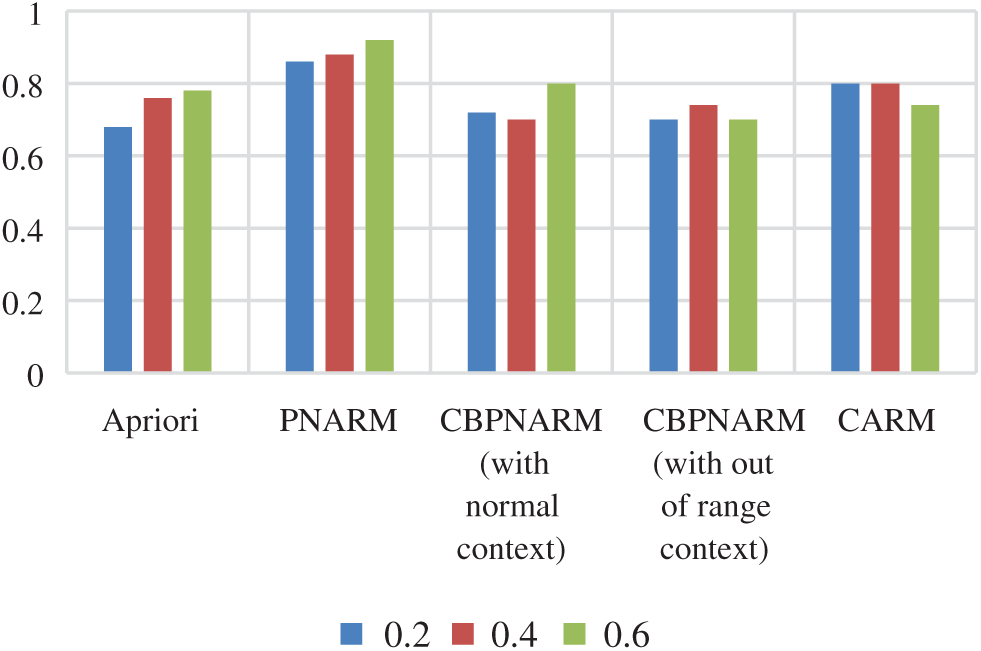
Figure 8: Plot of average dependence for Apriori, PNARM, CBPNARM (normal context), CBPNARM (context out of range), and CARM
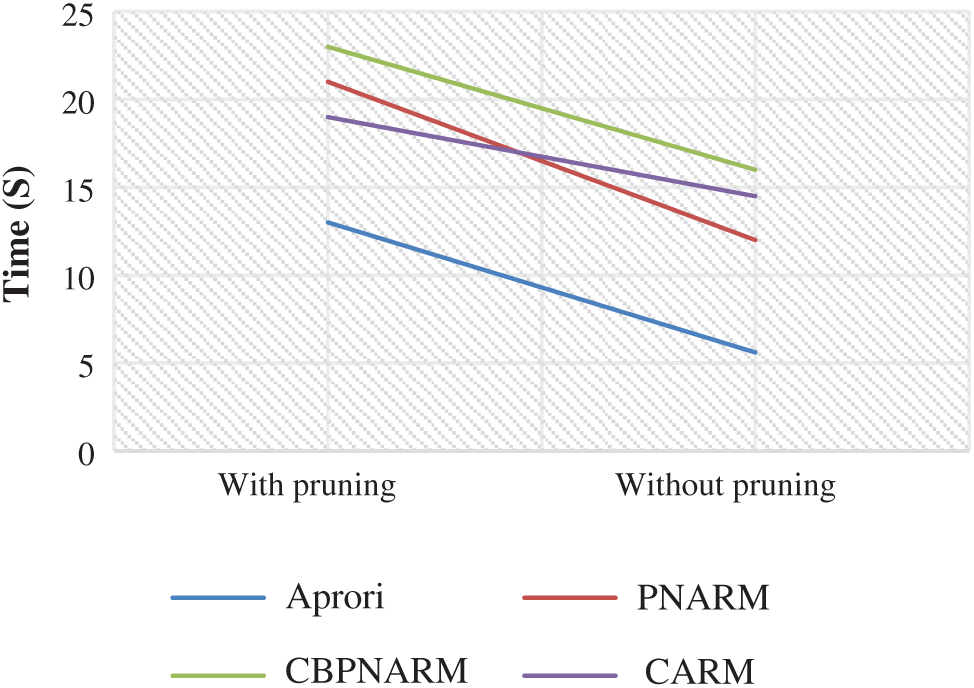
Figure 9: Plot of execution time for Apriori, PNARM, CBPNARM and CARM
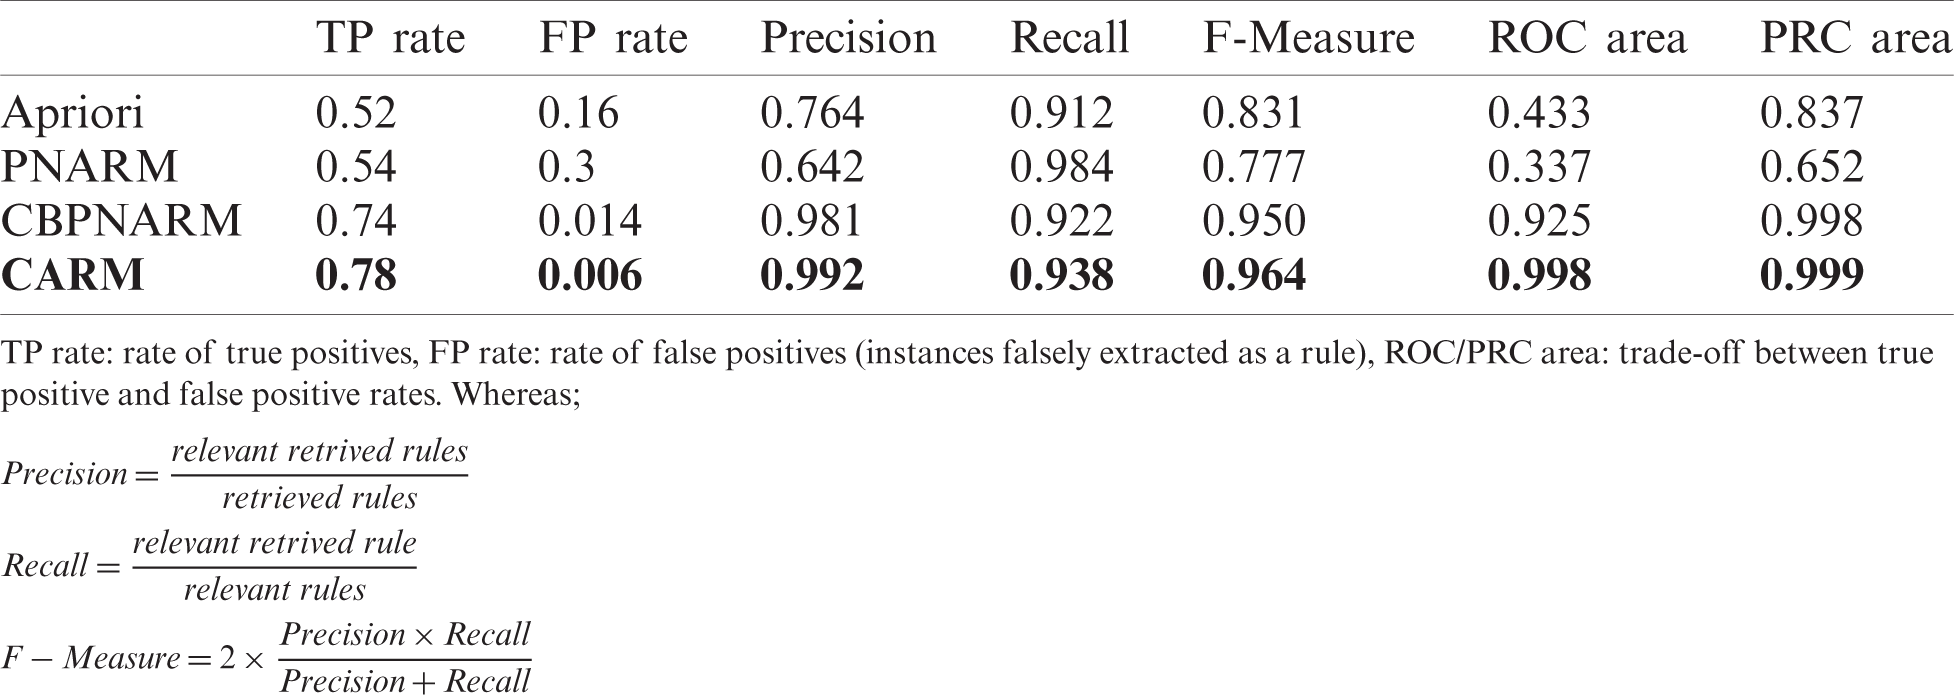
CARM with additional pruning measure took lesser execution time than CBPNARM. The execution time of CARM is at last but one position if no pruning technique is used for association rule mining. The algorithm was designed to improve the quality of association rules extracted from the datasets for which comparing algorithms based on precision, recall and F-measure depicted a clearer picture. The comparison of the algorithms based on average values on multiple energy datasets is shown in Tab. 5. The rules extracted from the dataset is divided into true positives, false positives, true negatives and false negatives according to the measures above. Higher precision, recall, and F-measure for the CARM algorithm indicate that the algorithm has extracted more useful rules. The values given in Tab. 5 are calculated by comparing the result of the algorithms for extracting association rules with the real rules that are used in the energy sector and validated by the expert of the domain.
Table 5: Precision, recall, F-measure for evaluation of the extracted rules
The CARM algorithm for mining context-based association rules is proposed in this paper as an extension of the CBPNARM algorithm. A few association rule pruning techniques are incorporated into the CARM algorithm including confidence, interestingness and CPIR to improve insights by decreasing the number of rules extracted. The context is used in the algorithm to eliminate certain rules and/or add those excluded from the final rule set defined based on the out-of-range-value of the context variable. The algorithm is applied to sustainable energy indicators to find co-varying sustainability indicators and countries for sustainable energy development. The rules produced by CARM are more robust, relevant and insightful in terms of average confidence, dependence and relevance.
The proposed method outperformed the previous methods in terms of the number of rules generated, confidence and dependency. The inclusion of the context variable and CPIR reduced the number of rules and increased the robustness and usability of the rules. Confidence and dependency values show that fewer rules do not suggest a loss of useful patterns. The execution time of the algorithm is higher than a few other algorithms, which is expected due to additional functions added for the context variable and CPIR. The complexity of the algorithm can be improved in future by using object-oriented approaches for context variable and CPIR.
The results obtained in terms of the application domain of sustainable energy development are also insightful and reported interesting covariances in the indicators and underlined the criticality of some countries for their energy development. The energy sector in a country can use associations derived from the proposed method to construct an optimal plan to ensure sustainable energy development. The associations among sustainability indicators can lead the energy sector to devise a plan according to the individual deficiencies of energy development and its relation with other developmental factors. Thus, the study can lead an energy sector to achieve optimal energy development without compromising the economy, ecology and social justice that are essential ingredients for sustainability. The work can be extended to automate the selection of context variable because manually selecting context variables can add some bias to the results. An automated mechanism interpreting negative association rules can also be added to the algorithm in future work. Different classification algorithms and learning approaches can be added to the system to reduce the complexity arising from the data structure.
Funding Statement: The authors received no specific funding for this study.
Conflicts of Interest: The authors declare that they have no conflicts of interest to report regarding the present study.
1. M. Shaheen, M. Shahbaz, Z. Rehman and A. Guergachi, “Data mining applications in hydrocarbon exploration,” Artificial Intelligence Review, vol. 35, no. 1, pp. 1–18, 2010. [Google Scholar]
2. M. Shaheen and M. Z. Khan, “A method of data mining for selection of site for wind turbines,” Renewable and Sustainable Energy Reviews, vol. 55, pp. 1225–1233, 2017. [Google Scholar]
3. S. H. Liao, P. H. Chu and P. Y. Hsio, “Data mining techniques and applications—A decade review from 2000 to 2011,” Expert Systems with Applications, vol. 39, no. 12, pp. 11303–11311, 2017. [Google Scholar]
4. A. Azevedo, “Data mining and knowledge discovery in databases,” in Advanced Methodologies and Technologies in Network Architecture, Mobile Computing, and Data Analytics. Pennsylvania, United States: IGI Global, pp. 502–514, 2019. [Google Scholar]
5. X. Wu, C. Zhang and S. Zhang, “Efficient mining of both positive and negative association rules,” ACM Transactions on Information Systems, vol. 22, no. 3, pp. 381–405, 2004. [Google Scholar]
6. K. Vadim, “Overview of different approaches to solving problems of data mining,” Procedia Computer Science, vol. 123, pp. 234–239, 2018. [Google Scholar]
7. M. Shaheen, M. Shahbaz and A. Guergachi, “Context based positive and negative spatio-temporal association rule mining,” Knowledge-Based Systems, vol. 37, pp. 261–273, 2013. [Google Scholar]
8. M. Shaheen, M. Shahbaz, A. Guergachi and Z. Rehman, “Mining sustainability indicators to classify hydrocarbon development,” Knowledge-Based Systems, vol. 24, no. 8, pp. 1159–1168, 2011. [Google Scholar]
9. S. Ray and M. Saeed, “Applications of educational data mining and learning analytics tools in handling big data in higher education,” Applications of Big Data Analytics, pp. 135–160, 2018. https://www.springerprofessional.de/en/applications-of-big-data-analytics/15972258. [Google Scholar]
10. C. Romero and S. Ventura, “Data mining in education,” WIREs Data Mining and Knowledge Discovery, vol. 3, pp. 12–27, 2013. [Google Scholar]
11. M. Shahbaz, A. Guergachi, A. Noreen and M. Shaheen, “A data mining approach to recognize objects in satellite images to predict natural resources,” In: G. C. Yang, Ao S., Gelman L. (Eds.) IAENG Transactions on Engineering Technologies, Lecture Notes in Electrical Engineering, vol. 229. Dordrecht: Springer, pp. 215–230, 2013. https://doi.org/10.1007/978-94-007-6190-2_17. [Google Scholar]
12. M. Shaheen and M. Shahbaz, “An algorithm of association rule mining for microbial energy prospection,” Scientific Reports, vol. 7, no. 1, pp. 68, 2017. [Google Scholar]
13. S. G. Alonso, I. D. I. Torre-Diez, S. Hamrioui, M. Lopez-Coronado, D. C. Barreno et al., “Data mining algorithms and techniques in mental health: A systematic review,” Journal of Medical Systems, vol. 42, no. 9, pp. 161, 2018. [Google Scholar]
14. D. AI, H. Pan, X. Li, Y. Gao and D. He, “Association rule mining algorithms on high-dimensional datasets,” Artificial Life and Robotics, vol. 23, pp. 420–427, 2018. [Google Scholar]
15. S. Cokpinar and T. I. Gundem, “Positive and negative association rule mining on XML data streams in database as a service concept,” Expert Systems with Applications, vol. 39, no. 8, pp. 7503–7511, 2012. [Google Scholar]
16. S. Mahmood, M. Shahbaz and A. Guergachi, “Negative and positive association rules mining from text using frequent and infrequent itemsets,” Scientific World Journal, vol. 973750, no. 2, pp. 1–11, 2014. [Google Scholar]
17. I. Batyrshin, D. S. Pamucar, P. Crippa and F. Liu, “Select actionable positive or negative sequential patterns,” Journal of Intelligent and Fuzzy Systems, vol. 29, no. 6, pp. 2759–2767, 2015. [Google Scholar]
18. R. Anuradha and N. Rajkumar, “Mining generalized positive and negative inter-cross fuzzy multiple-level coherent rules,” Journal of Intelligent and Fuzzy Systems, vol. 32, no. 3, pp. 2269–2280, 2017. [Google Scholar]
19. A. Aggarwal and D. Toshniwal, “Frequent pattern mining on time and location aware air quality data,” IEEE Access, vol. 7, pp. 98921–98933, 2019. [Google Scholar]
20. Cowen and J. David, “Geospatial metadata,” in International Encyclopedia of Geography: People, the Earth, Environment and Technology, Boston, MA: Springer, pp. 1–6, 2016. [Google Scholar]
21. R. Agarwal and R. Srikant, “Fast algorithms for mining association rules,” in Proc. of the 20th VLDB Conf., Santiago, Chile, vol. 487, pp. 499, 1994. [Google Scholar]
22. D. J. Prajapati, S. Garg and N. C. Chauhan, “Interesting association rule mining with consistent and inconsistent rule detection from big sales data in distributed environment,” Future Computing and Informatics Journal, vol. 2, no. 1, pp. 19–30, 2017. [Google Scholar]
23. United Nations Department of Economics and Social Affairs, “International energy agency, Eurostate, and European environment agency,” in Energy Indicators for Sustainable Development: Guidelines and Methodologies. Vienna: International Atomic Energy Agency, 2005. [Google Scholar]
24. United Nations (UNReport of the World Summit on Sustainable Development, A/CONF. 199(20). New York: United Nations, 2002. [Google Scholar]
25. B. K. Sovacool and I. Mukherjee, “Conceptualizing and measuring energy security: A synthesized approach,” Energy, vol. 36, no. 8, pp. 5343–5355, 2011. [Google Scholar]
26. U. Al-Mulali, B. Saboori and Ozturk, “Investigating the environmental Kuznets curve hypothesis in Vietnam,” Energy Policy, vol. 76, no. 3, pp. 123–131, 2015. [Google Scholar]
27. S. Pachauri and D. Spreng, “Measuring and monitoring energy poverty,” Energy Policy, vol. 39, no. 12, pp. 7497–7504, 2011. [Google Scholar]
28. M. Salahuddin, K. Alam, I. Ozturk and K. Sohag, “The effects of electricity consumption, economic growth, financial development and foreign direct investment on CO2 emissions in Kuwait,” Renewable and Sustainable Energy Reviews, vol. 81, no. 2, pp. 2002–2010, 2018. [Google Scholar]
29. J. W. Moon and J. Ahn, “Improving sustainability of ever-changing building spaces affected by users’ fickle taste: A focus on human comfort and energy use,” Energy and Buildings, vol. 208, pp. 109662, 2020. [Google Scholar]
30. Y. Dong and M. Z. Hauschild, “Indicators for environmental sustainability,” Procedia CIRP, vol. 61, pp. 697–702, 2017. [Google Scholar]
31. Y. Liu, P. Xie, Q. He, X. Zhao, X. Wei et al., “A new method based on association rules mining and geo-filter for mining spatial association knowledge,” Chinese Geographical Science, vol. 27, no. 3, pp. 389–401, 2017. [Google Scholar]
32. F. Yoseph and M. Heikkila, “A new approach for association rules mining using computational and artificial intelligence,” Journal of Intelligent and Fuzzy Systems, Prepress, pp. 1–14, 2020. [Google Scholar]
33. J. Han, M. Kamber and J. Pei, Data Mining: Concepts and Techniques, 3rd ed. Elsevier, Online, pp. 243–278, 2012. [Google Scholar]
34. L. K. Sharma, O. P. Vyas, U. S. Tiwary and R. Vyas, “A novel approach of multilevel positive and negative association rule mining for spatial databases,” In: P. Perner, A. Imiya (Eds.) Machine Learning and Data Mining in Pattern Recognition, Lecture Notes in Computer Science, vol. 3587. Berlin, Heidelberg: Springer, pp. 620–629, 2005. [Google Scholar]
35. W. Yang, Q. Liao and C. Zhang, “An association rule mining algorithm on context-factors and users preference,” in Proc. 2013 5th Int. Conf. on Intelligent Human–Machine Systems and Cybernetics, China, pp. 190–195, 2013. [Google Scholar]
 | This work is licensed under a Creative Commons Attribution 4.0 International License, which permits unrestricted use, distribution, and reproduction in any medium, provided the original work is properly cited. |