DOI:10.32604/cmc.2021.016489
| Computers, Materials & Continua DOI:10.32604/cmc.2021.016489 | |
| Article |
Prediction of Parkinson’s Disease Using Improved Radial Basis Function Neural Network
1St. Joseph’s Institute of Technology, Chennai, 600119, India
2Madras Institute of Technology, Chennai, 600044, India
*Corresponding Author: Rajalakshmi Shenbaga Moorthy. Email: srajiresearch@gmail.com
Received: 03 January 2021; Accepted: 23 February 2021
Abstract: Parkinson’s disease is a neurogenerative disorder and it is difficult to diagnose as no therapies may slow down its progression. This paper contributes a novel analytic system for Parkinson’s Disease Prediction mechanism using Improved Radial Basis Function Neural Network (IRBFNN). Particle swarm optimization (PSO) with K-means is used to find the hidden neuron’s centers to improve the accuracy of IRBFNN. The performance of RBFNN is seriously affected by the centers of hidden neurons. Conventionally K-means was used to find the centers of hidden neurons. The problem of sensitiveness to the random initial centroid in K-means degrades the performance of RBFNN. Thus, a metaheuristic algorithm called PSO integrated with K-means alleviates initial random centroid and computes optimal centers for hidden neurons in IRBFNN. The IRBFNN uses Particle swarm optimization K-means to find the centers of hidden neurons and the PSO K-means was designed to evaluate the fitness measures such as Intracluster distance and Intercluster distance. Experimentation have been performed on three Parkinson’s datasets obtained from the UCI repository. The proposed IRBFNN is compared with other variations of RBFNN, conventional machine learning algorithms and other Parkinson’s Disease prediction algorithms. The proposed IRBFNN achieves an accuracy of 98.73%, 98.47% and 99.03% for three Parkinson’s datasets taken for experimentation. The experimental results show that IRBFNN maximizes the accuracy in predicting Parkinson’s disease with minimum root mean square error.
Keywords: Improved radial basis function neural network; K-means; particle swarm optimization
Parkinson’s Disease (PD) is the second neurogenerative disorder after Alzheimer’s disease. It affects nearly 1% of individuals who are in or above the age of 60 [1,2]. PD is a progressive neurological disorder characterized by a large number of motor symptoms such as hypomimia, dysarthria, and non-motor symptoms such as autonomic dysfunction and sleep disorder [3,4]. There are no disease modifying therapies that either slow down, stop or inverse the progression of PD [5]. Treatments such as Levodopa/Carbidopa duodenal infusion improve motor conditions along with reduction in disabling dyskinesia in patients with PD [6]. Though these therapies only provide temporary relief from early symptoms, they do not cease progression of PD [7].
Two main quantitative measures that measure the progression of PD is i) the Hoehn and Yahr Scale [8] and ii) the Unified Parkinson’s Disease Rating Scale (UPDRS) [9]. The Movement Disorder Society (MDS) had revised UPDRS, which is called MDS-UPDRS. These measures identify the progression of PD, but the symptoms of PD vary from person to person. Thus, diagnosing PD is complex. In this article, an Improved Radial Basis Function Neural Network (IRBFNN) was used to predict the Parkinson’s disease. This work aims to improve the accuracy of predicting Parkinson’s disease from the dataset taken from the UCI repository. Voice signals, vowels, handwritten symbols, and gaits [10] are used for detecting Parkinson’s disease. In recent days, researchers focus on applying machine learning algorithms to build a model for better classification/prediction using data gathered at the clinic [11,12].
The motivation behind using IRBFNN is to predict PD with maximum accuracy, positive predictive value, negative predictive value, and minimum error. The problem with conventional RBFNN is that performance of the classifier lies in the center of the hidden neurons [13–15]. Conventionally K-means clustering was used to find the centers of the hidden neurons in RBFNN. K-means is vulnerable to the initial centroid, which heavily affects the performance of RBFNN [16]. In order to build an efficient RBFNN, an optimal radial basis function has to be constructed for the hidden neurons. Some traditional methods used to find RBF centers are K-means, K-means with density parameter [16], original density method [17]. All the approaches specified have their origin from K-means. Thus, this paper focuses on using K-means for finding centers of hidden neurons. Thus, a metaheuristic algorithm called Particle Swarm Optimization (PSO) based K-means is used to find the centers of the hidden neurons of IRBFNN to maximize the accuracy with correct predictions. The PSO K-means [18] finds the centers using the exploration, exploitation of the particles and movement of the particle towards the global best.
The main contributions of the paper are:
—PSO K-means is used to find the centers with the fitness value of maximizing the Inter-cluster distance and minimizing the intra-cluster distance
—The centers given by PSO K-means are used in the hidden neurons of IRBFNN
—Experimentation of IRBFNN is done on 3 Parkinson’s datasets
IRBFNN is compared with other variations of RBFNN such as RBFNN-3 where centers are found using Whale Optimization Algorithm (WOA) K-means, RBFNN-2 where centers are determined using Sine Cosine Algorithm (SCA) K-means, RBFNN-1 in which centers are calculated using Genetic Algorithm (GA) based K-means and RBFNN where centers are found using K-means in terms of accuracy, positive predictive value, negative predictive value, root mean square error, F-score
—IRBFNN is also compared with conventional machine learning algorithms such as {K-means}, Random Forest, Decision Tree, and Support Vector Machine
—Mean, Best, and Worst fitness values are also compared for proposed PSO K-means, WOA K-means, SCA K-means, and GA K-means, which is used in IRBFNN, RBFNN-3, RBFNN-2 and RBFNN-1, respectively.
—Also, IRBFNN is compared with other machine learning algorithms used for PD prediction
—Experimentation is carried out 30 times, and the mean value is taken for performance analysis
The rest of the paper is organized as follows: Section 2 describes the related study on applying different machine learning algorithms for predicting Parkinson’s disease. Section 3 details the proposed system for the prediction of Parkinson’s disease. Section 4 details IRBFNN along with centers determined using PSO K-means. Section 5 details the experimental results obtained by comparing the proposed Improved radial basis function neural network (IRBFNN-RBFNN + PSO + K-means) with other machine learning algorithms using the Parkinson’s dataset taken from UCI repository [19]. Section 6 concludes the work along with the future scope.
2 Background and Related Works
Freezing of Gait (FoG) in Parkinson’s disease was predicted using FoG prediction algorithm, which considers various metrics such as sensor positions, sensor axis, sampling window length [20]. Multisource ensemble learning together with Convolutional Neural Network (CNN) was used to detect Parkinson’s disease [21]. Cascaded Multi-Column Random Vector Functional Link (RVFL) had been used for diagnosing PD. The data sets used was taken from PPMI. The model produced an accuracy of 81.93% [22].
FoG prediction model using AdaBoost was designed using impaired gait features. In order to correctly identify gait, a pre-Fog phase was used based on the slope of the impaired gait pattern [23]. Positive Transfer Learning (PTL) was used to detect PD. An At-home testing device (AHTD) measures the symptoms of PD which is then converted into UPDRS measurements [24].
FoG prediction was made using Electroencephalography (EEG) features, which was determined using Fourier and wavelet analysis using data gathered from 16 patients [25]. Conventional RBFNN was used to predict PD using the data generated by electrodes implanted in the deep brain of a patient [26]. Random forest together with minimum redundancy and maximum relevance was used to predict PD using the dataset having voice measurements of 31 people [27]. National Centre for Voice and Speech (NCVS) having 263 samples were used as a dataset to create a model using support vector machine and random forest to maximize accuracy while classifying PD [28]. Joint Regression and Classification Framework was designed for diagnosing PD using Parkinson’s Progression Marker Initiative (PPMI) dataset [29].
From the literature, it is observed that there are several approaches present for prediction of Parkinson’s disease. Also, there is wide use of particle swarm optimization algorithms to find the number of neurons, their centers and weights of RBFNN and the methods were applied to various real-world problems. With the goal to still maximizing the accuracy, in this paper, PSO with K-means is designed to find the optimal centers for RBFNN structure and the proposed approach is used for optimal prediction of Parkinson’s disease.
3 Proposed Parkinson’s Disease Prediction System
The system design for the proposed prediction of Parkinson’s disease is shown in Fig. 1. The sensors embedded in the elderly patient gather the patient’s health data and the data get stored in the data store. The data in the data store is split as training data set and test data set. Training data set is given as input to the preprocessor where the normalization process happens. The normalized data is provided as input to the predictor, which is designed using IRBFNN. The IRBFNN is trained with the training dataset, and the model is tested with the test dataset. Improved radial basis function neural network is used to transfer input vector
where
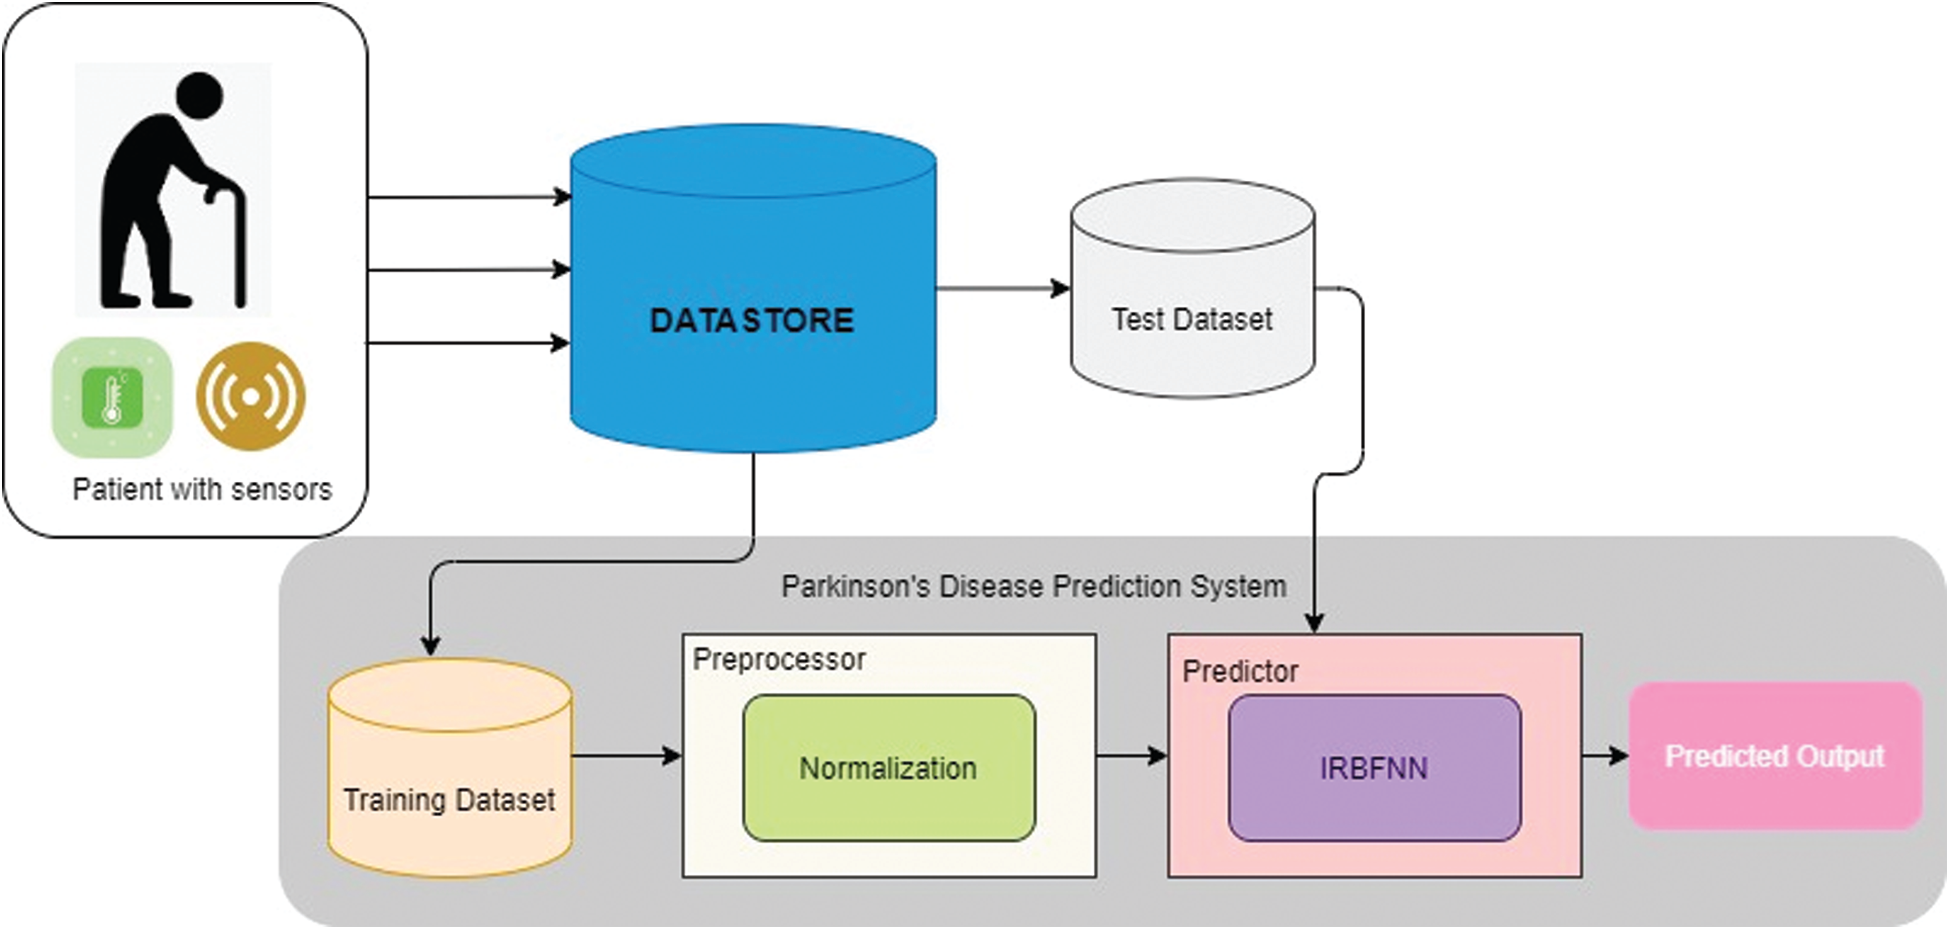
Figure 1: Proposed Parkinson’s disease prediction system
The preprocessor does the process of normalizing the data to the range [0, 1]. Normalization of attributes represented in Eq. (2) is essential for efficient training of the predictor.
IRBFNN classifies the input sample by sending each input vector
3.2.1 Initialization of Neuron
The numbers of neurons in the input layer are initialized to the number of dimensions of the dataset. Let
where
3.2.2 Construction of Radial Basis Function Using PSO K-means
Each RBF neuron is designed using PSO K-means. The RBF neuron prototype plays a prominent role in the optimal allocation of class label to the instance that results in maximizing accuracy. Thus, it is necessary to choose a good prototype for maximizing accuracy. The metaheuristic clustering is used as a RBF neuron prototype where each instance is trained for the optimal class assignment. PSO is evaluated against the metrics such as Intra-cluster distance and Inter-cluster distance.
Having computed the hidden neurons’ centers using PSO K-means, the next step is computing the variance of each hidden neuron using Eq. (4).
The initial weights between the hidden neuron and the summation layer neuron are assigned by the pseudo inverse method represented in Eq. (5). The weight between the
Error for the
where
When the error value is converged, the IRBFNN maximizes the accuracy in the prediction of Parkinson’s disease for the test dataset.
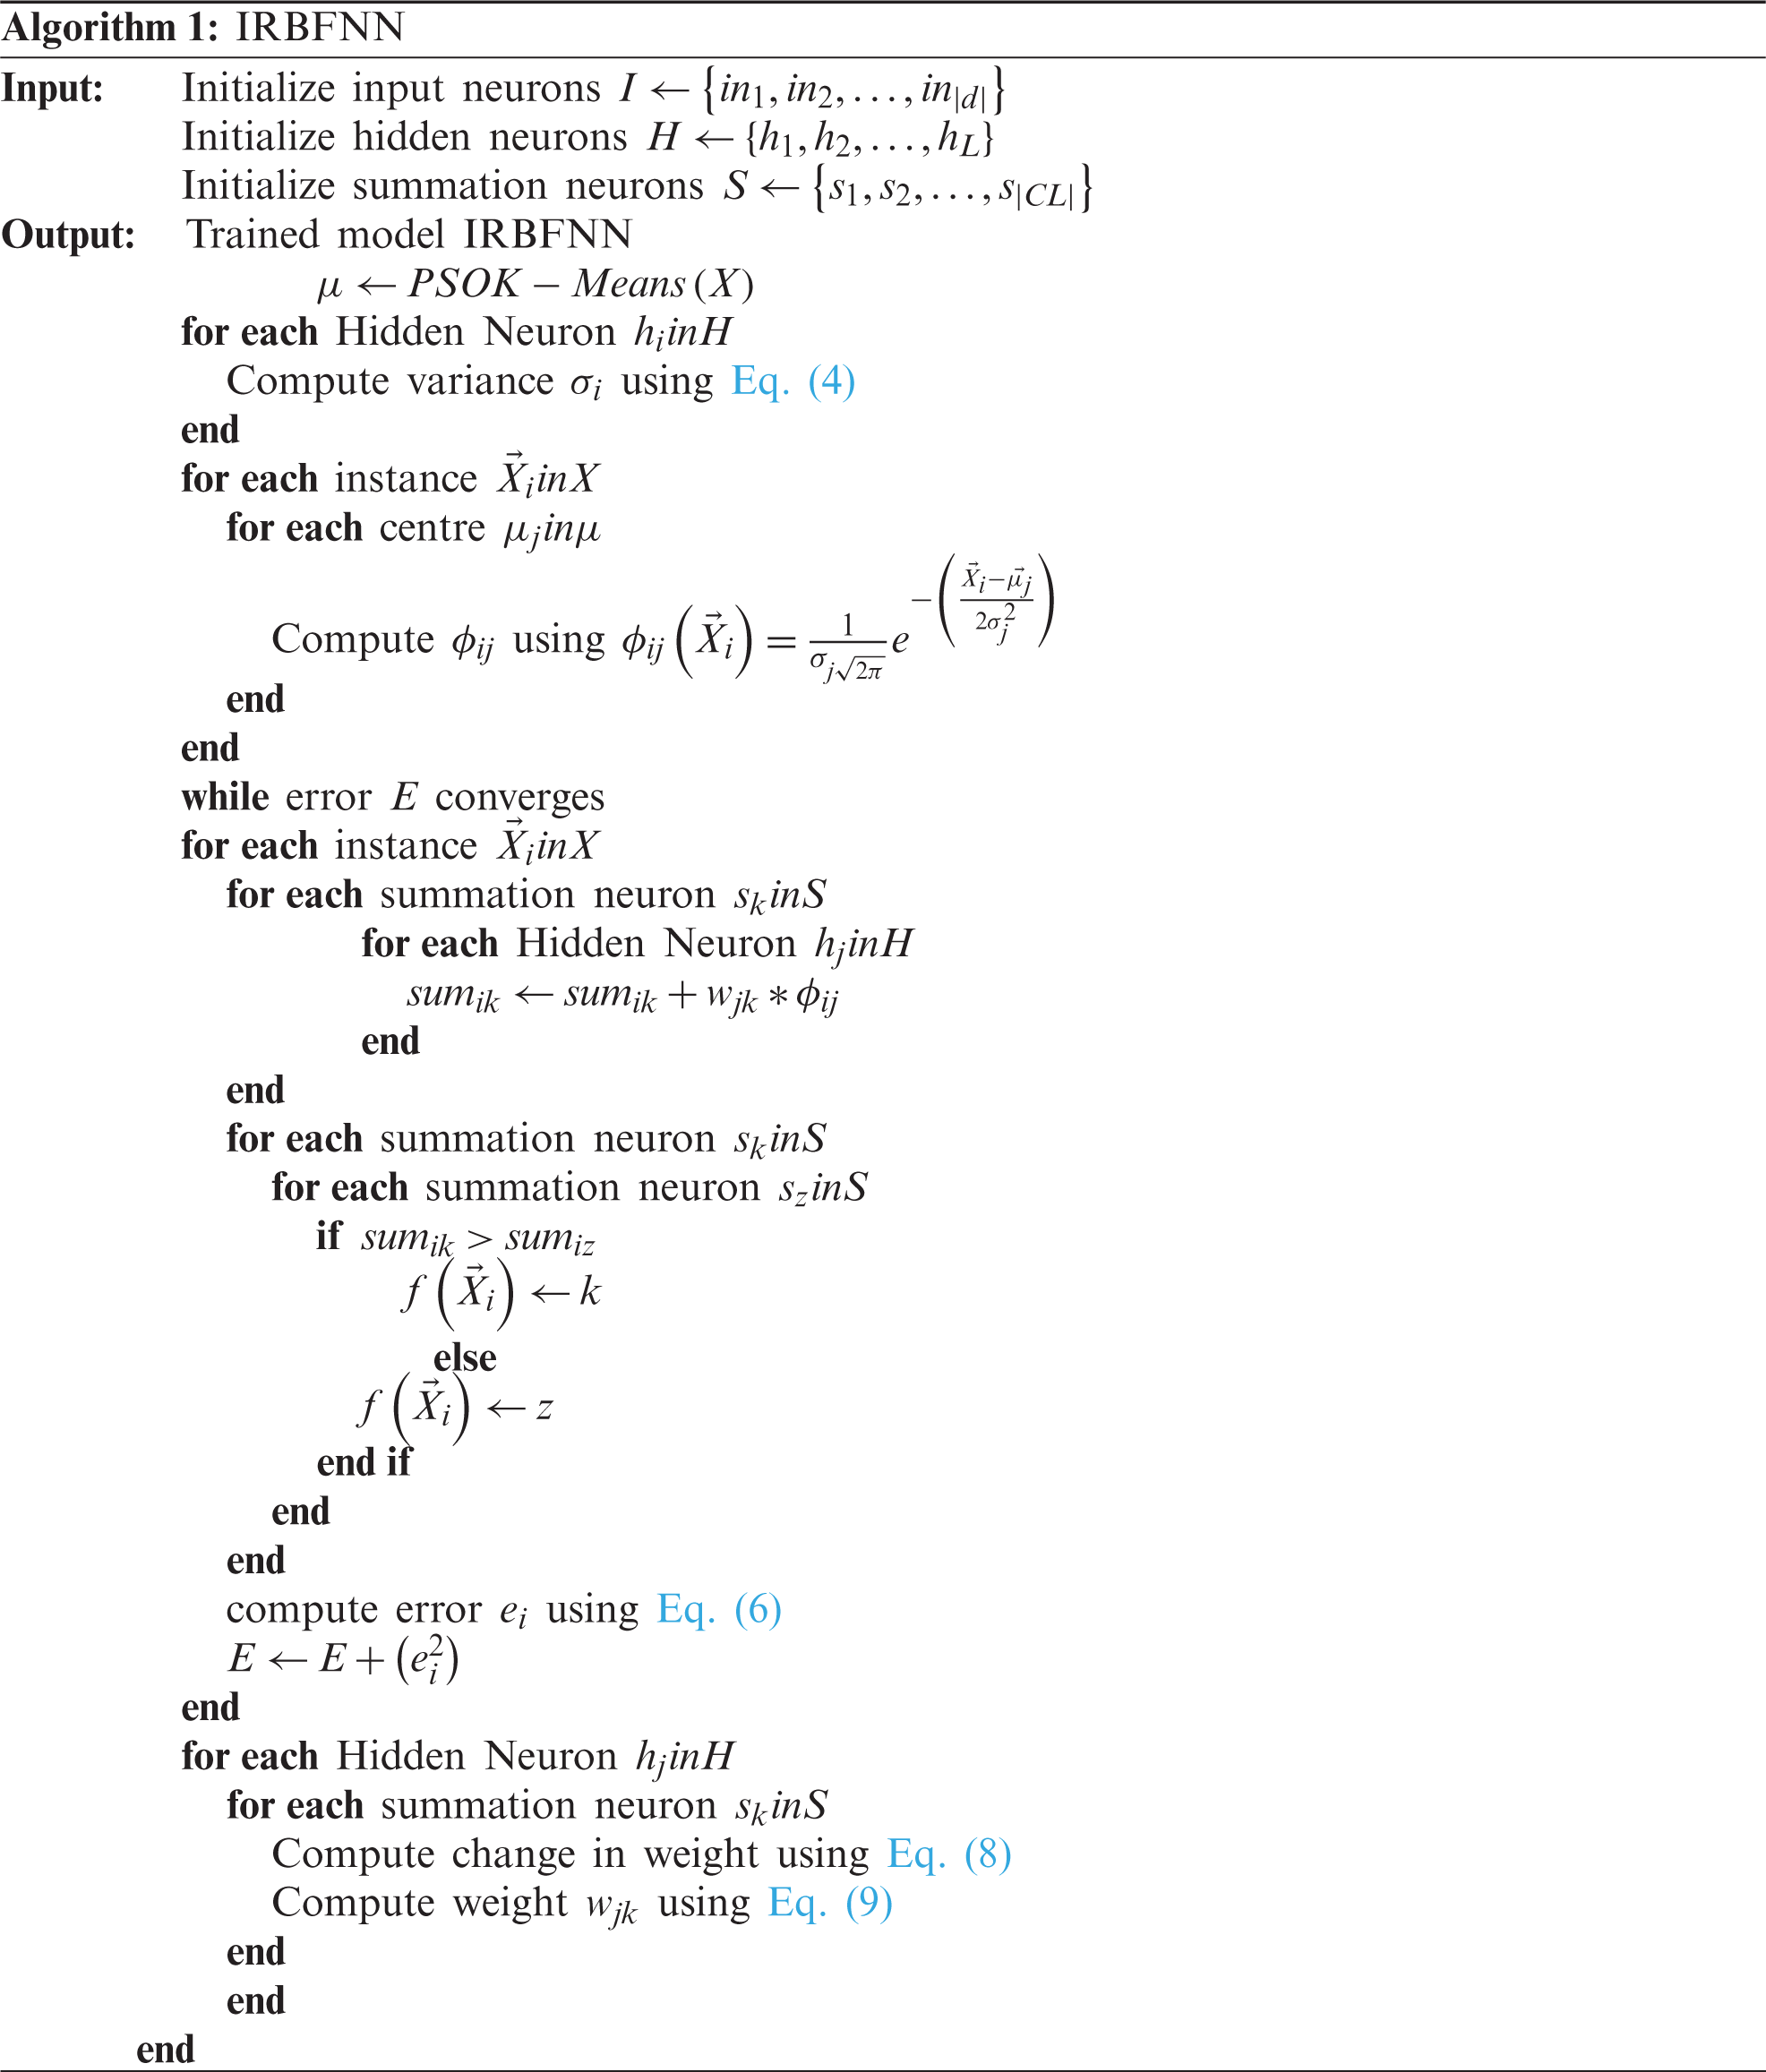
The radial basis function is designed using particle swarm optimization-based K-means. Algorithm 1 illustrates the working procedure of IRBFNN. Section 4 details the computation of the radial basis function for IRBFNN. The combined fitness function for the particle swarm optimization is represented in Eq. (10). The objective of maximizing the fitness function is achieved by maximizing the Inter-cluster distance and minimizing the intra-cluster distance.
where
Inter-cluster distance
where
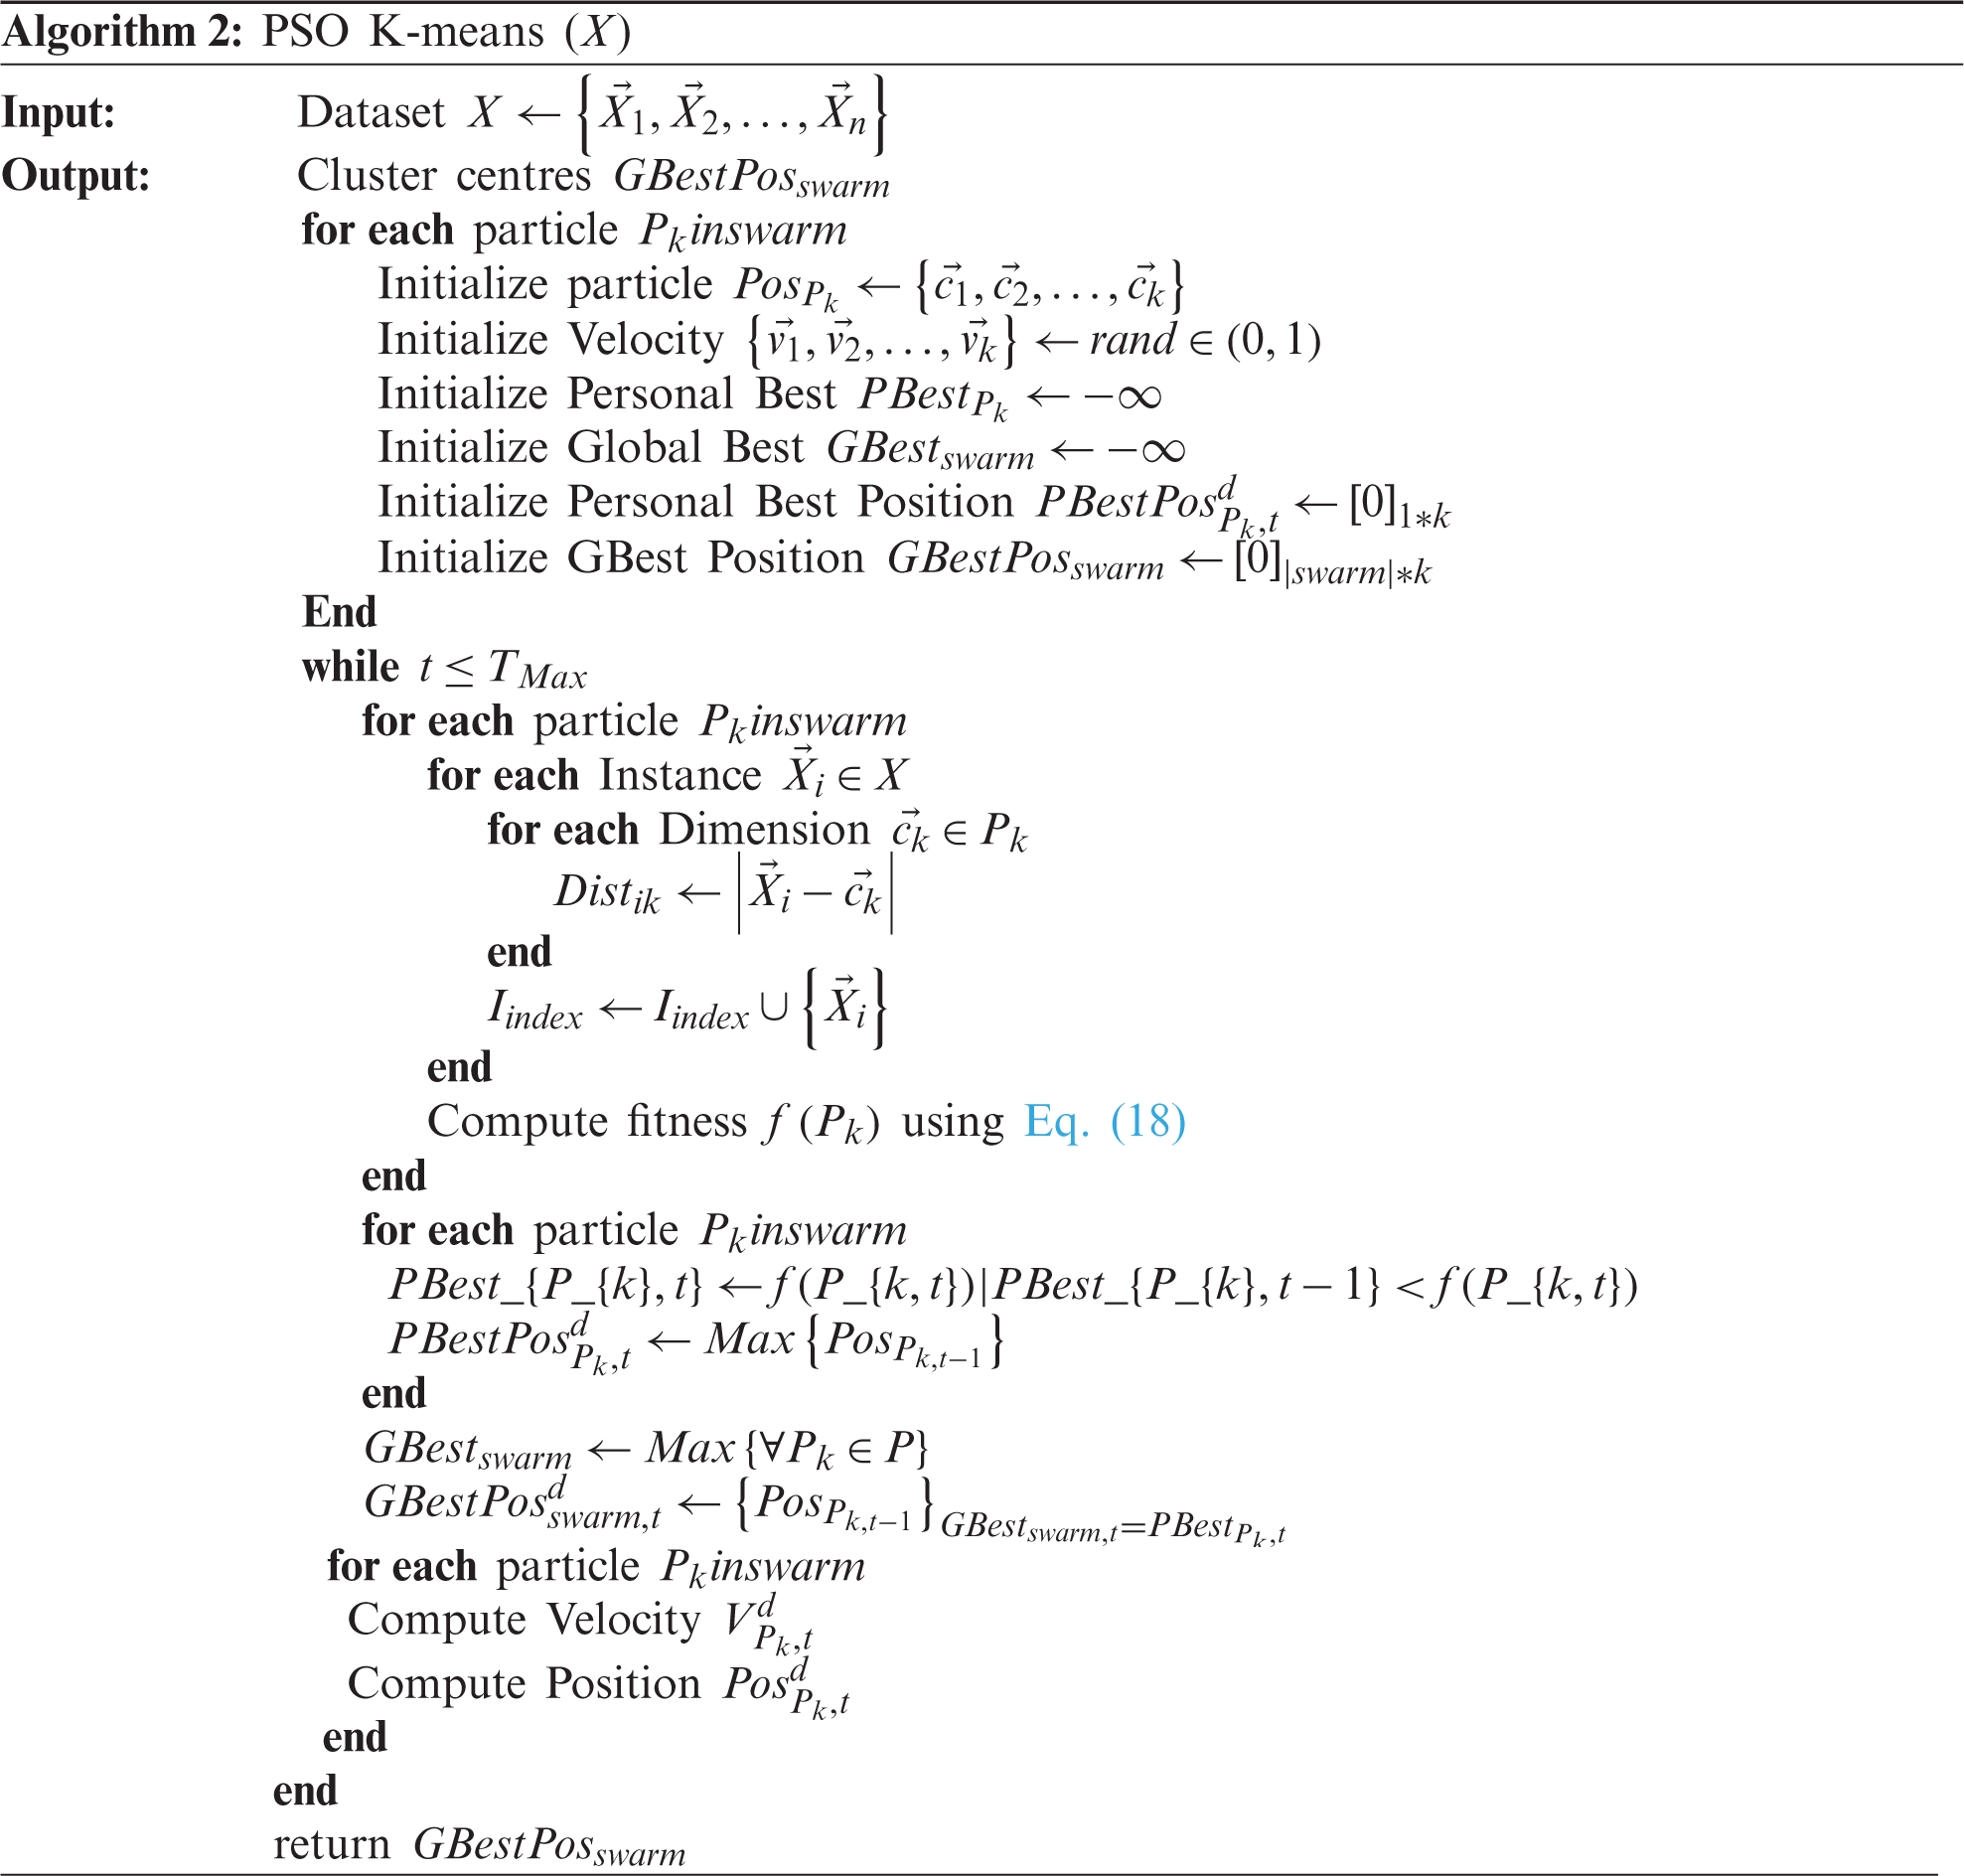
The PSO K-means for finding optimal centers of the hidden neuron are represented in Algorithm 2. The
The proposed IRBFNN was executed in python and its accomplishment was measured using three Parkinson’s disease datasets taken from the UCI repository [19]. PSO K-means is used to find centers of hidden neurons. The investigation is performed on Intel ® core TM i5-4210 U CPU @1.70 GHz and 4 GB RAM.
In order to evaluate the efficiency of the proposed IRBFNN, several investigations were performed. The analysis was conducted on 3 benchmarking Parkinson’s datasets taken from the UCI repository. The datasets include Dataset 1-Parkinson’s dataset, Dataset 2-Parkinson’s disease classification dataset, Dataset 3-Parkinson’s speech dataset with multiple types of sound recordings data set. Researchers widely used these datasets for classifying the Parkinson’s disease. Tab. 1 gives a detailed description of the datasets including the number of instances, features, and classes.
5.2 Algorithms Used for Comparison
A metaheuristic algorithm PSO integrated with K-means with the defined fitness represented in Eq. (10) is used to find the centers of hidden layer neurons for IRBFNN. For the experimental purposes, the dataset is divided into 80:20 ratio i.e., 80% of data is used for training and 20% of data are used for testing. The experimentation is repeated for 30 times and the average value is taken for analyzing the efficiency of IRBFNN. The variations of radial basis function used for comparison of proposed PSO K-means are Whale Optimization Algorithm (WOA) K-means [30] Sine Cosine Algorithm (SCA) K-means [31], Genetic Algorithm K-means [32], and K-means [33].

Maximum number of iterations is set as 100 for all Radial Basis Function except K-Means where the maximum iteration is set as 500. The number of neurons in the input layer is set as number of features in the respective datasets. The number of neurons in the input layer is 23, 754 and 26 for dataset 1, dataset 2 and dataset 3 respectively. The number of neurons in hidden layer is 6 for dataset 1 and dataset 3 and 29 for dataset 2 respectively. The parameter settings for the variations of radial basis functions and the neural network are listed in Tab. 2. The efficiency of the proposed IRBFNN was compared with other Parkinson’s Prediction Algorithms such as Neural Network [34], Support Vector Machine (SVM) with Recursive Feature Selection [35], Fuzzy K-NN [36], PSO–FKNN [37], CNN [38], Minimum Average Maximum Value Singular Value Decomposition (MAMA SVD) with K-NN [39], Octopus Pooling Method (OPS) with K-NN [40], Simple Logistic Greedy Stepwise (SLGS) [41], Leave one subject out (LOSO) validation with K-NN [42] and Fuzzy Lattice Reasoning [43]. Similar research work on health datasets is described in [44–47].
Table 2: Parameter settings of variations of the activation function (radial basis function) and radial basis function neural network

The results acquired for IRBFNN are elaborated in this section. The proposed IRBFNN is compared to assess the outcome of using PSO K-means as radial basis function instead of using K-means in RBFNN, GA K-means in RBFNN-1, SCA K-means in RBFNN-2 and WOA K-means in RBFNN-3. The metrics used to evaluate the proposed mechanism includes:
Accuracy: Accuracy is defined as the correct prediction ratio that the classifier made to the total number of instances. The classifier’s accuracy is represented in Eq. (14).
F score: F Score is the harmonic mean of precision and recall and it gives the measure of incorrectly classified instances by the classifier as specified in Eq. (15).
Recall: Recall is the ratio of correctly identified positive instances to the total number of positive instances specified in Eq. (16).
Positive Predictive Value (PPV): PPV represented in Eq. (17) represents the probability that if the result is abnormal, then it indeed indicates the correct result.
Negative Predictive Value (NPV): NPV represented in Eq. (18) is the probability that if the result is normal, then it truly represents the correct result.
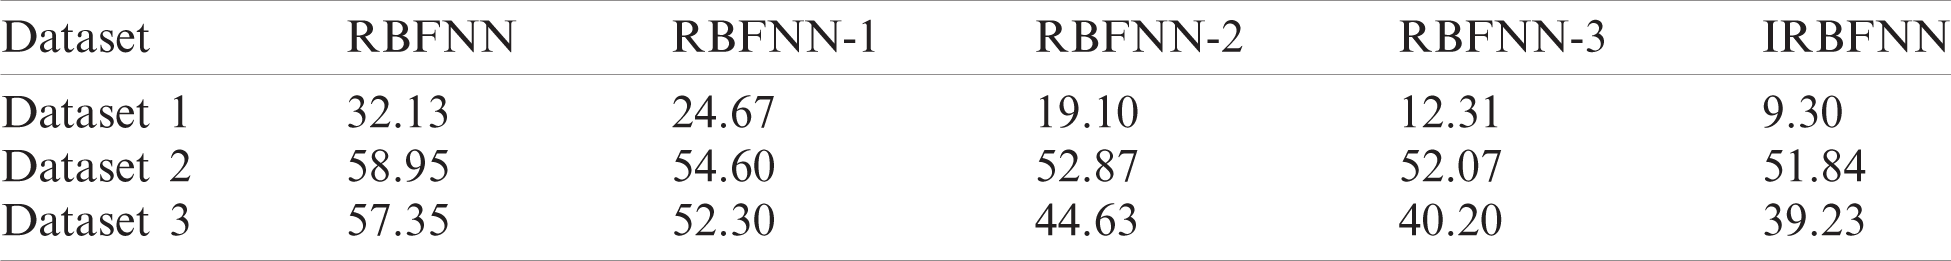
Root Mean Square Error: RMSE represented in Eq. (19) represents the measure of error in predicting the class label.
Fitness: The mean, best and worst fitness values of the radial basis functions are evaluated.
Execution Time: It is defined by the time taken to execute the algorithm to produce the desired outcome of 0 (indication of person is healthy) and 1 (indication of person is suffered from Parkinson’s disease). This also includes the time taken by radial basis function to find the centers of hidden neurons.
5.3.1 Comparison of IRBFNN with RBFNN, RBFNN-1, RBFNN-2, RBFNN-3
Fig. 2 gives the calculated values of average accuracy for the proposed IRBFNN is higher than other variations of RBFNN networks for all three Parkinson’s datasets. The reason behind is that radial basis function of WOA K-means in RBFNN-3 does not explores the search space efficiently [30]. Also, SCA K-means in RBFNN-2 use so many random parameters resulting in the degradation of searching ability [31]. The GA K-means in RBFNN-2 suffers from a problem of premature convergence, and thus the centers of hidden neurons are not optimal enough to increase the classifier accuracy. The RBF K-means is used to find centers of hidden neurons in RBFNN. As K-means is vulnerable to the initial centroid and the centers are not optimal in increasing classifier’s accuracy. For dataset1, IRBFNN achieves 4.9%, 12.04%, 14.71% and 17.3% greater accuracy than RBFNN-3, RBFNN-2, RBFNN-1 and RBFNN respectively. Similarly, for dataset 2, IRBFNN achieves 1.6%, 24.67%, 34.09% and 38.12% greater accuracy than RBFNN-3, RBFNN-2, RBFNN-1 and RBFNN respectively. IRBFNN improves the accuracy by 4.85%, 7.8%, 9.99%, and 20.00% than RBFNN-3, RBFNN-2, RBFNN-1, and RBFNN respectively for dataset 3.
Experimentation results carried out to measure the F-score of IRBFNN, and other variants of RBFNN are shown in Tab. 3. For dataset 1, IRBFNN yields 4.2%, 10.64%, 12.66% and 54.70% greater F-score than RBFNN-3, RBFNN-2, RBFNN-1 and RBFNN respectively. And for dataset 2, F-score is 5.56%, 17.12%, 40.50%, and 28.34% greater for IRBFNN than RBFNN-3, RBFNN-2, RBFNN-1, RBFNN respectively. Similarly, IRBFNN has 3.5%, 10.3%, 15.9% and 28.45% greater F-score than RBFNN-3, RBFNN-2, RBFNN-1 and RBFNN respectively for dataset 3. In all datasets, IRBFNN has a greater F-score because the RBF, PSO K-means explores and exploits in the search space and returns optima centers for hidden neurons of IRBFNN.
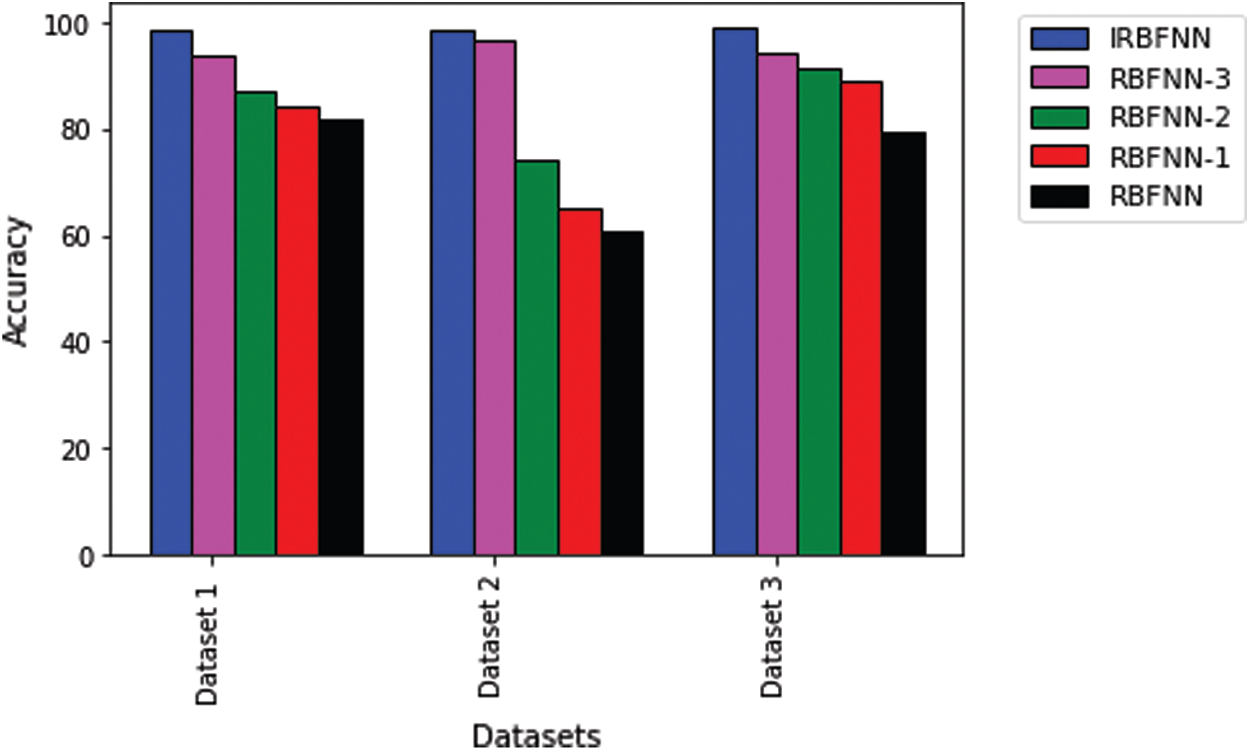
Figure 2: Comparison of accuracy of IRBFNN with variants of RBFNN
Next experiment is carried out to measure the positive predictive value, which is shown in Tab. 4. IRBFNN is superior to all other variants of RBFNN for dataset 1 and dataset 3. RBFNN-3 has a 6.9% higher PPV than IRBFNN for dataset 2. IRBFNN ranks first in maximizing PPV for all datasets except dataset2, for which it comes the second position. These experimental results indicate the proposed activation function PSO K-means is good in finding the centers of hidden neurons and justifies the need for integrating PSO K-means in original RBFNN. Tab. 5 gives the comparison between IRBFNN, RBFNN-3, RBFNN-2, RBFNN-1 and RBFNN based on the correct prediction of negative instances as negative using the metric NPV. Also, Tab. 5 outlines that IRBFNN surpasses the classifier outputs given by additional algorithms for all datasets. IRBFNN improves NPV by 0.11% and 12.06% than RBFNN-3 for dataset3 and dataset2, respectively. The reason behind the success of IRBFNN is that activation function PSO K-means carefully searches the solution space without trapping in local optima to produce centers of hidden neurons. Tab. 6 shows the outcome of applying IRBFNN and other variants of RBFNN on all three Parkinson’s datasets. It also gives clear evidence that IRBFNN has superior performance than other algorithms. For a good classifier, recall should be high so does IRBFNN. IRBFNN improves recall by 3.34%, 8.6%, 9.6% and 11.68% than RBFNN-3, RBFNN-2, RBFNN-1 and RBFNN respectively for dataset 1. For large scale dataset 2, the Recall of IRBFNN is 8.09% higher than RBFNN-3. Fig. 3 presents the results of IRBFNN and other variants of RBFNN for measuring root mean square error. Fig. 3 gives evidence that IRBFNN achieves minimum root mean square error for all datasets. The RMSE of IRBFNN is 0.09829, which is less than RBFNN where the RMSE is 0.56 for dataset 3. In other words, RMSE of IRBFNN is 33.195%, 45.52%, 50.17%, and 58.91% less than RBFNN-3, RBFNN-2, RBFNN-1, and RBFNN, respectively for dataset 3. Fig. 4 represents that IRBFNN predicts the instances more accurately than other variants of RBFNN.
Table 3: Average F-score of RBFNN, RBFNN-1, RBFNN-2, RBFNN-3, IRBFNN

Table 4: Average PPV of RBFNN, RBFNN-1, RBFNN-2, RBFNN-3, IRBFNN
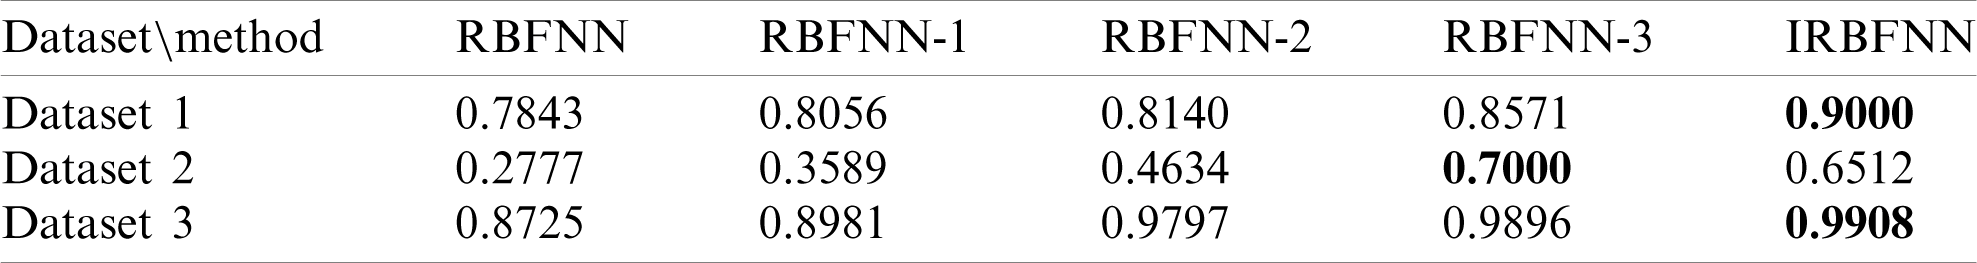
Table 5: Average NPV of RBFNN, RBFNN-1, RBFNN-2, RBFNN-3, IRBFNN

Table 6: Average Recall of RBFNN, RBFNN-1, RBFNN-2, RBFNN-3, IRBFNN

5.3.2 Comparison of Fitness of Radial Basis Function of IRBFNN with RBFNN, RBFNN-1, RBFNN-2, RBFNN-3
The fitness value of various algorithms for all datasets is represented in Fig. 5. radial basis function PSO K-means has better fitness than other RBF’s such as WOA K-means, SCA K-means, GA K-means. IRBFNN, and RBFNN-3, RBFNN-2 has nearly the same worst fitness value but the former achieves 3.34% and 8.69% minimum RMSE than the latter. For dataset 3, IRBFNN has poor worst fitness than RBFNN-1 but the mean fitness of IRBFNN is superior to the latter which gives evidence that IRBFNN is better than all other classifiers mentioned. Fig. 5 represents the fitness value as specified in Eq. (10) for the datasets described in Tab. 1.
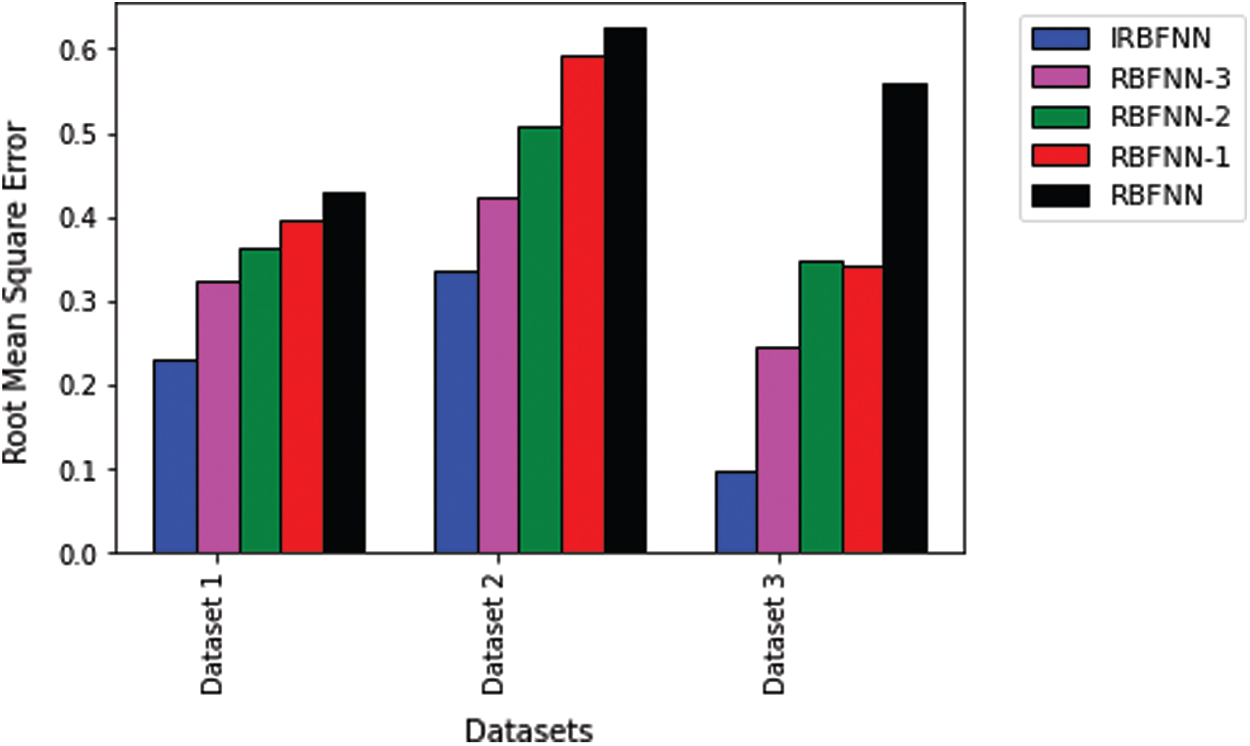
Figure 3: Comparison of root mean square error of IRBFNN with variants of RBFNN
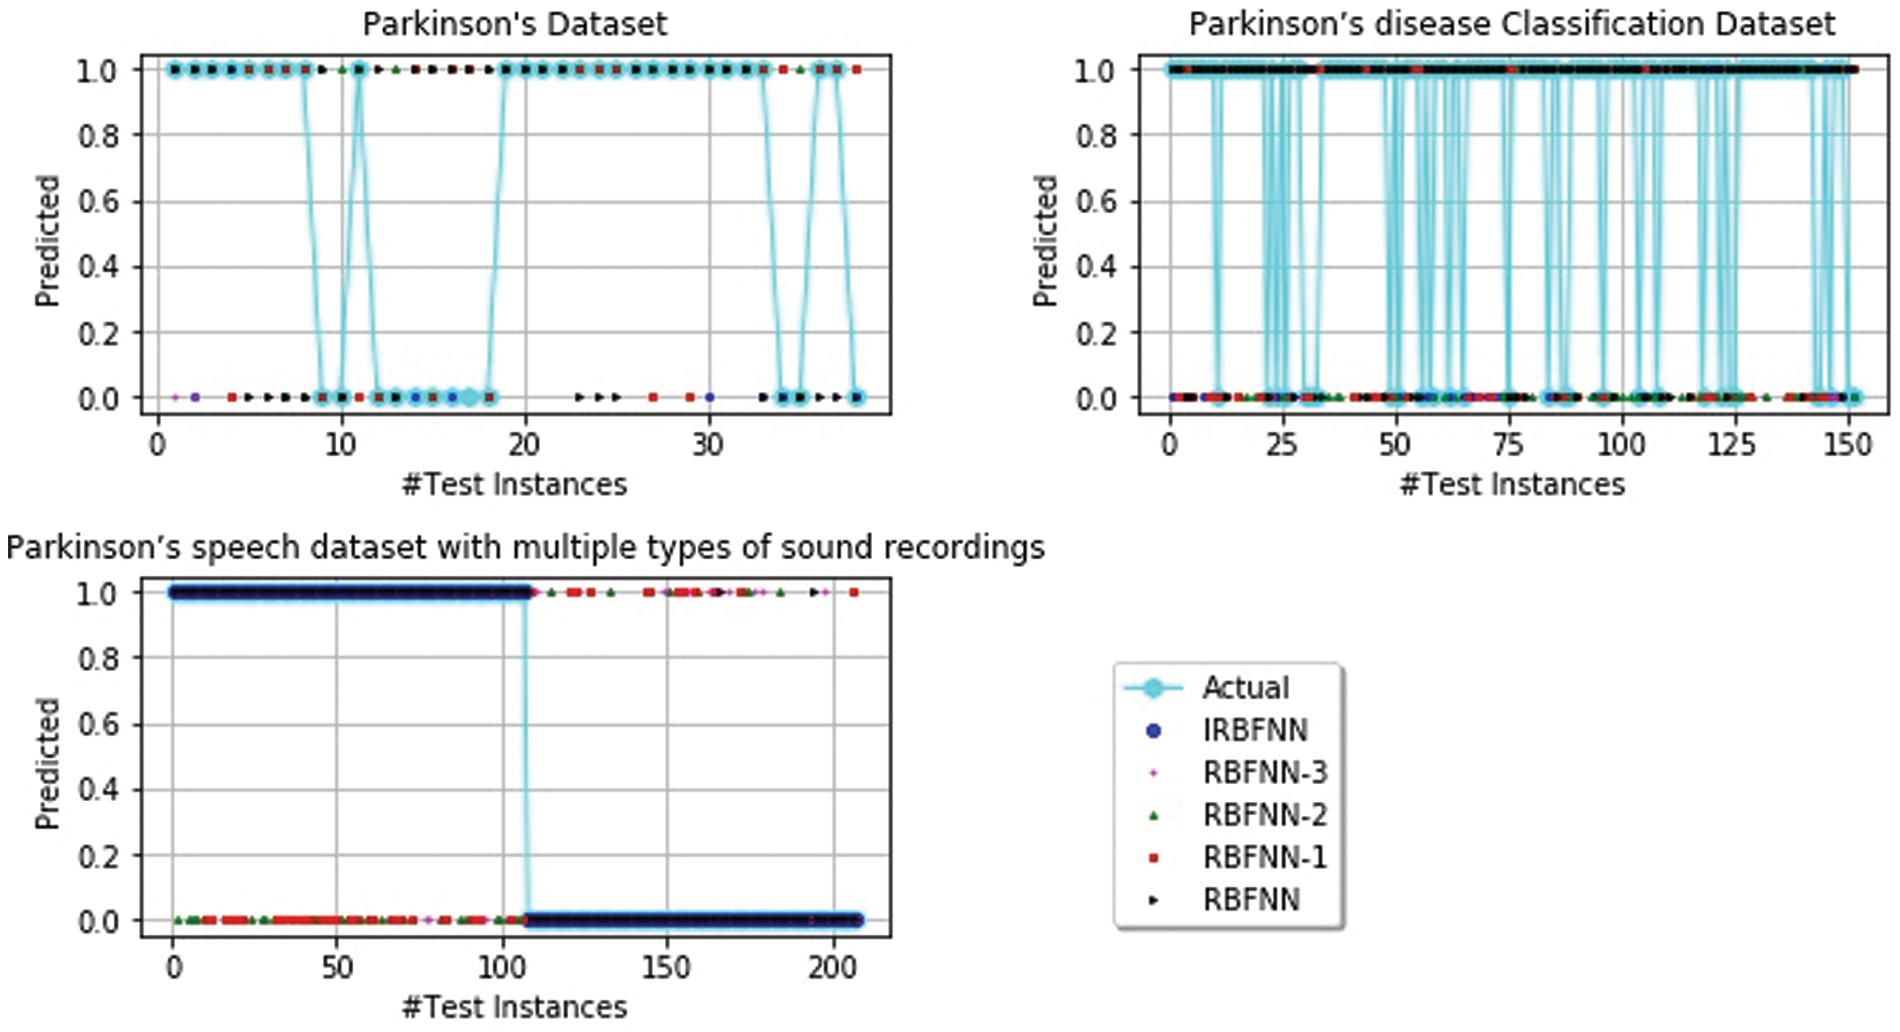
Figure 4: Prediction of parkinson’s disease
5.3.3 Comparison of IRBFNN with other Parkinson’s Disease Prediction Method
The accuracy of IRBFNN is compared with other existing Parkinson’s Prediction Algorithm. For dataset 1, the accuracy was measured as: neural network [34] 0.9290, SVM with recursive feature selection [35] 0.9384, Fuzzy K-NN [36] 0.9579, PSO FKNN [37] 0.9747 and IRBFNN 0.9874. For dataset 2, the computation of accuracy is given as CNN [38] with accuracy 0.8690, MAMASVD + K-NN [39] with accuracy 0.9200, OPS + K-NN [40] with accuracy 0.9841, SLGS [41] with accuracy 0.8871 for males and 0.8715 for females and IRBFNN with accuracy 0.9847. For dataset 3, the measurement of accuracy is given as: LOSO + K-NN [42] with accuracy 0.8250, FLR [43] with accuracy of 1.0000 and IRBFNN with an accuracy of 0.9903. For dataset 3, IRBFNN ranks second while FLR obtained first rank. In other words, the FLR improves accuracy by 0.0962% than IRBFNN. It is observed that IRBFNN is superior to other methods for dataset 1 and dataset 2 from experimental results.
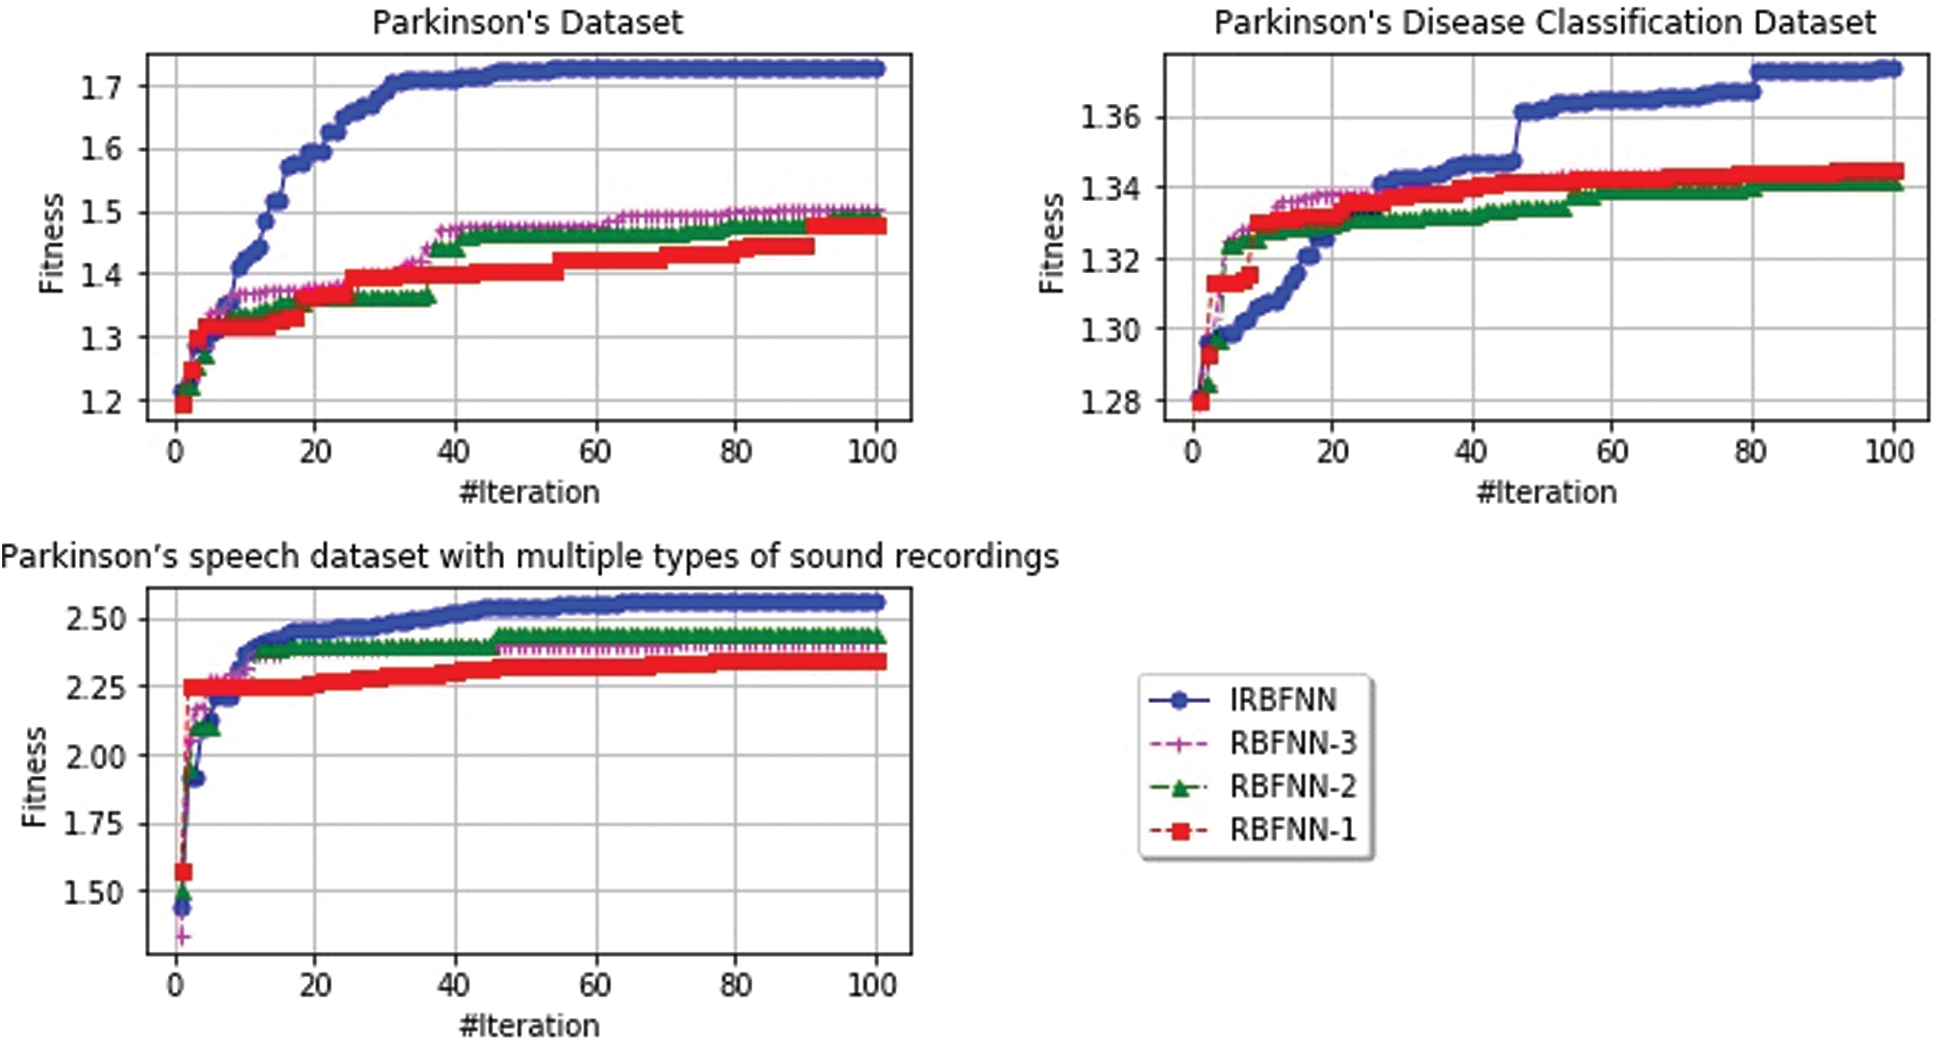
Figure 5: Rate of convergence for different radial basis function of IRBFNN, RBFNN-3, RBFNN-2, RBFNN-1
5.3.4 Analyzing Computational Time
The computational complexity of the proposed IRBFNN is measured using Big-Oh
Table 7: Computational complexity of proposed IRBFNN

Table 8: Average execution time in seconds
5.3.5 Comparison of IRBFNN with other Machine Learning Algorithms
From Tab. 9, it is evident that for all the datasets, IRBFNN achieves maximum accuracy than other traditional algorithms. The accuracy of IRBFNN is improved by 9.382%, 14.621%, 10.266%, and 18.875% than SVM, Random Forest, Decision Tree, and K-means for dataset 1. For dataset 2 IRBFNN improves accuracy 17.387% greater than Decision trees. Similarly, for dataset 3, the performance of IRBFNN is improved by 17.08% than SVM. But the time taken by IRBFNN is more than traditional machine learning algorithms showing there is a trade-off between accuracy and time taken. Tab. 10 shows the time taken by various algorithms for predicting the Parkinson’s disease.
Table 9: Average classification accuracy for five classifiers on Parkinson’s dataset

Table 10: Average time taken between various machine learning classifiers and IRBFNN in seconds

The inferences made from the experiment results were listed as:
• Improved radial basis function neural network maximizes accuracy together with minimizing root mean square error
• The use of PSO K-means with the fitness of maximizing Intercluster distance and minimizing intracluster distance finds optimal cluster centers, which is used in hidden neurons of IRBFNN
• Experiments performed to measure the positive predictive value, and negative predictive value also signifies the introduction of PSO K-means radial basis function improves the performance in identifying the positive and negative instances
• The execution time of the proposed IRBFNN is higher than conventional machine learning algorithms but with the increase in accuracy
• The introduction of PSO K-means improves the accuracy of IRBFNN by 3.83%, 14.85%, 19.57% and 25.15% than RBFNN-3, RBFNN-2, RBFNN-1 and RBFNN, respectively.
Finally, through rigorous analysis, it has been inferred that the IRBFNN was designed and experimented successfully to predict Parkinson’s disease. Besides, the proposed network reveals that finding the efficient radial basis function is essential for accurate prediction. The presented IRBFNN best solves the given problem of predicting Parkinson’s disease by efficiently finding the centers of hidden neurons for designing the radial basis function of IRBFNN. Thus, to obtain the good performance, metaheuristic algorithms are used to find optimal values of these parameters, leading to minimizing error and maximizing accuracy. PSO K-means’ performance is compared with other metaheuristic way of finding centers in designing radial basis function neural network and the proposed IRBFNN shows that PSO K-means choose the optimal center by doing good level of exploration and exploitation by avoiding struck in local optima when predicting Parkinson’s disease. The key findings of the paper are listed as:
• The problem of finding the centers of the hidden neurons is solved by using PSO with K-means, which maximizes the accuracy of the presented IRBFN
• The integration of PSO with K-means diminishes the problems caused by the initial random centroid of conventional K-means by doing a good level of exploration and exploitation
• The fitness value of PSO takes Intra-cluster distance, Inter-cluster distance, which produces optimal cluster centers
The use of PSO K-means in finding the hidden neurons’ centers maximize the accuracy, F-score, positive predictive value, negative predictive value, recall and minimizes the root mean square error. In future work, a novel feature selector algorithm will be integrated before the analytics process for further enhancing the accuracy of prediction.
Funding Statement: The authors received no specific funding for this study.
Conflicts of Interest: The authors declare that they have no conflicts of interest to report regarding the present study.
1. T. Lebouvier, T. Chaumette, S. Paillusson, C. Duyckaerts, S. Bruley des Varannes et al., “The second brain and parkinson’s disease,” European Journal of Neuroscience, vol. 30, no. 5, pp. 735–741, 2009. [Google Scholar]
2. C. Shi, Z. Zheng, Q. Wang, C. Wang, D. Zhang et al., “Exploring the effects of genetic variants on clinical profiles of parkinson’s disease assessed by the unified parkinson’s disease rating scale and the hoehn-yahr stage,” PloS one, vol. 11, no. 6, pp. 1–11, 2016. [Google Scholar]
3. J. Jankovic, “Parkinson’s disease: Clinical features and diagnosis,” Journal of Neurology, Neurosurgery & Psychiatry, vol. 79, no. 4, pp. 368–376, 2008. [Google Scholar]
4. M. Little, P. McSharry, E. Hunter, J. Spielman and L. Ramig, “Suitability of dysphonia measurements for telemonitoring of parkinson’s disease,” IEEE Trans. Biomedical Engineering, vol. 56, no. 4, pp. 1015–1022, 2009. [Google Scholar]
5. V. L. Dawson and T. M. Dawson, “Promising disease-modifying therapies for parkinson’s disease,” Science Translational Medicine, vol. 11, no. 520, pp. 1–4, 2019. [Google Scholar]
6. A. Antonini, I. U. Isaias, M. Canesi, M. Zibetti, F. Mancini et al., “Duodenal levodopa infusion for advanced parkinson’s disease: 12-month treatment outcome,” Movement Disorders, vol. 22, no. 8, pp. 1145–1149, 2007. [Google Scholar]
7. J. M. Savitt, V. L. Dawson and T. M. Dawson, “Diagnosis and treatment of parkinson disease: Molecules to medicine,” Journal of Clinical Investigation, vol. 116, no. 7, pp. 1744–1754, 2006. [Google Scholar]
8. B. E. Sakar, M. E. Isenkul, C. O. Sakar, A. Sertbas, F. Gurgen et al., “Collection and analysis of a parkinson speech dataset with multiple types of sound recordings,” IEEE Journal of Biomedical and Health Informatics, vol. 17, no. 4, pp. 828–834, 2013. [Google Scholar]
9. C. G. Goetz, W. Poewe, O. Rascol, C. Sampaio, G. T. Stebbins et al., “Movement disorder society task force report on the hoehn and yahr staging scale: Status and recommendations the movement disorder society task force on rating scales for parkinson’s disease,” Movement Disorders, vol. 19, no. 9, pp. 1020–1028, 2004. [Google Scholar]
10. R. Ramakrishnan, M. S. Ram, P. Pabitha and R. S. Moorthy, “Freezing of gait prediction in parkinson’s patients using neural network,” in Intelligent Computing and Control Systems. 2nd Int. Conf., Madurai, India: IEEE, pp. 61–66, 2018. [Google Scholar]
11. T. Khalil, S. Khalid and A. M. Syed, “Review of machine learning techniques for glaucoma detection and prediction,” in Science and Information Conf. 2014, London, UK: IEEE, pp. 438–442, 2014. [Google Scholar]
12. S. S.Pan, K. Warwick, J. Stein, M. N. Gasson, S. Y. Wang et al., “Prediction of parkinson’s disease tremor onset using artificial neural networks,” in Int. Conf.: Biomedical Engineering. Proc. of the Fifth IASTED, Innsbruck, Austria: ACTA Press, pp. 341–345, 2007. [Google Scholar]
13. Y. Wu, H. Wang, B. Zhang and K. L. Du, “Using radial basis function networks for function approximation and classification,” ISRN Applied Mathematics, vol. 12, pp. 1–34, 2012. [Google Scholar]
14. J. S. Bae, S. K. Oh and H. K. Kim, “Design of fingerprints identification based on RBFNN using image processing techniques,” Transactions of the Korean Institute of Electrical Engineers, vol. 65, no. 6, pp. 1060–1069, 2016. [Google Scholar]
15. H. R. Baghaee, M. Mirsalim, G. B. Gharehpetian and H. A. Talebi, “Application of RBF neural networks and unscented transformation in probabilistic power-flow of microgrids including correlated wind/PV units and plug-in hybrid electric vehicles,” Simulation Modelling Practice and Theory, vol. 72, pp. 51–68, 2017. [Google Scholar]
16. B. Shi, L. Yu-xia, Y. Xin-Hua, Y. Wang, L. Peng et al., “A modified particle swarm optimization and radial basis function neural network hybrid algorithm model and its application,” in WRI Global Congress on Intelligent Systems, Xiamen, China: IEEE, pp. 134–138, 2009. [Google Scholar]
17. J. Lu, H. Hu and Y. Bai, “Generalized radial basis function neural network based on an improved dynamic particle swarm optimization and AdaBoost algorithm,” Neurocomputing, vol. 152, pp. 305–315, 2015. [Google Scholar]
18. P. Parameswaran and R. Shenbaga Moorthy, “Secure pervasive healthcare system and diabetes prediction using heuristic algorithm,” in Intelligent Pervasive Computing Systems for Smarter Healthcare. 1\textrm{st} ed., vol. 1. Hoboken, New Jersey, USA: Wiley, Chapter No. 8, pp. 179–205, 2019. [Online]. Available: https://onlinelibrary.wiley.com/doi/abs/10.1002/9781119439004.ch8. [Google Scholar]
19. D. Dua and C. Graff, UCI Machine Learning Repository. Irvine, CA: University of California, School of Information and Computer Science, 2019. [Online]. Available: http://archive.ics.uci.edu/ml. [Google Scholar]
20. N. Naghavi and E. Wade, “Prediction of freezing of gait in parkinson’s disease using statistical inference and lower-limb acceleration data,” IEEE Transactions on Neural Systems and Rehabilitation Engineering, vol. 27, no. 5, pp. 947–955, 2019. [Google Scholar]
21. J. Prince, F. Andreotti and M. De Vos, “Multi-source ensemble learning for the remote prediction of parkinson’s disease in the presence of source-wise missing data,” IEEE Transactions on Biomedical Engineering, vol. 66, no. 5, pp. 1402–1411, 2018. [Google Scholar]
22. J. Shi, Z. Xue, Y. Dai, B. Peng, Y. Dong et al., “Cascaded multi-column RVFL+ classifier for single-modal neuroimaging-based diagnosis of parkinson’s disease,” IEEE Transactions on Biomedical Engineering, vol. 66, no. 8, pp. 2362–2371, 2018. [Google Scholar]
23. Y. Zhang, W. Yan, Y. Yao, J. J. Bint Ahmed, Y. Tan et al., “Prediction of freezing of gait in patients with parkinson’s disease by identifying impaired gait patterns,” IEEE Transactions on Neural Systems and Rehabilitation Engineering, vol. 28, no. 3, pp. 591–600, 2020. [Google Scholar]
24. H. Yoon and J. Li, “A novel positive transfer learning approach for telemonitoring of parkinson’s disease,” IEEE Transactions on Automation Science and Engineering, vol. 16, no. 1, pp. 180–191, 2018. [Google Scholar]
25. A. A. Handojoseno, J. M. Shine, T. N. Nguyen, Y. Tran and S. J. Lewis, “Analysis and prediction of the freezing of gait using EEG brain dynamics,” IEEE Transactions on Neural Systems and Rehabilitation Engineering, vol. 23, no. 5, pp. 887–896, 2014. [Google Scholar]
26. D. Wu, K. Warwick, Z. Ma, J. G. Burgess, S. Pan et al., “Prediction of parkinson’s disease tremor onset using radial basis function neural networks,” Expert Systems with Applications, vol. 37, no. 4, pp. 2923–2928, 2010. [Google Scholar]
27. A. K. Tiwari, “Machine learning based approaches for prediction of parkinson’s disease,” Mach. Learn. Appl., vol. 3, no. 2, pp. 33–39, 2016. [Google Scholar]
28. A. Tsanas, M. A. Little, P. E. McSharry, J. Spielman and L. O. Ramig, “Novel speech signal processing algorithms for high-accuracy classification of parkinson’s disease,” IEEE Transactions on Biomedical Engineering, vol. 59, no. 5, pp. 1264–1271, 2012. [Google Scholar]
29. H. Lei, Z. Huang, F. Zhou, A. Elazab, E. L. Tan et al., “Parkinson’s disease diagnosis via joint learning from multiple modalities and relations,” IEEE Journal of Biomedical and Health Informatics, vol. 23, no. 4, pp. 1437–1449, 2018. [Google Scholar]
30. J. Nasiri and F. M. Khiyabani, “A whale optimization algorithm (WOA) approach for clustering,” Cogent Mathematics & Statistics, vol. 5, no. 1, pp. 1–13, 2018. [Google Scholar]
31. V. Kumar and D. Kumar, “Data clustering using sine cosine algorithm: Data clustering using SCA,” in Handbook of Research on Machine Learning Innovations and Trends. 1st ed., vol. 1, Hershey, Pennsylvania, USA: IGI Global, pp.715–726, 2017. [Online]. Available: https://www.igi-global.com/chapter/data-clustering-using-sine-cosine-algorithm/180969. [Google Scholar]
32. U. Maulik and S. Bandyopadhyay, “Genetic algorithm-based clustering technique,” Pattern Recognition, vol. 33, no. 9, pp. 1455–1465, 2000. [Google Scholar]
33. A. K. Jain, “Data clustering: 50 years beyond K-means,” Pattern Recognition Letters, vol. 31, no. 8, pp. 651–666, 2010. [Google Scholar]
34. R. Das, “A comparison of multiple classification methods for diagnosis of parkinson disease,” Expert Systems with Applications, vol. 37, no. 2, pp. 1568–1572, 2010. [Google Scholar]
35. Z. K. Senturk, “Early diagnosis of parkinson’s disease using machine learning algorithms,” Medical Hypotheses, vol. 138, pp. 1–5, 2020. [Google Scholar]
36. H. L. Chen, C. C. Huang, Y. X.G., X. Xu, X. Sun X et al., “An efficient diagnosis system for detection of parkinson’s disease using fuzzy k-nearest neighbor approach,” Expert Systems with Applications, vol. 40, no. 1, pp. 263–271, 2013. [Google Scholar]
37. G. E. Tsekouras and J. Tsimikas, “On training RBF neural networks using input-output fuzzy clustering and particle swarm optimization,” Fuzzy Sets and Systems, vol. 221, pp. 65–89, 2013. [Google Scholar]
38. H. Gunduz, “Deep learning-based parkinson’s disease classification using vocal feature sets,” IEEE Access, vol. 7, pp. 115540–115551, 2019. [Google Scholar]
39. T. Tuncer, S. Dogan and U. R. Acharya, “Automated detection of parkinson’s disease using minimum average maximum tree and singular value decomposition method with vowels,” Biocybernetics and Biomedical Engineering, vol. 40, no. 1, pp. 211–220, 2020. [Google Scholar]
40. T. Tuncer and S. Dogan, “A novel octopus based parkinson’s disease and gender recognition method using vowels,” Applied Acoustics, vol. 155, pp. 75–83, 2019. [Google Scholar]
41. Ş. S. Yücelbaş, “Simple logistic hybrid system based on greedy stepwise algorithm for feature analysis to diagnose parkinson’s disease according to gender,” Arabian Journal for Science and Engineering, vol. 45, no. 3, pp. 2001–2016, 2020. [Google Scholar]
42. A. Benba, A. Jilbab and A. Hammouch, “Voice analysis for detecting patients with parkinson’s disease using the hybridization of the best acoustic features,” International Journal on Electrical Engineering and Informatics, vol. 8, no. 1, pp. 108–116, 2016. [Google Scholar]
43. N. K. Dastjerd, O. C. Sert, T. Ozyer and R. Alhajj, “Fuzzy classification methods based diagnosis of parkinson’s disease from speech test cases,” Current Aging Science, vol. 12, no. 2, pp. 100–120, 2019. [Google Scholar]
44. T. R. Gadekallu, N. Khare, S. Bhattacharya, S. Singh, P. K. R. Maddikunta et al., “Deep neural networks to predict diabetic retinopathy,” Journal of Ambient Intelligence and Humanized Computing, vol. 57, no. 13, pp. 1–14, 2020. [Google Scholar]
G. T. Reddy, S. Bhattacharya, S. S. Ramakrishnan, C. L. Chowdhary, S. Hakak et al., “An ensemble based machine learning model for diabetic retinopathy classification,” in Int. Conf. on Emerging Trends in Information Technology and Engineering, Vellore, India: IEEE, pp. 1–6, 2020. [Google Scholar]
N. Deepa, B. Prabadevi, P. K. Maddikunta, T. R. Gadekallu, T. Baker et al., “An AI-based intelligent system for healthcare analysis using ridge-adaline stochastic gradient descent classifier,” Journal of Supercomputing, vol. 77, no. 2, pp. 1998–2017, 2021. [Google Scholar]
47. S. Bhattacharya, P. K. R. Maddikunta, Q. V. Pham, T. R. Gadekallu, C. L. Chowdhary et al., “Deep learning and medical image processing for coronavirus (COVID-19) pandemic: A survey,” Sustainable Cities and Society, vol. 65, no. 13, pp. 1–18, 2021. [Google Scholar]
 | This work is licensed under a Creative Commons Attribution 4.0 International License, which permits unrestricted use, distribution, and reproduction in any medium, provided the original work is properly cited. |