DOI:10.32604/cmc.2021.016001
| Computers, Materials & Continua DOI:10.32604/cmc.2021.016001 | |
| Article |
Extended Forgery Detection Framework for COVID-19 Medical Data Using Convolutional Neural Network
1Department of Computer Science, Shah Abdul Latif University, Khairpur, 66020, Sindh, Pakistan
2National College of Business Administration & Economics, Lahore, 54000, Pakistan
3School of Computer Science and Engineering, SCE, Taylor’s University, Malaysia
4Department of Information Systems, Faculty of Computer Science & Information Technology, Universiti Malaya, Malaysia
5Department of Information Technology, College of Computer and Information Technology, Taif University, Taif, 21944, Saudi Arabia
6Department of Computer Science, College of Engineering & Computing Sciences, New York Institute of Technology, Vancouver, Canada
7The Computer Research Institute of Montreal, Quebec, Canada
*Corresponding Author: N. Z. Jhanjhi. Email: noorzaman.jhanjhi@taylors.edu.my
Received: 17 December 2020; Accepted: 15 March 2021
Abstract: Medical data tampering has become one of the main challenges in the field of secure-aware medical data processing. Forgery of normal patients’ medical data to present them as COVID-19 patients is an illegitimate action that has been carried out in different ways recently. Therefore, the integrity of these data can be questionable. Forgery detection is a method of detecting an anomaly in manipulated forged data. An appropriate number of features are needed to identify an anomaly as either forged or non-forged data in order to find distortion or tampering in the original data. Convolutional neural networks (CNNs) have contributed a major breakthrough in this type of detection. There has been much interest from both the clinicians and the AI community in the possibility of widespread usage of artificial neural networks for quick diagnosis using medical data for early COVID-19 patient screening. The purpose of this paper is to detect forgery in COVID-19 medical data by using CNN in the error level analysis (ELA) by verifying the noise pattern in the data. The proposed improved ELA method is evaluated using a type of data splicing forgery and sigmoid and ReLU phenomenon schemes. The proposed method is verified by manipulating COVID-19 data using different types of forgeries and then applying the proposed CNN model to the data to detect the data tampering. The results show that the accuracy of the proposed CNN model on the test COVID-19 data is approximately 92%.
Keywords: Data security; data privacy; medical-data forgery; COVID-19; convolutional neural network; machine learning; deep learning
Forging or manipulating means changing the originality of a certain element, data, or even an entity. Digital data processing has undermined the trust in digital photographs due to the development of subtler methods of forgery that present an ever-increasing threat to the credibility and accuracy of photographs. In recent years, great effort has been devoted to the development of new methods for fighting against multiple data forgery attacks [1]. Tampering of photographs began in the early 1840s. Hippolyte Bayard was the first person who documented a fake image as recorded in history. Later on, it was found that it had been altered. In the early computer age, data were modified by using paint, ink airbrushing, or scratching Polaroid. Digital data tampering has been dated from the late 20th century. Currently, digital images can be easily modified by low-cost software [2]. However, digital data denote one of the most common sources of knowledge over the internet. In recent times, digital data alteration has become simple due to fast digital software growth, and using different tools, data can be easily altered [3,4]. When the use of digital data increases, new software tools for manipulating photos and photographs are being implemented. These tools are used to make forged data, where objects can be added or deleted to look like real data [5]. Therefore, checking the validity of available digital content in the form of images has become crucial. Picture forensic is an evolving field for digital image quality and reliability testing [6]. It is very important to maintain the integrity of digital images because they can be used for different purposes, in the court of law, medical field, newspapers, magazines, and many other fields [4]. The methods for manipulating medical data can be roughly divided into two categories: active methods and passive methods [7]. Active methods are used for the protection of digital data that include digital watermarking and digital signatures. In these methods, during data pre-processing, a watermark is embedded into data, or a signature is created during the data creation phase. In contrast, using passive methods to modify data is a great challenge in the field of digital data processing. Passive methods include data retouching, copy move, and data splicing. Unlike active methods, in passive methods, there is no data pre-processing. Tamper detection using passive methods is to analyze a raw image based on different semantics and statistics of the image to localize the tampering. The classification of image modifying techniques [8–11] is illustrated in Fig. 1.
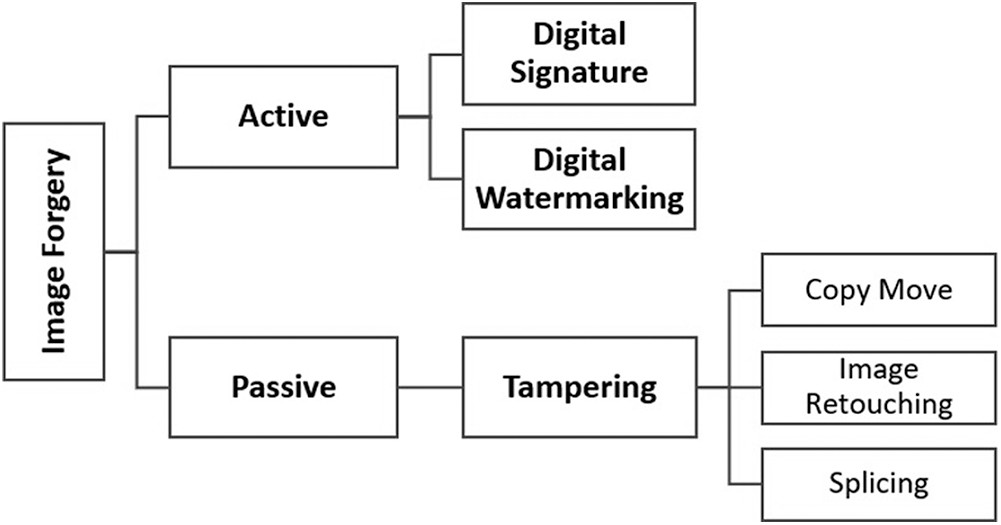
Figure 1: Types of data forgeries
Several passive methods have been used to modify digital images in telemedicine, such as Copy Move, Image Splicing, and Image Retouching. Health is a significant factor that should treated with great attention and protection [12]. In recent years, telemedicine has gained high popularity due to the fact that medical images can be sent across the internet to communicate patient’s restorative state, which makes medical analysis simple for medical staff. However, threats and image manipulations have become a serious challenge to the medical industry [13]. Due to the wide accessibility of the internet, there is a high chance that the contents of a medical image may be corrupted [14]. In telemedicine, a medical image can be altered over the internet during the transmission process and can be misperceived by a physician if it loses its integrity. Commonly, forgery in medical data cannot be perceived by the naked eye [15]. Copy move is the most popular technique used to tamper the original image in which a digital image is copied from one region and pasted on different locations [16]. Image splicing is also a common method for the detection of tampering in digital images, which represents merging two or more images to form a new one that has a significant difference from the original one [17]. Image Retouching is another technique to forge an image in which image features are enhanced or reduced to a certain extent. The detection of retouching is difficult as no radical change is found in an image. The lighting is also frequently applied to splice image that contains different lighting conditions, and it is very tough for a forged image to meet exact light conditions [2,18].
Numerous classifiers have been used to detect forgeries in digital images, including the SVM, the least square support vector machine (LS-SVM), and convolutional neural networks (CNNs). The SVM classifier has similar types of functions to neural networks, and in SVM, textures and image pixels are evaluated and analyzed from images. The SVM classifier can be implemented to classify images as forged or genuine. The LS-SVM is a least square version of SVM, which includes a set of related supervised learning methods for pattern recognition and data analysis that are further used for classification and regression analysis [19]. The CNNs have a variety of applications in video recognition, natural language processing, and system recommenders. The CNNs can be applied to medical images to evaluate a forgery that is not visible by the naked eye. The main objective of CNN is to detect active forgery, i.e., digital watermarked images or images that contain signatures [20]. Many CNN variants have been proposed to analyze forgeries in images. However, in this work, CNN is combined with the error level analysis (ELA) for the detection of forged images. It should be noted that whenever an image is manipulated by editing, splicing, or even watermarking, a noise pattern can be observed in the image, which has a different representation in the noise chart. In the proposed method, first, the noise attributes of an unknown image are obtained, and then these attributes are fed to the input of the CNN classifier, which further analyzes the noise pattern and evaluates whether the input image has been tampered.
The rest of the paper is organized as follows. Section 2 presents related work. Section 3 describes the operations of the proposed system. Section 4 presents the results of the research work. Finally, Section 5 concludes the paper.
Medical data tampering and localization techniques have been developed and identified by hundreds of researchers focusing on splice forgeries, in-painting, copy-move forgeries, image-wise adjustment (cropping, histogram equalization, and resizing), and many other applications. In [15], a passive image technique for the detection of a tampered region in medical images was proposed. This method gains the advantage of the local binary pattern rotational invariant (LBPROT) so that it can extract the key points more successfully. The classifier used in that work was the Scale Invariant Feature Transform (SIFT), and it detected tampered areas by matching the key points. In [21], a solution based on the segmentation was proposed, where a medical image was segmented into two parts, Region of Interest (ROI), and Region Of Not Interest (RONI). The proposed scheme was used to localize forgeries, detect tempering, and recover images and hidden data. The integer Wavelet transform (IWT) was utilized to generate the recovery information of ROI. In [9], the authors have explained that in a medical image, the ROI represents the area that is marked by the physicians and is represented in the rectangular form. This rectangle is defined by its vertical coordinates. It should be noted that in a medical image, more than one ROI can be present. The watermarking technique was combined with the IWT method to achieve the objective of identification of ROI and RONI. In [20], a forensic scheme, which identifies contextual anomalies in a target image to identify image manipulation when tampered, was proposed. This scheme uses complex-valued CNN (CV-CNN) that detects a contextual abnormality. The CV-CNN was used to detect a forgery in images marked with medical watermarks.
A new approach proposed in [22] uses CNN to monitor activities to help children, and is applicable for real-time applications; 183,600 data samples were used to train CNN to classify ten physical activities, including slow walk, brisk walk, and going upstairs. The overall accuracy was 81.2%. The results were compared by the results obtained by the SVM, whose overall accuracy was 64.8%. Different block-based and key point methods were studied in [17]. The method proposed in [17] was based on the discrete cosine transformation (DCT), and an improvement in this technique was accomplished by using an octagonal block to reduce the number of matching features. Besides, enhancing the detection of precision in terms of dimensional reduction was compared to previously proposed solutions, and it was found that the previous work could determine about 79% of the quantified DCT coefficients on each image block, while the proposed approach reflected about 85% of the quantified DCT coefficients. Thus, the recovery of about 6% more features was achieved by using the octagonal block.
In [23], the focus was on splicing forgery detection since it has been one of the most commonly used techniques for image manipulation. In the proposed scheme, the Markov features in both discrete Wavelet transform (DWT) and local binary pattern (LBP) domains were retrieved and integrated for image splicing detection. The effectiveness of the proposed scheme was evaluated on the basis of six benchmark datasets, i.e., DVMM, CASIA v2.0, Columbia CASIA v1.0, IFS-TC, and DSO-1 datasets. In addition, the SVM classifier was trained to identify the images as manipulated or real. Based on different performance metrics, including precision, sensitivity, and specificity, the efficacy of the proposed scheme was assessed. The results indicated the enhanced precision of the proposed scheme of 99.69%, 99.76%, 97.80%, 98.61%, 96.90%, and 92.50% on DVMM, CASIA v2.0, Columbia CASIA v1.0, IFS-TC, and DSO-1 datasets, respectively. In [24], hyperspectral document images were studied for forgery detection, and the proposed approach could effectively distinguish various ink forms and achieve the overall accuracies of 98.2% and 88% for blue and black inks, respectively. This is the highest achieved accuracy among the latest ink mismatch detection techniques on the UWA writing ink hyperspectral images (WIHSI) database that can distinguish in a hyperspectral document picture between the highest number of inks mixed in unbalanced proportions. In addition, this work provided a detailed discussion on the selection of a suitable CNN architecture and classification performance through the comparison with the previous ink mismatch detection methods. This study opens a new door for research on automatic forgery detection in hyperspectral document images using deep learning. In [25], an approach based on block processing and feature extraction from the transformations of blocks for copy-move forgery detection was introduced, and CNN was used for forgery detection. Using serial pairs of convolution and pooling layers, the feature extraction was carried out, and then the classification between the original and tampered images was performed. Furthermore, a comparative analysis of ten cases using the CNN-based method to detect the manipulated image was conducted. A method for forgery detection based on DWT and DCT, which relies on the feature reduction, was proposed in [26]. After using the DWT to divide an image into blocks, the DCT was applied on the obtained individual blocks, and on the basis of correlation coefficients, the blocks were compared. In order to validate the detection process, a mask-based tampering approach was also used as part of the experiments.
2.1 Error Level Analysis (ELA)
The ELA is a technique used to discover forgery in digital images. The ELA represents a compression algorithm used for the detection of image forgeries. The image compression degree depends on the quality and content of an image. In this work, the ELA is used to detect tampering in images. The ELA is capable of identifying manipulation in images even with unchanged regions. The error produced by the ELA technique helps to detect the manipulation in images [27,28].
2.2 Convolutional Neural Network (CNN)
In this work, CNN is used for feature extraction since it supports multiple training epochs and has stable and high precision, recall, and many input features. Many image tampering and localization techniques focusing on splice forgeries, including in-painting, copy-move forgeries, image-wise adjustment (cropping, histogram equalization, and resizing), have been developed using CNNs. CNNs consist of non-linear neurons with complex activation functions, and they are inspired by the biology of human vision. For content authentication at times of conflict, watermarking is commonly used. Data authentication can be conducted in the spatial or spectrum domain [29]. To secure images, encryption and steganography can also be used [15,30].
In this study, analysis and interpretation of data categories (forged or not) are achieved by conducting many iterative phases of developing and fine-tuning the dataset by using CNN. The proposed method involves five main phases. In the first phase, a structured and fine-tuned COVID-19 dataset from GitHub (www.github.com) is obtained and pre-processed. In the second phase, histograms are prepared using all the images of both categories (either forged or not). The third phase constructs a single CSV file containing all the histograms of images from both primary categories. After a successful merging, all the data points in a single file, the Python script was written in the fourth phase to classify the images between two primary categories. The CNN was to classify the images; in this phase, the weights, number of epochs, and histogram points were kept unchanged. In the last phase, 255 histogram data points of all images of both categories were normalized, and the epoch number was reduced from 100 to 50. The CNN weights were updated according to the performance threshold set in the performance monitor of CNN. The state-of-the-art performance regarding the accuracy of 92% was achieved. The histogram of ELA of the original and tampered images is shown in Fig. 2, and the block diagram of the proposed system is depicted in Fig. 3.
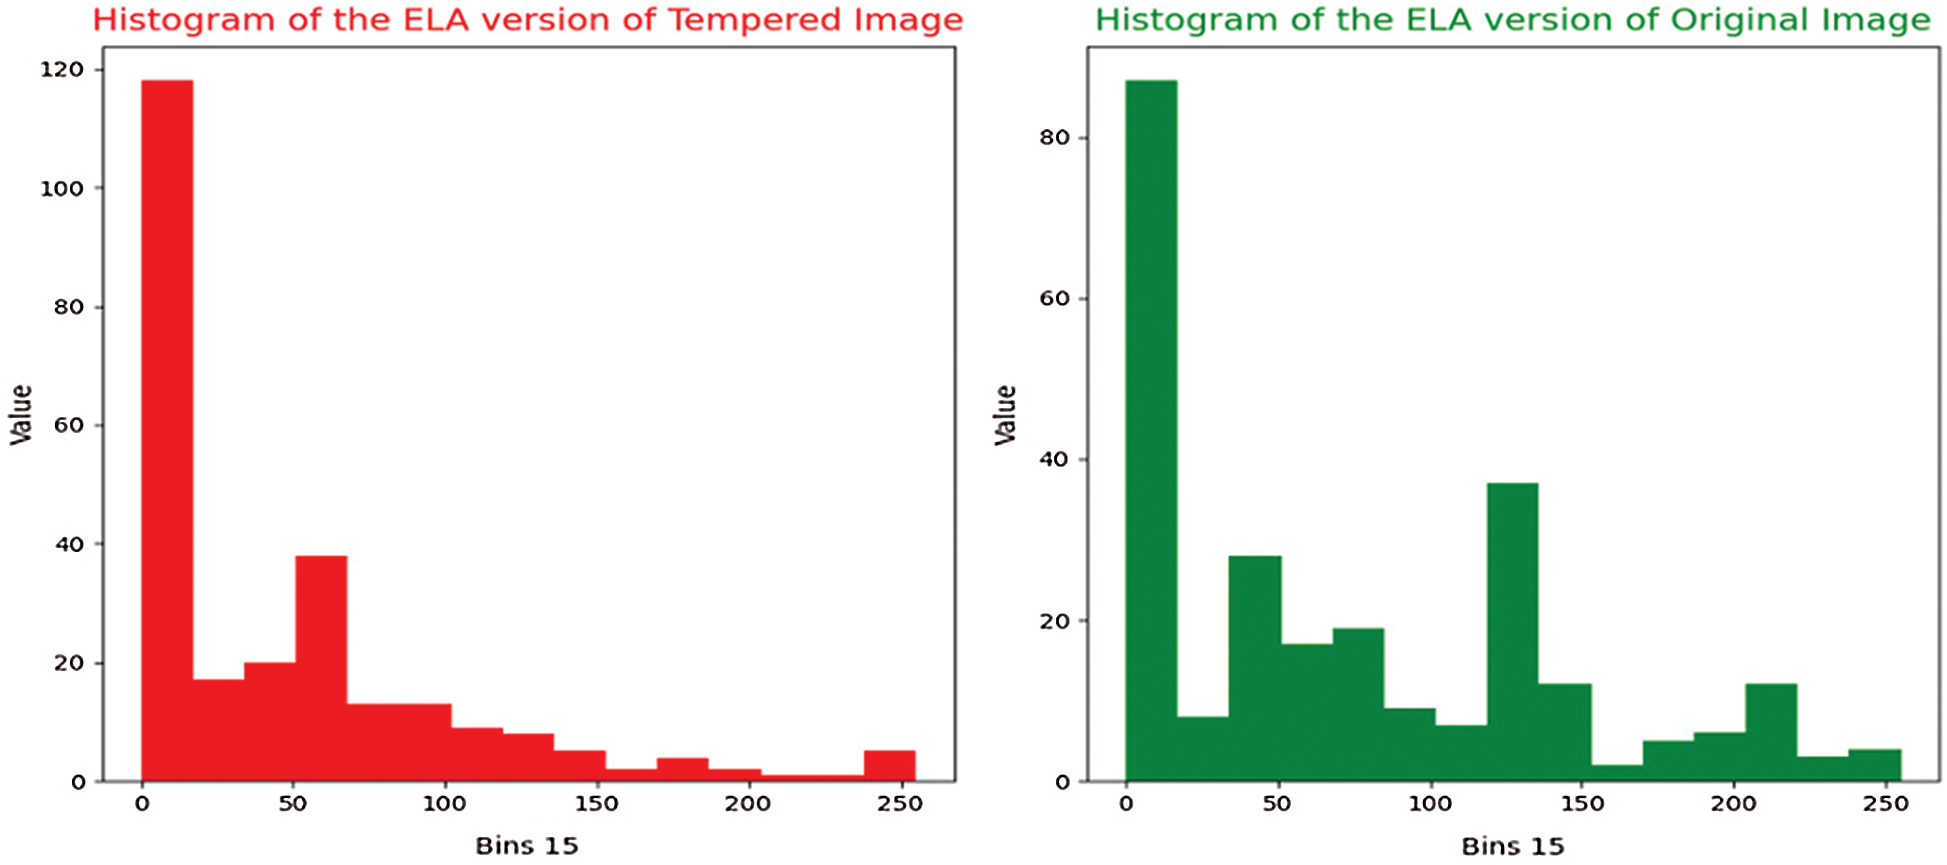
Figure 2: Histogram of tampered and original image
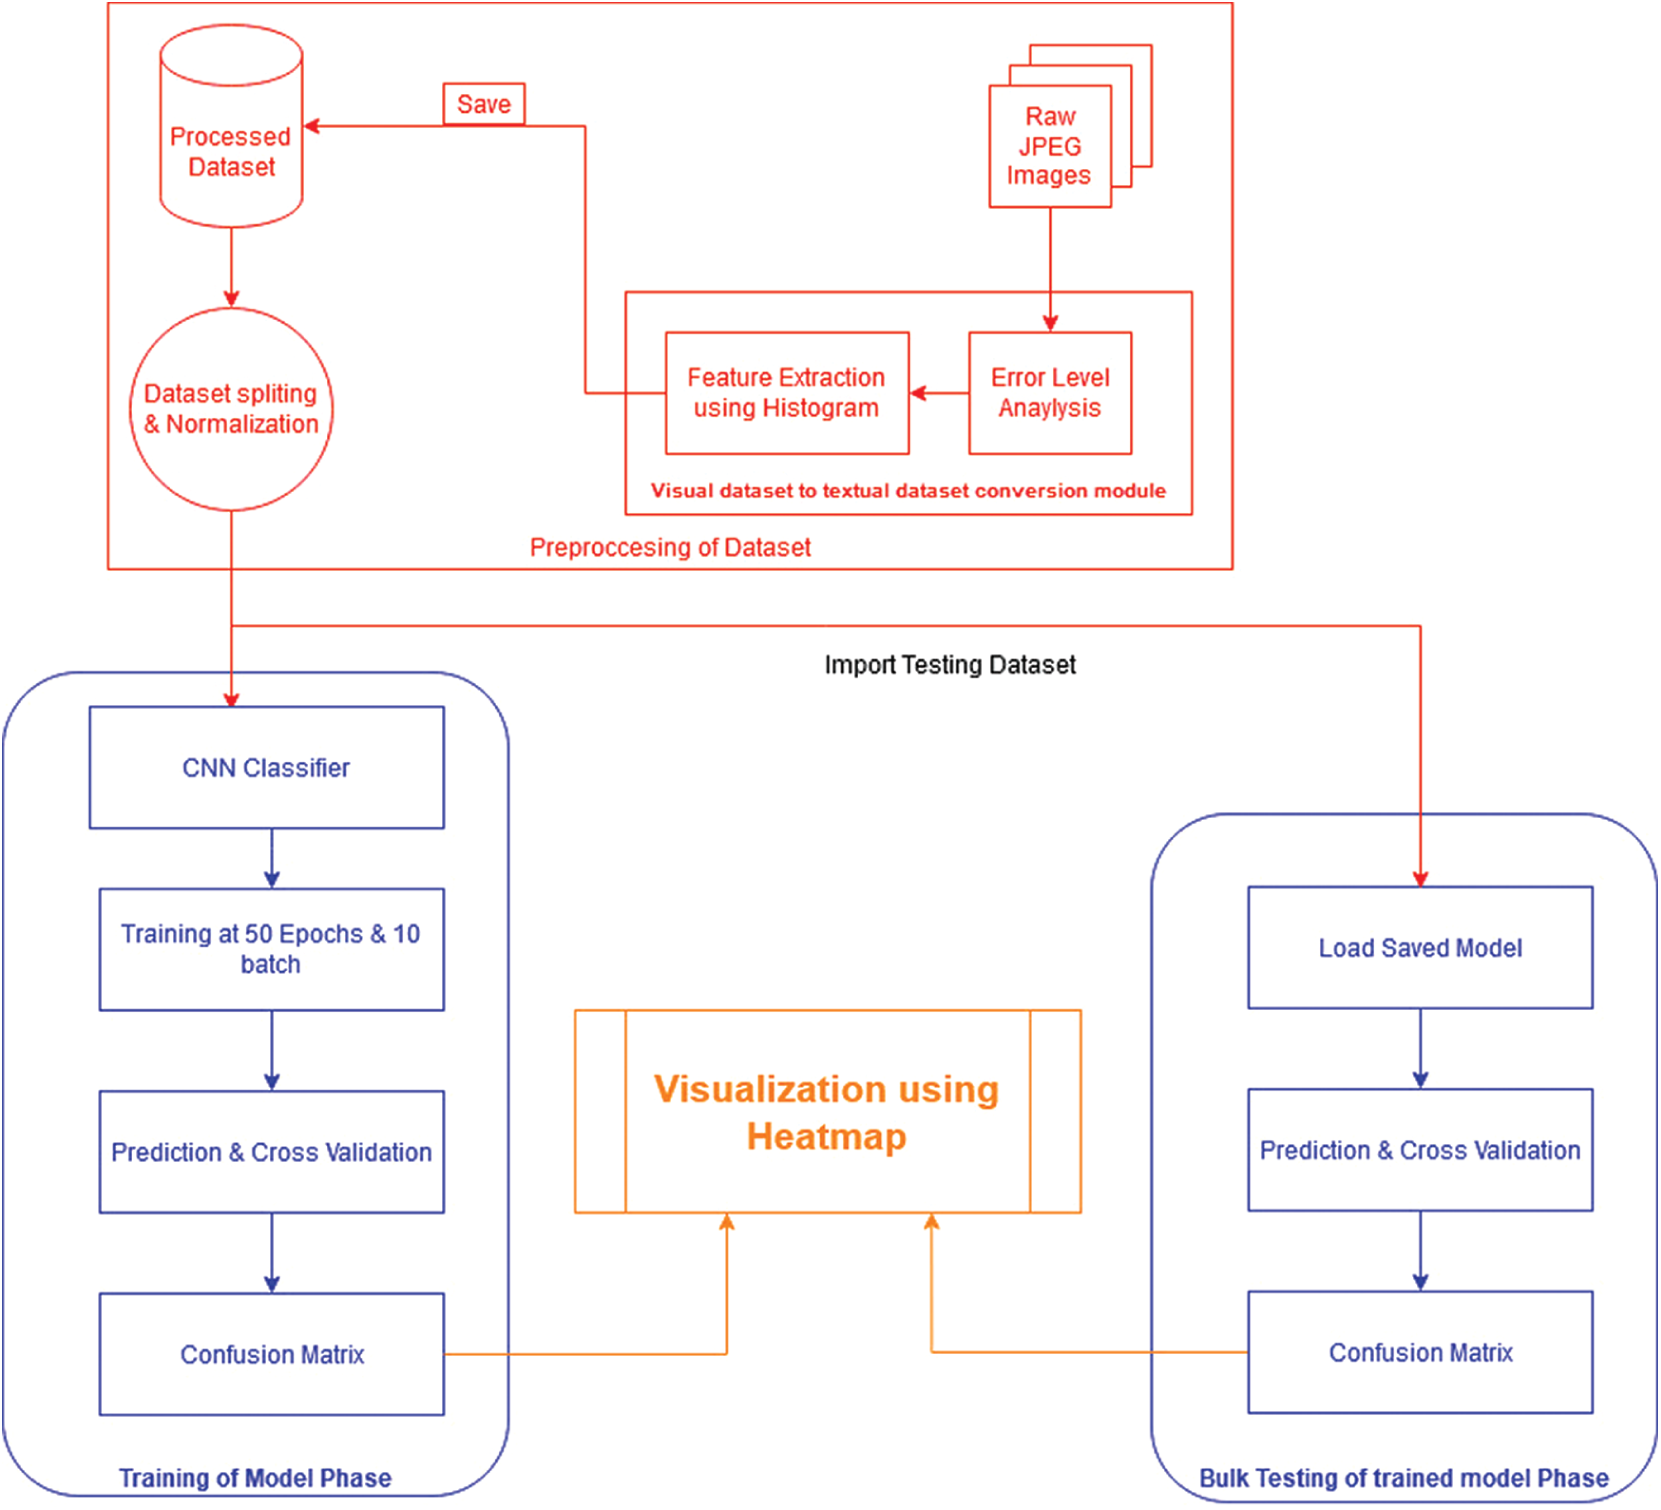
Figure 3: Block diagram of the proposed system
The training flowchart represents a significant tool in the training process, which helps trainers and other individuals involved in the training process to see how well the training process proceeds. The flowchart of the training process is presented in Fig. 4.
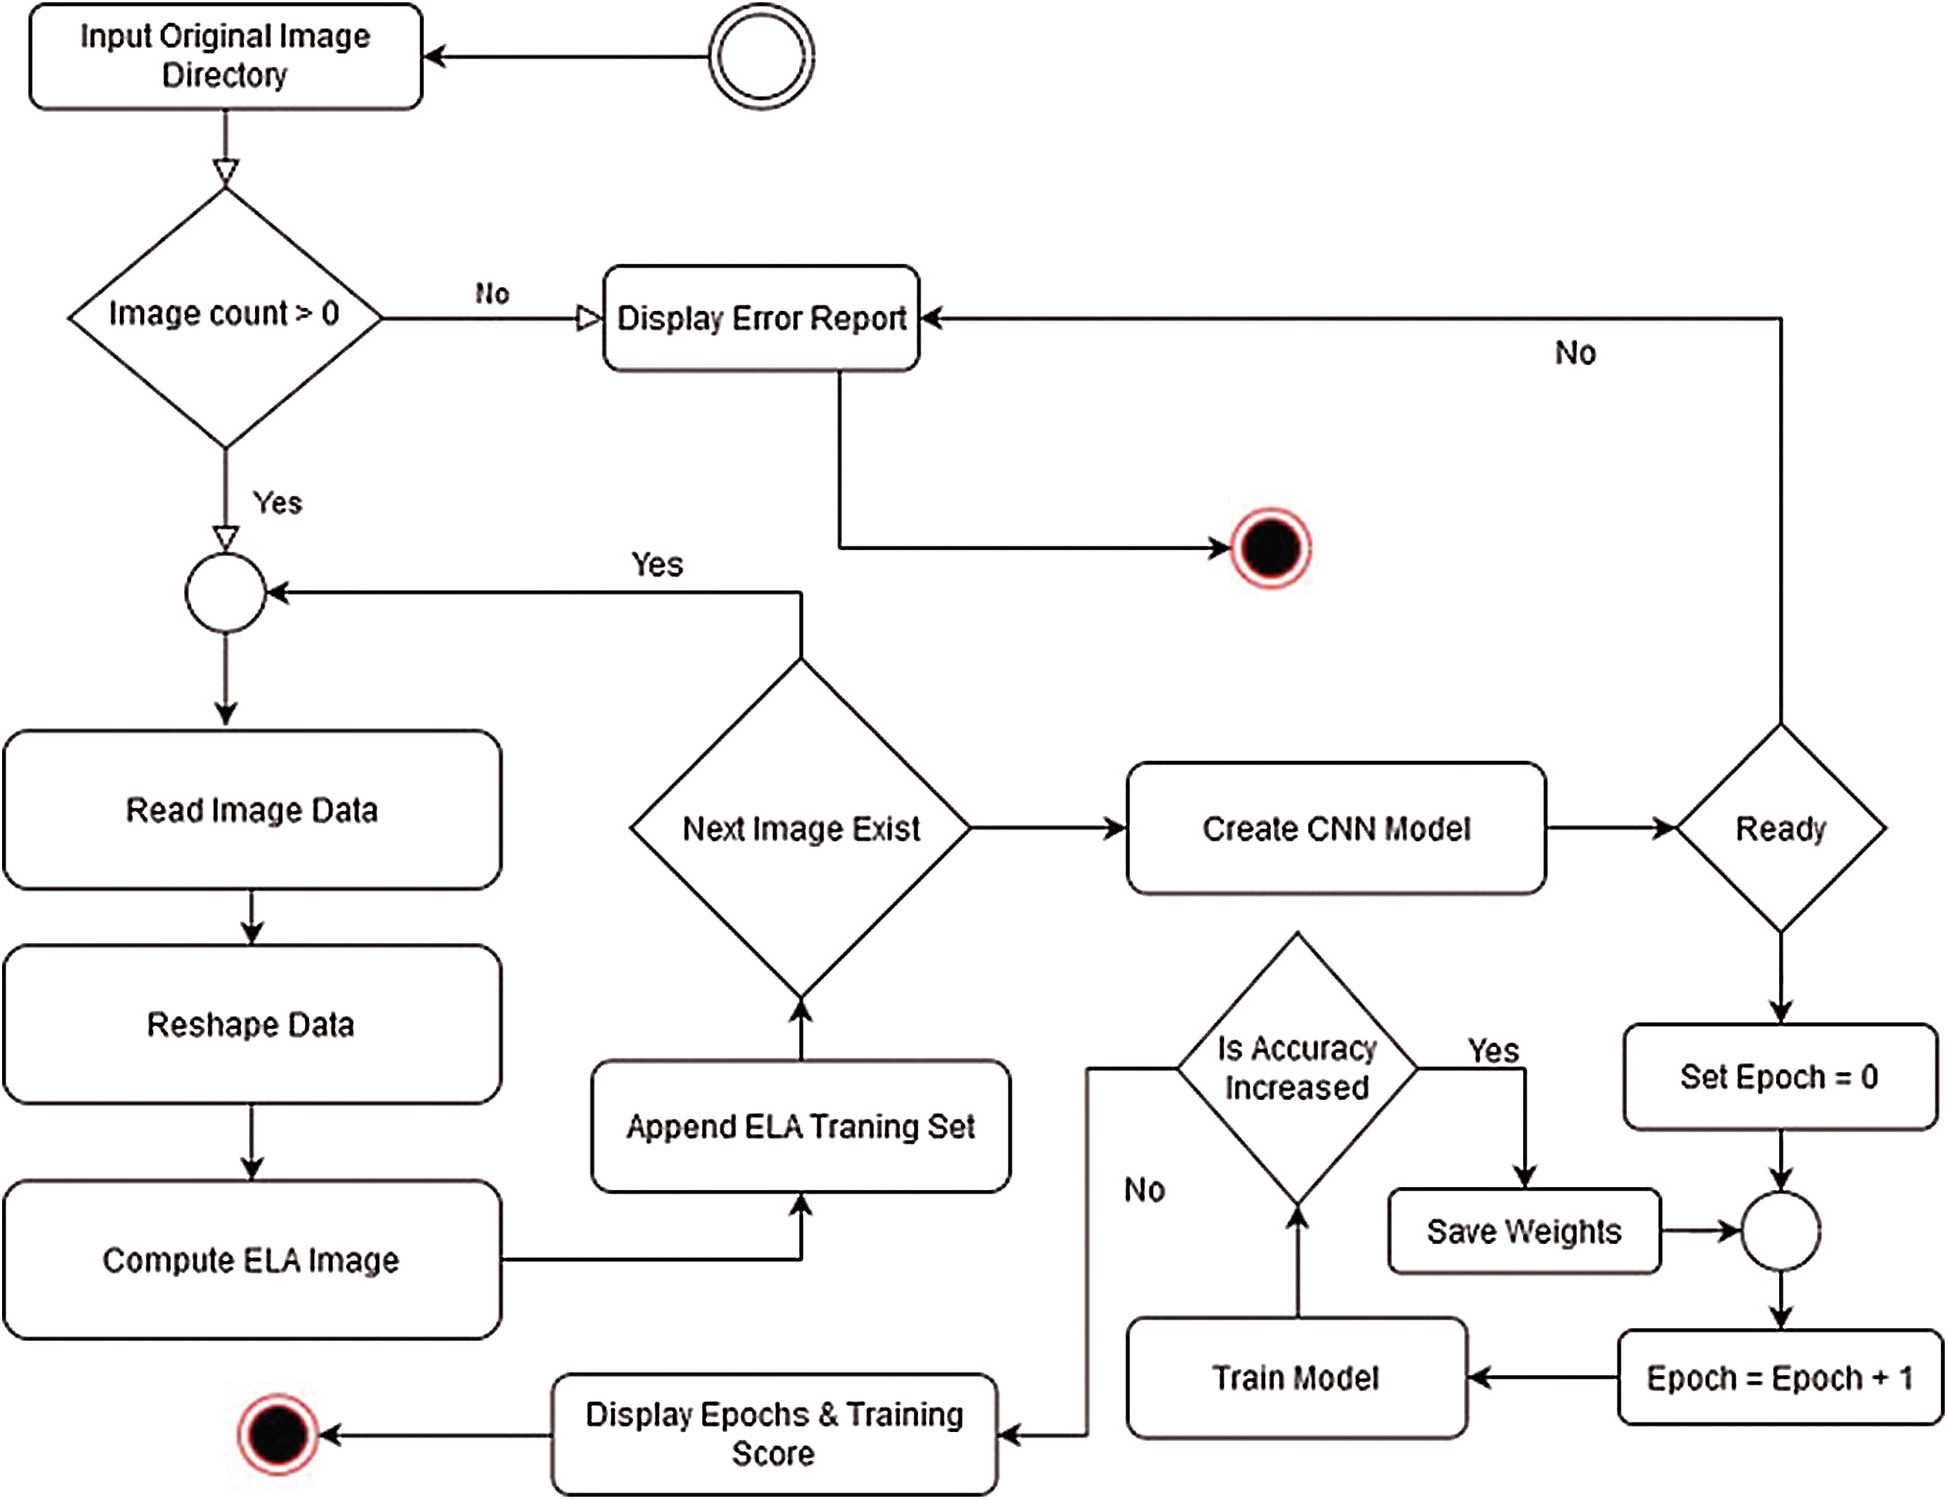
Figure 4: Flowchart of the training process
Many methods for detecting forging in images have been proposed, but this work presents a slightly different technique for the detection of forged images. As mentioned previously, when an image is exploited by splicing, editing, or watermarking, a noise pattern is generated in the image, which has a different representation in the noise chart. Therefore, in this work, the CNN model is used for the recognition of noise patterns in dozens of manipulated and tampered images.
The dataset used for model training and testing was taken from the open-source platform (Github.com) [31]. The dataset included the chest X-Rays data of different COVID-19-positive patients. The data were used almost in the genuine form. The dataset included a total of 544 images, of which 400 images (200 original and 200 tampered images) were used for training, and the remaining 144 images were used for testing. The illustration of data is shown in Fig. 5.
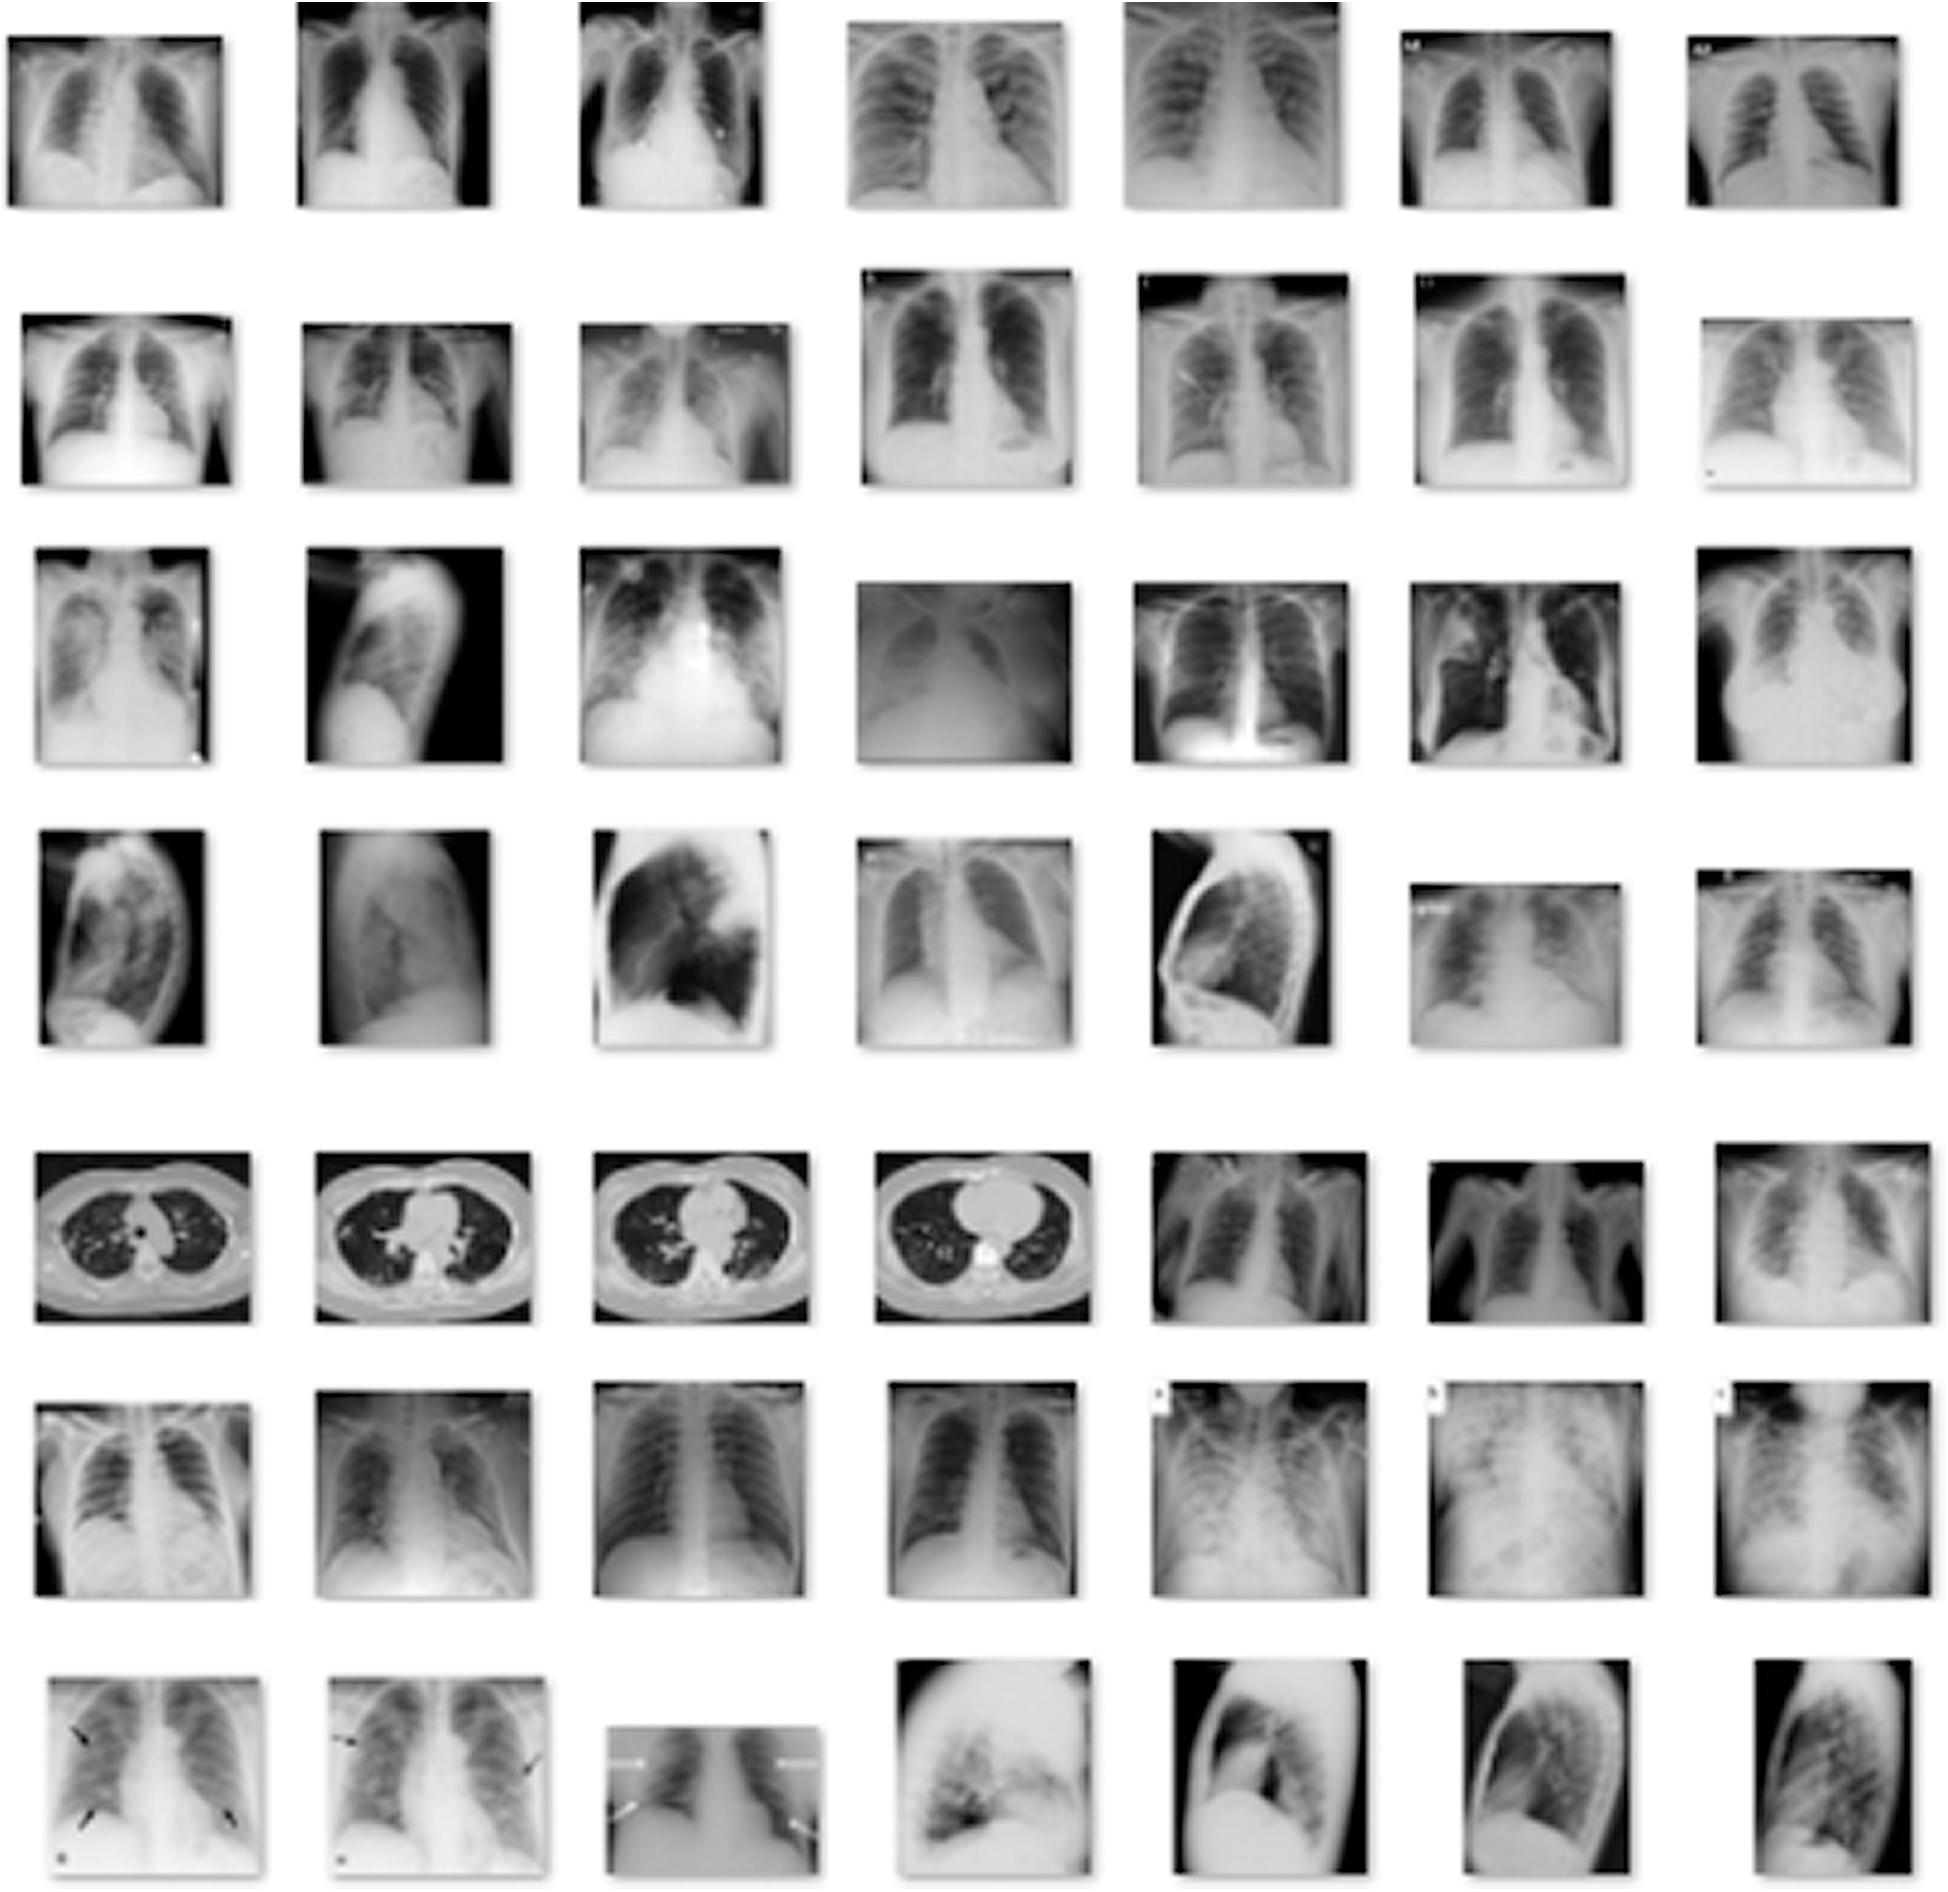
Figure 5: Illustration of actual dataset [31]
The Python approach consisted of Keras (https://keras.io/) as a model provider, and tensor flow was used as a CNN at the back end. The CNN model consisted of the following fully-connected dense layers:
1. The input layer having 300 neurons
2. Hidden 1 layer having 150 neurons
3. Hidden 2 layer having 75 neurons
4. Hidden 3 layer having 50 neurons
5. Hidden 4 layer having 25 neurons
6. Output layer with only one neuron
The first five layers used “ReLU” activation function, and the output layer used “Sigmoid” activation function. The CNN represents a profound learning system, consisting of neurons with learnable biases and weights. Neurons receive multiple inputs and assign them with attribute importance, and then take a weighted sum of the image inputs to distinguish one from the other. The data are processed by an activation function (Sigmoid and ReLU), and the output data are fed to the input of the next layer. In a completely integrated layer, neurons have complete connections to all previous layer activations. The graphical representation of the developed CNN model is shown in Fig. 6.
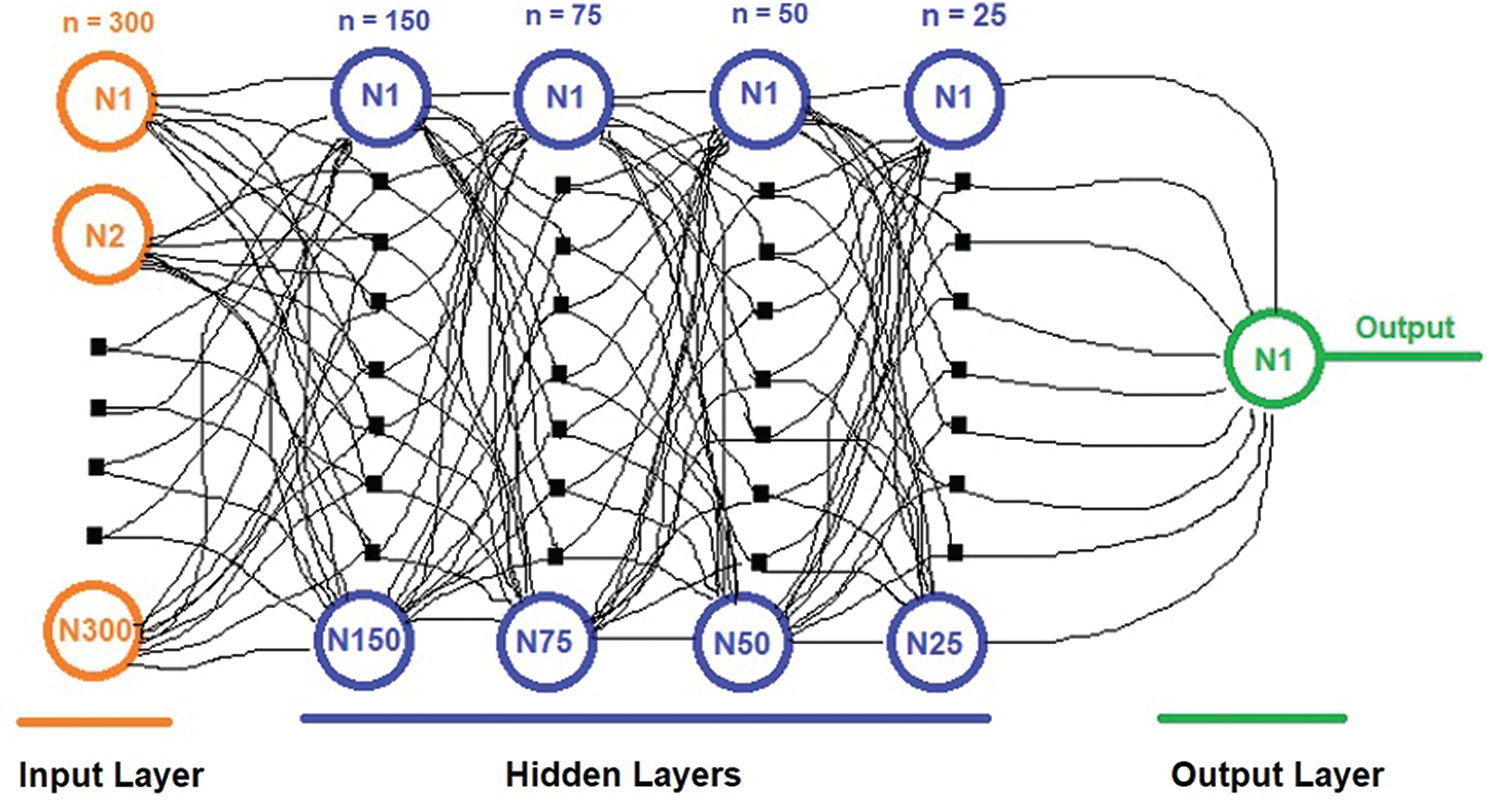
Figure 6: The structure of the proposed CNN model
This is how the ELA of an image is computed, and to understand the ELA concept better, two images, the original image and its ELA image, are shown in Fig. 7.
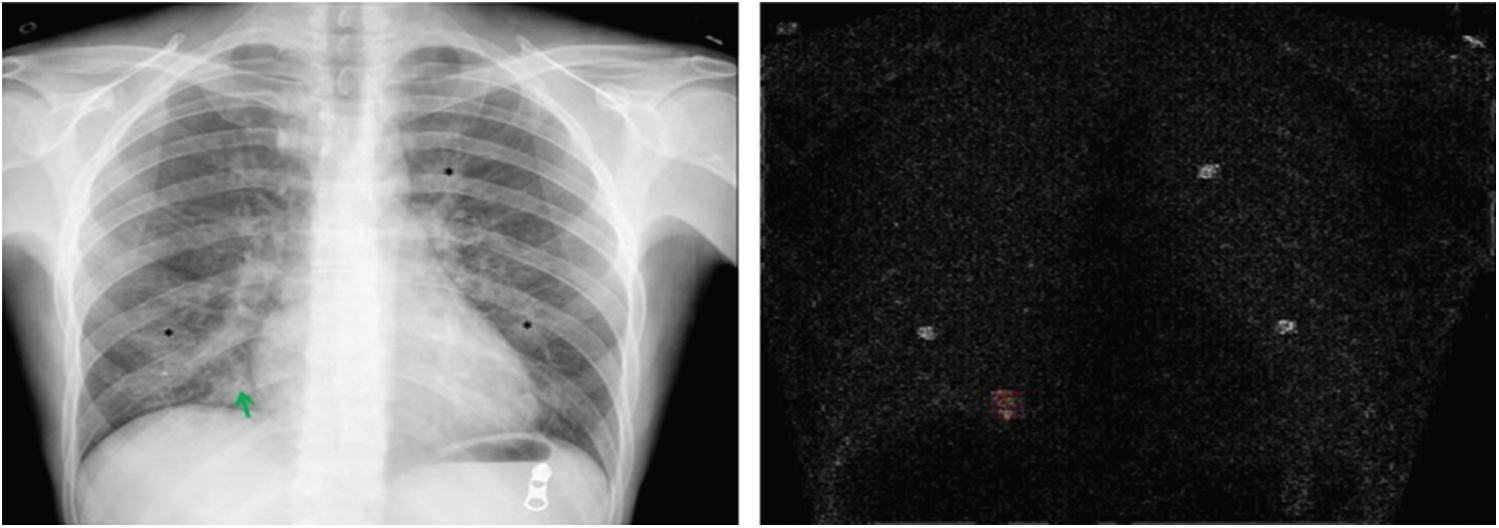
Figure 7: The original image and its ELA
Before the implementation of the machine learning approach to detect forgery, first, the ELA of an image should be explained. As mentioned above, the ELA is a simple technique of detecting tampering in an image. The ELA working flow used in this work was as follows:
1. A copy of the input image was created with a compression quality of known error rate, which was 95%.
2. The original image and the newly created image were compared, and the difference in pixels between these images was calculated.
3. If the image was not tampered, then the change in pixel compression was at an absolute minimum level.
4. If the image was forged/tampered heavily, then this ratio increased to a noticeable maximum level.
3.6 Handling Forgery with Machine Learning (Neural Networks)
Since the ELA computes the error level of the input image, the system under discussion was made of two main modules:
• ELA Computer
• ELA Forensic
The ELA computer module computed the ELA of a given image such that a new image was obtained with the same shape and dimensions. The new ELA image was then fed to the second module of the system, which was an analyzer; the analyzer analyzed the ELA image and decided on whether it was forged. The system was trained using a dataset of images that were forged heavily so that when an unknown image was given, it could successfully compute the results. To illustrate how the ELA of the forged image shows a great difference from the ELA of the original image, two images are shown in Fig. 8.
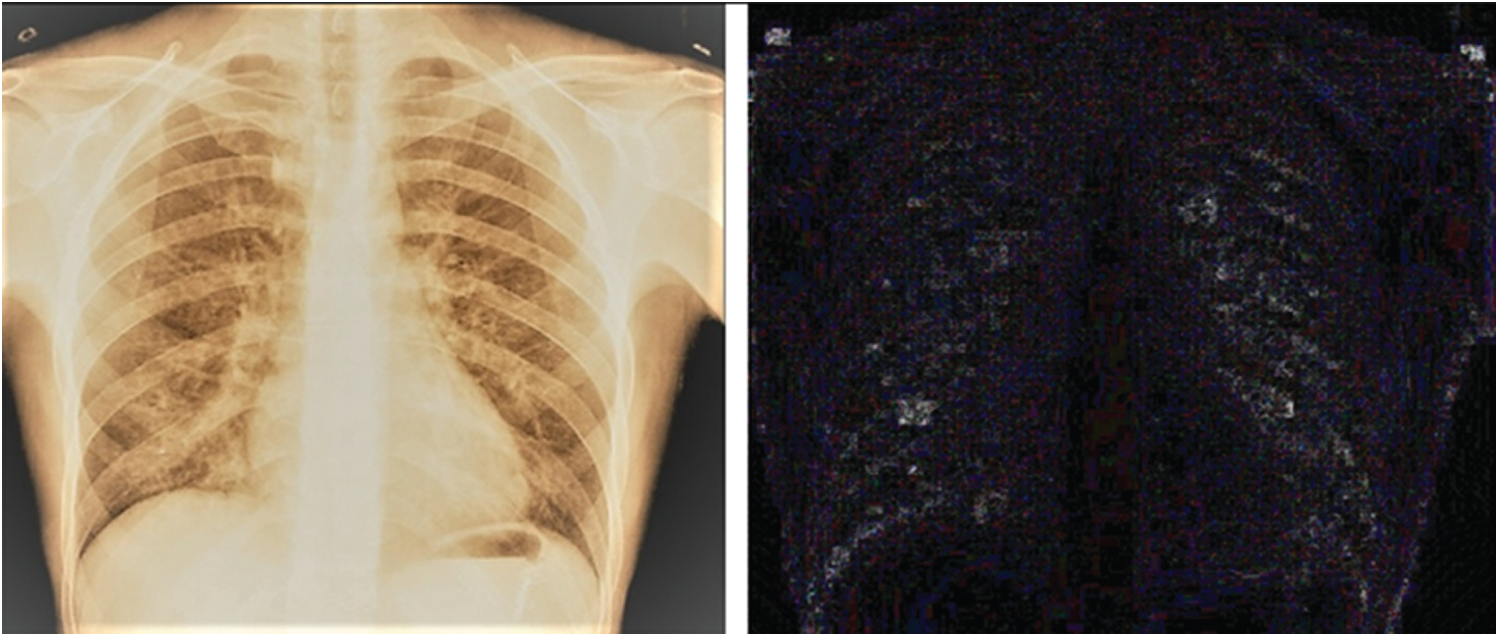
Figure 8: The ELA of the forged version of the original image and ELA of the tampered image
As shown in Fig. 8, the noise pattern in the ELA forensic of the forged image was due to the changes that were made in the original image. To simulate the forgery, the following changes were made in the original image.
• To enhance the view, a sharp orange filter was applied.
• Three visible stars in the original images were removed.
• The green arrow was also removed from the original image.
The changes were relatively good and useful enough to simulate the forgery in an image.
A confusion matrix represents a table illustrating and comparing prediction and test results with the real-world values, as described in Fig. 9.
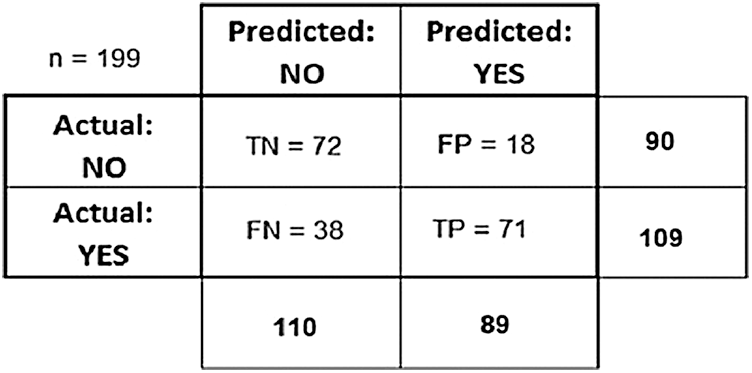
Figure 9: Confusion matrix
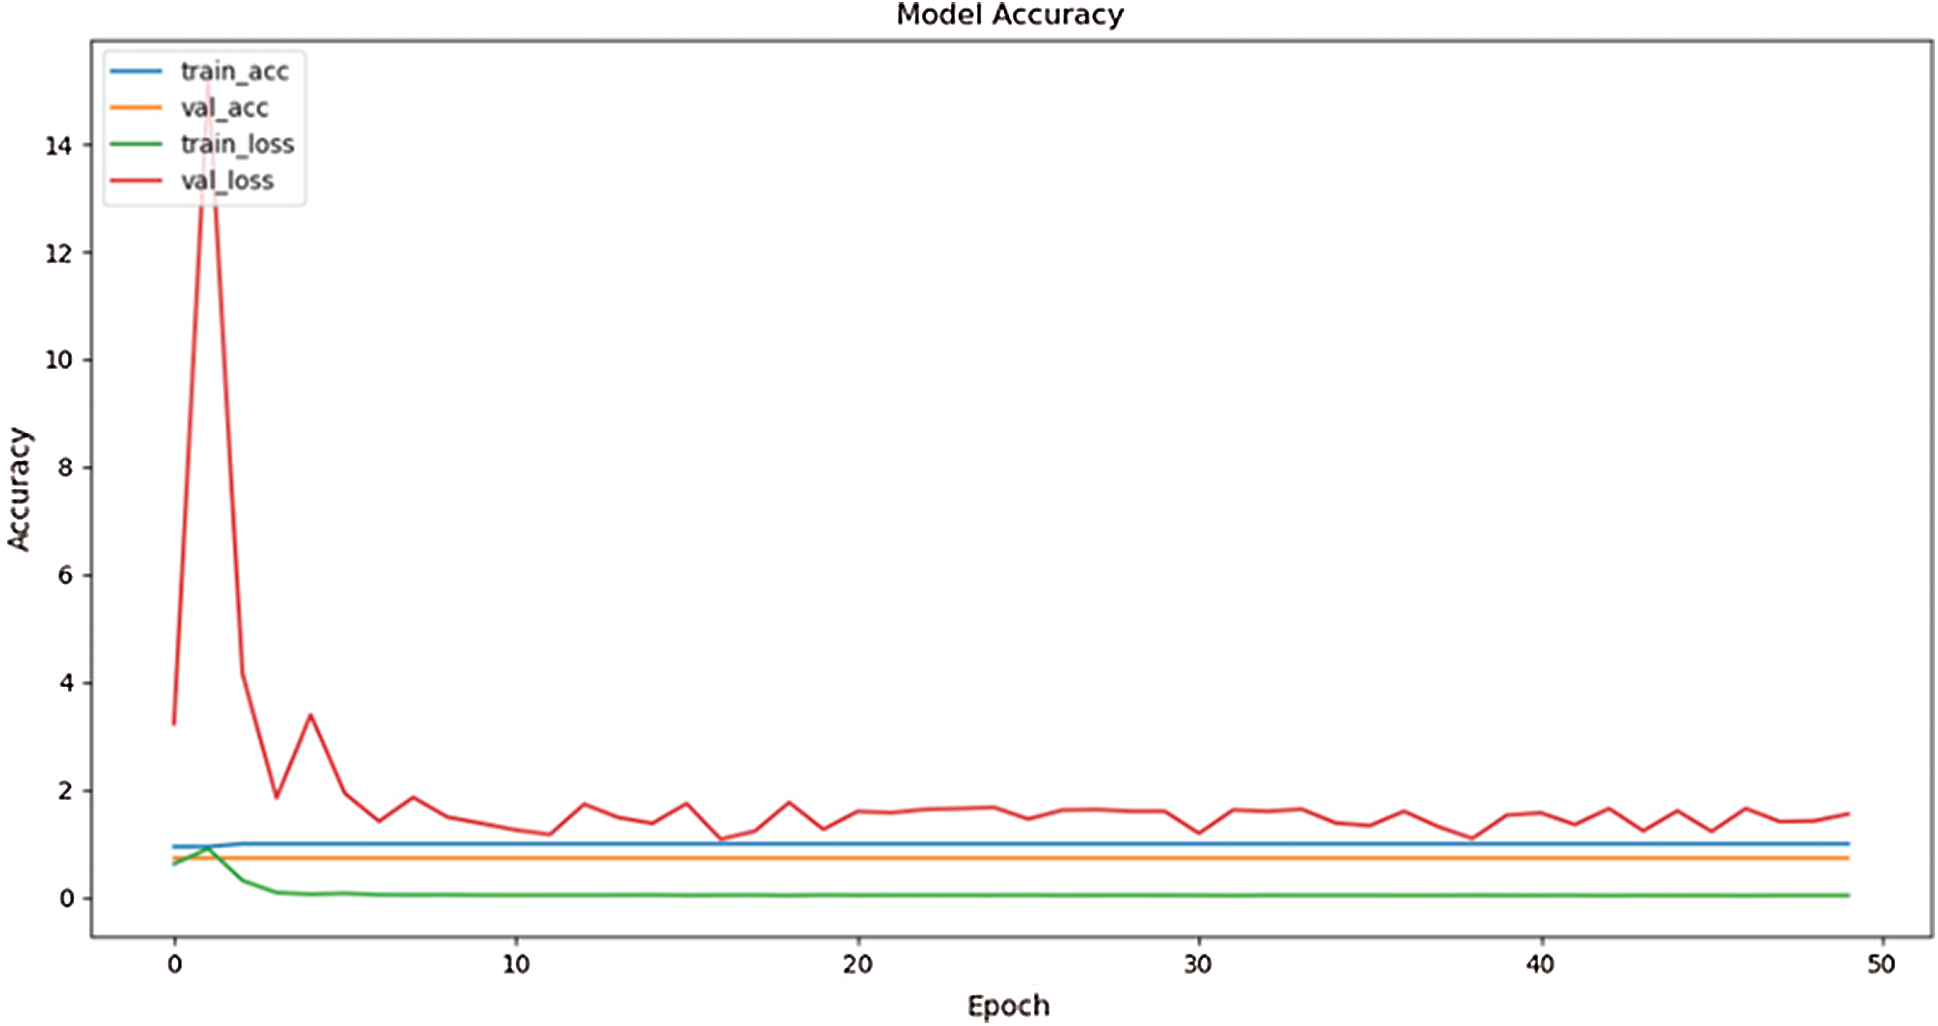
Figure 10: Accuracy results
Initially, the accuracy of the CNN was approximately 71%. By making the three above-mentioned changes, the accuracy increased to 92%, as shown in Fig. 10. The accuracy was improved by removing the noise pattern injected into the dataset and extra garbage values. The number of layers of the CNN was optimized to improve efficiency. In addition, some tweaks were done in the activation function of layers. The initial optimizer was also changed to a more optimal one. The learning rate was set 0.005, which was small enough to train a model with good precision and recall, and the SGD optimizer was used along the above-mentioned learning rate to accomplish the results. The accuracy results for 50 epochs are shown in Fig. 10. The training accuracy (blue line) in Fig. 10 is stable and near 92%. The major red line indicates the validation loss, which was very high at the start, and then decreased. The green line indicates the training loss, which was very low. This result indicates that the training of the neural network was stable, thus ensuring minimal loss and high accuracy of the trained model.
There has been a long history of fear since the COVID-19 outbreak. The number of patients infected by the COVID-19 virus has been rising exponentially across the globe. Scientists, technologists, physicians, and other healthcare staff have been working day and night to monitor and put this virus under control, as well as to develop a vaccine and provide proper medication. The COVID-19 pandemic contributed to the ongoing worldwide study. Although society has been hit by several pandemics in the past, it is difficult to estimate the long-term economic, behavioral, or societal consequences of the COVID-19 pandemic since these aspects have not been studied to a great extent in the past. The impacts of the COVID-19 pandemic have been disastrous for the whole world. In [32], a strategy for implementing p-CNN with a traditional image CNN (image-wised CNN) was suggested, which was almost 25 times faster than using a p-CNN directly in the multi-focus image fusion. The experimental findings indicated that in terms of both subjective visual interpretation and quantitative measurement criteria, the proposed approach was comparable with or even outperformed the state-of-the-art methods. In [33], the latest CNN architecture for hyperspectral image classification was introduced. The proposed CNN was a 3D network that used spectral as well as spatial data. The test results were compared to the results obtained by other conventional ANN techniques, and the comparison result showed that the proposed network performed reliably and effectively, reducing the processing time and increasing the precision of hyperspectral image classification. In [34], several studies dealing with the automated diagnosis of the COVID19 virus were reviewed, and the validity of the normal research protocols was discussed. Also, it was shown that these protocols could be biased and learn to predict features that relied more on the source dataset than on the required medical data. A classifier based on Generative Adversarial Network (GANs) was trained not to allow their model to learn specific features, achieving the accuracies of 97%, 88%, and 66% for severe, moderate, and mild cases, respectively, on various source datasets. Furthermore, in [35], a patch-based deep neural network architecture that could be trained with a relatively small dataset was proposed. When the neural network was established, the ultimate decision based on dataset was made on the basis of the majority vote at random locations inside the lungs from several patches. In [36], the close approximation for the derivation of discontinuous binarization function and L2 regularisation acting on the weight scaling factors were discussed, and a specific training algorithm was developed. The binary CNN achieved the precision of 92.3% on the CIFAR-10 dataset using the VGG-Small network by adopting the mentioned upgrades. On the ImageNet dataset, using the AlexNet, our approach achieved an accuracy of 46.1%, and an accuracy of 54.2% using the Resnet-18, exceeding the previous works. In [37], the authors evaluated the performance of CNN using four architectures, namely, LeNet-5, ResNet-50, VGG-11, and VGG-16 and compared the obtained model performances. Using the proposed CNN architecture on the ISI, CMATERDB, and NUMTADB datasets with the image resolution of
In this paper, it is discussed how the manipulation of digital data has become a very common practice. Digital data forgeries are split into two categories, active and passive. In order to increase the trust of patients and to eschew them from disconcertment, the medical data forgery needs further research. The proposed model combines the CNN and ELA to extract features from data patches. The dataset used for model development is divided into the forged data and original data. The proposed model is verified by the experiments, and the experimental results show that the proposed model can achieve an accuracy of 92% on the COVID-19 dataset. The proposed model can help the community, including doctors and paramedical staff, as well as the healthcare system, to detect the forgery in COVID-19 data. In the future, the performance of CNN can be further verified using another classifier.
Funding Statement: The work was partially supported by Computer Research Institute of Montreal, Quebec, Canada, we acknowledge the support of Ministère de l’Économie et de l’Innovation, Quebec, Canada. This work was also partially supported by Taif University Researchers Supporting Project Number (TURSP-2020/215), Taif University, Taif, Saudi Arabia.
Conflicts of Interest: The authors declare that there are no conflicts of interest to report regarding the present study.
1. S. Walia and K. Kumar, “Digital image forgery detection: A systematic scrutiny,” Australian Journal of Forensic Sciences, vol. 51, no. 5, pp. 488–526, 2019. [Google Scholar]
2. M. A. Qureshi and M. Deriche, “A bibliography of pixel-based blind image forgery detection techniques,” Signal Processing: Image Communication, vol. 39, no. 1, pp. 46–74, 2015. [Google Scholar]
3. M. D. Ansari, S. P. Ghrera and V. Tyagi, “Pixel-based image forgery detection: A review,” IETE Journal of Education, vol. 55, no. 1, pp. 40–46, 2014. [Google Scholar]
4. A. C. Popescu and H. Farid, Exposing Digital Forgeries by Detecting Duplicated Image Regions. Hanover, USA: Dept. Comput. Sci., Dartmouth College, Tech. Rep. TR2004-515, pp. 1–11, 2004. [Google Scholar]
5. M. Emam, Q. Han and H. Zhang, “Two-stage keypoint detection scheme for region duplication forgery detection in digital images,” Journal of Forensic Sciences, vol. 63, no. 1, pp. 102–111, 2018. [Google Scholar]
6. S. Kumar and S. Nagori, “Key-point based copy-move forgery detection in digital images,” Journal of Statistics and Management Systems, vol. 20, no. 4, pp. 611–621, 2017. [Google Scholar]
7. S. Manjunatha and M. M. Patil, “A survey on image forgery detection techniques,” Digital Image Processing, vol. 9, no. 5, pp. 103–108, 2017. [Google Scholar]
8. K. H. Chiang, K. C. Chang-Chien, R. F. Chang and H. Y. Yen, “Tamper detection and restoring system for medical images using wavelet-based reversible data embedding,” Journal of Digital Imaging, vol. 21, no. 1, pp. 77–90, 2008. [Google Scholar]
9. R. Eswaraiah and E. S. Reddy, “Robust medical image watermarking technique for accurate detection of tampers inside region of interest and recovering original region of interest,” IET Image Processing, vol. 9, no. 8, pp. 615–625, 2015. [Google Scholar]
10. J. Lukas, J. Fridrich and M. Goljan, “Digital camera identification from sensor pattern noise,” IEEE Transactions on Information Forensics and Security, vol. 1, no. 2, pp. 205–214, 2006. [Google Scholar]
11. M. A. Qureshi and E. S. M. El-Alfy, “Bibliography of digital image anti-forensics and anti-anti forensics techniques,” IET Image Processing, vol. 13, no. 11, pp. 1811–1823, 2019. [Google Scholar]
12. S. Kabilesh, K. Revathi, K. Sabitha and N. Sujithkumar, “Medical image counterfeit detection for smart healthcare,” Journal of Sensor Research and Technologies, vol. 2, no. 2, pp. 1–6, 2020. [Google Scholar]
13. M. A. Anoop and S. Poonkuntran, “LPG: A novel approach for medical forgery detection in image transmission,” Journal of Ambient Intelligence and Humanized Computing, vol. 11, pp. 1–17, 2020. [Google Scholar]
14. C. S. Prakash, H. Om and S. Maheshkar, “Authentication of medical images using passive approach,” IET Image Processing, vol. 13, no. 13, pp. 2420–2427, 2019. [Google Scholar]
15. G. Ulutas, A. Ustubioglu, B. Ustubioglu, V. V. Nabiyev and M. Ulutas, “Medical image tamper detection based on passive image authentication,” Journal of Digital Imaging, vol. 30, no. 6, pp. 695–709, 2017. [Google Scholar]
16. R. Dixit and R. Naskar, “Review, analysis and parameterisation of techniques for copy-move forgery detection in digital images,” IET Image Processing, vol. 11, no. 9, pp. 746–759, 2017. [Google Scholar]
17. A. H. Oyiza and M. A. Maarof, “An improved dct block-based technique for copy-move forgery detection in medical images,” International Journal of Innovative Computing, vol. 8, no. 1, pp. 1–7, 2018. [Google Scholar]
18. V. Nath, G. Gaharwar and R. Gaharwar, “Comprehensive study of different types image forgeries,” International Journal of Science Technology and Management, vol. 4, no. 1, pp. 146–151, 2015. [Google Scholar]
19. B. Chen, Y. Lu, W. Pan, J. Xiong, Z. Yang et al., “Support vector machine classification of nonmelanoma skin lesions based on fluorescence lifetime imaging microscopy,” Analytical Chemistry, vol. 91, no. 16, pp. 10640–10647, 2019. [Google Scholar]
20. H. Jang and J. U. Hou, “Exposing digital image forgeries by detecting contextual abnormality using convolutional neural networks,” Sensors, vol. 20, no. 8, pp. 2262, 2020. [Google Scholar]
21. R. Thabit and B. E. Khoo, “Medical image authentication using slt and iwt schemes,” Multimedia Tools and Applications, vol. 76, no. 1, pp. 309–332, 2017. [Google Scholar]
22. Y. Jang, S. Kim, K. Kim and D. Lee, “Deep learning-based classification with improved time resolution for physical activities of children,” PeerJ, vol. 6, no. 5, pp. e5764, 2018. [Google Scholar]
23. N. Kaur, N. Jindal and K. Singh, “A passive approach for the detection of splicing forgery in digital images,” Multimedia Tools and Applications, vol. 79, no. 43–44, pp. 1–27, 2020. [Google Scholar]
24. M. J. Khan, A. Yousaf, A. Abbas and K. Khurshid, “Deep learning for automated forgery detection in hyperspectral document images,” Journal of Electronic Imaging, vol. 27, no. 5, pp. 53001, 2018. [Google Scholar]
25. F. M. Al Azrak, A. Sedik, M. I. Dessowky, G. M. El Banby, A. A. Khalaf et al., “An efficient method for image forgery detection based on trigonometric transforms and deep learning,” Multimedia Tools and Applications, vol. 79, pp. 1–23, 2020. [Google Scholar]
26. K. Hayat and T. Qazi, “Forgery detection in digital images via discrete wavelet and discrete cosine transforms,” Computers & Electrical Engineering, vol. 62, no. 4, pp. 448–458, 2017. [Google Scholar]
27. I. B. K. Sudiatmika and F. Rahman, “Image forgery detection using error level analysis and deep learning,” Telkomnika, vol. 17, no. 2, pp. 653–659, 2019. [Google Scholar]
28. N. B. Abd Warif, M. Y. I. Idris, A. W. A. Wahab and R. Salleh, “An evaluation of error level analysis in image forensics,” in Proc. 5th IEEE Int. Conf. on System Engineering and Technology, Shah Alam, Malaysia, pp. 23–28, 2015. [Google Scholar]
29. T. Vijayanandh and A. Shenbagavalli, “Tamper detection of medical images using statistical moments against various attacks,” Multimedia Tools and Applications, vol. 77, no. 8, pp. 10273–10284, 2018. [Google Scholar]
30. M. A. Razzaq, R. A. Sheikh, M. A. Baig and A. Ahmad, “Digital image security: Fusion of encryption, steganography and watermarking,” International Journal of Advanced Computer Science and Applications, vol. 8, no. 5, pp. 224–228, 2017. [Google Scholar]
31. J. P. Cohen, P. Morrison, L. Dao, K. Roth, T. Q. Duong et al., “Covid-19 image data collection: Prospective predictions are the future,” preprint arXiv preprint arXiv:2006.11988, 2020. [Google Scholar]
32. H. Tang, B. Xiao, W. Li and G. Wang, “Pixel convolutional neural network for multi-focus image fusion,” Information Sciences, vol. 433, no. 5, pp. 125–141, 2018. [Google Scholar]
33. Y. Zhang, D. Zhou, S. Chen, S. Gao and Y. Ma, “Single-image crowd counting via multi-column convolutional neural network,” in Proc. IEEE Conf. on Computer Vision and Pattern Recognition, NV, USA: Las Vegas, pp. 589–597, 2016. [Google Scholar]
34. T. C. COVID and R. Team, “Severe outcomes among patients with coronavirus disease 2019 (covid-19)-United States,” MMWR Morb Mortal Wkly Rep, vol. 69, no. 16, pp. 343–346, 2020. [Google Scholar]
35. Y. Oh, S. Park and J. C. Ye, “Deep learning covid-19 features on CXR using limited training data sets,” IEEE Transactions on Medical Imaging, vol. 39, no. 8, pp. 2688–2700, 2020. [Google Scholar]
36. Z. Xu and R. C. Cheung, “Accurate and compact convolutional neural networks with trained binarization,” preprint arXiv:1909.11366, 2019. [Google Scholar]
37. M. M. Rahman, M. S. Islam, R. Sassi and M. Aktaruzzaman, “Convolutional neural networks performance comparison for handwritten bengali numerals recognition,” SN Applied Sciences, vol. 1, no. 12, pp. 1660, 2019. [Google Scholar]
38. T. Kattenborn, J. Eichel and F. E. Fassnacht, “Convolutional neural networks enable efficient, accurate and fine-grained segmentation of plant species and communities from high-resolution uav imagery,” Scientific Reports, vol. 9, no. 1, pp. 1–9, 2019. [Google Scholar]
 | This work is licensed under a Creative Commons Attribution 4.0 International License, which permits unrestricted use, distribution, and reproduction in any medium, provided the original work is properly cited. |