DOI:10.32604/cmc.2021.015355
| Computers, Materials & Continua DOI:10.32604/cmc.2021.015355 | |
| Article |
Data-Fusion for Epidemiological Analysis of Covid-19 Variants in UAE
1Zayed University, Dubai, United Arab Emirates
2Staffordshire University, Stoke-on-Trent, ST4 2DE, United Kingdom
3Keele University, Newcastle, ST5 5BG, United Kingdom
*Corresponding Author: Anoud Bani-Hani. Email: Anoud.Bani-Hani@zu.ac.ae
Received: 17 November 2020; Accepted: 15 March 2021
Abstract: Since December 2019, a new pandemic has appeared causing a considerable negative global impact. The SARS-CoV-2 first emerged from China and transformed to a global pandemic within a short time. The virus was further observed to be spreading rapidly and mutating at a fast pace, with over 5,775 distinct variations of the virus observed globally (at the time of submitting this paper). Extensive research has been ongoing worldwide in order to get a better understanding of its behaviour, influence and more importantly, ways for reducing its impact. Data analytics has been playing a pivotal role in this research to obtain valuable insights into understanding and fighting against the spread of infection. However, this is time and resource intensive, making it difficult to observe and quickly identify the impact of mutations. Factors such as the spread or virulence could explain the three months delay in revealing the new virus variant in the UK. This paper presents an extensive correlation analysis of the effect caused by the different SARS-CoV-2 strains, and their influence on the population across diverse factors, such as propagation and fatality rates, during the peak of the pandemic, with a focus on two major countries in the Middle East, the United Arab Emirate (UAE) and the Kingdom of Saudi Arabia (KSA). This research aims to investigate the epidemiological behaviour of the Coronavirus’ genomic variants over time in the UAE, compared with the KSA, where correlation analysis is carried out for a number of cases, deaths and their statistical deviations. The results of the analysis highlight very interesting insights into the epidemiological impact of the Covid-19 genomic behaviour in both countries, which could lead to important actions taken to minimize the impact on wider public health, possibly saving lives, and the economy. For instance, our method identifies a potential correlation between a spike in the number of deaths per case of 5.5 observed in the UAE by March 24th, with the emergence of new genomic variants of the Coronavirus (G0_c, G0_e1 and G0_e2). Our proposed methodology can be instrumental in identifying and classifying new variations of the virus earlier, and possibly predicting foreseeable mutations through pattern analysis, hence creating proactive measures to control its spread, such as the recent case of the new virus variant, recently discovered in the UK.
Keywords: SARS-CoV-2; genome; covid-19; public health; pandemic; epidemiology; case study; United Arab Emirates; UAE; Kingdom of Saudi Arabia; KSA
At the time of submitting this paper, more than 87 million cases of Covid-19 have been identified globally [1], with almost 2 million deaths and more than 5,775 different variations observed [2]. Due to its fast propagation, the virus has evolved quickly, which required more extensive research across several domains in order to improve detection, treatment, and the search for a vaccine [3]. Since January 2020, numerous research efforts have been reported and several datasets were generated [3,4]. Moreover, not all infected people present symptoms, which makes it even harder to control its spread [5], while massive testing is a highly demanding process that requires considerable resources, not available to the majority of the world [6]. Therefore, the accurate number of infected cases can be difficult to identify [7]. Furthermore, the virus proved to cause other conditions, such as MIS-C disease observed in people under 21 [8], neurological impacts [8], persistent symptoms [9,10], in addition to the ongoing evolution of its virulence [11,12].
Genome analysis of the virus and its variants has been an important source of information in helping understand its detection, behaviour, characteristics, development history, as well as developing treatments and vaccines [13–20]. Genomic analysis has also been utilised to detect the virus mutations and their potential impact on its spread and possible predictions [20–23]. However, these mutations are still under investigation to prove their validity [23]. Significant work is required to understand the virus and the correlations between the genomes and their behaviour. Moreover, most of the closest research to our work in this paper, genomic mutation analysis, focuses either on the origin of the virus or on the impact of specific mutations. The former is done using a similar approach to ours for genome grouping, however, they concentrate primarily on the study of the path that the virus has taken (where does the different Covid-19 sequences come from?). The latter is mainly supported by Machine Learning [24,25] to explore the different mutations observed and search for their impact in larger populations across countries or continents, but without grouping genomes upstream and focusing only on correlations with mutations such as in [26]. Our approach ensures timely identification of new variants of the Coronavirus.
In our paper, the main methods used for the comparisons are alignments [27] and phylogenetic trees [28]. Alignment is used to arrange sequences, one above the other. The sequence is then altered for comparison as illustrated in Fig. 1. Using these alignments, phylogenetic trees are created, which are similar to evolutionary trees, however genomic sequences are applied. They allow us to graphically observe distances between sequences based on the mutations. Domain knowledge is required to understand the impact of a specific mutation, however, in our approach we compare the genomes of the different virus variants by grouping and comparing them with each other according to their likelihood, like comparing a set of pictures together.
While the results, at the picture level, may not provide precise identification of the pixels that differ, other forms of data can be derived from it. In the case of genomic sequences, it could show trends of evolution and virus variations that tend to emerge, which can potentially be an indicator of how this crisis is being handled geographically. Genomic sequences have been studied to enhance the understanding of the epidemic in the United Arab Emirates (UAE) and identify its origin [29], but there are no other studies which attempt to report the work presented in this paper. More detailed analysis has also been carried out, for other parts of the world, particularly on the potential impact of the virus’s mutations, symptoms, severity, and its spread [30,31].
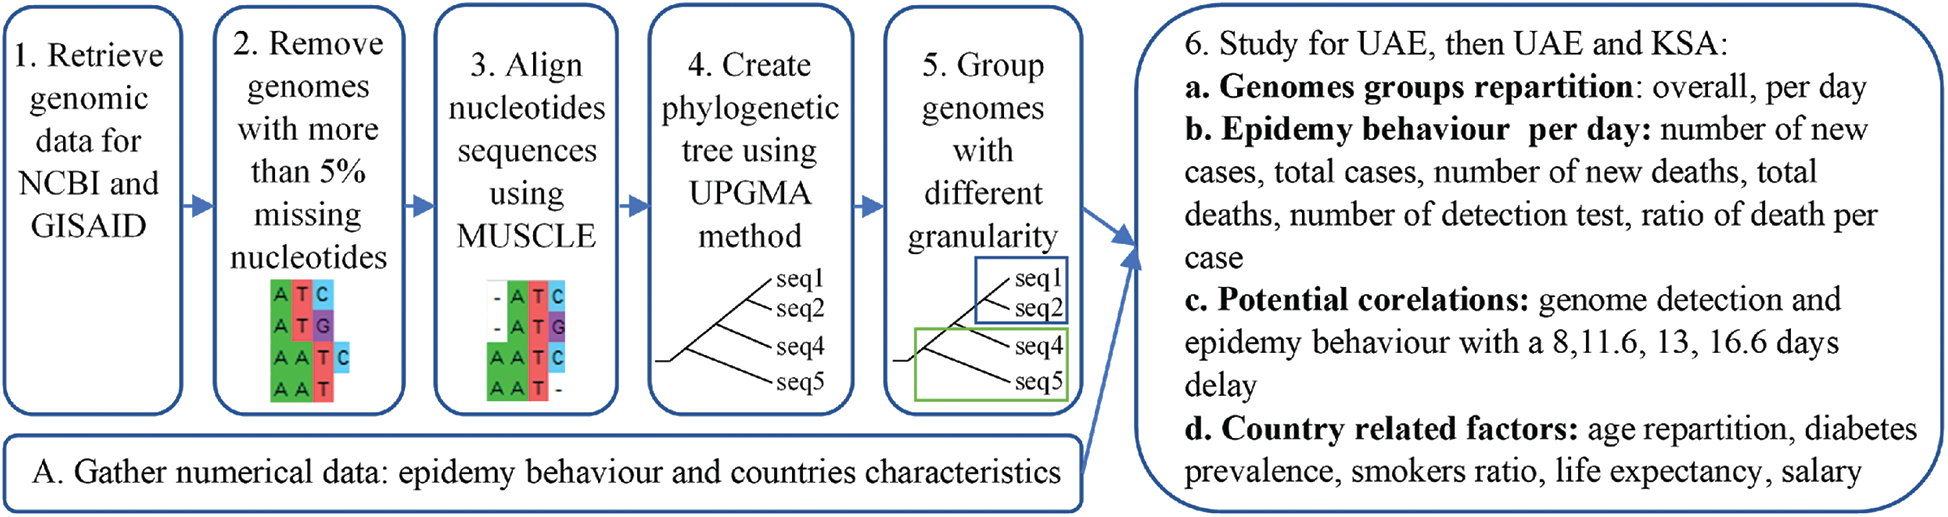
Figure 1: Resume of the methodology applied
The goal of this article is to analyse genomic mutations of the Covid-19 virus using groups of genomes based on their similarity instead of specific nucleotides or amino-acid proteins as it is usually performed [32]. Our work focuses specifically on the UAE, which is reported for the first time. It will also review how the UAE was exposed to the virus; the genome diversity observed during the first wave of the pandemic, the potential impact of the countermeasures against this diversity, the diversity observed with its impact at the country scale. The same analysis is also done for the Kingdom of Saudi Arabia (KSA) and compared with UAE.
Using groups of genomes instead of their nucleotides can reduce the time required to identify new variants of the virus. It can be used before the nucleotides exploration to reduce the scale of possibility and allow us to uncover more important mutations in shorter times. Perhaps, it can help avoid scenarios as the one currently faced by the UK and the world, amid the new variant of the virus, which was discovered after three months from its emergence [33].
There are many Covid-19 related research studies and analyses, but mostly focused on countries greatest affected with the pandemic including India, China, USA, Europe and more recently, with a particular focus on the UK, following the emergence of the new virus variant [34]. To the best of the authors’ knowledge, there is very little research on countries like the UAE, the KSA and the region as a whole. This paper focuses mainly on the case of the UAE, as required by the project funder, where the KSA is also considered due to its close geographical location and its differences in population repartition (larger country with less dense population), which allows the investigation of the potential impact of proximities. Further, the UAE and the KSA are important countries for the movement of people. The UAE is a principal hub between the east and the west, and the KSA is a religious destination for tens of millions of visitors from all around the world. The movement of people has a direct impact on the spread of this pandemic. In summary, the contributions of this study include:
1. The proposed methodology allowing for a quicker detection of the epidemiological impact of new Coronavirus variants, unlike existing approaches, which are time and resource consuming.
2. The first time for this analysis to be conducted for the UAE and the KSA.
3. Results which show, for the first time, a number of important insights about the Coronavirus genomic variations and their epidemiological impacts, which can help the government review its measures for controlling the spread of the infection.
4. A demonstration of the power of data-fusion for the intended purpose and highlights future directions for research.
The remainder of the paper is organised as follows: Section 2 describes the environment setup, the data sources and types. Section 3 describes the proposed methodology for all steps taken in the research. Section 4 presents the results and a comprehensive analysis of various correlations. Finally, Section 5 concludes the research work and discusses research limitations and future directions.
To execute this analysis, several sources of data were combined. We obtained permission to access and use mRNA genome sequences data from the GISAID database as presented in [35]. This includes 32 samples from the United Arab Emirates and 142 samples from the Kingdom of Saudi Arabia from January 29th, 2020 to May 4th, 2020. To identify the closest genomes to the one observed in China, the mRNA genome reference from NCBI database was also added to the genome dataset [36]. Even if the genome dataset contains sequences with up to 4.57% missing nucleotides, the majority were complete. As the genomes were grouped according to their similarities, all genomes were kept, reducing the impact of missing data. The genomic analysis was performed using the MEGA-X software [37]. As the goal of this article is to study correlations between genomic diversity and its potential impact on the epidemic, other statistical data related to the number of the cases and deaths were required. Hence, the number of cases and number of accumulated daily deaths was retrieved from ‘Our World in Data website’ [38]. The worldwide countermeasure tracker created by Oxford University [39] was then correlated with the observed genomic group. More specifically, the focus of this work is on the potential factors that could impact diversity in the genomes observed such as population lockdown and travel restrictions. Genomes were aligned and plotted using Mega-X, while structured data was analysed using Python 3 through plots.
First, genomic diversity was analysed using Mega-X as it is one of the main open-source software applications available for genomic analysis. The sequences were aligned using MUSCLE alignment [40]. As it can be observed in Fig. 1 part 3. The MUSCLE alignment allows for highlighting proximity between sequences, based on the mutations that occurred. However, the translated protein sequences might not correspond to the real protein’s sequences encountered. Nevertheless, Muscle alignment is one of the most used methods for sequences’ alignment and mutation tracking. The distance matrix was then computed, and the corresponding phylogenetic tree created using the UPGMA method [40]. Groups were visually identified using the phylogenetic tree, to avoid having too many groups. Groups with more than 30 samples were split into subgroups. After identifying the groups, the information about the genomes in each group (ID, Date, Location) were aggregated. Then the diversity was observed over time and location by creating a small dataset containing genome ID, location, group, and date. Subsequently, analysis was performed according to this data fusion.
The second phase allows for the observation of potential group repartition which changes according to time or location, or if it remains constant. Furthermore, the diversity of genomes was merged with the countermeasures using Python 3.7, such as lockdowns and air travelling restriction. The goal was to study potential impacts of these measures against the diversity observed. Finally, the diversity of the genomes was combined with the epidemy factor as to the evolution of the number of cases, deaths, recovery with their rates of fatality (death/cases) or the rate of recovery (recovery/cases). To do so, dates were used considering a potential margin of fifteen days as it corresponded to the average time of recovery. The goal was to search for the correlation between groups and the evolutions of these elements as it was observed for the mutation D614G.
For this purpose and in the case of the UAE, first we focused on the genomic diversity to study if some specific mutations were observed in the country, based on the samples retrieved. Second, we analysed the epidemiological behaviour, including nature and pattern for the first wave, search for potential factors that could have impacted the observed behaviours (mutations observed, diversity, risk factors etc.), and finally, we compared the UAE with the KSA, for any similarities, otherwise, why there were differences. In order not to confuse the reader, all groups of genomes were defined based on the fusion of all genomic data as illustrated in Fig. 10. In summary, the research methodology is divided into seven main steps as illustrated in Fig. 1.
The genomes sequences in the UAE were retrieved during the beginning of the pandemic in the country. These genomes revealed which SARS-CoV-2 genomes were detected in the UAE and their different variants. This dataset has already been used in order to understand the source of these genomes [41]. Therefore, in this article, we focused more on the potential impact of this diversity.
The UAE genome dataset showed a repartition into four main groups with two dominants, named herein, G0_d and G0_e, which are the closest groups to the genomes observed in China as presented in Fig. 3. Even after dividing these groups further, G0_d1 remained the most noted subgroup of the genomes as depicted in Fig. 2, while the different groups illustrate the shared ancestors or mutations that were observed. Furthermore, it can be observed that some genomes are more isolated than others as for the EPI_ISL_463740. This difference could correspond to either an imported case that did not spread in the UAE, isolation of the case, genomic characteristics that led to a low spread of the infection, low appearance during the sequencing period, or due to milder symptoms on the infected people. It also appears from Fig. 4 that G0_d was mainly observed at the beginning of the sequencing dates, then it was overtaken by G0_e before both groups stabilised. A possible explanation could be that G0_d and G0_e were both introduced by travellers, which led to a time localised cluster followed by a lower spread of infection. In other words, as the number of people infected were in closed environments during their travels, the virus had the opportunity to spread quickly to other passengers as the correlation between international travelling and epidemic spread risk was proved in [42]. However, due to the repartition of the sample, this stabilisation could also have been due to unrelated factors as there was not enough data to prove it. Moreover, even in subgroups, it appears that repartition of the genomes seemed to change over time. A possible explanation is that the government handled the epidemic well and successfully isolated infected cases to reduce its spread. However as for G0_e3, the number of genomes rose, which could be either due to a possibility that the first detected cases did not correspond to the first cases detected in the country and it has spread before being identified or that the countermeasures did not succeed to maintain the spread or else the restrictions put in place were not respected or perhaps several cases were imported a few days apart.
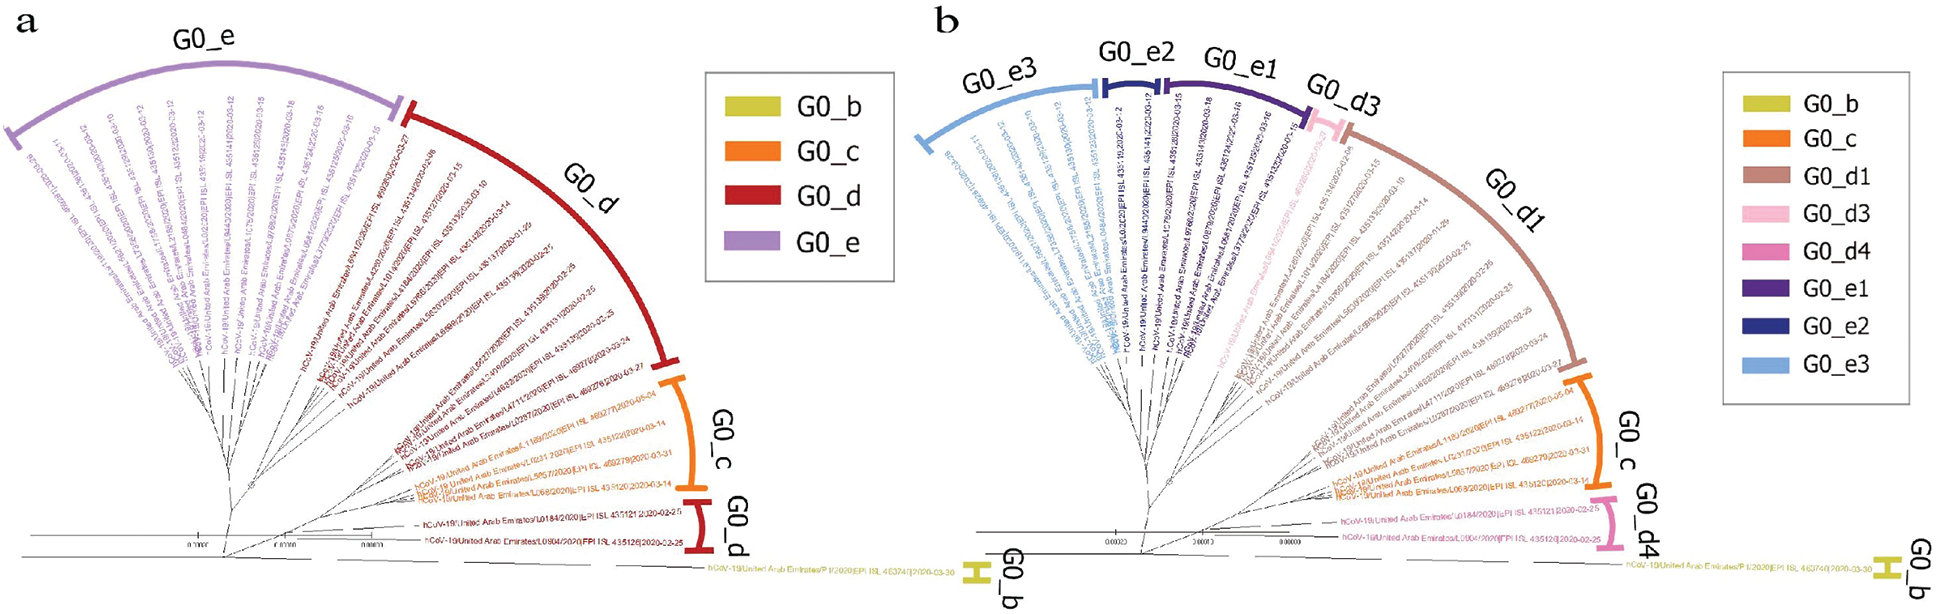
Figure 2: Radial phylogenetic tree of UAE Covid-19 of (a) G0 subgroups; (b) smallest groups identified
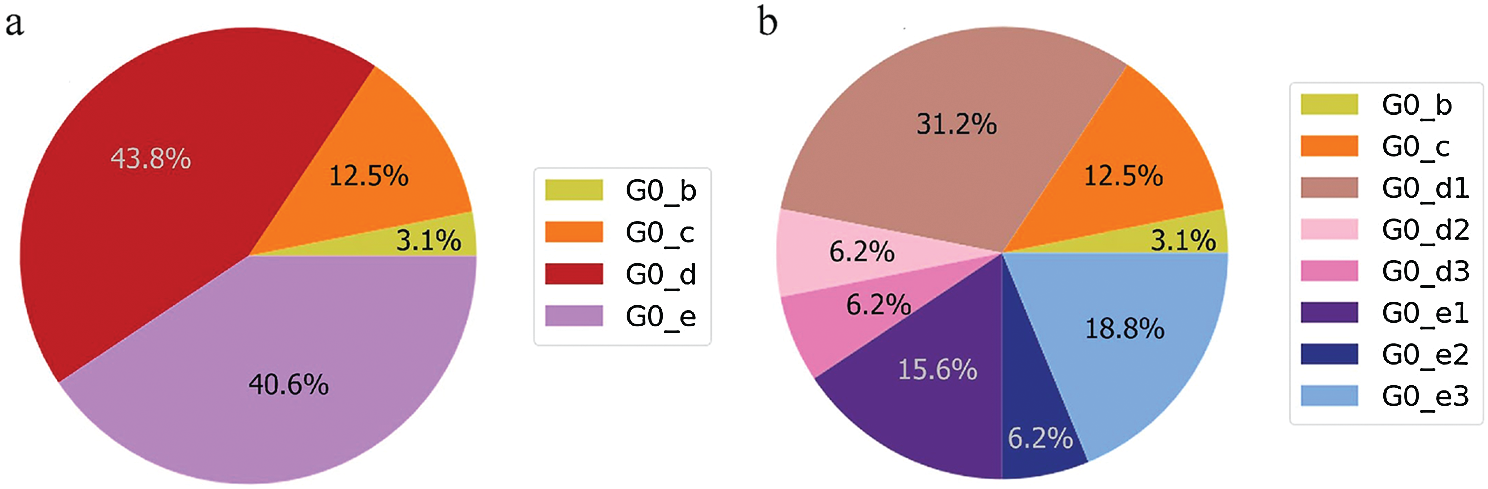
Figure 3: Genome diversity in UAE (a) in G0; (b) in minimal size groups
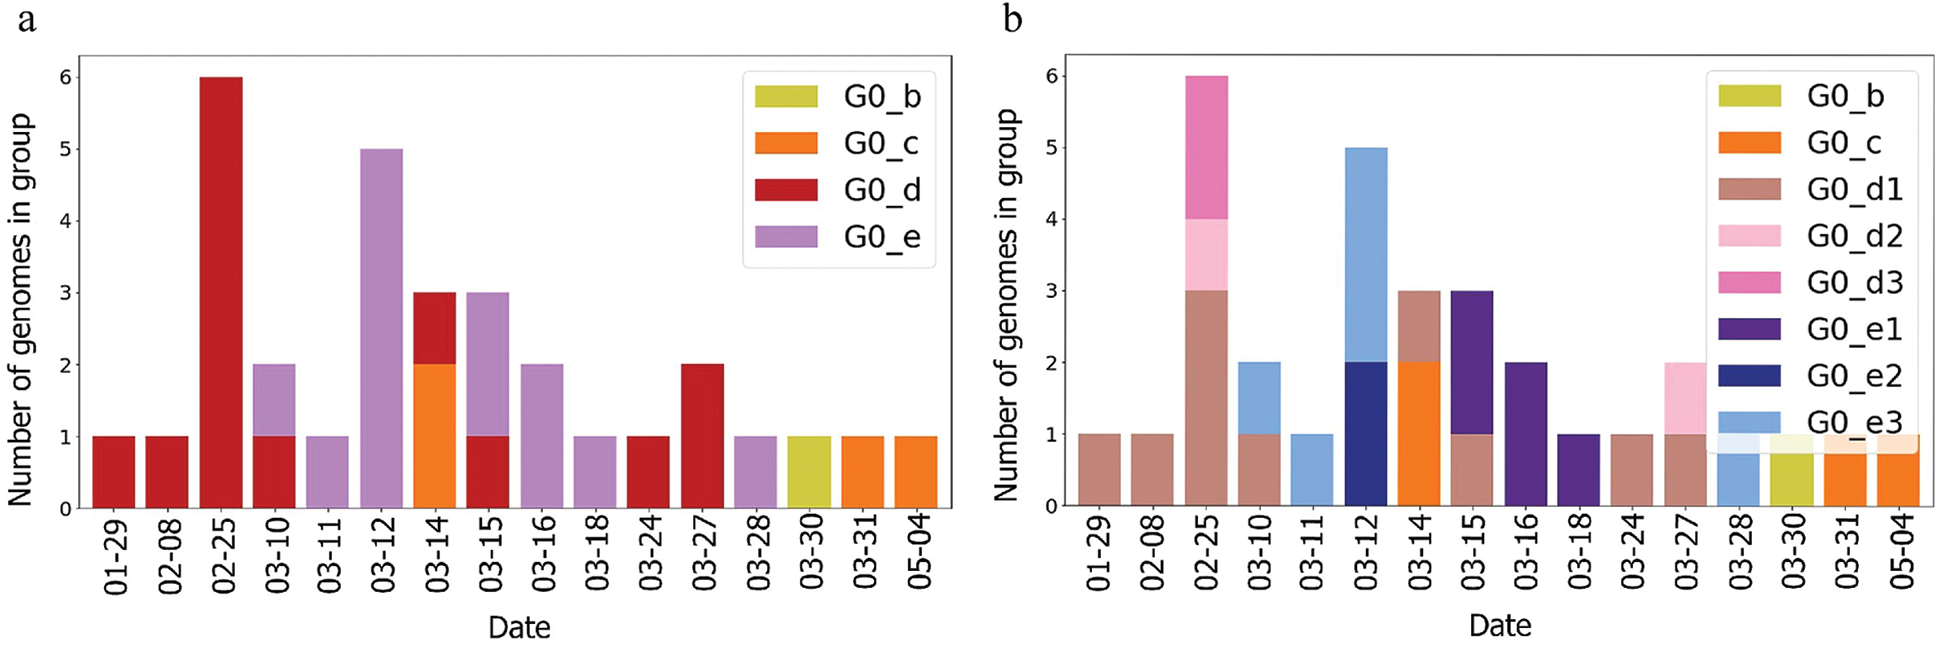
Figure 4: Genome diversity in UAE over time (a) in G0; (b) in minimal size groups
4.2 Epidemy Behaviour in United Arab Emirates
From the epidemy behaviour analysis displayed in Fig. 5, it appears that three different steps in the propagation were observed. These steps correspond to the time when the number of cases increased as it was observed on the 4th of April 2020 and the 7th of May 2020. As mass testing began on the 10th of April 2020 in UAE, it is suggested that this rise of cases was due to an event that happened five days before, as it corresponded to the average delay of the incubation period reported in [43]. However, no correlation was observed between the genome’s introduction and the number of cases. Still, the number of deaths per case does not follow the same pattern. It can be observed that this curve contains three different spikes on the 23rd of March 2020, the 1st of April 2020 and the 13th of May 2020. On these dates, the cases were higher than the other dates. Moreover, they do not correspond to a specific event such as the beginning of the week, or a weekend, and these spikes are more likely linked to a delay in information sharing.
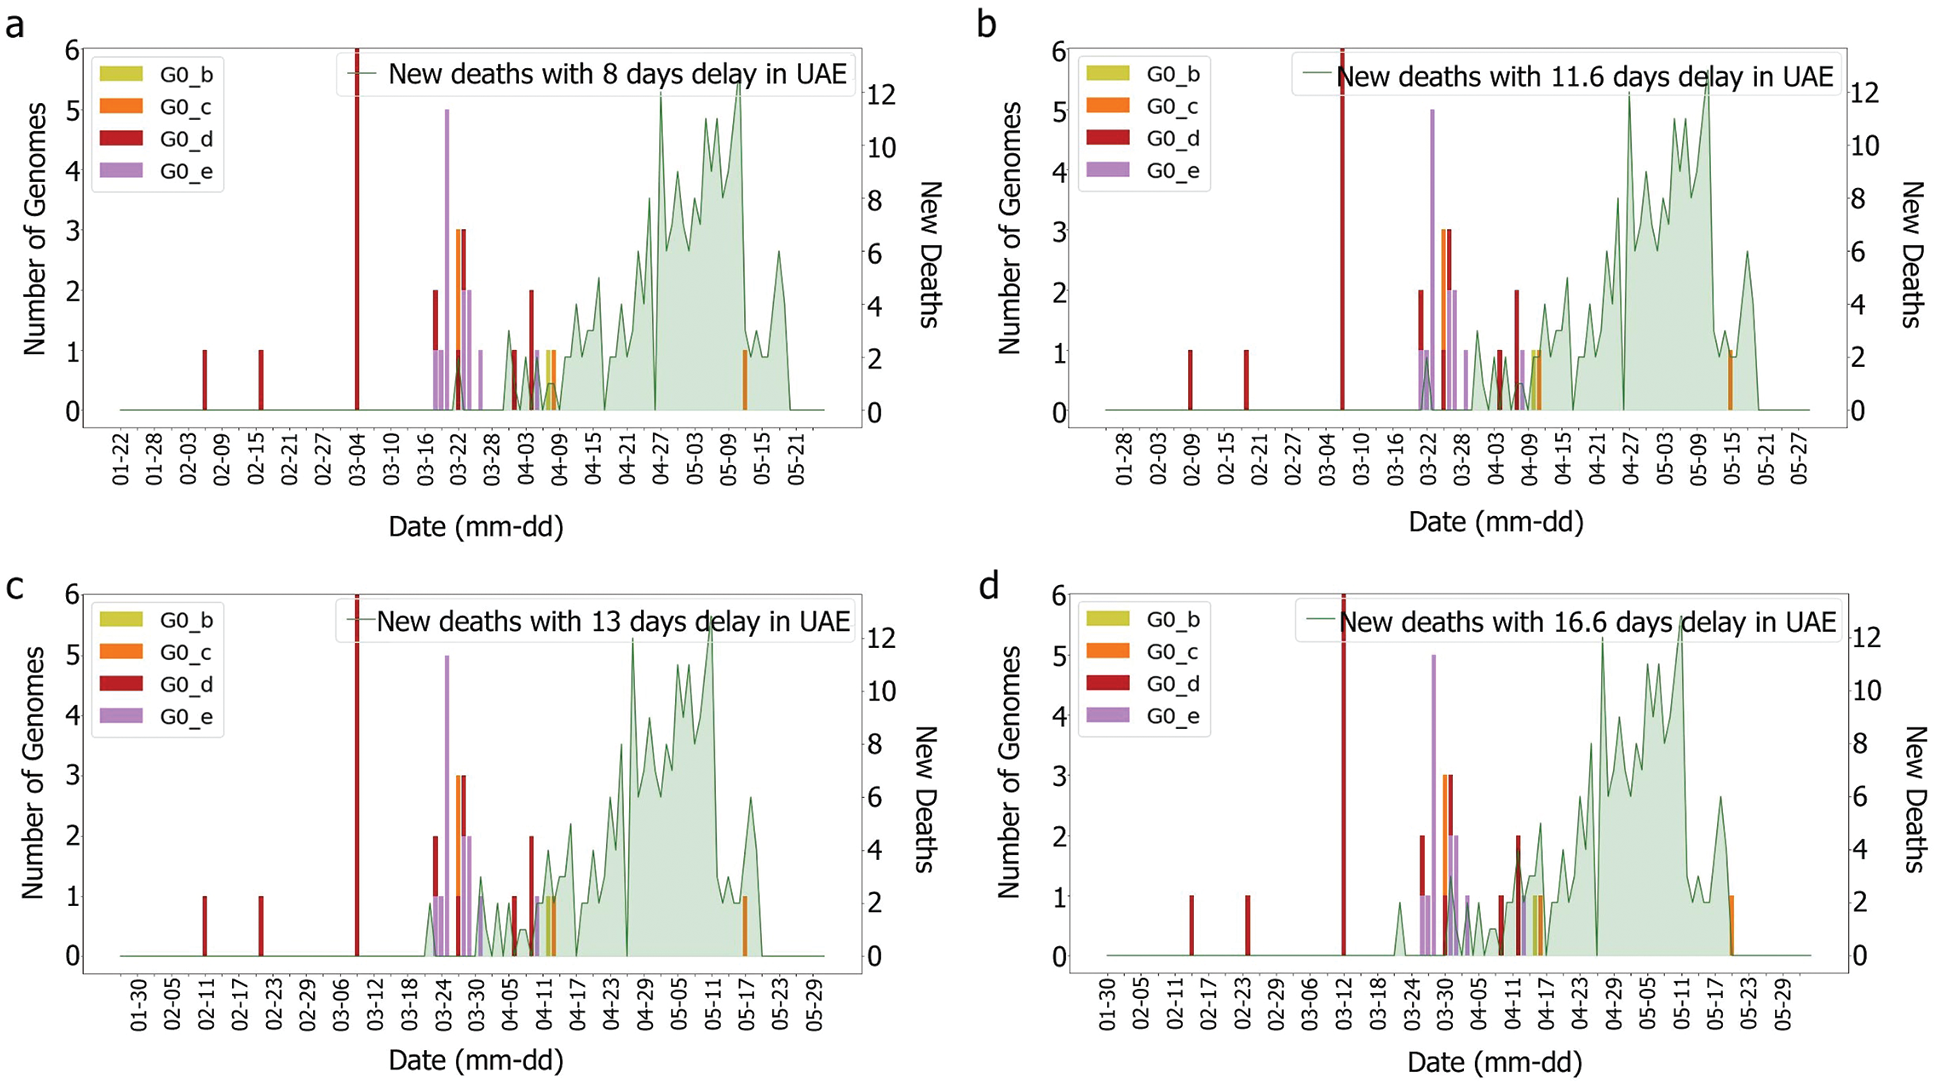
Figure 5: Death and genomes changes with (a) 8, (b) 11.6; (c) 13, (d) 16.6 days delay for G0 subgroups
According to [44], the average delay between the appearance of symptoms and deaths is approximately eight days. The KSA, for instance, showed a delay of 11.6 days [44]. Both intervals were tested with and without the incubation periods. It was difficult to correlate death rates with genomes, as illustrated in Figs. 6 and 7, which were obtained by plotting death rates per case. Instead, it seems that some other factors had an impact upon the fatality rate, otherwise, we would have expected a more unified graph. As the first rise was observed more than one month after the introduction of G0_d1, it can be suggested that this genome group did not have an impact on the results shown in Figs. 8 and 9. Moreover, using the intervals of 11.6 and 16.6 days, a potential correlation between genomic diversity and death/cases rate appears. Indeed, if the first picture corresponds to the introduction of G0_e, the second one could correspond to the cases linked to the G0_e introduction in the country. In other words, if the first picture corresponds to G0_e introduction, the second one could correspond to the person that was infected by that cluster. As the cluster was probably quickly identified and their contacts informed, only two waves were observed.
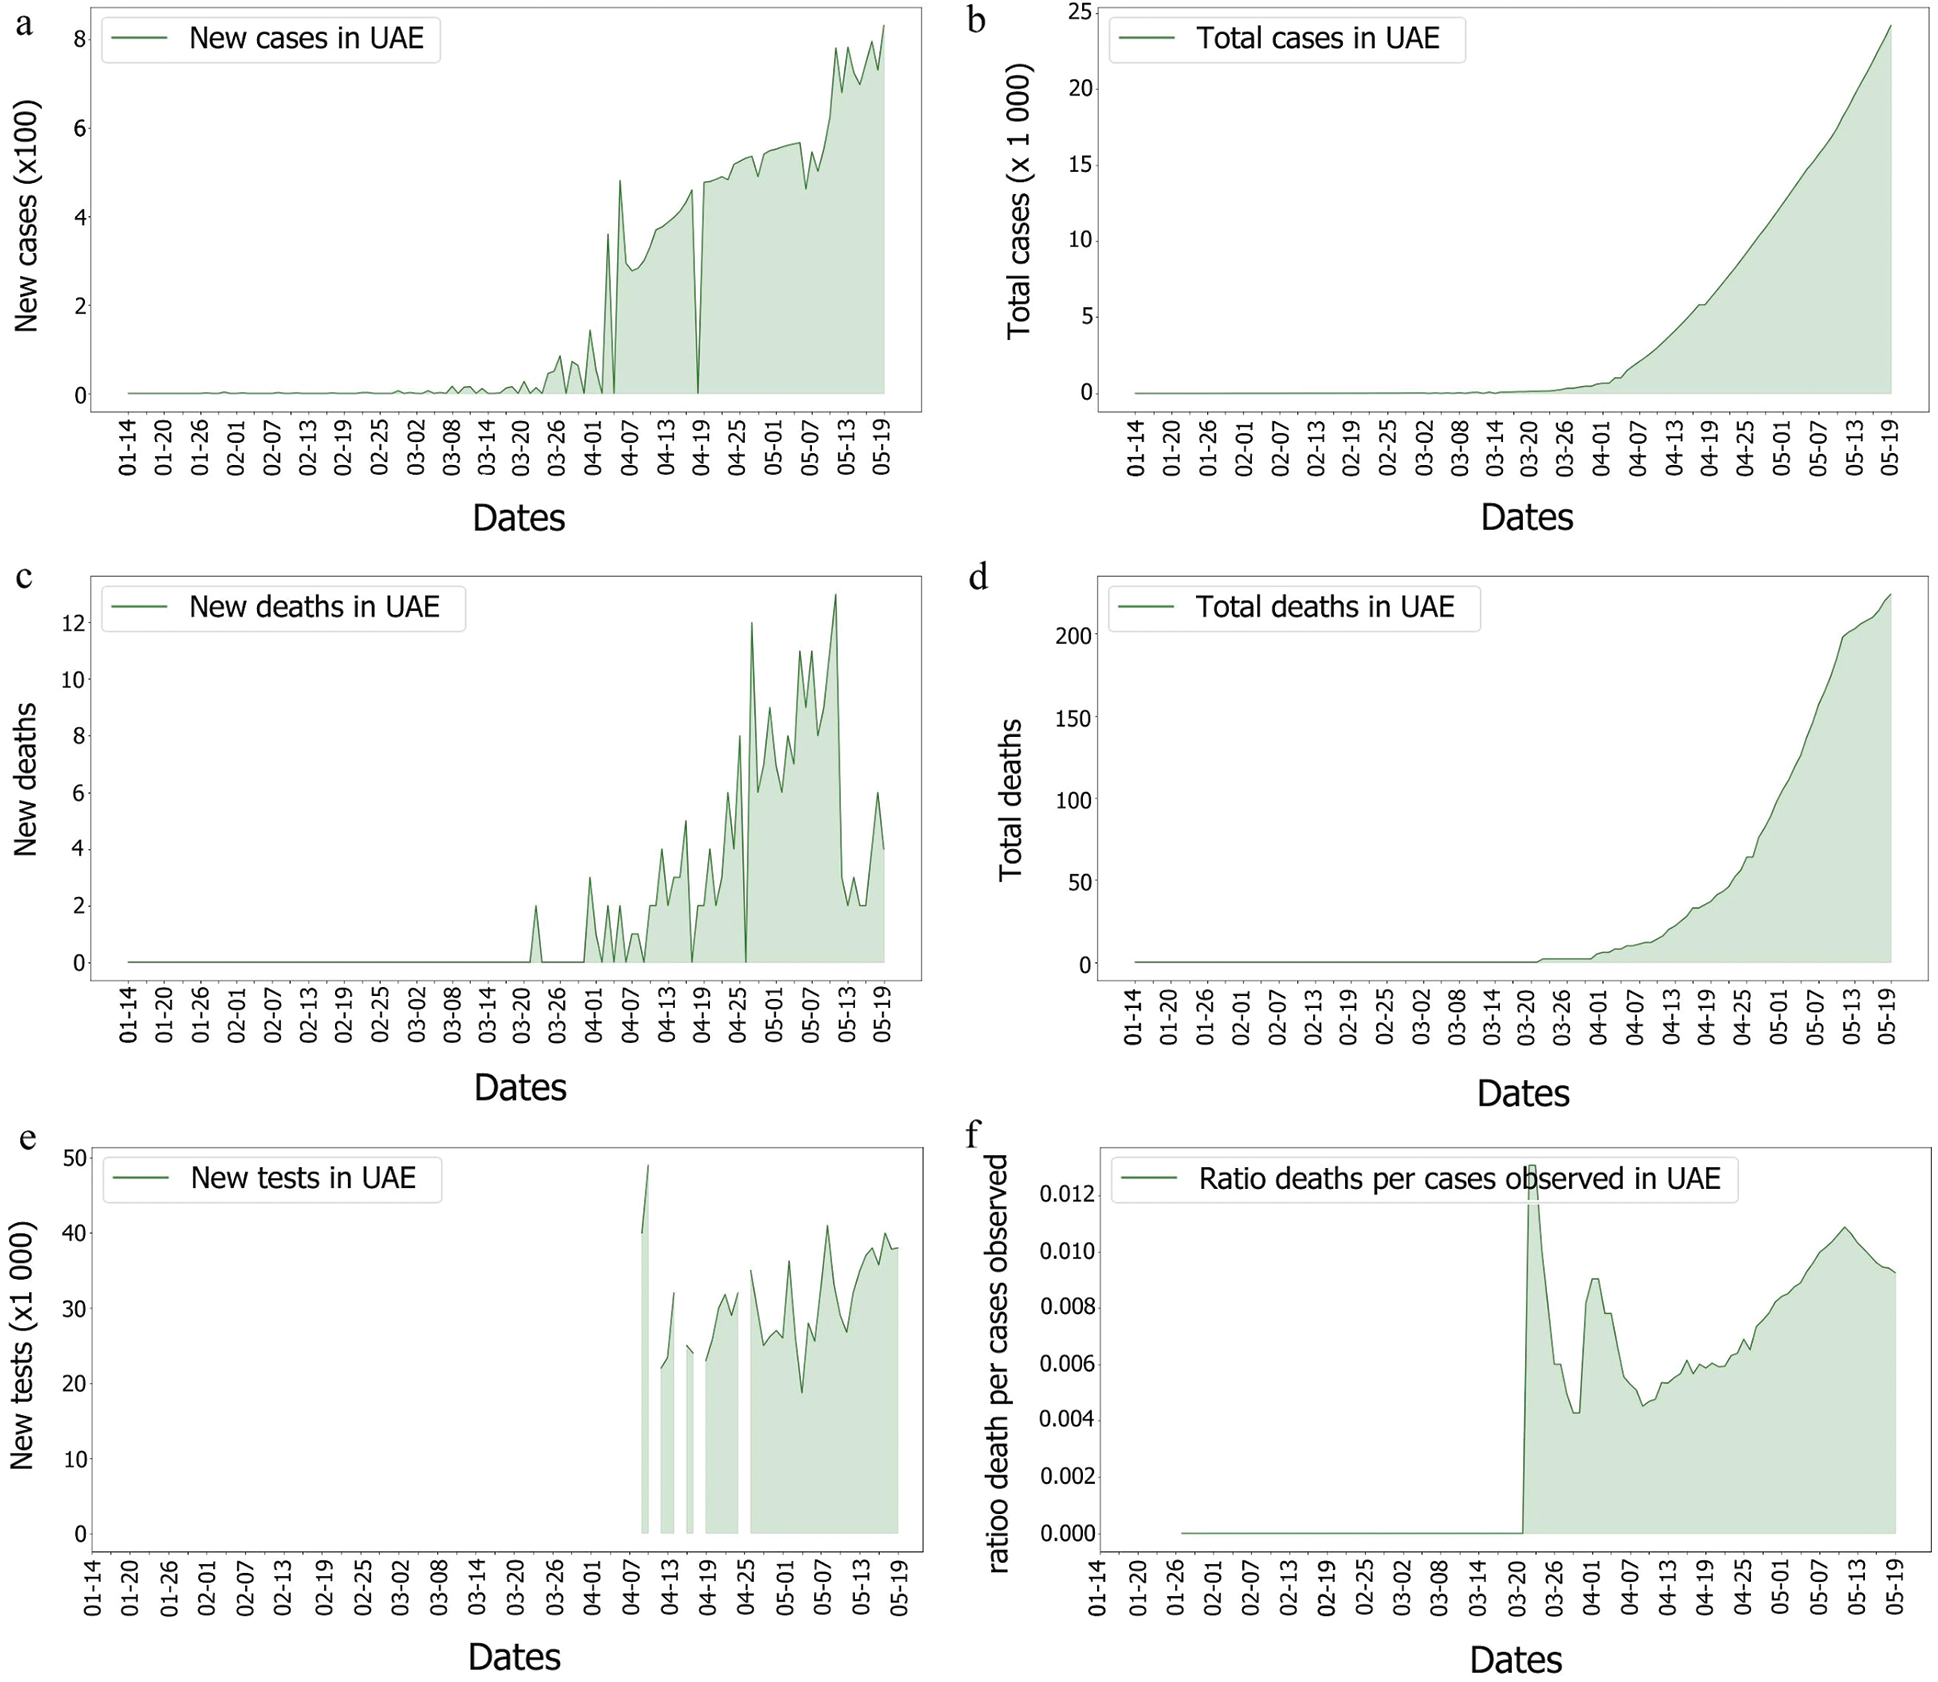
Figure 6: Covid-19 cases, death and tests rates in UAE
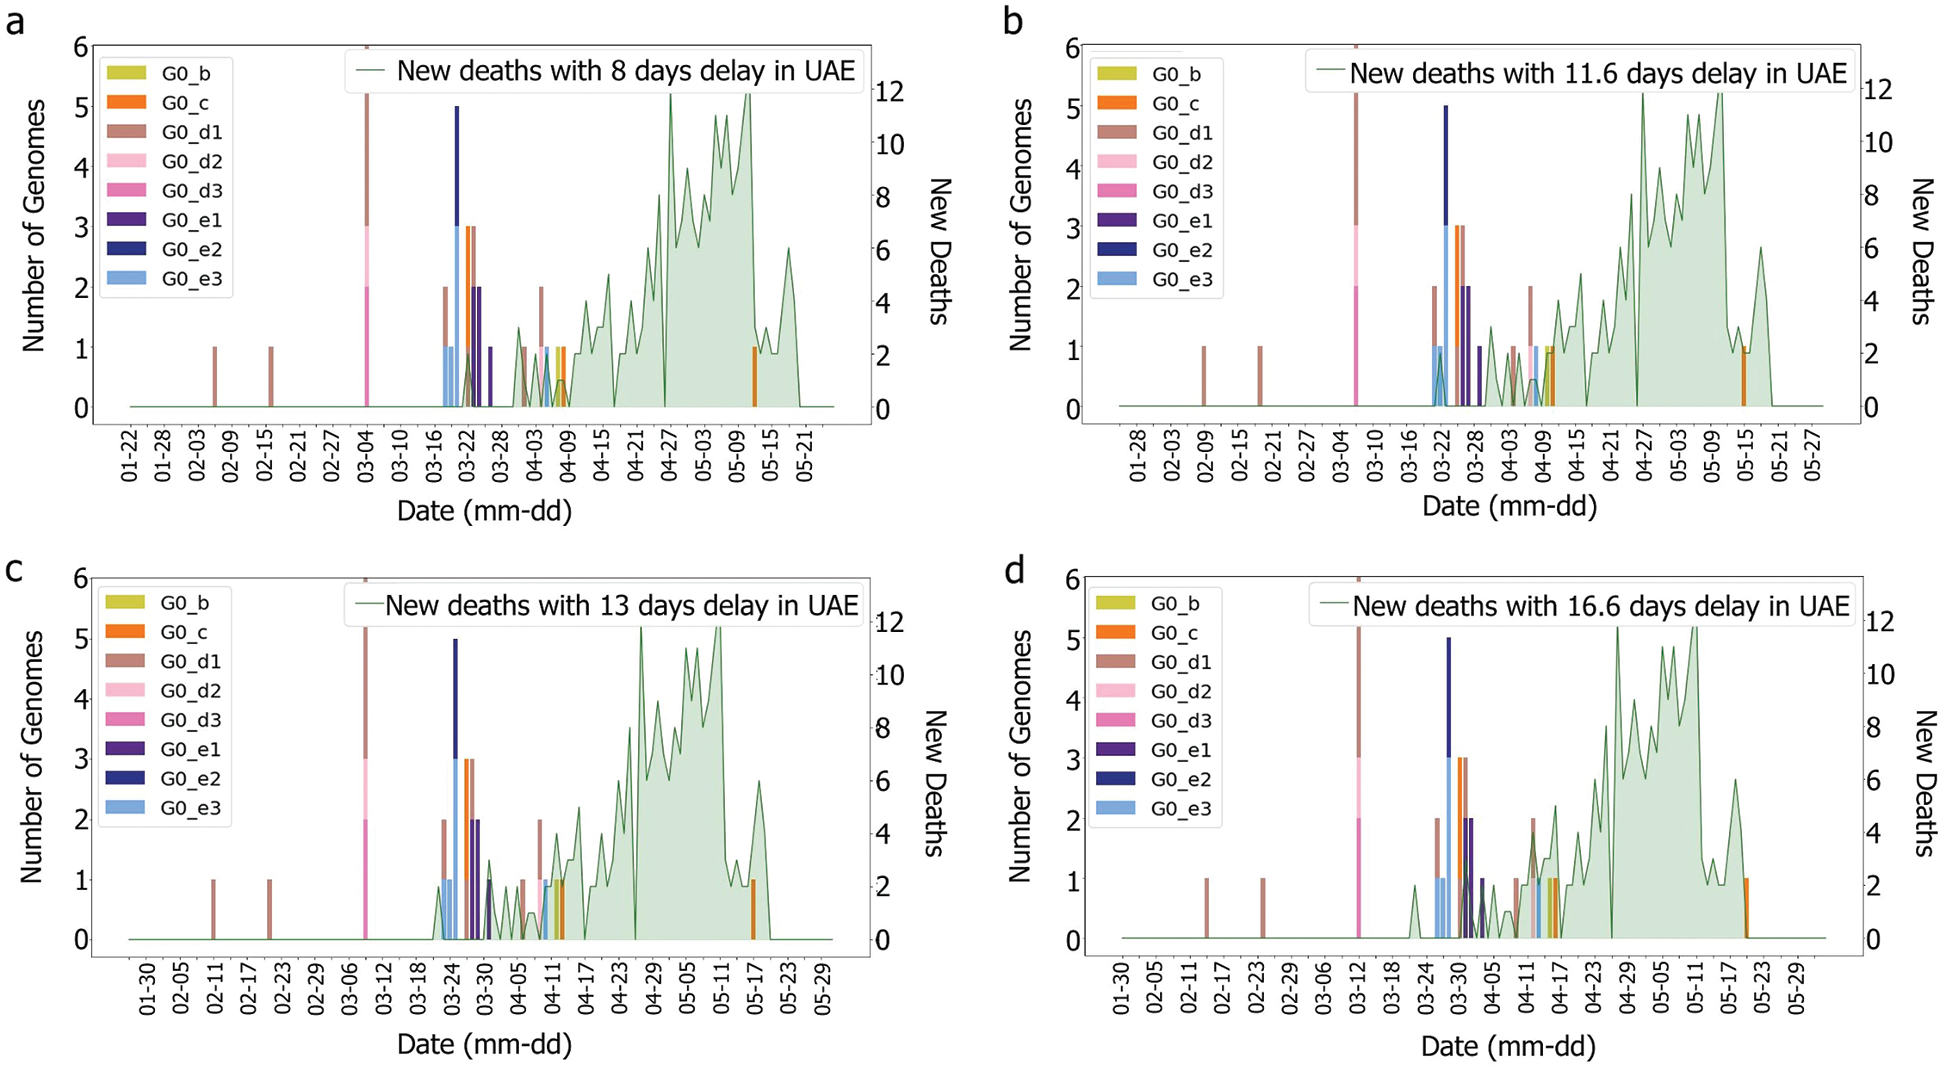
Figure 7: Death and genomes changes with (a) 8, (b) 11.6; (c) 13, (d) 16.6 days delay for min subgroup
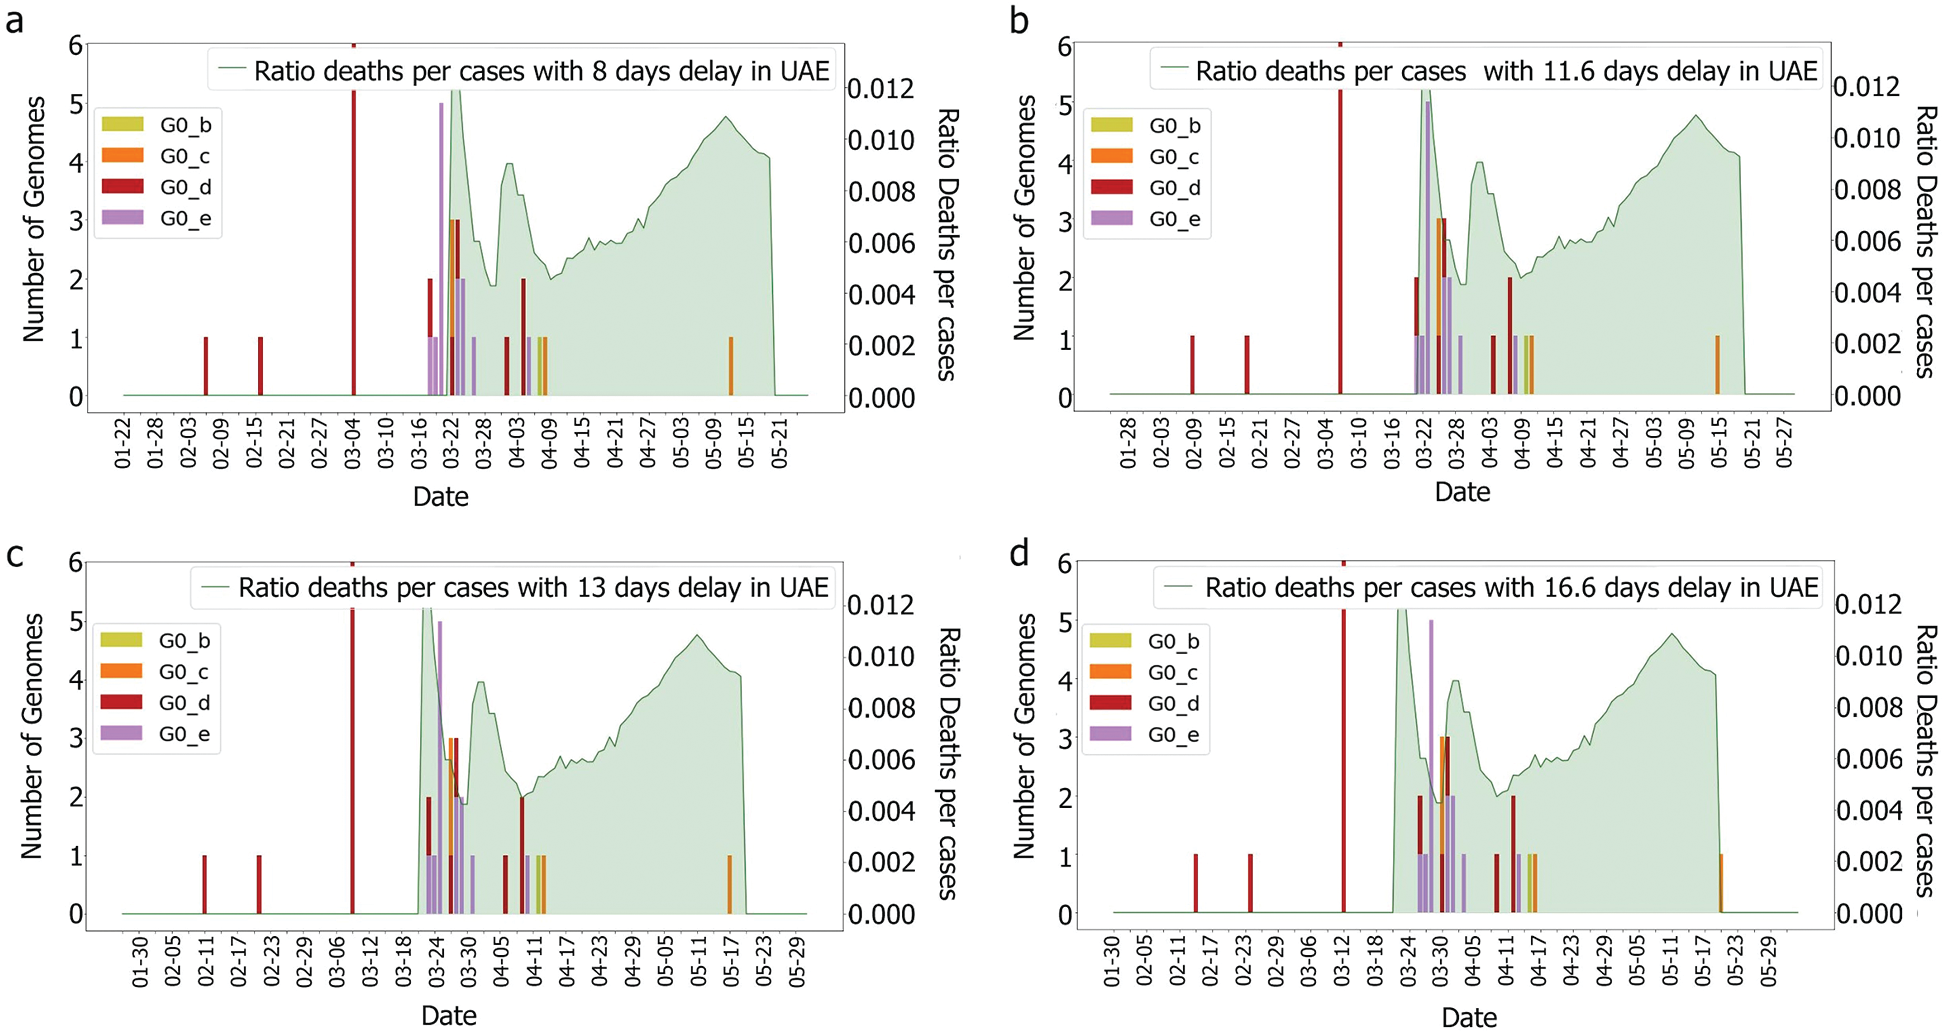
Figure 8: Deaths/cases and genomes with (a) 8, (b) 11.6 (c) 13, (d) 16.6 days delay for G0 subgroup
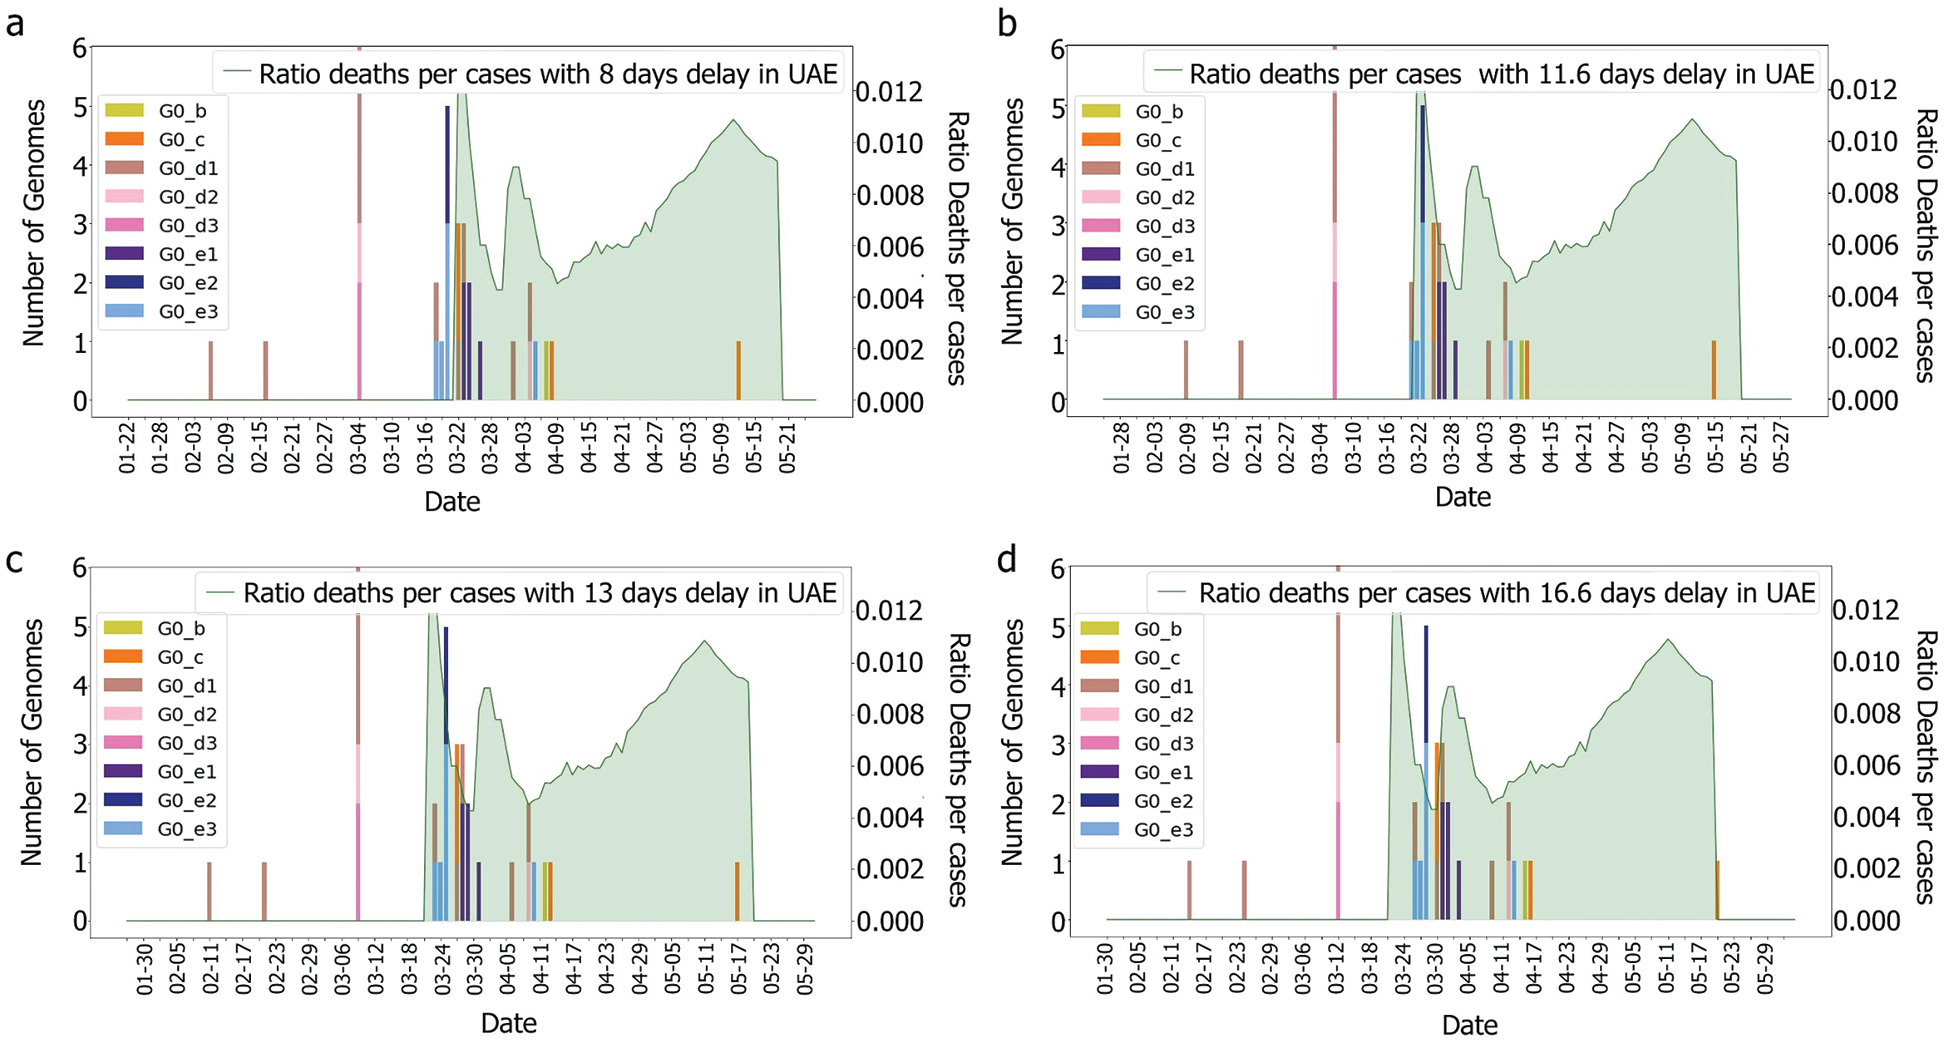
Figure 9: Deaths/cases and genomes with (a) 8, (b) 11.6 (c) 13, (d) 16.6 days delay for min group
As we do not have enough information to ensure that these cases correspond to the G0_e genome group, further study is required. However, if these characteristics are not observed in the other countries that faced the epidemic with similar specifications (close geographical location, similar curve for the number of cases), then it could be possible to highlight a correlation between the genomic diversity and the epidemy characteristics in a country. Indeed, even if a single mutation could change the behaviour of the virus, grouping the genomes would allow the observation of trends and new emerging groups.
A correlation between the lockdown and the rise of cases could be suggested, however, this relationship should not impact the ratio of death per case, except, if it was due to some restrictions. To ensure this theory, it was required to look at the countermeasures taken by the government. To test this genomic correlation with the fatality rate, the UAE was compared to the KSA.
4.3 United Arab Emirates Compared to Kingdom of Saudi Arabia
The KSA is one of the neighbouring countries to the UAE. Furthermore, it has gathered more genomes than UAE. The genome repartition showed two groups of genomes G1 and G2, which correspond to a new speciation of the SARS-CoV-2, which were not observed in the UAE, as shown in Figs. 2 and 10. These groups correspond to mutations perceived of more than 1% compared to the Chinese observed genomes. Even if this distance is low, considering the length of the reference genome, it represents around 299 mutations (considering each nucleotide missing/added as a mutation) using as a reference the length of the Chinese genome.
Still the main part of the genomes is localised in G0 but with a different repartition as the main subgroup is G0_e. Furthermore, compared to the UAE, GO_e3 and G0_e1 are not the dominant subgroups of G0_e. In fact, as shown in Fig. 11, the main subgroup observed in G0_e is G0_e9. The absence of the G0_c can also be noted at this point. Though only 190 genomes were retrieved between the 29th of January 2020 and the 4th of May 2020, some other groups might exist but were not observed or sequenced. Grouping the genomes according to division of the phylogenetic tree allowed the creation of groups based on their shared ancestors. Due to the presence of both G0_e groups in the UAE and SA, the previous hypothesis linking this group to the fatality wave seems less probable as only one wave was observed in the KSA, (Fig. 14). However, as another group of genomes or a specific subgroup of G0_e could be linked to it, the potential correlation between the genomic diversity and the epidemy behaviour was studied in the KSA. The spread of the infection showed to be more controlled in the KSA compared to the UAE over time, (Fig. 12).
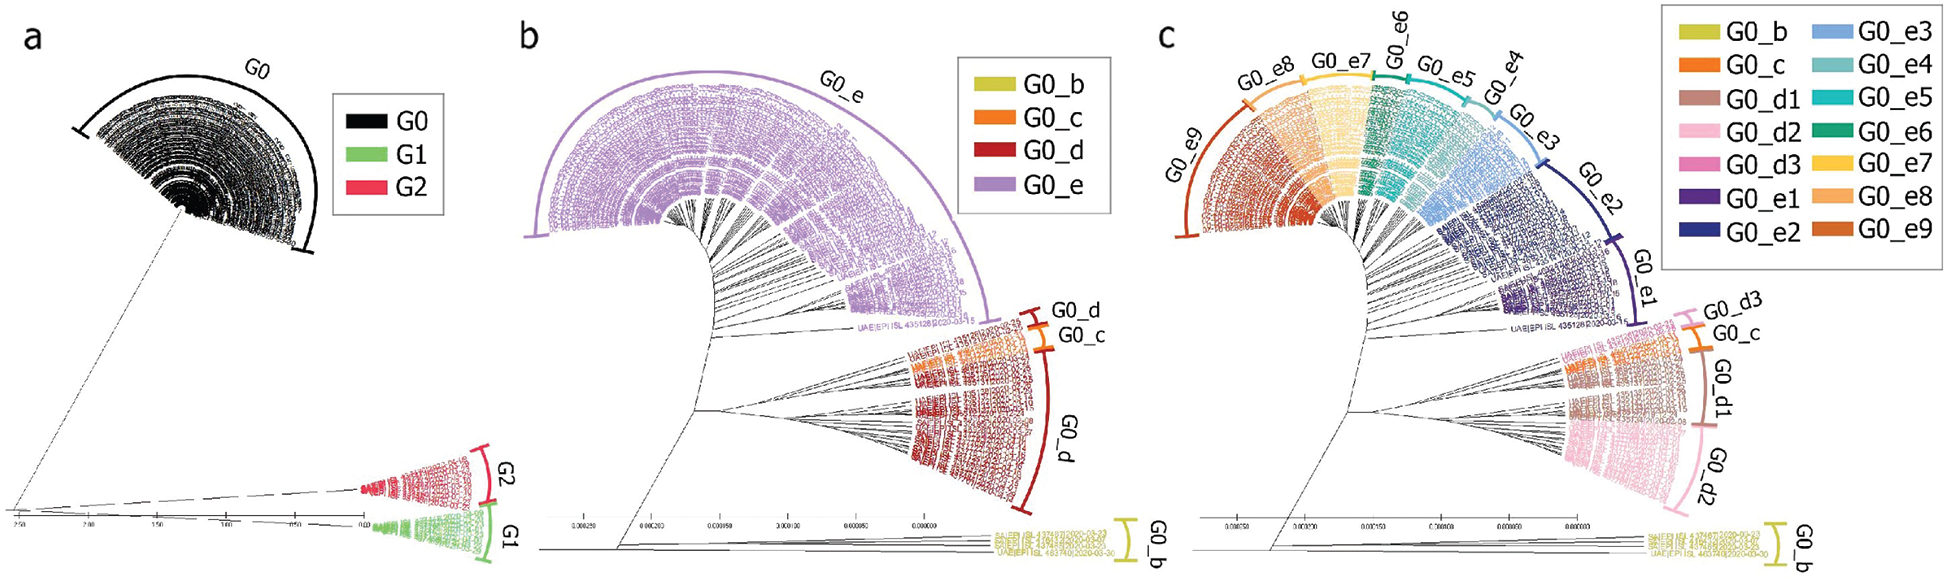
Figure 10: Radial phylogenetic tree view of (a) all genomes; (b) G0 detailed; (c) G0_d and G0_e detailed
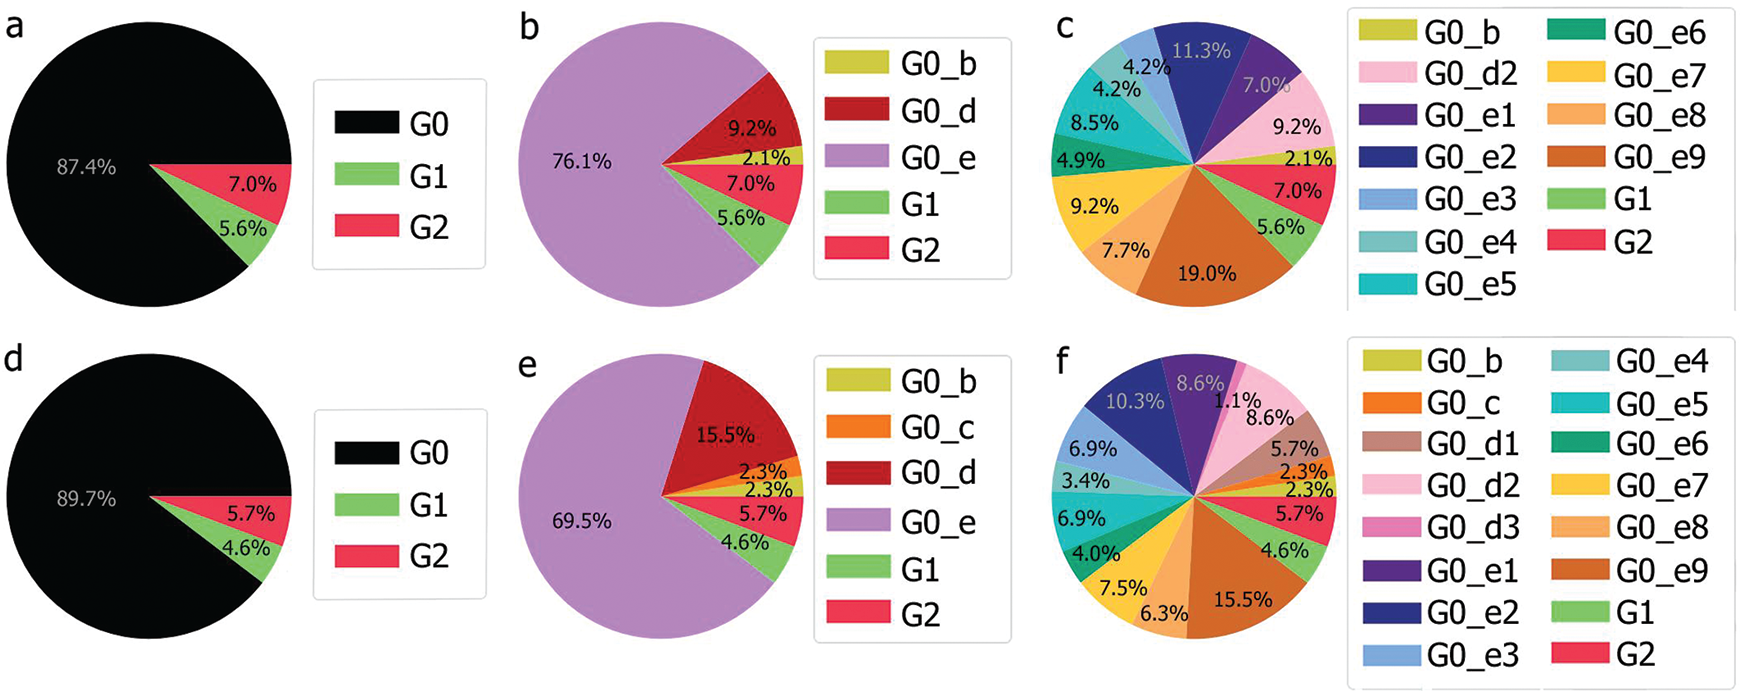
Figure 11: Genomic repartition G0, G0_d and G0_e in the KSA (a–c) and in the UAE and the KSA (d–f)
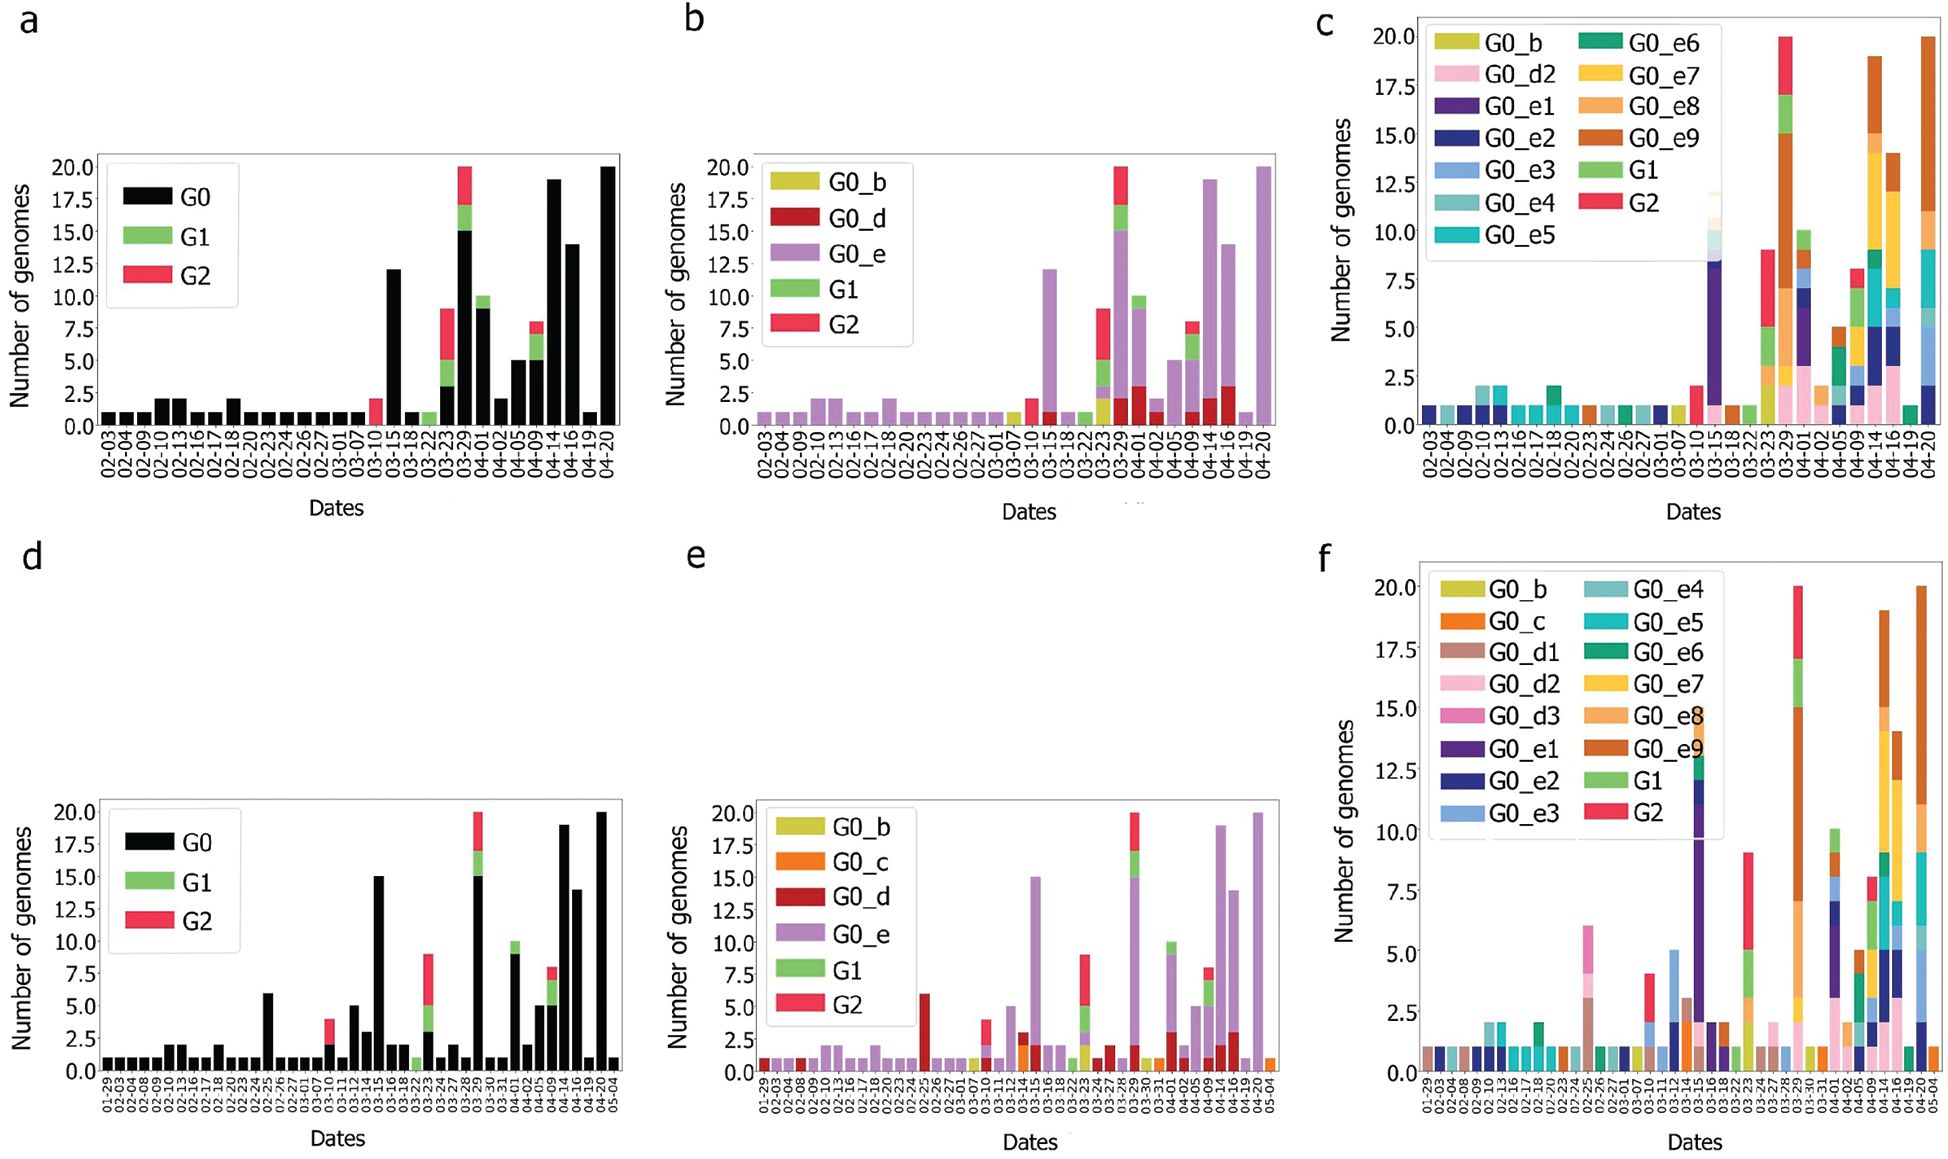
Figure 12: Genome diversity over time for G0, G0_d, G0_e in KSA (a–c) and in UAE & KSA (d–f)
4.4 United Arab Emirates Epidemy Behaviour Compared to Kingdom of Saudi Arabia Epidemy Behaviour
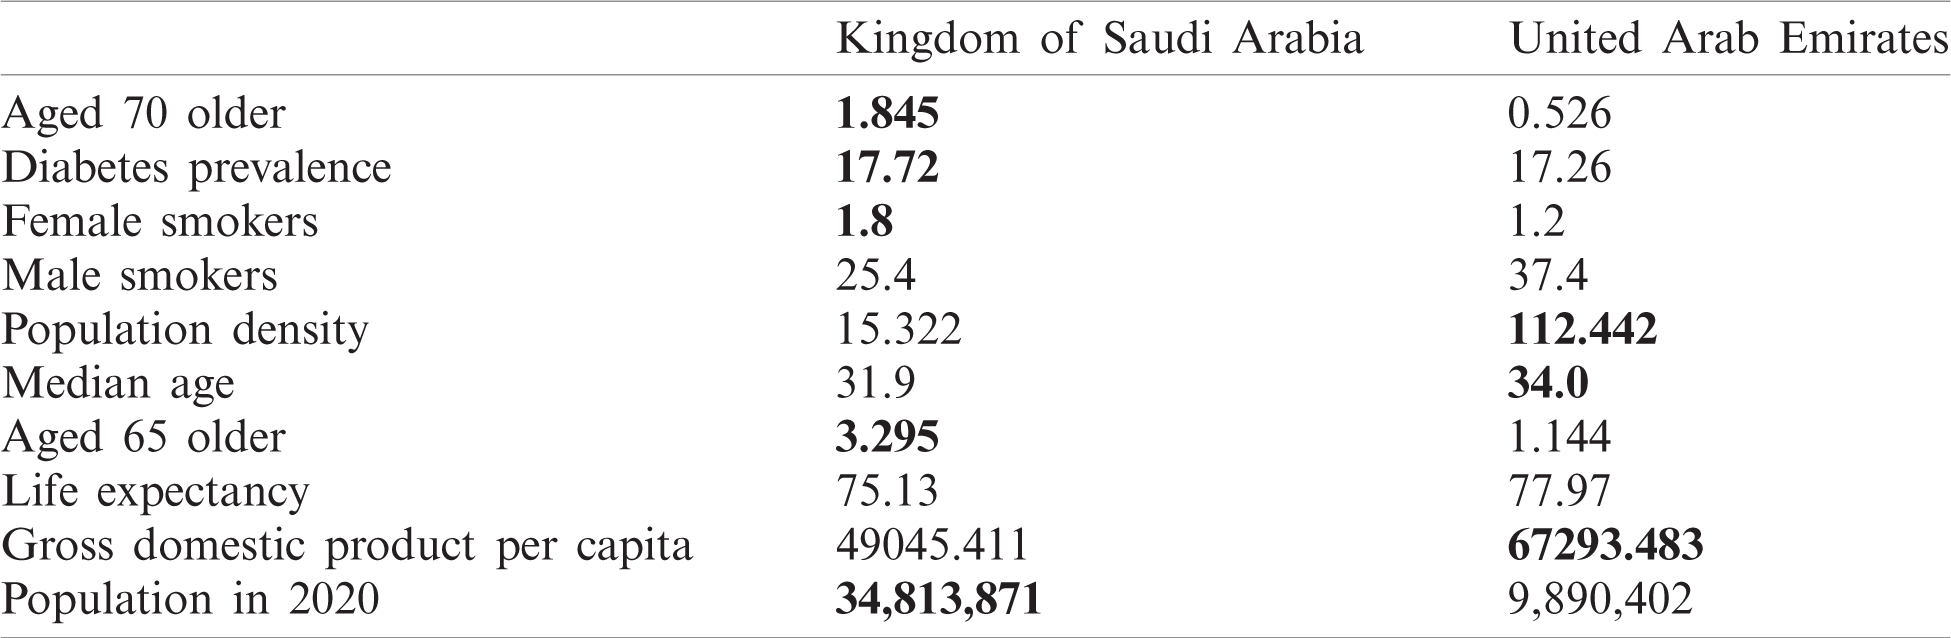
As can be observed in Fig. 13, UAE and KSA shared a similar behaviour for the number of cases and number of deaths per millions inhabitant which looked exponential. However, Fig. 14 showed clearly some divergence in terms of death rates. According to Fig. 13, it appears that the epidemy was more prevalent in UAE than KSA at its commencement. This is based on the number of cases and death per millions which are higher which could be linked to the population density as observed in Tab. 1 based on [45,46].
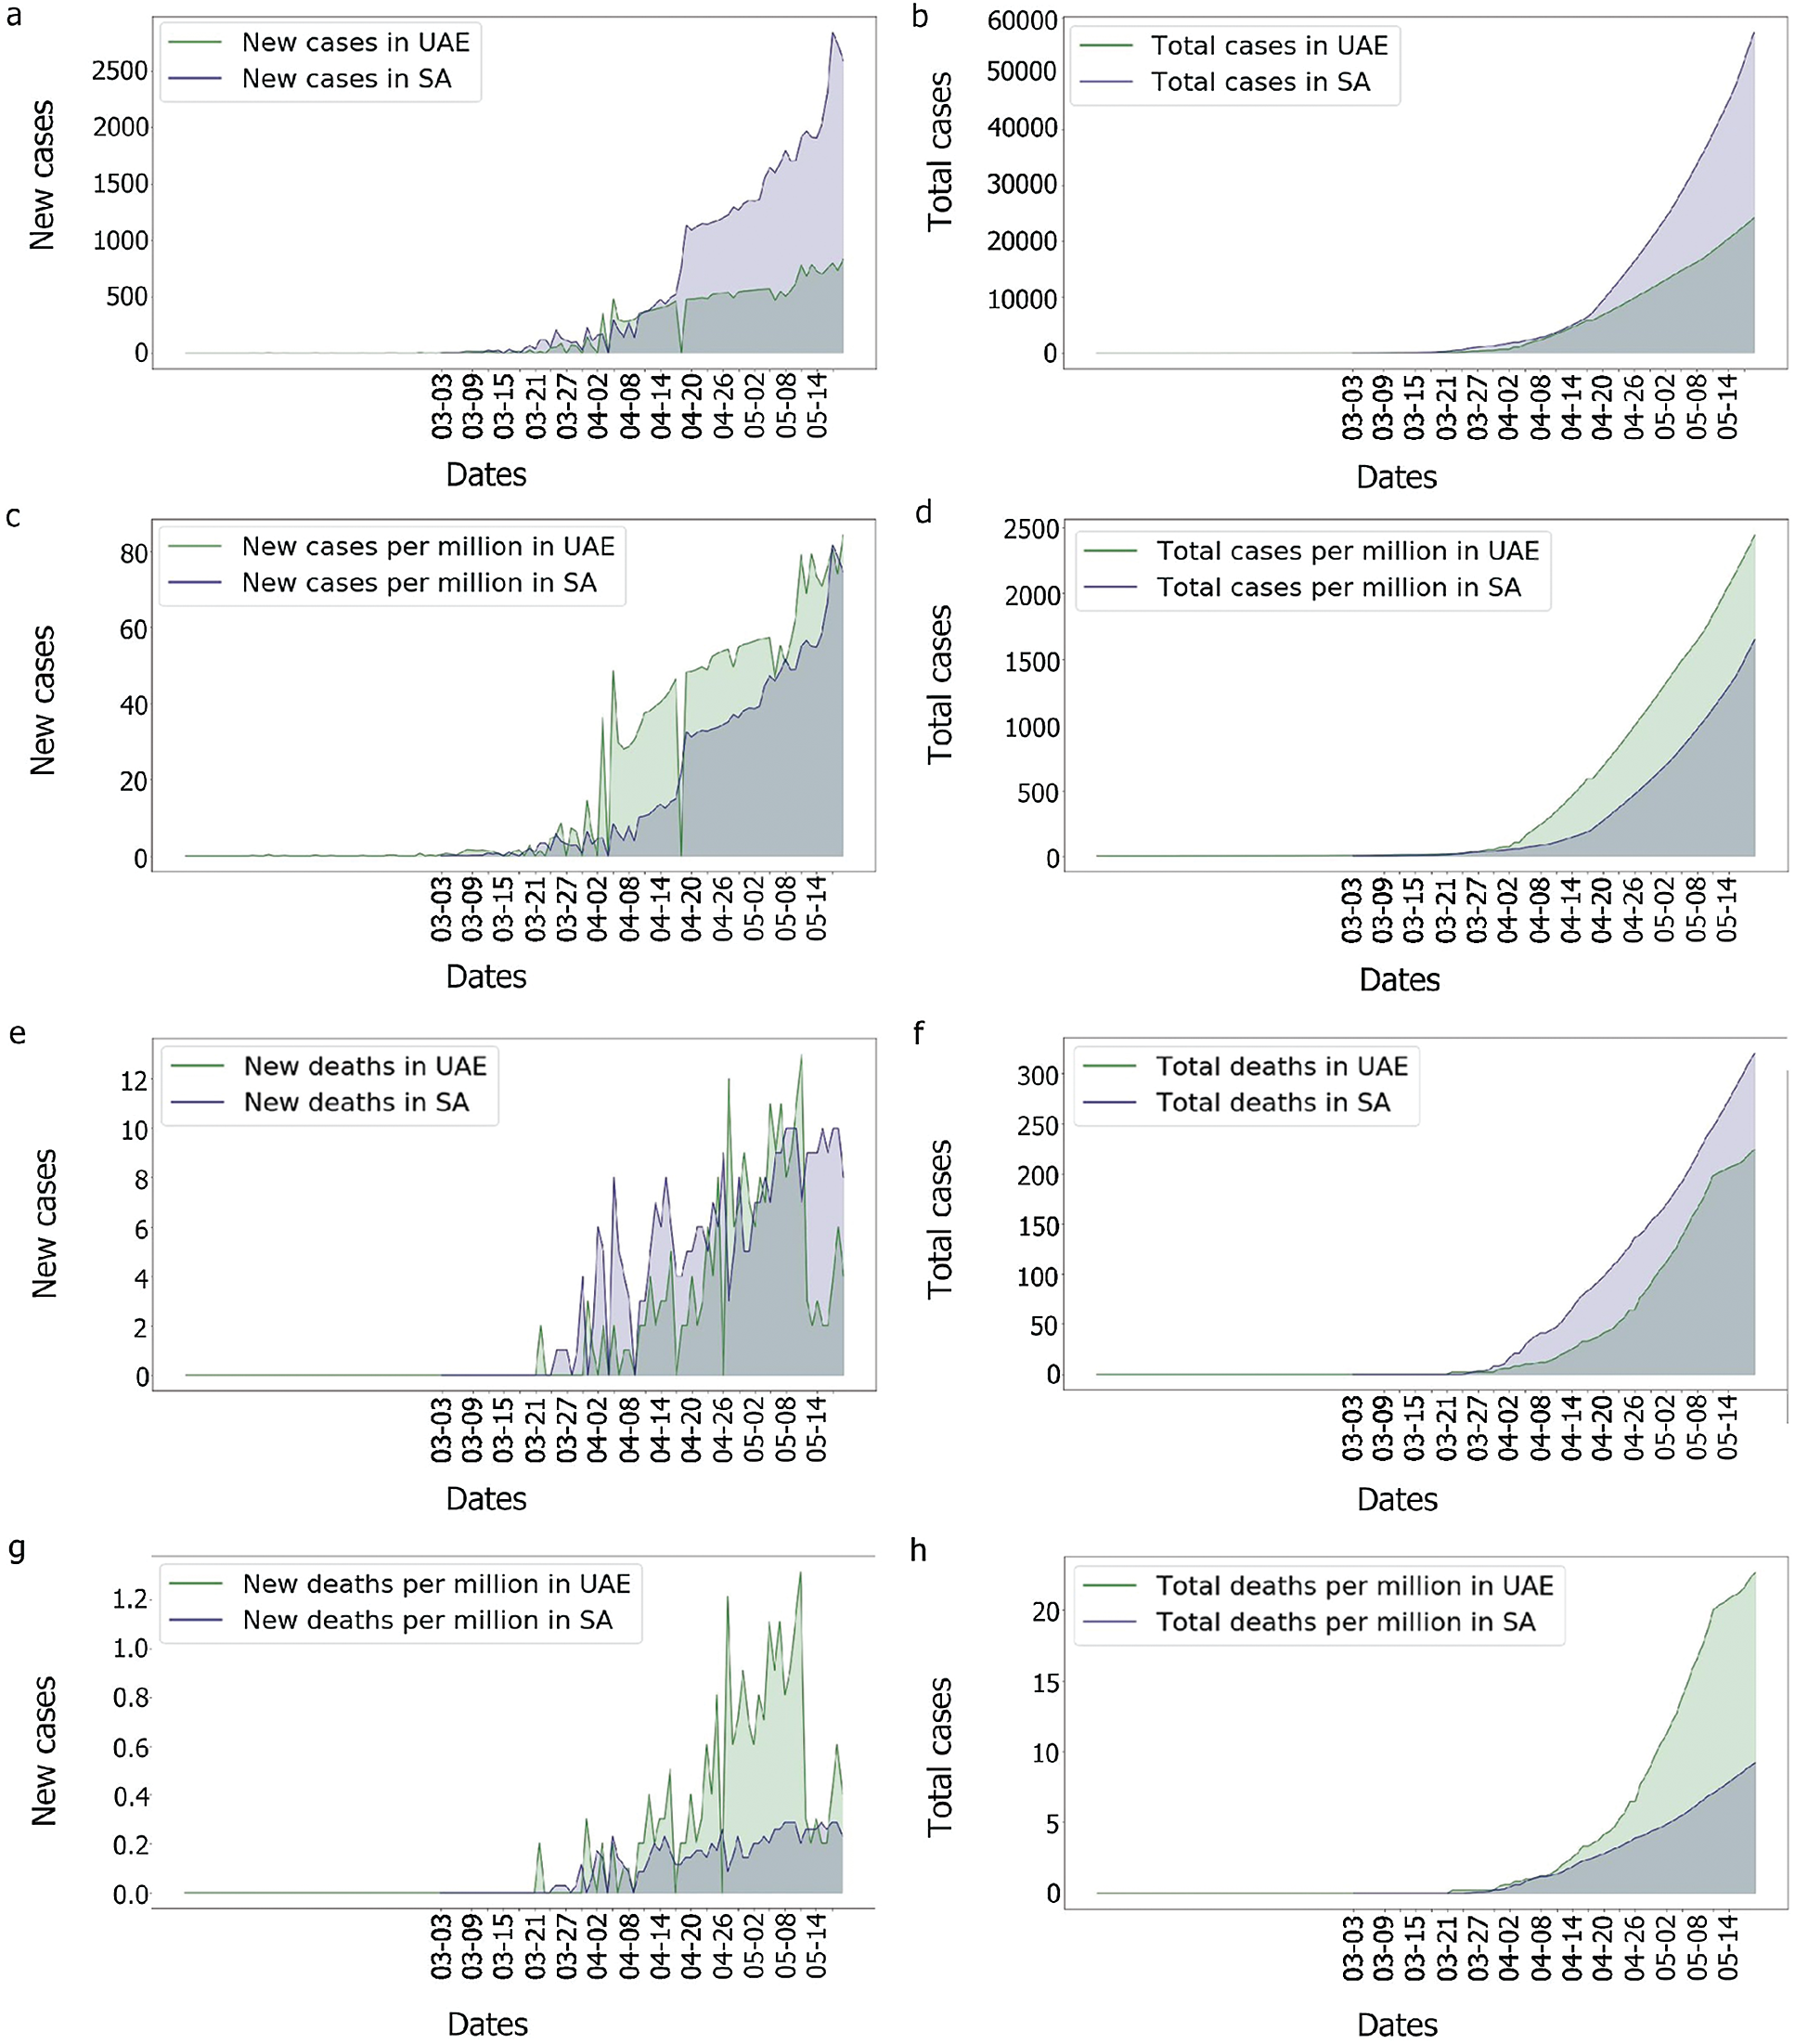
Figure 13: Comparison of the UAE and the KSA Covid-19 cases and death rate
Indeed, as the population of the UAE is much denser than that of the KSA, the risk of seeing the virus spread was higher in the UAE. In comparison to the UAE, the KSA only observed one wave of fatalities, as shown in Fig. 14. This could imply that something happened in the UAE that was not observed in the KSA. In fact, as many tests performed in the UAE were soon after the second fatality wave, explaining why the third wave in the UAE’s death/cases looked smoother than any other. One benefit of mass testing is the early detection of asymptomatic patients, which is extremely important to limit the spread of the infection.
With regards to the genomic group’s relation to the epidemy behaviour, only the 11.6 days delay between detection and deaths were considered as a precise estimation. It appeared for both countries that some specific genome groups emerged before the first death was observed as shown in Figs. 5, 7 and 15. Still, due to the characteristics of the virus, this correlation cannot be proved, and some deaths could have happened earlier, but were not noticed due to an absence of symptoms and the fact that some deaths which were linked to pneumonia were in fact linked to the Coronavirus [47]. Moreover, as the patients’ history also mattered (medical history, age, gender, ethnicity, etc.) [48,49], these graphs could be showing, only, the impact of events that had put vulnerable people in contact with the virus too. As data shows a positive correlation between the death rate and the identified genomic diversity in this study, other measures taken by the UAE, such as the ‘stay at home’ policy could have also helped reduce the diversity of the genomes by limiting contact and spread of the infection. This could also explain the reduction of mortality per case. However, for this paper, we assume that the numbers reflect the reality observed and we attempt to focus on identifying which genomic groups could have more impact than others and find out if these groups present some specific mutations.
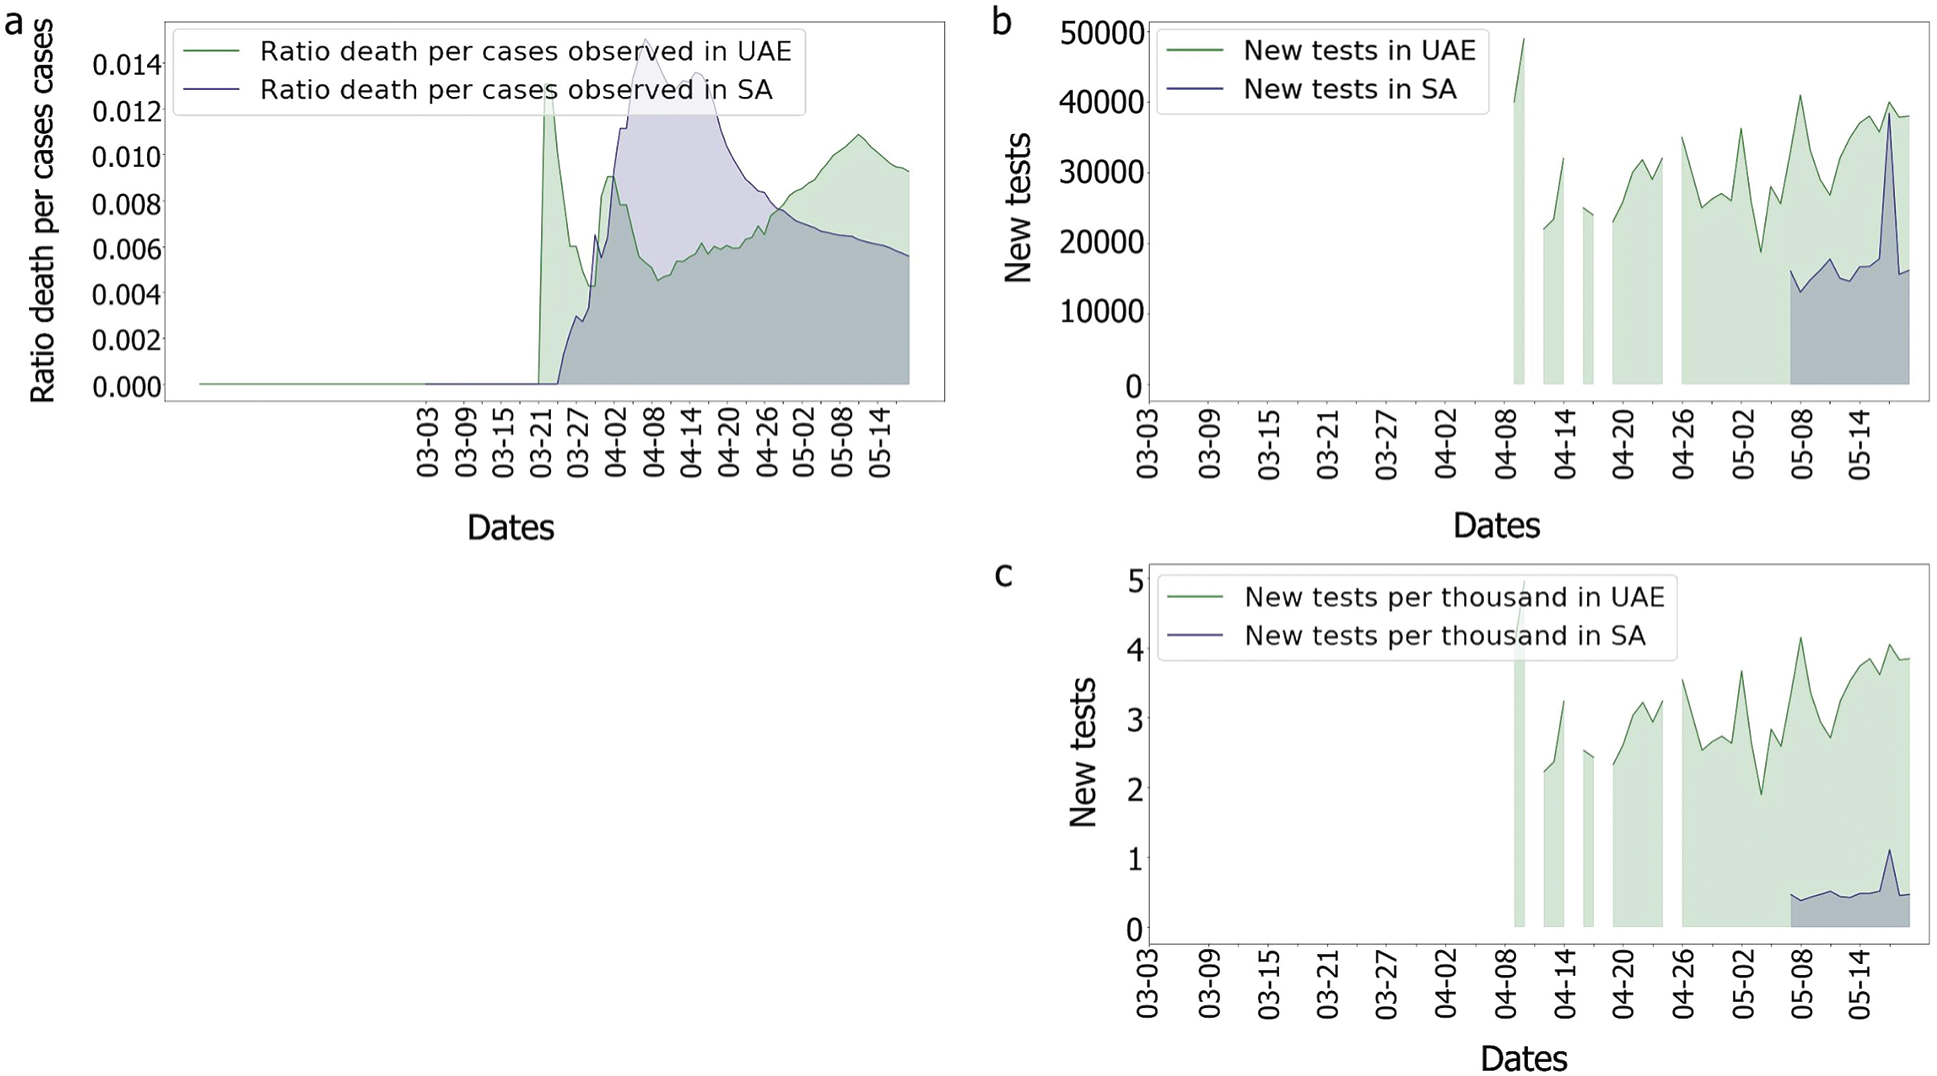
Figure 14: Comparison of the UAE and the KSA Covisd-19 death per cases and tests
Table 1: Country characteristics and population size
4.5 Correlation with Genome Diversity
It was observed, for the UAE, that no death was recorded even after two weeks from the introduction of G0_d1, G0_d2 and G0_d3, Fig. 7. It can then be suggested that these groups either have a low R0 (propagation rate) due to their quick detection, or genomic specifications, or a high level of discipline by the population toward social distancing and government’s measures. The same phenomenon was observed for G0_e2, G0_e4, G0_e5, G0_e6, G0_e9 and G0_b, Fig. 15. As some genomes were observed for only a limited number of samples (less than three) where no correlation could be made at this point.
The first main fatality rate observed corresponds to the effect of G0_e2 and G0_e3 introduction, followed by the emergence of G0_c and G0_e1, Fig. 9. However, G0_e3 was also observed in the KSA on the 1st of May 2020, which did not affect the fatality rate drastically, Fig. 15.
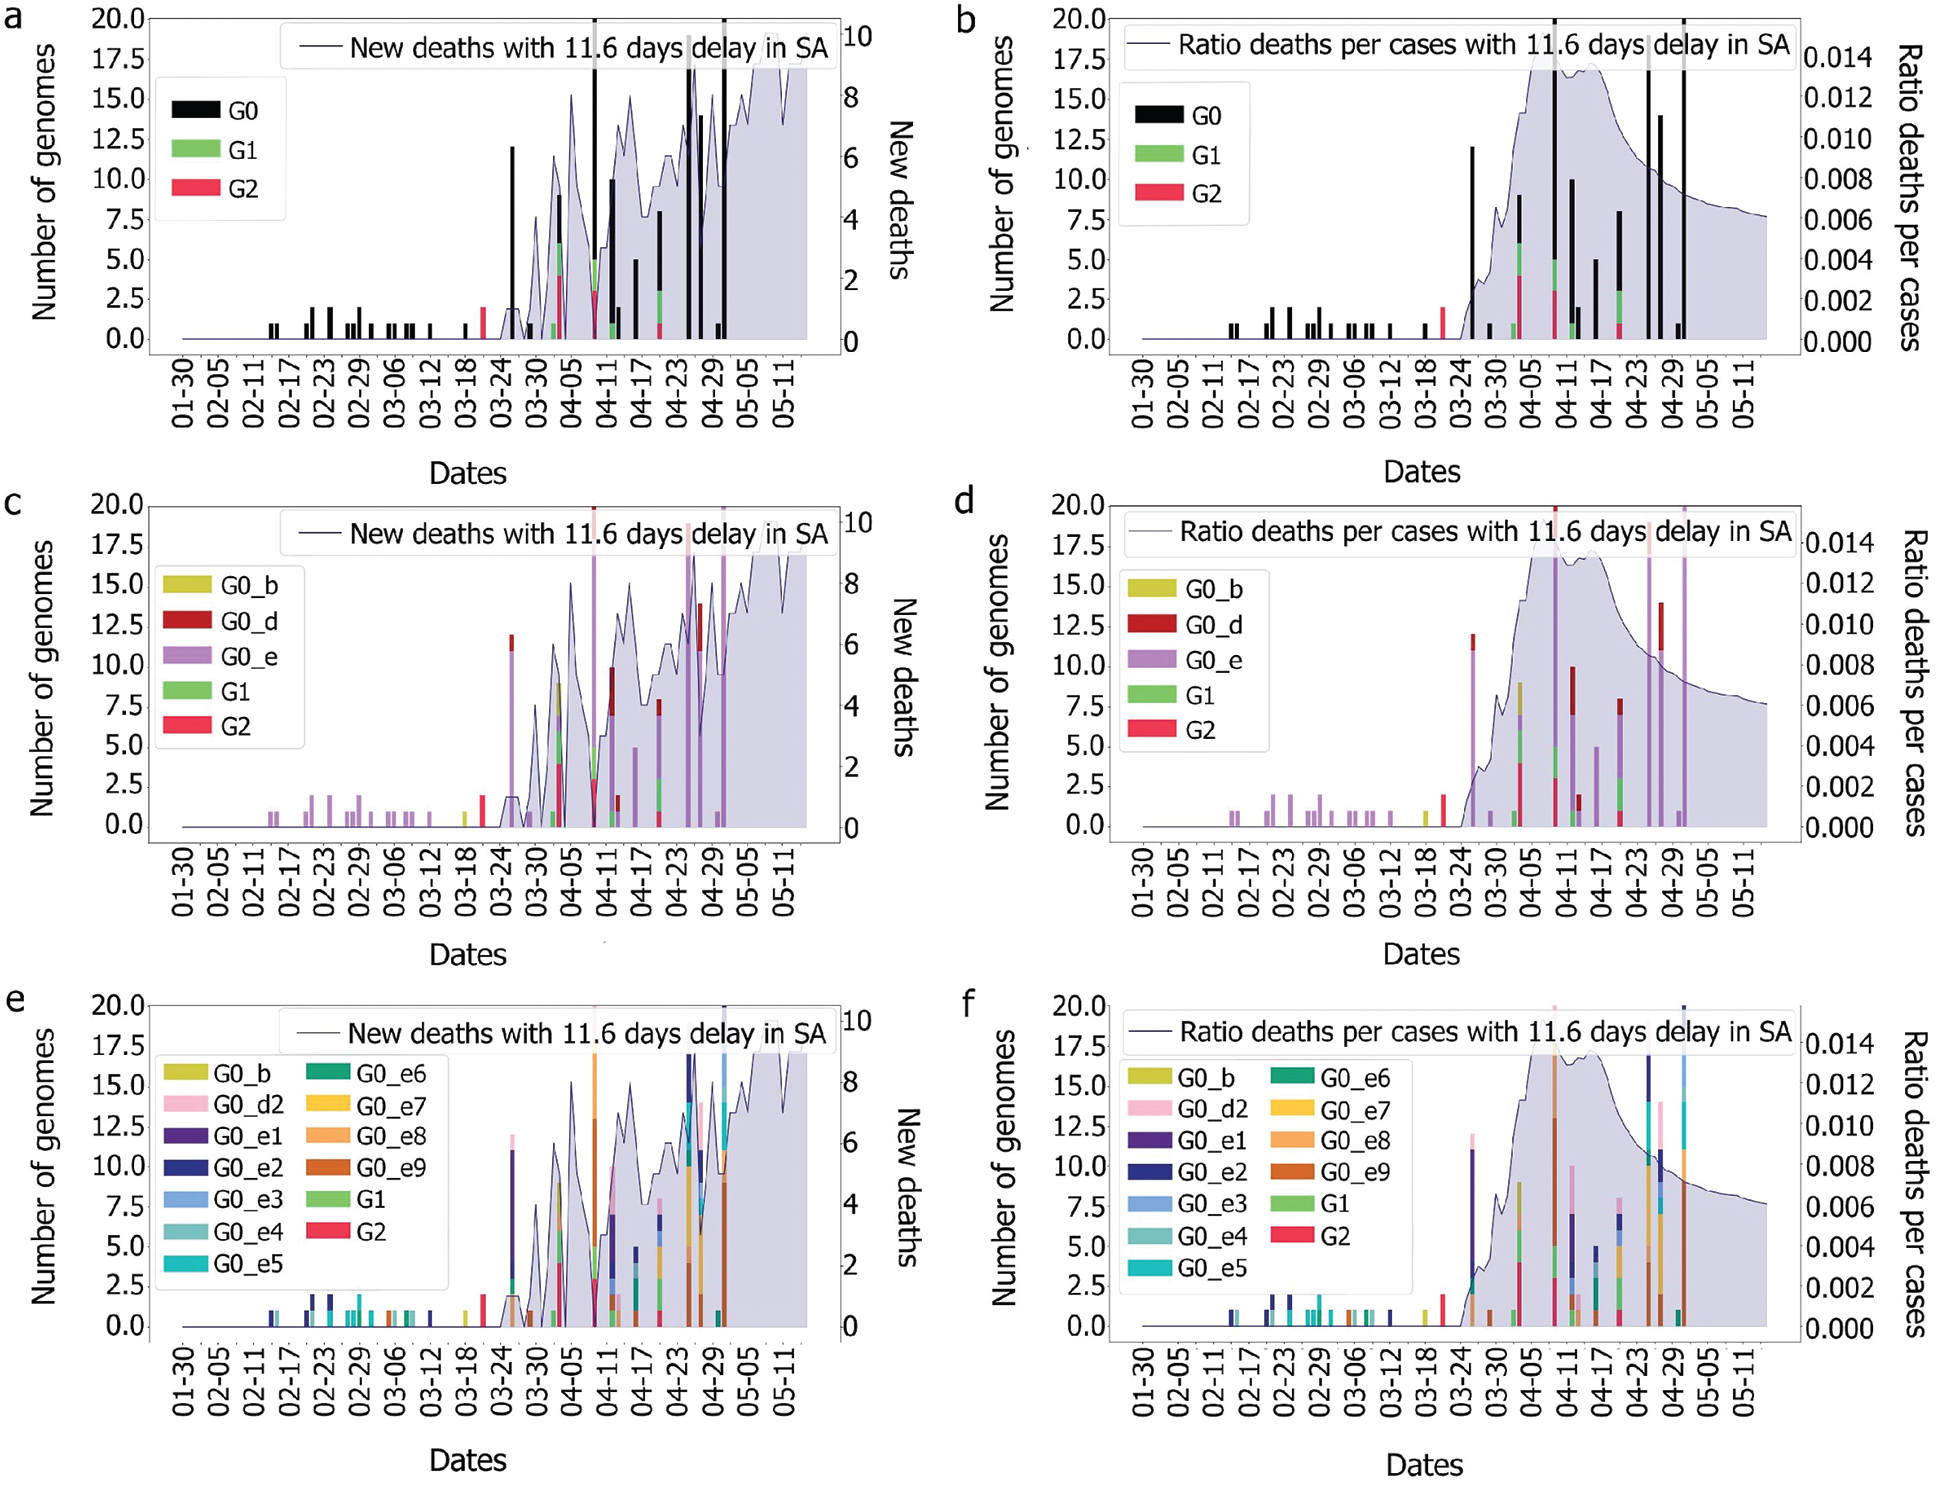
Figure 15: Evolution of deaths and genomes with 11.6 days for the different groups
In the KSA, the main genome groups observed during the picture of fatality are: G0_e9, G0_e8, which appeared along with G1, G0_e1, G0_d2 and G0_e7. As G1 and G2 were not observed in the UAE, it could be assumed that the mutations encountered in these two groups were not the ones impacting the fatality observed in the UAE. Therefore, the only genome group remaining that could explain our observation was G0_c as it does not appear in the KSA and is the furthest from the other genomic groups.
5 Conclusion and Future Directions
We know that different genomes of the same virus family can induce different behaviours such as difference in R0 (propagation rate), fatality rate and symptoms (presence and severity). We also know that individuals do not react the same way to a virus and its variants, depending mainly on their immune systems, their medical history, their age, etc. In this paper, we focused on studying the potential impact of Covid-19 genome groups at a country scale, the UAE compared to the KSA. This is the first time such a study is reported for these selected countries. Based on our classifications of the Covid-19 genomic variations, obtained in the UAE and the KSA, we performed a number of correlations, covering the emergence of these variations by date, and the analysis of possible relationships between the virus variants, number of infected cases and death rates. The goal was to identify correlations between the genomic diversity and their possible epidemiological impact. The results show some good insights, which uncover some interesting correlations and their interpretations. These insights are not only important to understand the virus’ development and changes over time, but also identifies which of the virus variants could be behind some epidemiological impact. These interpretations can help countries take the right measures, in time, to tackle the spread of the epidemy and plan appropriate resources.
Studying and searching for a specific mutation’s impact is time and resource consuming due a number of factors. This causes delays between the emergence of any mutation and when its impact is detection. Our approach, presented in this paper, can reduce this delay and allow earlier detections of new virus variants. Reducing this time will allow us to keep a better track of the epidemy and could help in the reduction of cases and the control of the spread of the infection. Indeed, using such methodology can orient the research toward a specific set of genomes with common mutations, which can be investigated further. Such a study would be useful in preparation for a new wave, and if correlations are made between specific groups of genomes and their impact on public health, the countermeasures and the health care response could be adapted. For example, if the fatality rate is indeed related to some new genomic groups, the detection of such groups would lead to localised lockdowns instead of using only the number of cases detected, leading to more precise and efficient measures. This type of analysis could be very useful, considering the recent case of a new Coronavirus variant in the UK, which was only uncovered three months later.
One limitation to our research and the proposed approach is the availability of reliable and complete data. We do recognise that there could be some missing data, such as that related to asymptomatic cases, where we may not have the genomic code, but could still affect the phylogenetic tree construction. Also, the delay of data transmission and the missing details. When the genome was sequenced compared to the observation of the symptoms, patients’ recovery, the number of contact cases detected, the specificity of the patient: age, gender, smoker, medical history, are all examples of very valuable data, that if provided, would add invaluable insights into the analysis. Incorporating such information could improve the analysis to get a more accurate view of the evolution of the genomes and their epidemiological behaviour. The other main limitation of this research is the number of genomes that can be aligned and treated at the same time, which is limited by the complexity of the genome sequence. Searching for new alignment methods that can support bigger sets of genomes will be an improvement in this area as more sequences could be compared and studied at the same time. This type of study is still showing an interesting approach which could reduce the time of detection and tracking of emerging virus’s mutations.
This study also illustrates the power of data analytics in this context, by demonstrating how the fusion of three-dimensional data (genomes, number of cases/deaths and dates) reveals interesting and unprecedented insights into the epidemiological impact of the pandemic on the UAE over time, which can lead to appropriate interventions to limit this impact. If other dimensions were added to the data, such as, travellers’ from outside the UAE, the health system, people’s compliance with government advice, symptoms, social media, news etc, this data fusion together with advanced semantically enabled analytics will lead to more significant insights that could potentially provide the government with opportunities to be more proactive and respond to the crisis more effectively. This could result in saving humans’ lives and minimizing the health, social and economic impacts. As the world is preparing for a long-lasting battle with Sar-Cov-2, improving our understanding of its strains and how to face them will become increasingly critical.
Acknowledgement: We gratefully acknowledge GISAID and NCBI platforms for providing us with the data used in this paper.
Funding Statement: This work is funded by RIF project, from Zayed University, the UAE. AB www.zu.ac.ae.
Conflicts of Interest: The authors declare that they have no conflicts of interest to report regarding the present study.
1. E. Dong, H. Du and L. Gardner, “An interactive web-based dashboard to track Covid-19 in real time,” Lancet Infectious Diseases, vol. 20, no. 5, pp. 533–534, 2020. [Google Scholar]
2. T. Koyama, D. Platt and L. Parida, “Variant analysis of Sars-cov-2 genomes,” Bulletin of the Word Health Organisation, vol. 98, pp. 495–504, 2020. [Google Scholar]
3. H. Li, Z. Liu and J. Ge, “Scientific research progress of Covid-19/Sars-cov-2 in the first five months,” Journal of Cellular and Molecular Medicine, vol. 24, no. 12, pp. 6558–6570, 2020. [Google Scholar]
4. M. A. Lake, “What we know so far: Covid-19 current clinical knowledge and research,” Clinical Medicine Journal (London), vol. 20, no. 2, pp. 124–127, 2020. [Google Scholar]
5. M. Day, “Covid-19: Four fifths of cases are asymptomatic, China figures indicate,” British Medical Journal, vol. 369, Media no. m1375, 2020. [Google Scholar]
6. I. K. Singgih, “Mobile laboratory routing problem for Covid-19 testing considering limited capacities of hospitals,” in 3rd Int. Conf. on Mechanical, Electronics, Computer, and Industrial Technology, Medan, Indonesia, pp. 80–83, 2020. [Google Scholar]
7. J. R.-M. Black, C. Bailey, J. Przewrocka, K. K. Dijkstra and C. Swanton, “Covid-19: The case for health-care worker screening to prevent hospital transmission,” Correspondence, vol. 395, no. 10234, pp. 1418–1420, 2020. [Google Scholar]
8. M. Ahmed, S. Advani, A. Moreira, S. Zoretic, J. Martinez et al., “Multisystem inflammatory syndrome in children: A systematic review,” EClinicalMedicine, vol. 26, pp. 100527, 2020. [Google Scholar]
9. N. Kanberg, N. J. Ashton, L.-M. Andersson, A. Yilmaz, M. Lindh et al., “Neurochemical evidence of astrocytic and neuronal injury commonly found in Covid-19,” Neurology, vol. 95, no. 12, pp. 1754–1759, 2020. [Google Scholar]
10. T. Greenhalgh, M. Knight, C. A. Court, M. Buxton and L. Husain, “Management of post-acute Covid-19 in primary care,” British Medical Journal, vol. 370, Media no. m3026, 2020. [Google Scholar]
11. N. D. Grubaugh, W. P. Hanage and A. L. Rasmussen, “Making sense of mutation: What D614G means for the Covid-19 pandemic remains unclear,” Cell, vol. 182, no. 4, pp. 794–795, 2020. [Google Scholar]
12. L. van Dorp, M. Acman, D. Richard, L. P. Shaw, C. E. Ford et al., “Emergence of genomic diversity and recurrent mutations in SARS-CoV-2,” Infection Genetics and Evolution, vol. 83, no. 1, pp. 104351, 2020. [Google Scholar]
13. Y. Cheng, B. He, J. Yang, F. Ye, S. Lin et al., “Crystal structure of the S1 subunit n-terminal domain from DcCoV UAE-HKU23 spike protein,” Virology, vol. 535, no. 6, pp. 74–82, 2019. [Google Scholar]
14. P. Kakodkar, N. Kaka and M. Baig, “A comprehensive literature review on the clinical presentation, and management of the pandemic Coronavirus disease 2019 (Covid-19),” Cureus, vol. 12, no. 4, pp. e7560, 2020. [Google Scholar]
15. Y.-R. Guo, Q.-D. Cao, Z.-S. Hong, Y.-Y. Tan, S.-D. Chen et al., “The origin, transmission and clinical therapies on Coronavirus disease 2019 (Covid-19) outbreak–an update on the status,” Military Medical Research, vol. 7, no. 1, pp. 2000058, 2020. [Google Scholar]
16. D. Tang, P. Comish and R. Kang, “The hallmarks of Covid-19 disease,” PLoS Pathogens, vol. 16, no. 5, Media no. e1008536, 2020. [Google Scholar]
17. C.-J. Houldcroft, M.-A. Beale and J. Breuer, “Clinical and biological insights from viral genome sequencing,” Nature Review Microbiology, vol. 15, no. 3, pp. 183–192, 2017. [Google Scholar]
18. A. Tahamtan and A. Ardebili, “Real-time RT-PCR in Covid-19 detection: Issues affecting the results,” Expert Reveview of Molecular Diagnostics, vol. 20, no. 5, pp. 453–454, 2020. [Google Scholar]
19. J. V. Waller, P. Kaur, A. Tucker, K. K. Lin, M. J. Diaz et al., “Diagnostic tools for Coronavirus disease (Covid-19Comparing CT and RT-PCR viral nucleic acid testing,” American Journal of Roentgenology, vol. 215, no. 4, pp. 834–838, 2020. [Google Scholar]
20. M. A. Mohamed, K. H. Abdulkareem, A. S. Al-Waisy, S. A. Mostafa, S. Al-Fahdawi et al., “Benchmarking methodology for selection of optimal Covid-19 diagnostic model based on entropy and TOPSIS methods,” IEEE Access, vol. 8, pp. 99115–99131, 2020. [Google Scholar]
21. Y. Lahlou, B. E. Amraoui and T. Bamhaoud, “Genomic and molecular analysis of SARS-CoV-2 and the possible strategies of Covid-19 treatment-a review,” IOSR Journal of Pharmacy and Biological Sciences, vol. 15, no. 3, pp. 39–47, 2020. [Google Scholar]
22. B. T. Korber, W. M. Fischer, S. Gnanakaran, H. Yoo, J. Theiler et al., “Tracking changes in SARS-CoV-2 spike: Evidence that D614G increases infectivity of the Covid-19 virus,” Cell, vol. 182, no. 4, pp. 812–827, 2020. [Google Scholar]
23. P. Saha, A. K. Banerjee, P. P. Tripathi, A. K. Srivastava and U. Ray, “A virus that has gone viral: Amino acid mutation in s protein of Indian isolate of Coronavirus Covid-19 might impact receptor binding and thus infectivity,” Bioscience Report, vol. 40, no. 5, Article ID BSR20201312, 2020. [Google Scholar]
24. H. A. Karrar, A. M. Mazin, S. G. Saraswathy, N. A. M. Mohammed, A. M. Ammar et al., “A review of fog computing and machine learning: Concepts applications,” Challenges and Open Issues IEEE Access, vol. 7, pp. 153123–153140, 2019. [Google Scholar]
25. A. S. Al-Waisy, S. Al-Fahdawi, M. A. Mohammed, K. H. Abdulkareem, S. A. Mostafa et al., “Covid-CheXNet: Hybrid deep learning framework for identifying Covid-19 virus in X-rays images,” Soft Computing, pp. 1–16, 2020. https://doi.org/10.1007/s00500-020-05424-3. [Google Scholar]
26. M. Nei and M. Nozawa, “Roles of mutation and selection in speciation: From Hugo de Vries to the modern genomic era,” Genome Biology and Evolution, vol. 3, pp. 812–829, 2011. [Google Scholar]
27. B. Chowdhury and G. Garai, “A review on multiple sequence alignment from the perspective of genetic algorithm,” Genomics, vol. 109, no. 5–6, pp. 419–431, 2017. [Google Scholar]
28. C. Blair and C. Ané, “Phylogenetic trees and networks can serve as powerful and complementary approaches for analysis of genomic data,” Systematic Biology, vol. 69, no. 3, pp. 593–601, 2020. [Google Scholar]
29. D. Harilal, S. Ramaswamy, T. Loney, H. A. Suwaidi, H. Khansaheb et al., “SARS-CoV-2 whole genome amplification and sequencing for effective population-based surveillance and control of viral transmission,” Clinical Chemistry, vol. 66, no. 11, pp. 1450–1458, 2020. [Google Scholar]
30. R. Wang, Y. Hozumi, C. Yin and G.-W. Wei, “Mutations on Covid-19 diagnostic targets,” Genomics, vol. 112, no. 6, pp. 5204–5213, 2020. [Google Scholar]
31. S. K. Tessema, S. C. Inzaule, A. Christoffels, Y. Kebede, T. de Oliveira et al., “Accelerating genomics-based surveillance for Covid-19 response in Africa,” Lancet Microbe, vol. 1, no. 6, pp. 227–228, 2020. [Google Scholar]
32. K. M. Bindayna and S. Crinion, “Variant analysis of SARS-CoV-2 genomes in the middle east,” Microbial Pathogenesis, vol. 153, 2021. [Google Scholar]
33. Public Health England, “Covid-19 (SARS-CoV-2Information about the new virus variant,” 2020. [Online]. Available: https://www.gov.uk/government/news/covid-19-sars-cov-2-information-about-the-new-virus-variant. [Google Scholar]
34. L. Galli, E. Chiappini, R. Schumacher and F. Richard, “After the first wave of Covid-19: Reflections from Italy,” Pediatric Infectious Disease Journal, vol. 39, no. 8, pp. 192–194, 2020. [Google Scholar]
35. Shu Y. and McCauley J., “GISAID: Global initiative on sharing all influenza data–from vision to reality,” EuroSurveillance, vol. 22, no. 13, pp. 957, 2017. [Google Scholar]
36. J. R. Brister, D. Ako-Adjei, Y. Bao and O. Blinkova, “NCBI viral genomes resource,” Nucleic Acids Research, vol. 43, pp. 571–577, 2015. [Google Scholar]
37. G. Stecher Kumar, M. Li, C. Knyaz and K. Tamura, “MEGA X: Molecular evolutionary genetics analysis across computing platforms,” Molecular Biology and Evolution, vol. 35, no. 6, pp. 1547–1549, 2018. [Google Scholar]
38. J. Hasell, E. Mathieu, D. Beltekian, et al., “A cross-country database of COVID-19 testing,” Scientific Data, vol. 7, no. 1, pp. 345–345, 2020. [Google Scholar]
39. T. Hale, S. Webster, A. Petherick, T. Phillips, B. Kira et al., “Oxford Covid-19 government response tracker, Blavatnik School of Government,” 2020. [Online]. Available: https://www.bsg.ox.ac.uk/research/research-projects/Coronavirus-government-response-tracker. [Google Scholar]
40. R. C. Edgar, “MUSCLE: Multiple sequence alignment with high accuracy and high throughput,” Nucleic Acids Research, vol. 32, no. 5, pp. 1792–1797, 2004. [Google Scholar]
41. A. A. Tayoun, T. Loney, H. Khansaheb, S. Ramaswamy, D. Harilal et al., “Multiple early introductions of SARS-CoV-2 into a global travel hub in the middle east,” Scientific Reports, vol. 10, no. 1, Paper ID 17720, 2020. [Google Scholar]
42. C. R. Wells, P. Sah, S. M. Moghadas, A. Pandey, S. A. et al., “Impact of international travel and border control measures on the global spread of the novel 2019 Coronavirus outbreak,” in Proc. of the National Academy of Sciences of the United States of America, USA, pp. 7504–7509, 2020. [Google Scholar]
43. S. A. Lauer, K. H. Grantz, Q. Bi, F. K. Jones, Q. Zheng et al., “The incubation period of coronavirus disease 2019 (Covid-19) from publicly reported confirmed cases: Estimation and application,” Annals of Internal Medicine, vol. 172, no. 9, pp. 577–582, 2020. [Google Scholar]
44. S. Scheiner, N. Ukaj and C. Hellmich, “Mathematical modeling of Covid-19 fatality trends: Death kinetics law versus infection-to-death delay rule,” Chaos Solitons & Fractals, vol. 136, Article ID 109891, 2020. [Google Scholar]
45. J. Hasell, E. Mathieu, D. Beltekian, B. Macdonald, C. Giattino et al., “A cross-country database of Covid-19 testing,” Scientific Data, vol. 7, Article ID 345, 2020. [Google Scholar]
46. Population-Worldometer, 2020. [Online]. Available: https://www.worldometers.info/population/. [Google Scholar]
47. A. M. Farhan, “Covid-19 deaths: Are we sure it is pneumonia? please, autopsy, autopsy, autopsy!,” Journal of Clinical Medicine, vol. 9, no. 5, pp. 1259, 2020. [Google Scholar]
48. Assessing Risk Factors, “Centers for disease control and prevention,” 2020. [Online]. Available: https://www.cdc.gov/Coronavirus/2019-ncov/covid-data/investigations-discovery/assessing-risk-factors.html. [Google Scholar]
49. People with Certain Medical Conditions, “Centers for disease control and prevention,” 2020. [Online]. Available: https://www.cdc.gov/Coronavirus/2019-ncov/need-extra-precautions/people-with-medical-conditions.html. [Google Scholar]
 | This work is licensed under a Creative Commons Attribution 4.0 International License, which permits unrestricted use, distribution, and reproduction in any medium, provided the original work is properly cited. |