DOI:10.32604/cmc.2021.016698
| Computers, Materials & Continua DOI:10.32604/cmc.2021.016698 | |
| Article |
Early Tumor Diagnosis in Brain MR Images via Deep Convolutional Neural Network Model
1School of Information Technology and Engineering, Vellore Institute of Technology, Vellore, 632014, India
2Department of Computer Science and Engineering, Indian Institute of Information Technology, Surat, 395007, India
3Research Quality Management Section, King Abdullah International Medical Research Center, King Saud bin Abdulaziz University for Health Sciences, Ministry of National Guard - Health Affairs, Riyadh, 11426, Kingdom of Saudi Arabia
4Department of Computer Science and Information Engineering, National Yunlin University of Science and Technology, Yunlin, 64002, Taiwan
5Graduate Institute of Biomedical Informatics, Taipei Medical University, Taipei, Taiwan
*Corresponding Author: Chuan-Yu Chang. Email: chuanyu@yuntech.edu.tw
Received: 08 January 2021; Accepted: 08 February 2021
Abstract: Machine learning based image analysis for predicting and diagnosing certain diseases has been entirely trustworthy and even as efficient as a domain expert’s inspection. However, the style of non-transparency functioning by a trained machine learning system poses a more significant impediment for seamless knowledge trajectory, clinical mapping, and delusion tracing. In this proposed study, a deep learning based framework that employs deep convolution neural network (Deep-CNN), by utilizing both clinical presentations and conventional magnetic resonance imaging (MRI) investigations, for diagnosing tumors is explored. This research aims to develop a model that can be used for abnormality detection over MRI data quite efficiently with high accuracy. This research is based on deep learning and Deep-CNN was deployed to examine the MR brain image for tracing the tumor. The system runs on Tensor flow and uses a feature extraction module in Deep-CNN to elicit the factors of that part of the image from where underlying issues are identified and subsequently succeeded in prediction of the disease in the MR image. The results of this study showed that our model did not have any adverse effect on classification, achieved higher accuracy than the peers in recent years, and attained good detection outcomes including case of abnormality. In the future work, further improvement can be made by designing models that can drastically reduce the parameter space without affecting classification accuracy.
Keywords: Deep learning; convolutional neural network; brain tumor magnetic resonance imaging
Diagnosis of most of the disease requires extensive clinical investigations, including radiological imaging, which provides vital information regarding the concerned organs’ physiological appearances. However, imaging has various modalities according to the application, e.g., X-ray, thermal imaging, ultrasound scanning, MRI and computed tomography (CT) scan. MRI scan is preferable option for brain imaging as it provides information about brain soft tissue anatomy, especially for soft tissue delineation. Additionally, it doesn’t produce any harmful radiation because it is a non-invasive technique and generates high-quality resolution images of soft brain tissues [1]. Hence, to begin an investigation of the brain-related disorders like Schizophrenia, Alzheimer’s disease (AD), Parkinson’s disease (PD), autism and brain tumor, neurologists require brain MR images as an imperative resource to complete clinical investigation. Using MR image, neurologists can assess the extent, volume, and intensity of the tumor, and subsequently, they can categorize tumor into its types—malignant (cancerous) or benign (non-cancerous). However, the complexity, non-uniform spreading, and confusing cases in MRI pose a significant challenge for a specialist to deal with. In the backdrop of this case, getting a second opinion on time can definitely boost confidence and help the neurologists/radiologists in the diagnosis and subsequent treatment trajectory. Additionally, the enormous count of MR image tissue parameters becomes a cumbersome task for doctors to interpret such images manually [2]. Keeping an eye on this requirement, the design of an Artificial Intelligence (AI) based automatic system for diagnosing malignant tumors is presented in this research work.
Generally, MRI processing for diagnosis passes through few specified phases as shown in Fig. 1.
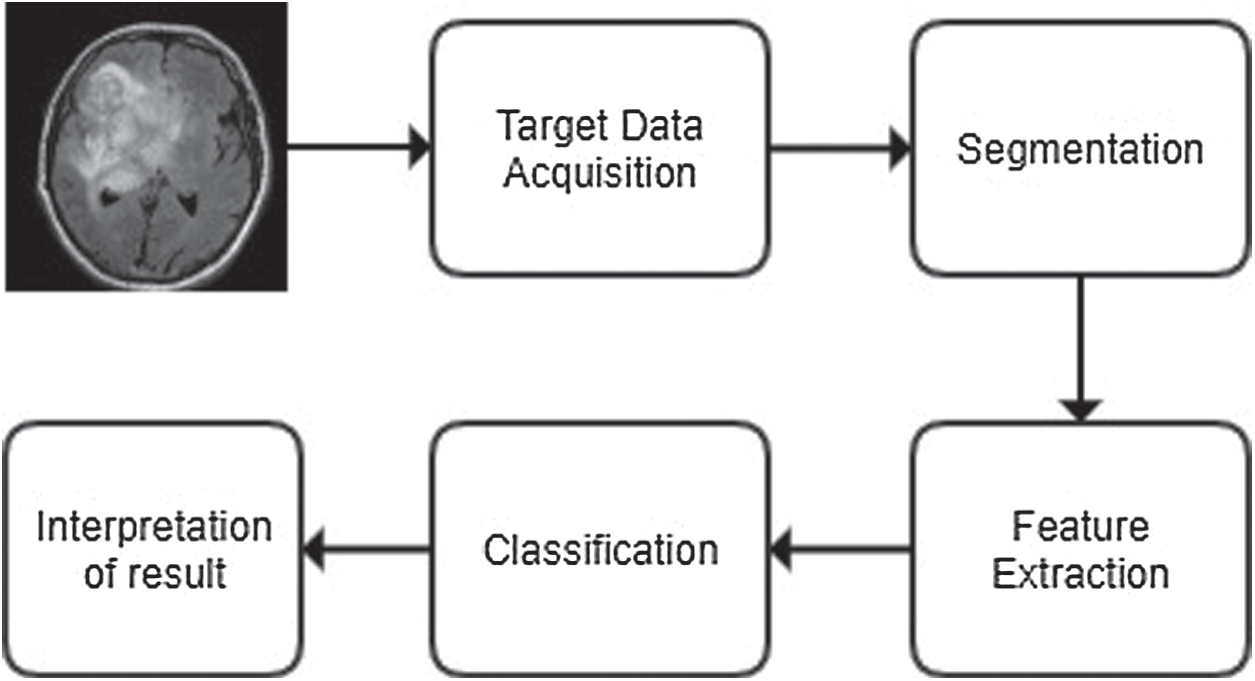
Figure 1: The generic process of classification
In this common framework of classification, first, the brain’s MRI image is acquired from a reliable source. The quality of selected images is enhanced for better resolution, and the underlying noises are removed by employing several de-noising methods, like spatial filters, transformation domain filters, or fuzzy-based filters. Next, it is segmented to highlight the region of study as segmentation projects sharp boundaries of tumor image that helps feature extraction of the region of interest [3]. A plethora of segmentation techniques are utilized for this purpose, e.g., fuzzy c-means, SVM, self-organising map (SOM), neuro-fuzzy c-means and wavelet transformation [4].
Next, the image’s vital features are extracted from the image for classification purposes [5]. Several feature extraction techniques are used for this purpose, e.g., texture features, Gabor features, feature based on wavelet transform, principal component analysis, discriminant analysis, decision boundary feature extraction, nonparametric weighted feature extraction and spectral mixture analysis [6]. Once the high dimensional feature vectors are extracted, fewer features can be selected for further processing to increase the accuracy by employing dimensionality reduction techniques, such as principal component analysis (PCA) or kernel PCA. Next, a classifier has to be designed that will achieve the highest accuracy and would incur a less computational cost [7,8].
The recent literature has shown different brain MRI investigations employing deep learning technique. In general, there has been a significant change in the outlook towards CNN diversification and employability. Certainly, it is evident from the fact that deep learning has been utilised in (i) marketing for sentiment analysis of the customers [9–11], (ii) social network platform for hate speech detection [12], (iii) agriculture for crop disease detection [13], (iv) healthcare for ECG beat classification [14], electromyography (EMG) based recognition [15], X-ray investigation [16], COVID-19 exploration [17] and many more.
The recent literature has shown different brain MRI investigations employing deep learning technique. In general, there has been a significant change in the outlook towards CNN diversification and employability. Zou et al. [18] developed an automatic classification algorithm based on 3D-CNN to classify attention deficit hyperactivity disorder (ADHD) exploiting information from functional MRI (fMRI) scans. Similarly, Cao et al. [19] implemented a novel method for improving the feature extraction efficiency of the MRI image by processing a multi-channel input employing 3D-CNN system, which ultimately helps in reducing the dimensionality of the features. On the other side of the spectrum, Li et al. [20] developed a 3D-CNN for comparing the multi-modality of neuroimaging data by capturing the nonlinear relationships between different data modalities.
Using CNN and other deep learning methods, Lin et al. [21] developed a system that can successfully predict the mild cognitive impairment to AD conversion. They came up with a strong result that showed that CNN could easily extract the distinctive features by identifying morphology changes between AD and normal controls. Iqbal et al. [22] presented a deep CNN network that can segment brain tumors from the MRI data. The given network used the BRATS segmentation dataset, which had a lot of different MRI data obtained from four separate modalities. Lundervold et al. [23] presented an insight into deep learning models revealing their MRI processing chain applications from attenuation to prediction of the diseases.
Farooq et al. [24] proposed and implemented a 4-way classifier to predict AD, mild cognitive impairment (MCI) and late MCI. The experiment was carried out on the ADNI dataset with the help of a very high-performance GPU and resulted in prediction accuracy of 98.8%. Ramzan et al. [25] explored fMRI’s effectiveness for a multi-class AD classification, including associated stages of AD progression. They even investigated the ResNet-18 architecture in great detail to provide a better insight into the transfer learning approaches that could be applied for the classification of AD.
From the above observations, it is clear that brain MRI scan is mostly used for diagnosing brain-related disorders. However, the counts of disorders are increasingly numerous due to complexity of brain structure. In this context, we have chosen the detection of brain tumor, as there are only a few studies in the literatures that utilized CNN for classifying brain tumor. Moreover, those studies employed standard CNN models for their experiment, but in comparison to that our approach is quite different. The major contributions of our research work are listed below
(i) The Deep-CNN model is proposed based on incremental design associated with customized hyper parameters.
(ii) Proposed model adopts to GAP layer replacing conventional fully connected layers of CNN.
(iii) The model has been evaluated on a contemporary dataset obtained from Kaggle [26].
(iv) The results obtained are promising as misclassification rate is almost zero.
The rest of the paper is organized as follows: methodology and its associated experimental setup is explained in Section 2, while Section 3 presents analyses of our experimental results. Section 4 discusses contemporary research in brain tumor detection using brain MR images and compares the results with other standard CNN techniques. The conclusions are outlined in Section 5.
The proposed system is designed by making use of a training dataset and further a testing dataset is employed to check the system’s accuracy. The training data is first pre-processed as the input image needs to be resized in order to process by CNN. Next, the data is augmented to have a large pool of its variations. Now the images are subjected for feature extraction where the unique point of the data is targeted and sent to the convolution neural network. By doing so, it predicts which disease is existing in the training data. Correspondingly, the same process applied to the testing images, and from the result the predictor checks how accurate it is in contrast to data. If the accuracy is not up to the desired level, then the training process is repeated with altering the network hyper parameters.
The MRI dataset was taken from Kaggle [26], which is an open platform. It contained multiple MRI images of Diseased Brain MRI and one without any disease in JPEG format. There were a total of 253 images, out of which 155 were diseased MRI images and 98 were healthy MRI images.
Once the data is pre-processed, it is executed by convolution layer. The output of convolution operation is subjected to pooling operation. The pooling layer shrinks the size of feature map’s generated from the previous layer by a factor of pool size and pool stride. Next, the fully connected (FC) layer is connected to all the neurons in the subsequent layer. Models having more FC layers become slow down since the processing take much time for a huge network. However, they cannot be bypassed as the individual feature’s significances might be lost by doing so and consequently, it can lead to misclassification in the final output.
The general flow-map of Deep-CNN adopted by our work is depicted in Fig. 2.
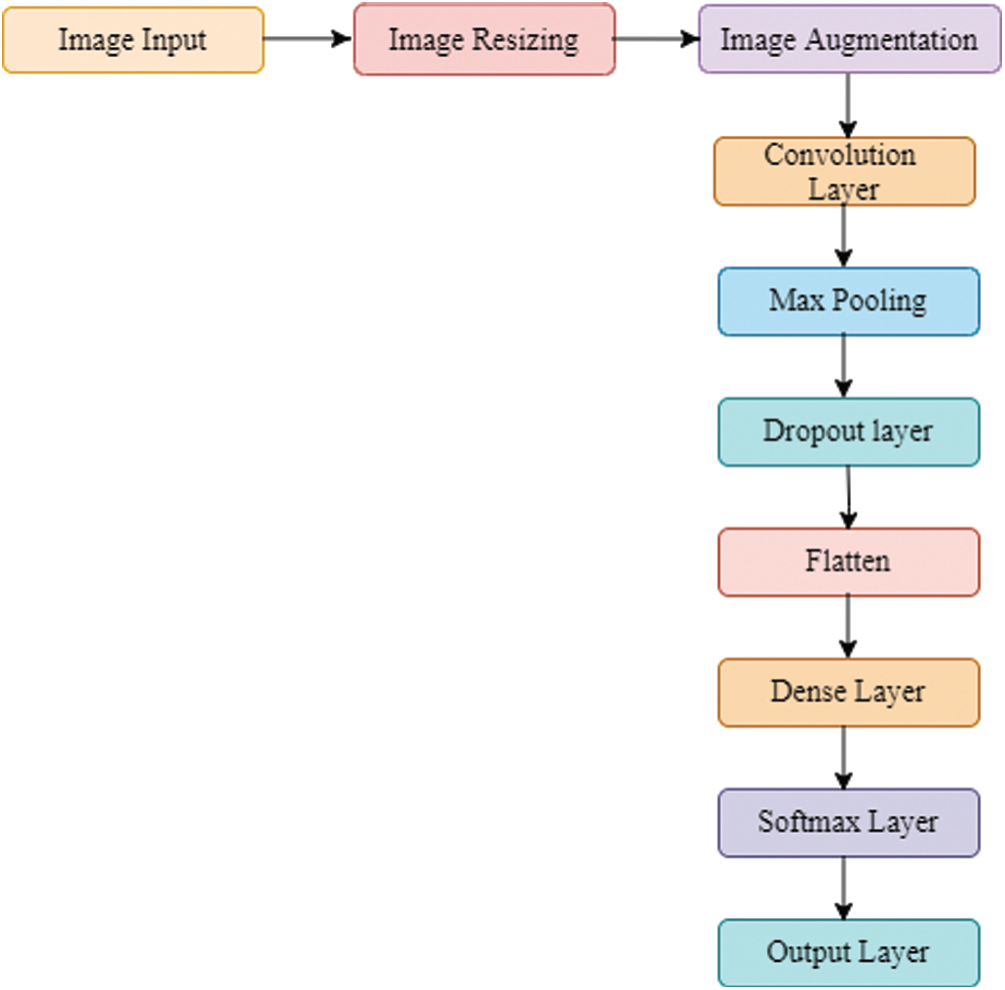
Figure 2: The flow-map of the proposed Deep-CNN model
The proposed flow-map is alterable as desired by the user, and it adopts diverse combinations of a convolutional layer, pooling layer, dropout layer, batch normalization and activation functions. We tested six variants of CNN models for their efficacy by employing brain tumor dataset. These models are conceptualized as below:
(a) Model 1: One convolution layer with batch normalization and dropout layer. Softmax layer is used in a fully connected layer and Adam optimizer is used in the convolution process.
(b) Model 2: Two-layered Deep-CNN; each layer consists of a convolution layer and a pooling layer with batch normalization and dropout layer. Softmax layer is used in a fully connected layer and Adam optimizer is used in the convolution process.
(c) Model 3: Three-layered Deep-CNN; each layer consists of a convolution layer and a pooling layer with stopping criteria.
(d) Model 4: Four layered Deep-CNN; each layer consists of a convolution layer and a pooling layer with stopping criteria with dropout.
(e) Model 5: Five convolutional layers with dropout and stopping criteria accompanied by two fully connected layers.
(f) Model 6: In the Five layered Deep-CNN, each layer consists of a convolution layer and a pooling. layer. The global average pooling layer is introduced, followed by the Softmax layer.
The proposed model is divided into two significant blocks known as convolutional blocks and dense blocks, as these are two significant components of the network. Each block has few layers, specific functions depending on designated functionalities, and the associated parameters as presented in Fig. 3. Batch normalization was performed immediately after convolution and dense operation.
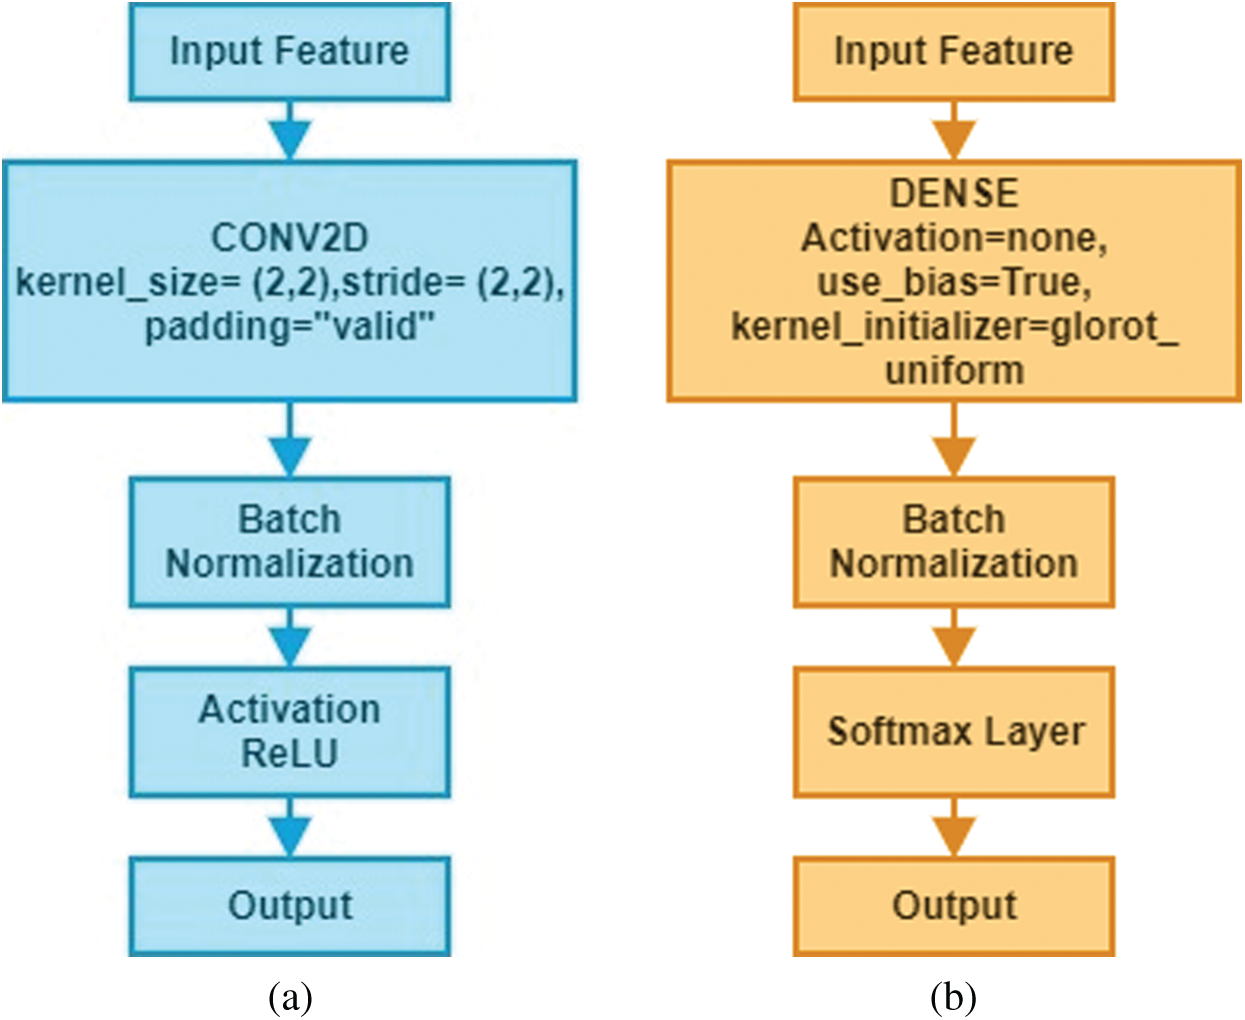
Figure 3: Structure of convolutional blocks and dense blocks used in the Deep-CNN (a) convolutional block (b) dense block
The Deep-CNN model composed of three significant parts: (i) a convolution layer, (ii) a pooling layer, and (iii) a fully connected layer. Automatic extraction of features from input images was performed by convolution layer; however, pooling layer helped in reducing dimensions of features obtained by convolution layer so that vital features are spotted for further processing, while fully connected layer flattened the features into a vector and finally it was classified into a particular label. First, the convolution layer was added to the proposed sequential Deep-CNN model. Several parameters, such as kernel size, the number of filters, padding type, activation function type, strides and bias were specified when creating a convolutional layer. Fig. 4 shows a snapshot of the Brain MRI Data.
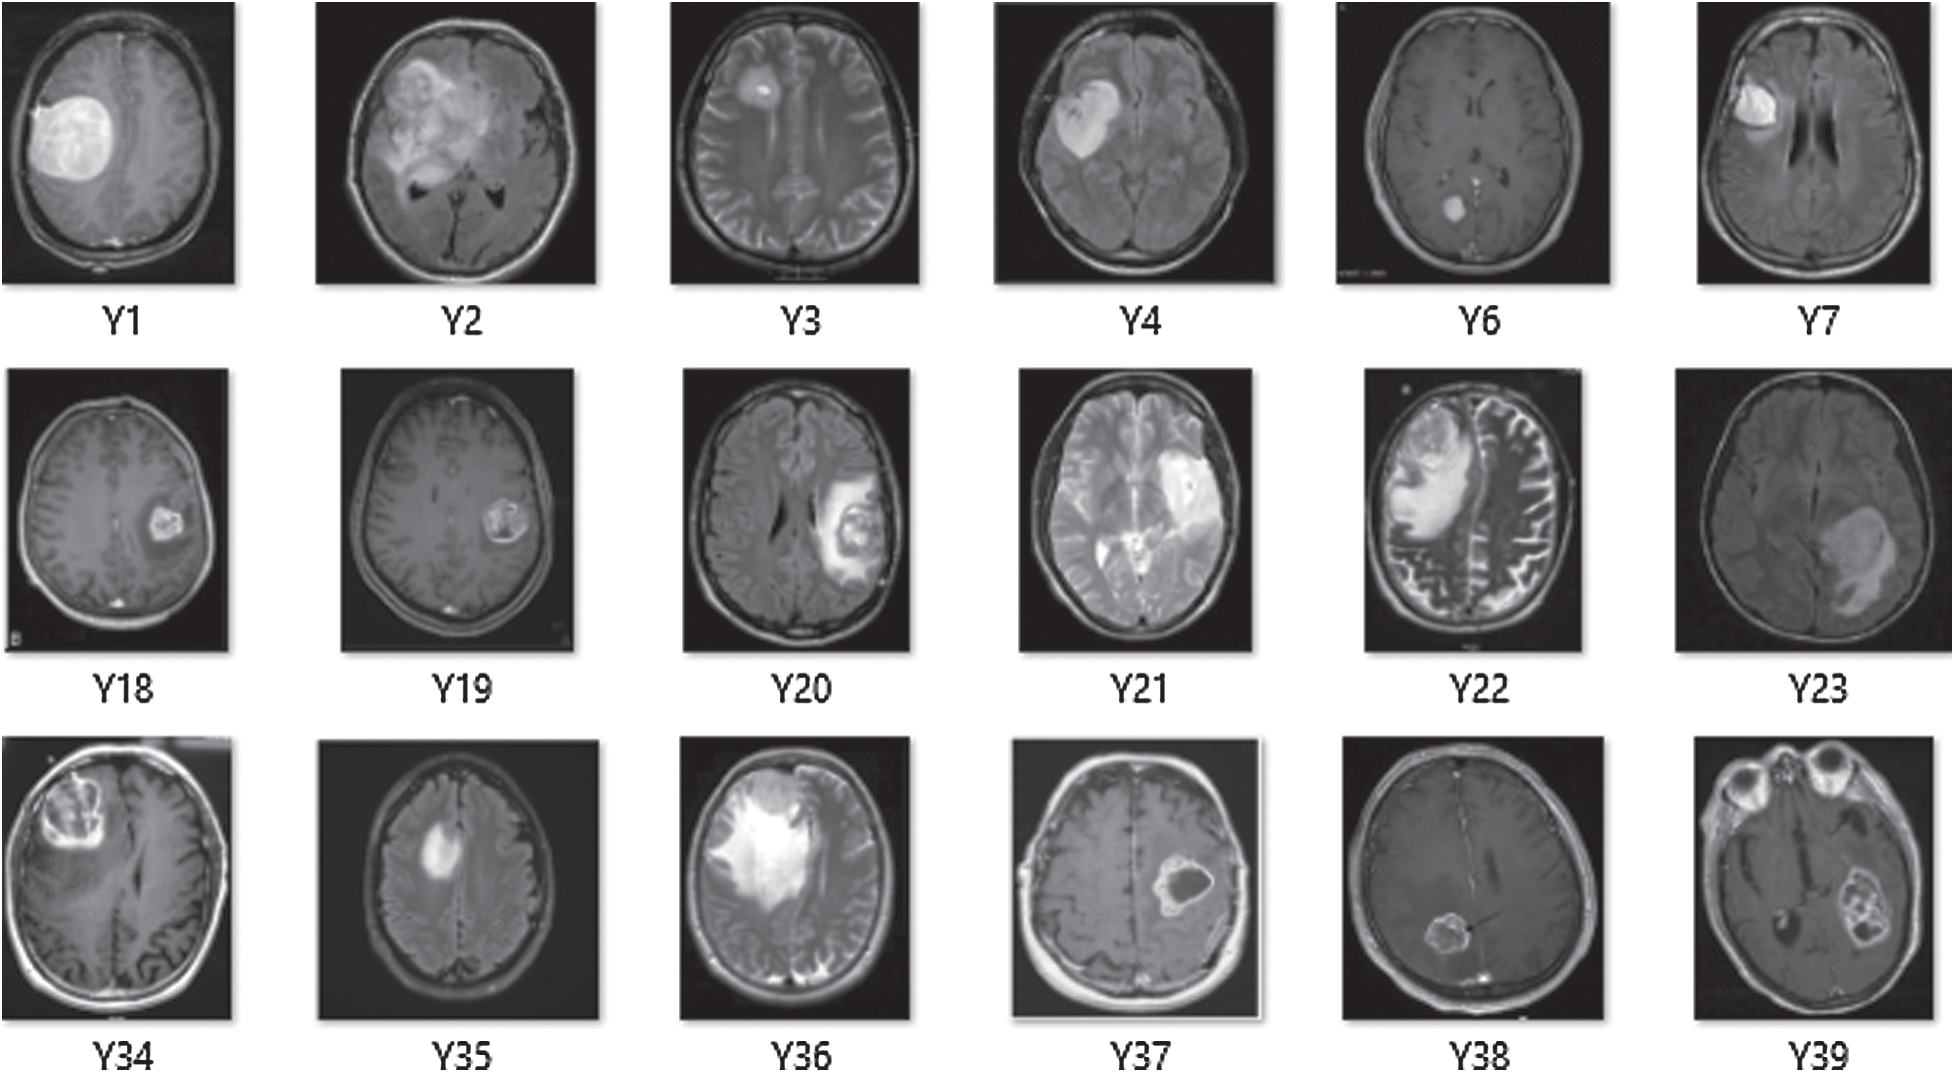
Figure 4: A snapshot of brain MRI data
On performing convolution operation, generated image size from convolution layer can be determined by using Eq. (1):
where W is matrix width, H is matrix height, B is the width of convolution kernel, P stands for padding and S is step-size. The output of the convolution layer is being subjected to pooling operation; however, the size of the image after pooling is computed using Eq. (2):
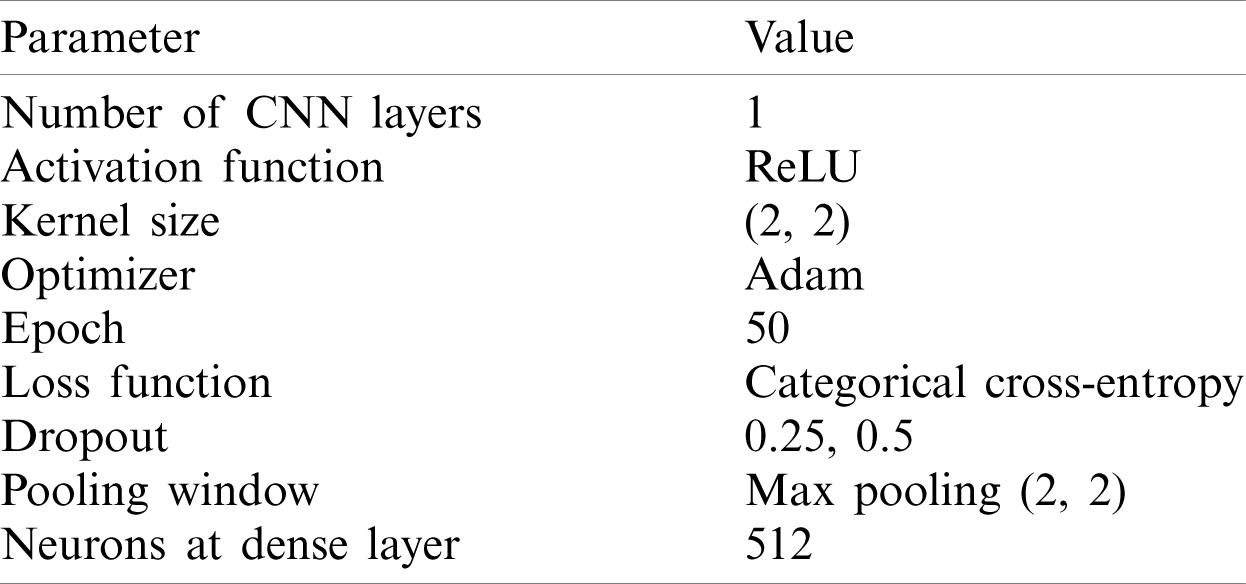
The experiment started with a basic structure of 2D convolution with the parameter values as listed in Tab. 1.
Table 1: List of key parameters with their values for model 1
The models used in our research were trained for 50 epochs with early stopping call backs (patience = 5 epochs). In order to find the best setting, different optimization techniques were applied to different settings of 2D Deep-CNN. The time required to complete one epoch was different for different settings. The model performance was calculated using loss and classification metrics, such as Precision, Recall, F1-measure and AUC-ROC curve. Fig. 5 shows the Proposed Deep-CNN structure with the introduction of Global Average Pooling Layer.
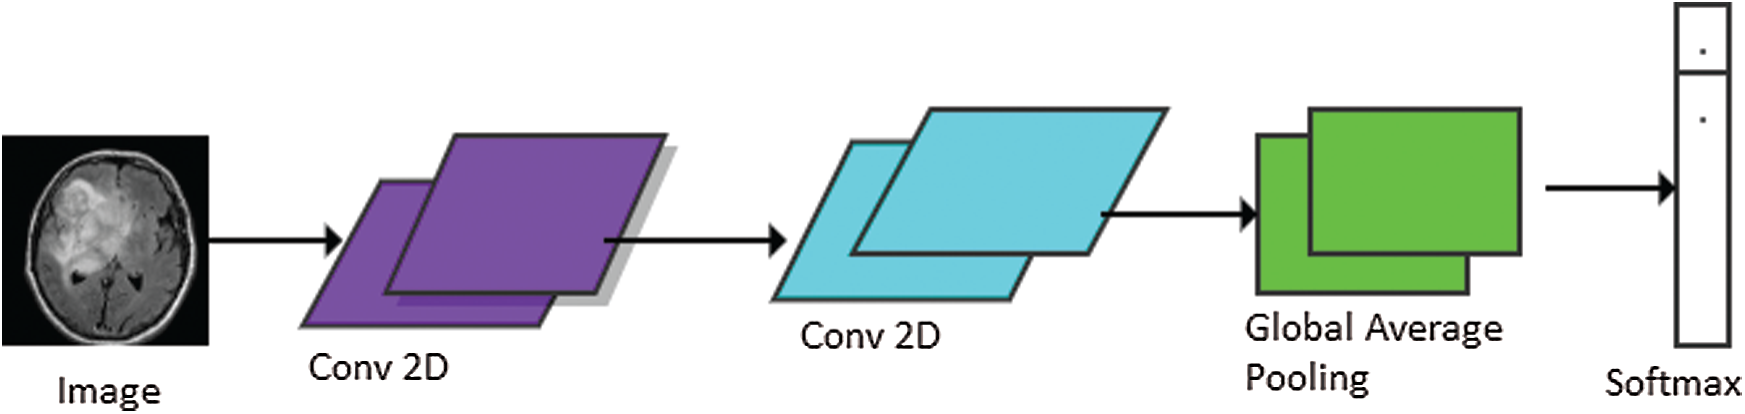
Figure 5: Proposed Deep-CNN structure with the introduction of global average pooling layer
The basic model of Deep-CNN consisted of one layer of 2D convolutional neural network that takes the input and processes it with kernel size (2, 2). Further, batch-normalization was used, and finally the important features were taken out by applying max pooling with window size (2, 2) and stride (2, 2). The outcome of the model 1 is listed in Tab. 2.
Table 2: Results using one layer of 2D Deep-CNN
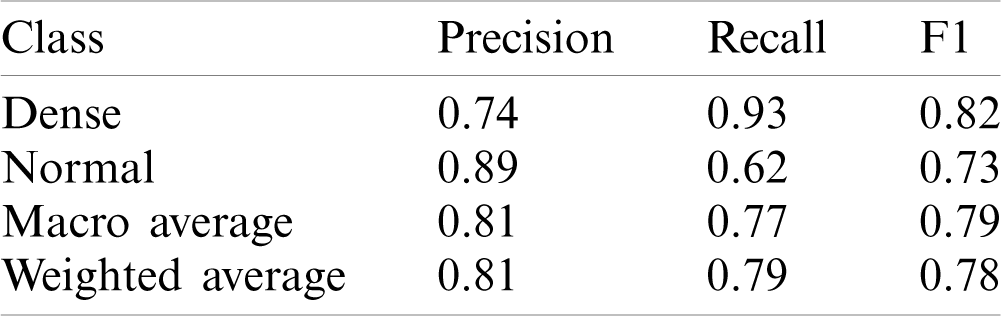
This model yielded the Precision (P), Recall (R) and F1-score (F1) values as 0.74, 0.93 and 0.82 for disease class; whereas for the normal class, it was 0.89, 0.62 and 0.73, respectively. The macro average and weighted average P, R, and F1 was 0.81, 0.77, 0.79 and 0.81, 0.79, 0.78 respectively. The AUC-ROC curve obtained from the model is shown in Fig. 6.
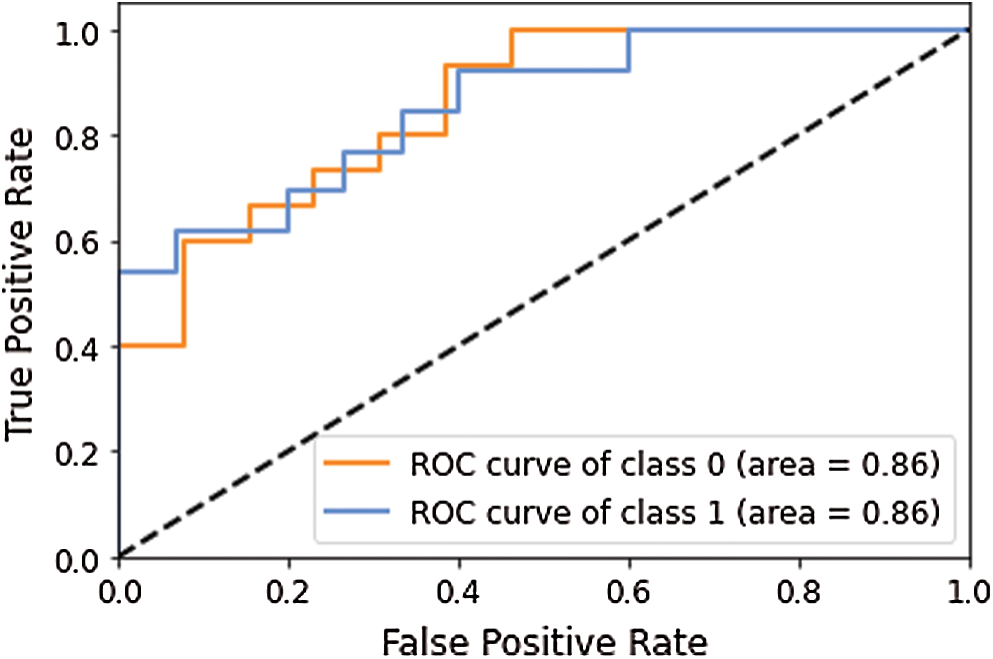
Figure 6: AUC-ROC curve obtained using model 1
As shown in Tab. 2, the proposed model 1 successfully identified the disease cases with a recall value of 0.93, whereas recall value for normal cases was 0.62, which indicated that most normal cases are misclassified. In medical cases, the misclassification rate must be less for both classes so that normal people do not get a treatment similar to the infected people. It may cause the loss of lives as well. Hence, we tried another model to improve the prediction accuracy by adding another CNN layer in the previous model. The other parameter values were the same as one layer of CNN. The results obtained with two layers of Deep-CNN are shown in Tab. 3.
Table 3: Results using two layers of 2D Deep-CNN
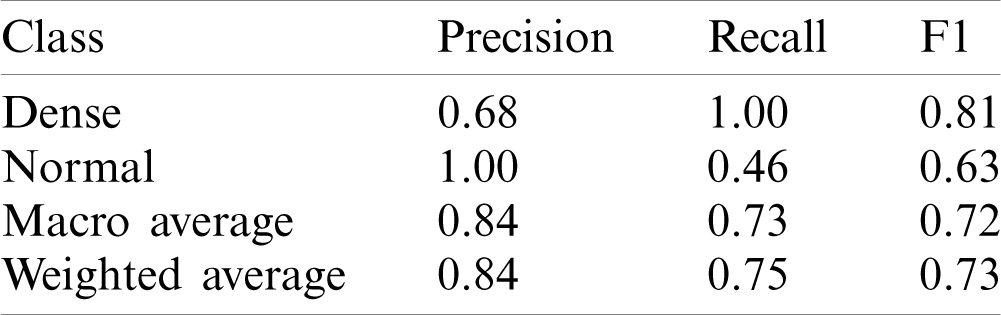
This model yielded the Precision (P), Recall (R) and F1-score (F1) values as 0.68, 1.00 and 0.81 for disease class, whereas for normal class, it was 1.00, 0.46 and 0.63 respectively. The macro average and weighted average P, R and F1 was 0.84, 0.73, 0.72 and 0.84, 0.75, 0.73 respectively. The AUC-ROC curve obtained from the model 2 is shown in Fig. 7.
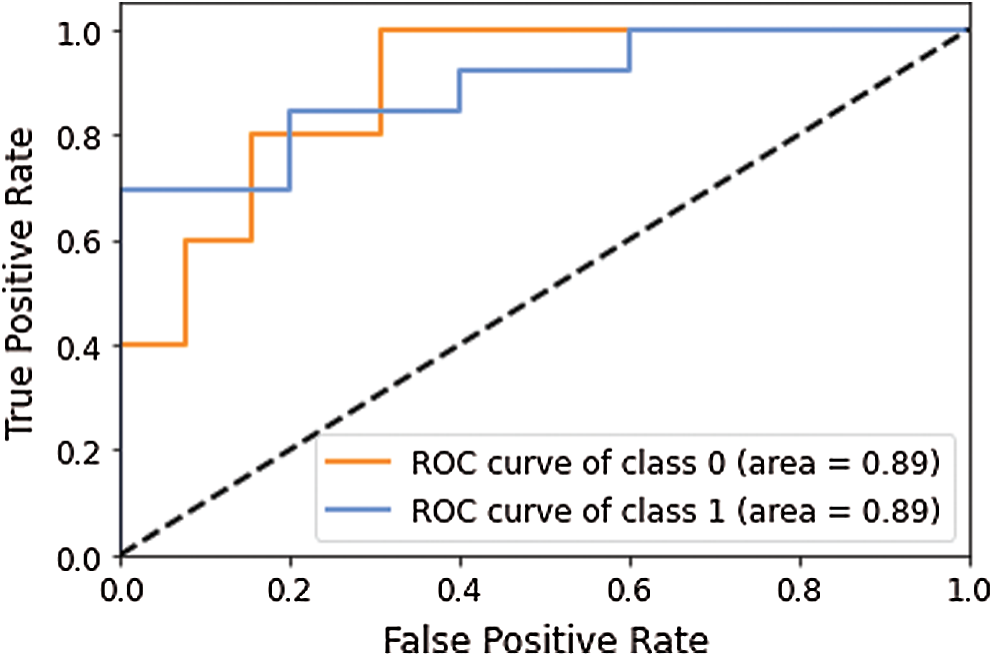
Figure 7: AUC-ROC curve obtained using model 2
Two layers of Deep-CNN achieved the recall value of 1.00 for disease class prediction, whereas for normal class, it is 0.62, which again showed that the model failed to identify the normal cases misclassified to disease classes.
One layer of Deep-CNN and two layers of the Deep-CNN model failed to provide good performance to detect the disease cases; however, both models failed to identify the normal case. To overcome this issue, we tuned the model parameters and tried a different CNN model variant. The detailed results obtained using the different models are presented in Tab. 4. Here model 3 having three layers of Deep-CNN along with the other parameters is listed in Tab. 4.
Table 4: Performance of different models of deep-CNN
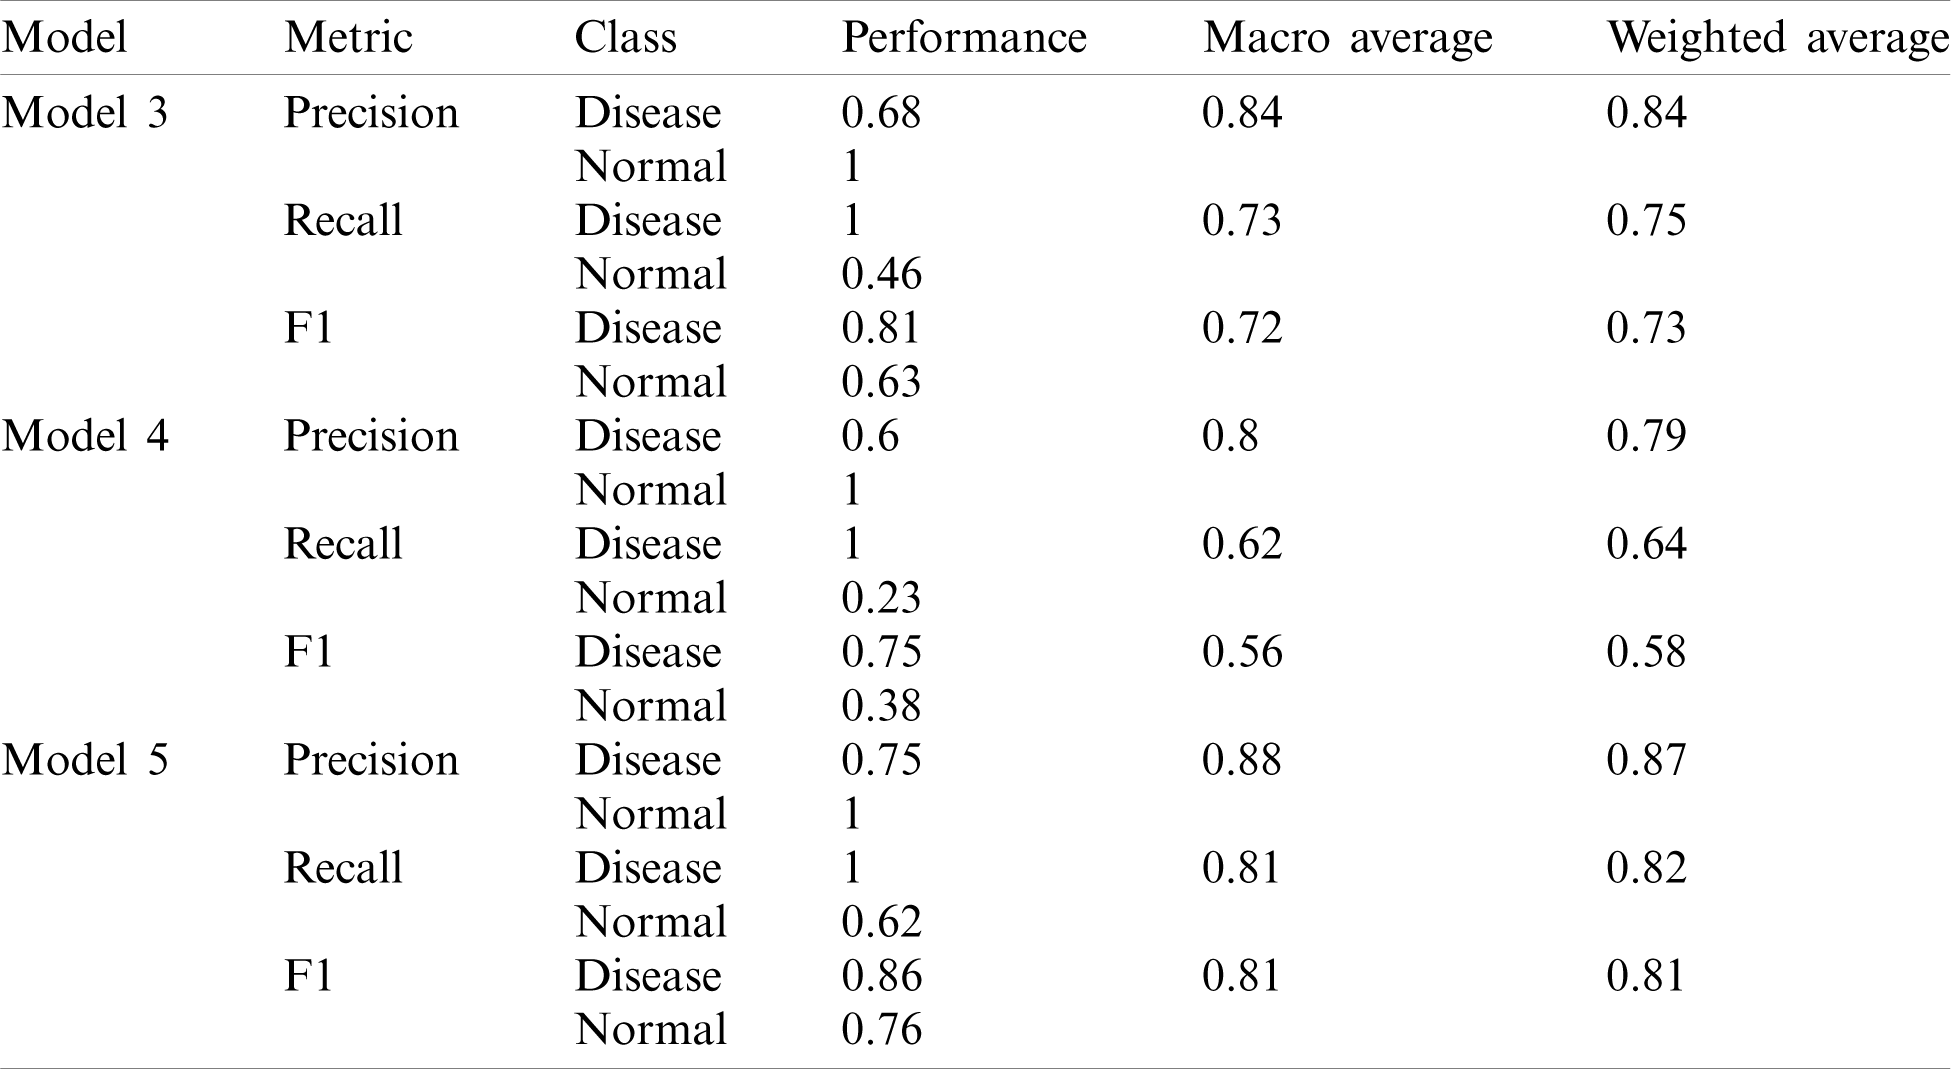
Model 4 consisted of four layers of Deep-CNN, whereas Model 5 was the modified architecture of Model 4. As shown in Tab. 4, Model 3 and Model 4 also performed well for disease predictions, whereas Models 1 and 2 do not give satisfactory performance for normal cases. The AUC-ROC curve obtained from Model 3 and model 4 are shown in Fig. 8.
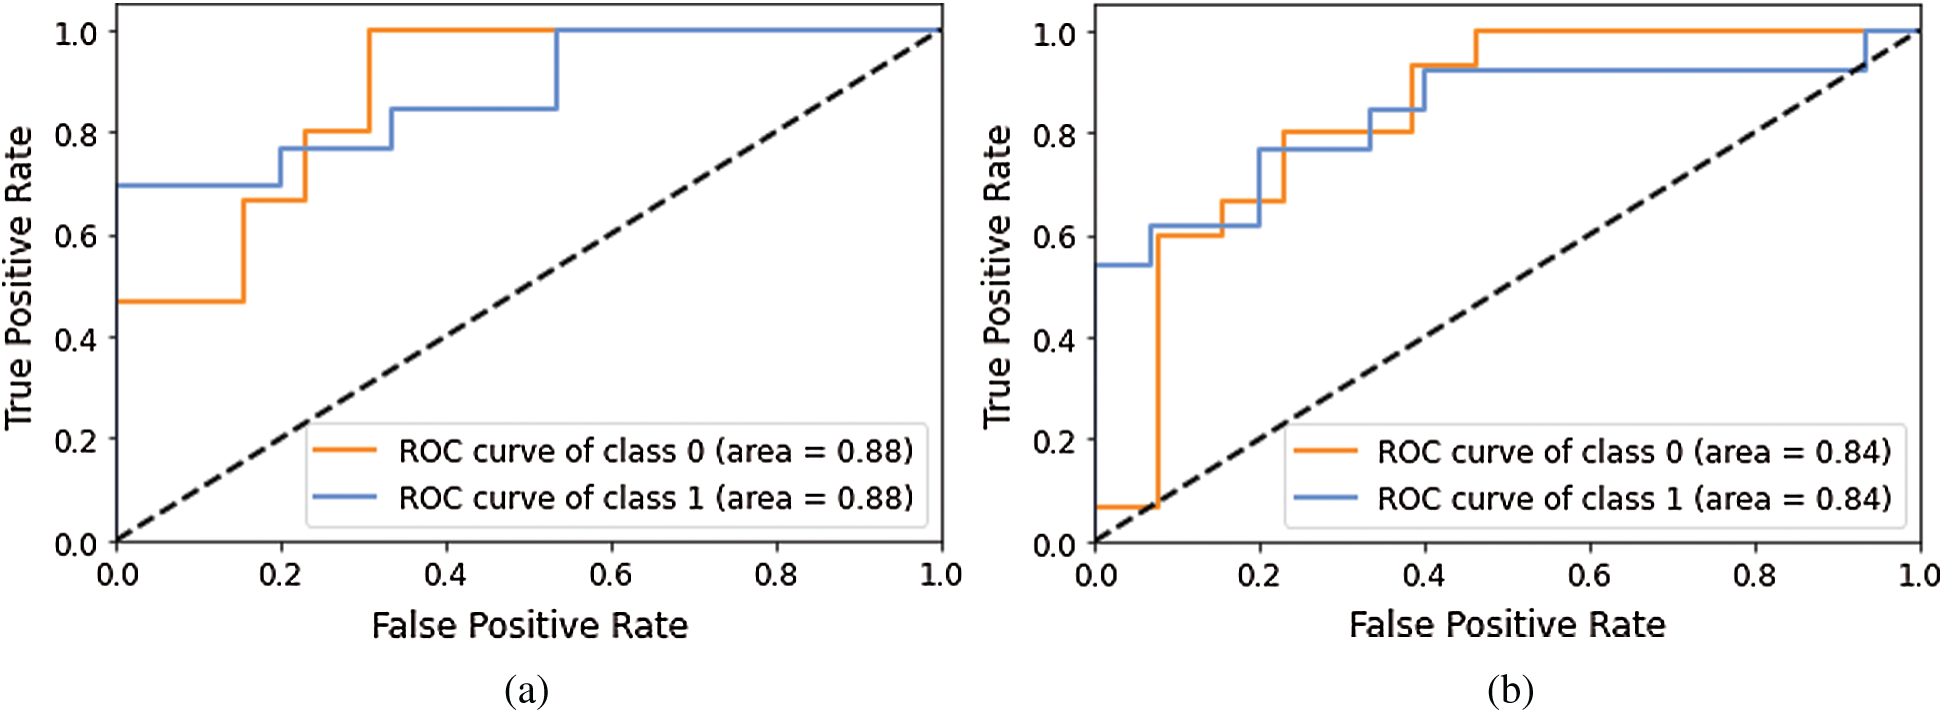
Figure 8: AUC-ROC using different Models of Deep-CNN (a) AUC-ROC curve obtained using Model 3 (b) AUC-ROC curve obtained using Model 4
Models 3 and 4 yielded the same AUC-ROC values; the recall value for the normal class is 0.46 and 0.23, which indicated that increasing the convolutional layer will not help achieve better performance. Hence, in Model 5, we turned the other existing hyper parameters values of model 4, such as the kernel size modified from (2, 2) to (3, 3), stride modified from (2, 2) to (1, 1). Furthermore, the batch normalization process was not used between the second and third layer of CNN; however, it was the same as previous models for layer one and layer 4. With these changes, the model was re-run and it yielded the recall value as 0.62, which was better than earlier experiments but still not satisfactory.
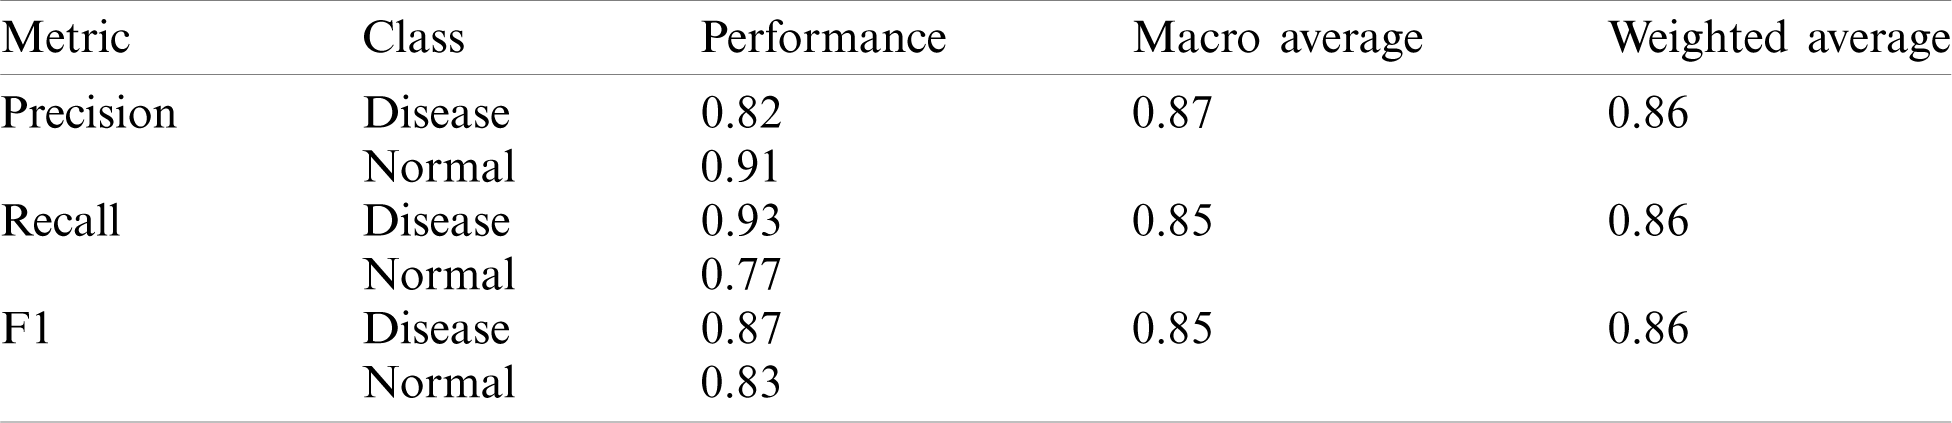
Finally, we modified the structure of model 5 by introducing the Global Average Pooling (GAP) layer in place of the fully connected (FC) layer; hence Model 6 contained four convolutional layers, each of them followed by batch normalization operation and a ReLu activation function. The last layer contained of a GAP layer and a Softmax activation function for classification. Here we maintained dropout values from 0.25 to 0.5 throughout the models and achieved the recall value of 0.77 for normal class whereas 0.93 for disease class, which is the best performance so far. Not only the recall but also the precision and other metrics values were outperformed over the previous models, as shown in Tab. 5.
Table 5: Performance of Deep-CNN model with the introduction of the GAP layer
The AUC-ROC curve obtained using Models 5 and 6 as shown in Fig. 9.
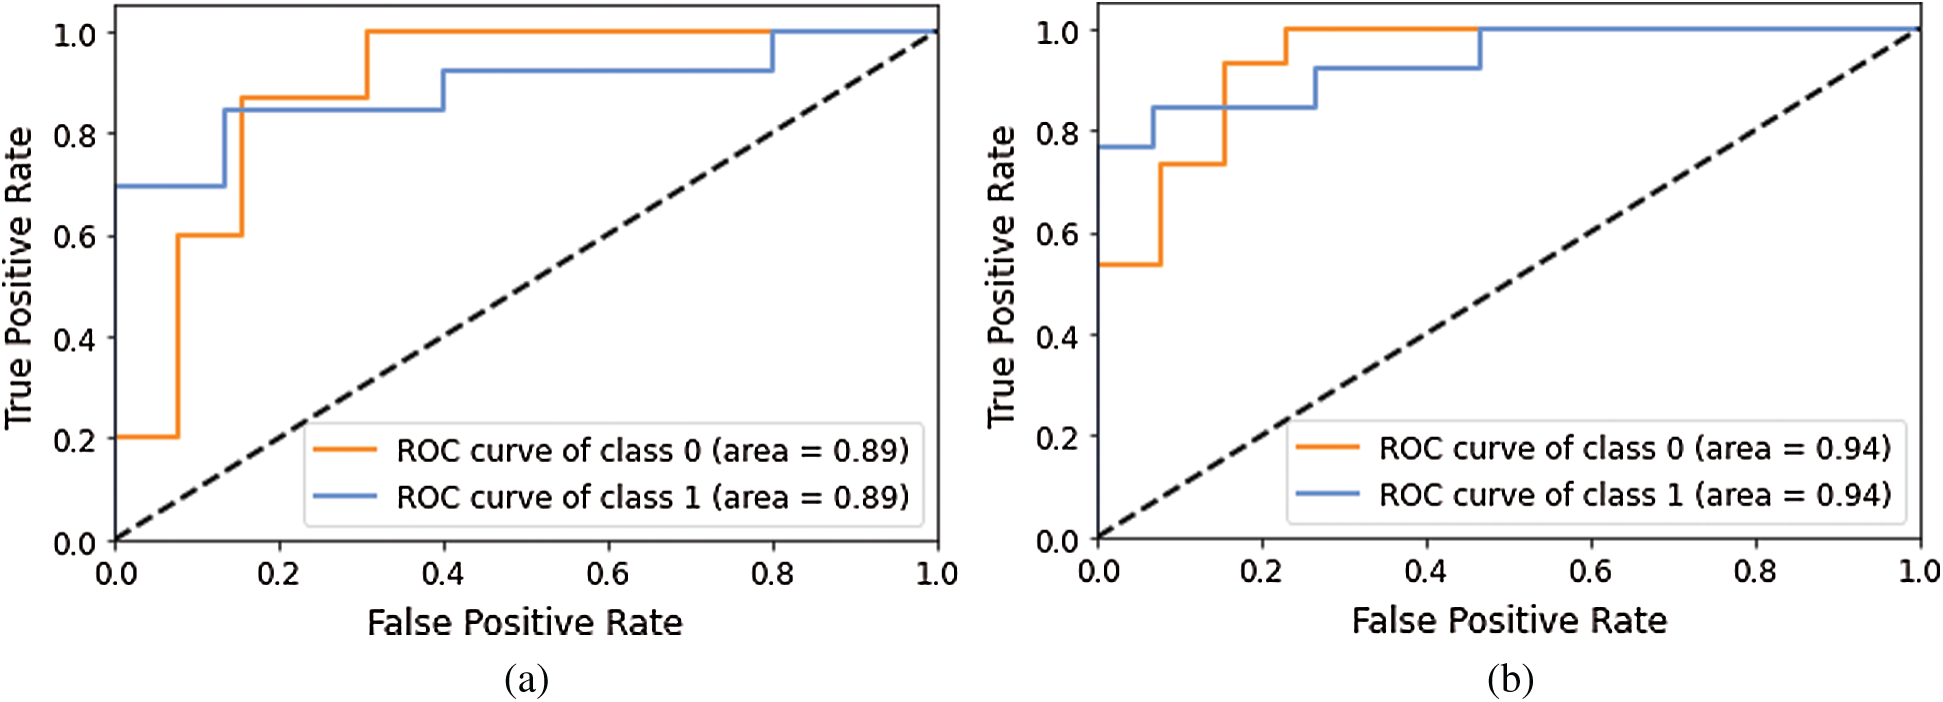
Figure 9: AUC-ROC using different Models of Deep-CNN (a) AUC-ROC curve obtained using Model 5 (b) AUC-ROC curve obtained using Model 6
Figs. 10–12 show a change in loss value according to iterations in our model.
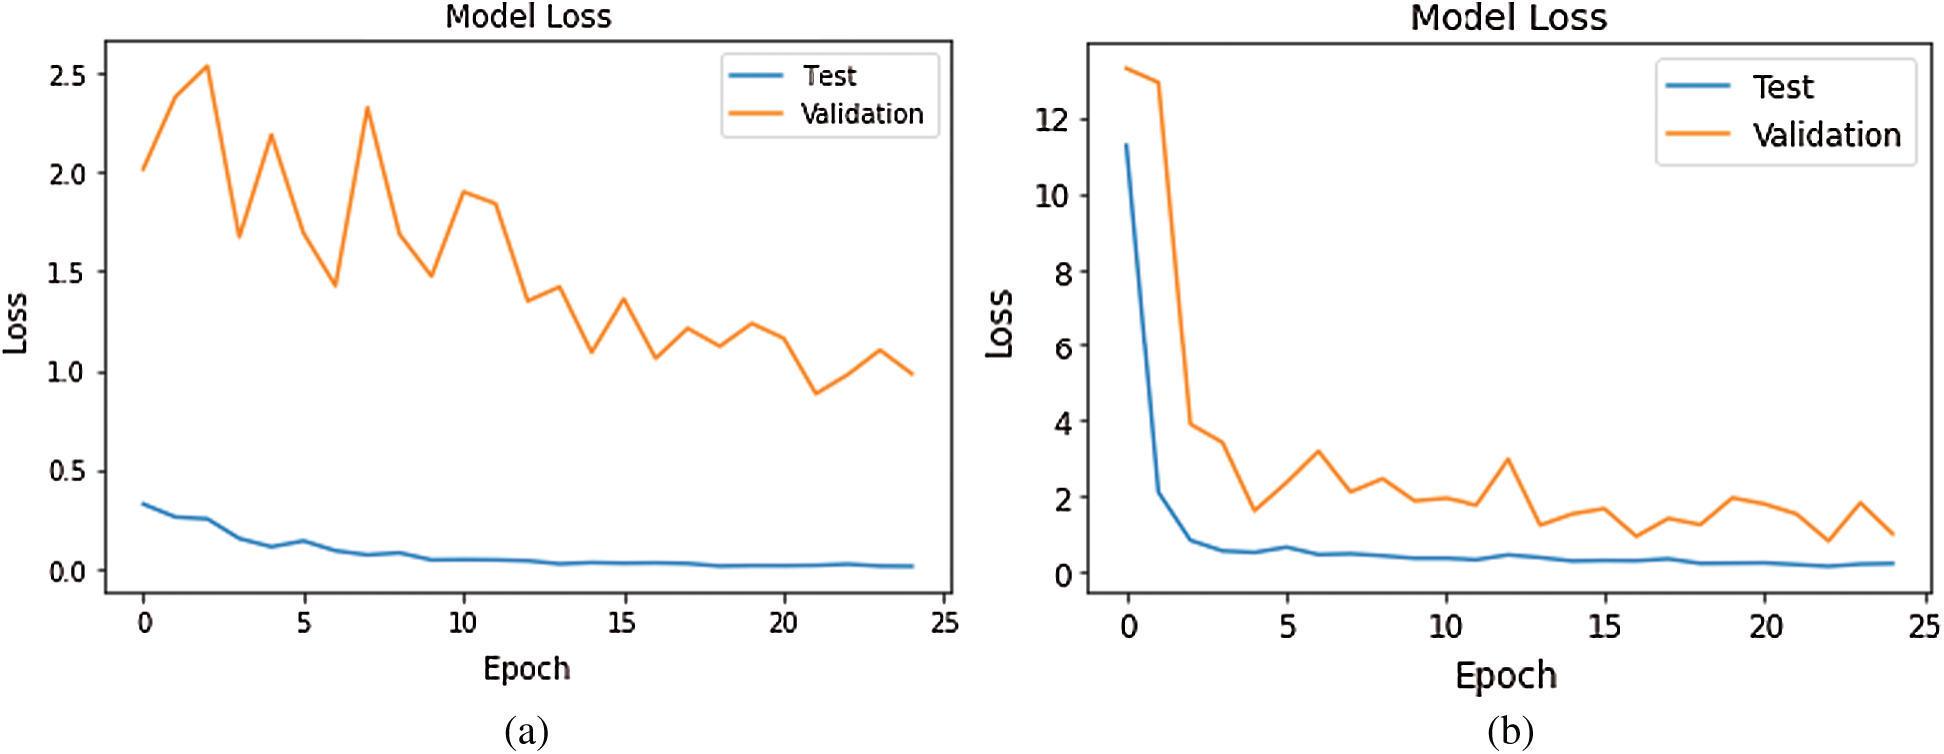
Figure 10: Loss Graph using Model 1 and Model 2 of Deep-CNN (a) loss graph using Model 1 (b) loss graph using Model 2
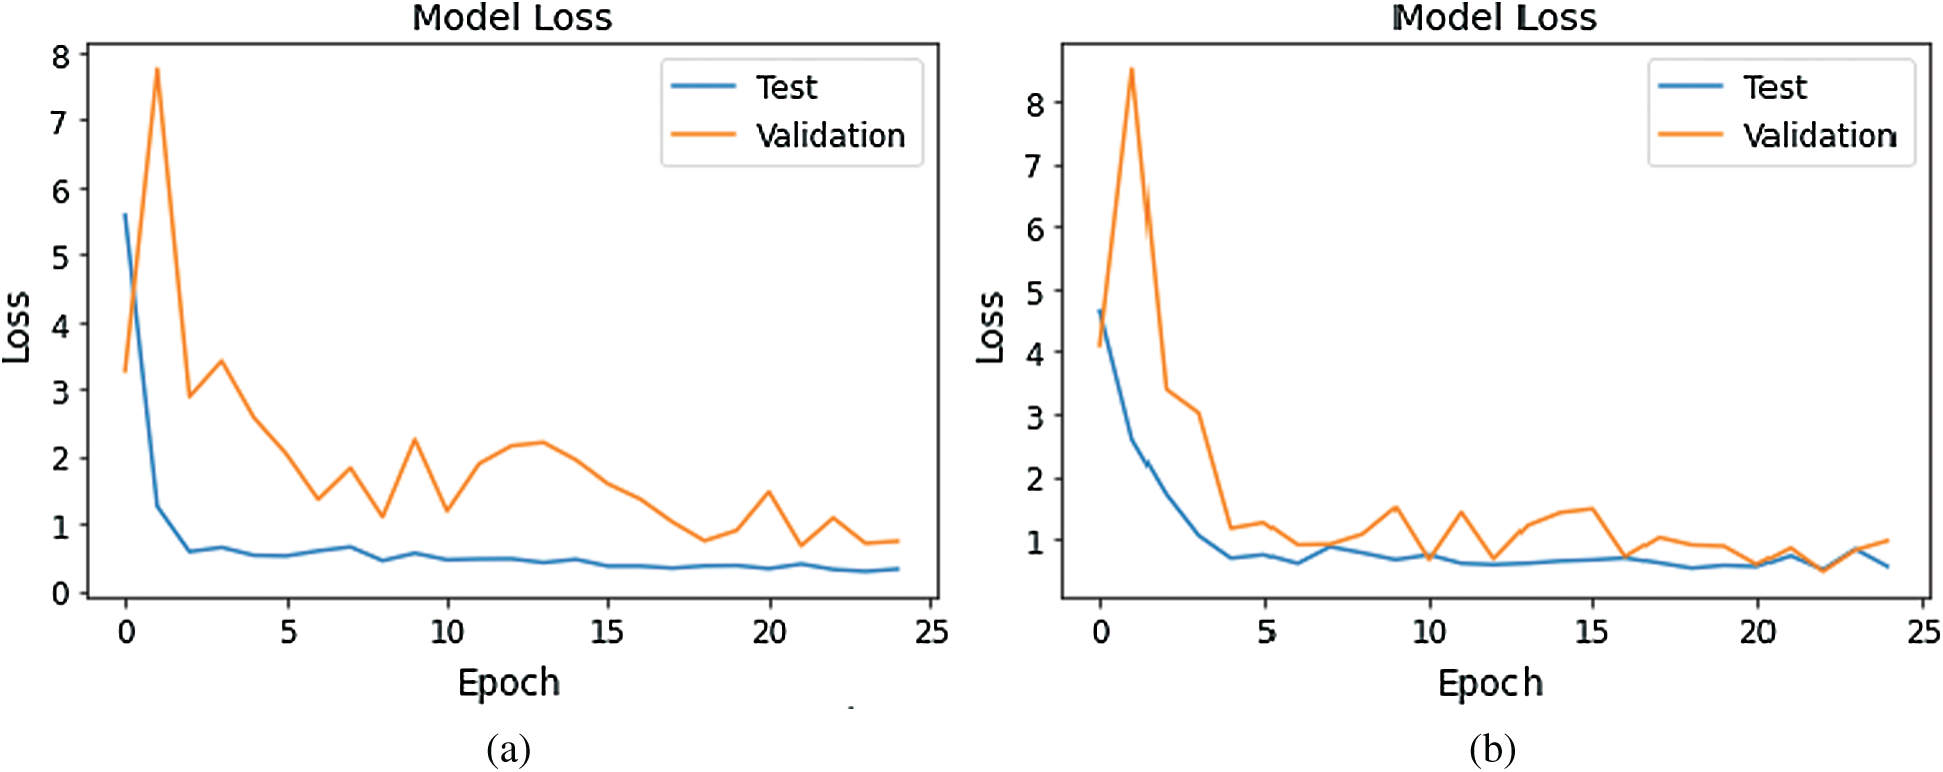
Figure 11: Loss Graph using Model 3 and Model 4 of Deep-CNN (a) loss graph using Model 3 (b) loss graph using Model 4
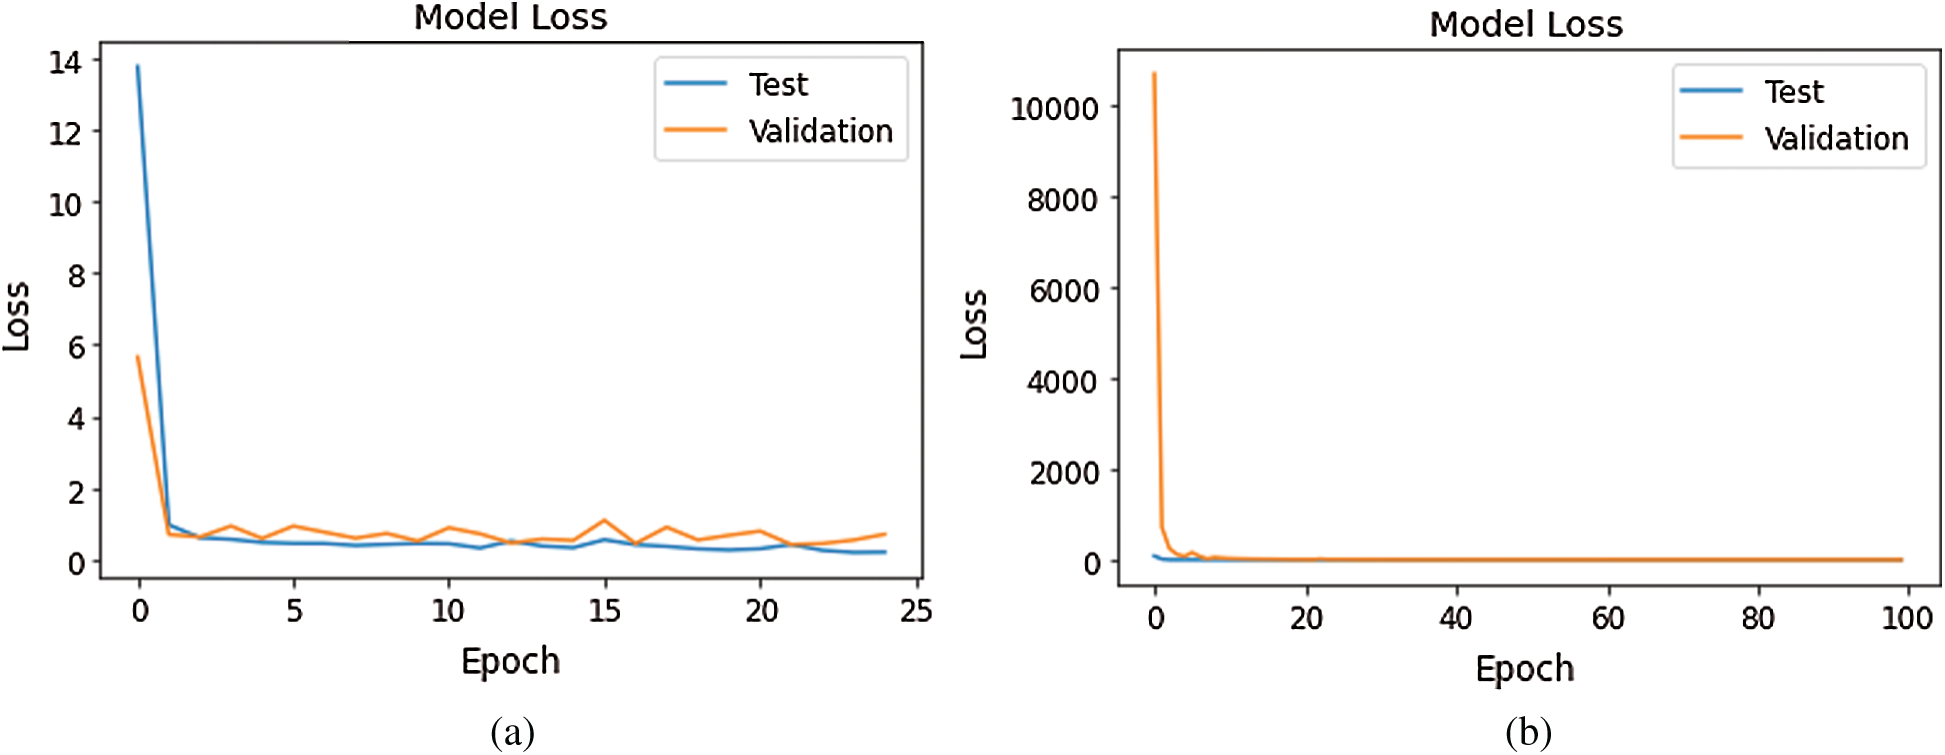
Figure 12: Loss Graph using Model 5 and Model 6 of Deep-CNN (a) loss graph using Model 5 (b) loss graph using Model 6
As shown in Fig. 10, for Model 1, the loss value for validation set was substantial; however, for Model 2 the loss value for validation set abruptly fell after few epochs, and it was clearly converging towards the minimum as epoch increased. Further, this reflected the accuracy boost gradually by iterations. From Fig. 11, it is evident that both the models exhibited a considerable decrease in the loss value for testing and validation sets, with the validation set a little higher value of loss compared to test data. However, the convergence of loss value indicated the efficacy of the model. Moreover, after 10-15 iterations, the loss became stable. As shown in Fig. 12, Model 5 exhibited a sharp decline in loss, and further, the loss curve smoothed following 15 iterations. This specified that a further increase in the number of iterations will have no impact on model loss. For model 6 which was created, with the introduction of the GAP layer instead of a fully connected layer, the loss incurred significantly reduced as it nearly approached zero. Though initially, the loss value was higher—it straightway fell, and after five iterations-the curve almost flattened and stabilized after that, having close to zero signifying the accuracy of the model as high as 98%. Further, having an accuracy of more than 98% finally, our purpose of designing and fine-tuning the model was met. It manifested that continuous updating of hyper parameters and formalizing a lightweight architecture can better classify and predict classification.
The literature shows that supervised techniques such as ANN, kNN, SVM and unsupervised methods like SOM and FCM are well suited for brain MRI classification tasks [3]. However, deep neural networks’ preference is attributed to the extraction and utilization of millions of parameters describing the brain’s structural and functional deformity. Additionally, this type of classifiers does not require manually segmented tumor regions for processing. Hence, multiple neurodegenerative brain diseases, such as Alzheimer’s disease, Parkinson’s disease, and Schizophrenia have been accessed by utilizing appropriate CNN models over brain MRI. However, we focused on brain tumor detection using the Deep-CNN model; hence we narrowed down the search space to brain tumor detection from MRI employing the CNN model as exhibited in Tab. 6.
Table 6: Brain tumor segmentation and classification using CNN model
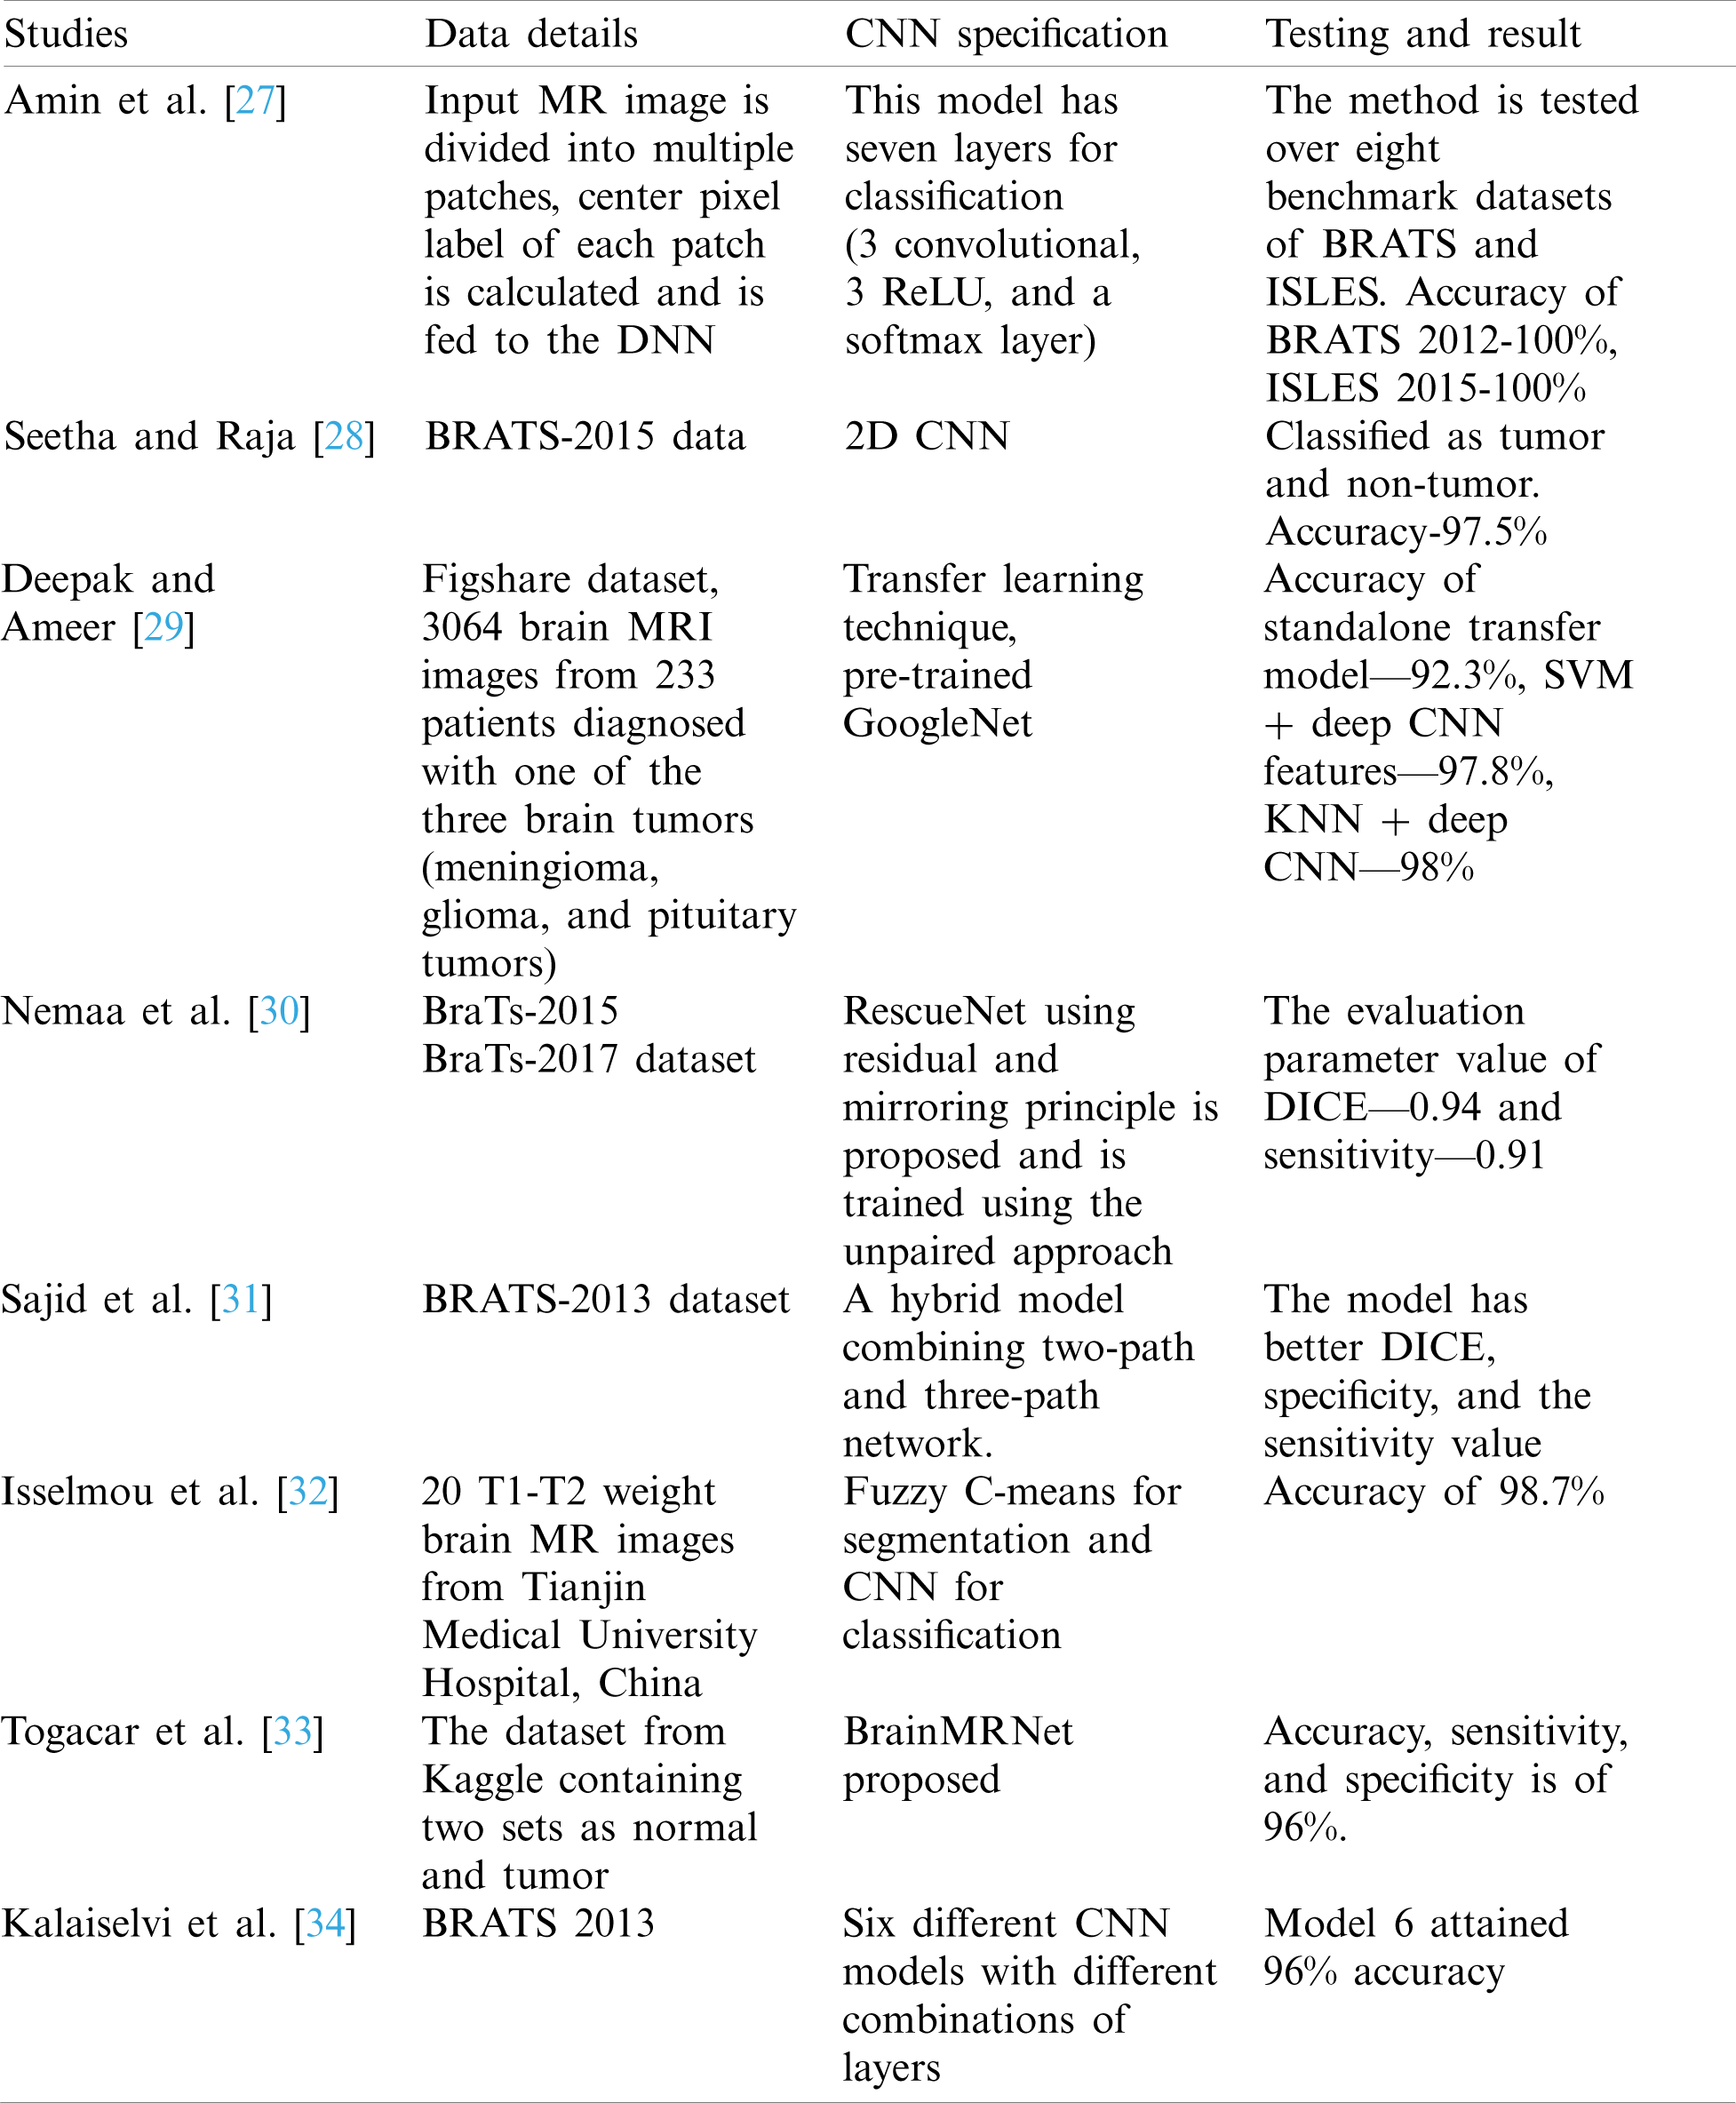
Havaei [35] developed an automatic segmentation method for a brain tumor based on deep CNN. While doing so, they used cascade CNN architectures and found their impact on the performance. Their experimentation revealed that BRATS 2013 implementation was 30 times faster than the previous studies. Another article by Hossain [36] used a series of standard classifiers such as SVM, kNN and MLP, and further achieved 97% accuracy by implementing a CNN. They utilized BRATS 2013 dataset for the experiment. However, our dataset from Kaggle launched in 2019, was a recent one. In comparison to that, we have experimented with different variants of the Deep-CNN model to reduce the process’s complexity.
In this paper, a Deep-CNN based model for automatically identifying brain tumors from brain MRI scan is proposed. The model was tested over a brain tumor dataset. Our model did not have any adverse effect on classification, achieved higher accuracy than the peers in recent years, and attained good detection results including case of abnormality. We improved the accuracy by increasing the network’s depth as the gradients were propagated backward, and it caused an update of parameters. However, these added layers incurred an overhead in terms of computational time and infra. Further, owing to the increase in the network’s depth, the parameter spaces became huge and consequently training errors increased, as these are disadvantages of increasing the depth of the network. Hence, in another embodiment, the GAP layer was employed in place of a fully connected layer to limit the huge parameter space and avoid overfitting. Finally, the layer outperformed others in terms of correct classification and reduced misclassification to zero. In the future work, further improvement can be made by designing models that can drastically reduce the parameter space without affecting classification accuracy.
This designated model may fail for another brain MRI images as MRI images possess varying intensity levels due to different MRI machine configuration (1, 3, 5 or 7T). The images are obtained in multiple MRI modalities (T1, T2, T1c, T2flair) where each modality provides a different kind of information regarding tumor. Moreover, our research is limited to classifying brain MRI images into the normal or abnormal (tumor) categories; however, the tumors can be further classified as malignant or benign since malignant is a kind of dreaded tumor. The finding in this research is to detect the brain tumor only. In the future, this can be extended by further categorizing tumors into glioma, meningioma and pituitary type.
Acknowledgement: This work was supported by the Ministry of Science and Technology, Taiwan, under Grant: MOST 103-2221-E-224-016-MY3.
Funding Statement: This research was partially funded by the “Intelligent Recognition Industry Service Research Center” from “The Featured Areas Research Center Program within the framework” of the “Higher Education Sprout Project” by the Ministry of Education (MOE) in Taiwan and the APC was funded by the aforementioned Project.
Conflicts of Interest: The authors declare that they have no conflicts of interest to report regarding the present study.
1. P. Georgiadis, D. Cavouras, I. Kalatzis, A. Daskalakis, G. C. Kagadis et al., “Improving brain tumor characterization on MRI by probabilistic neural networks and non-linear transformation of textural features,” Computer Methods and Programs in Biomedicine, vol. 89, pp. 24–32, 2008. [Google Scholar]
2. M. Jafari and S. Kasaei, “Automatic brain tissue detection in MRI images using seeded region growing segmentation and neural network classification,” Australian Journal of Basic and Applied Sciences, vol. 5, no. 8, pp. 1066–1079, 2011. [Google Scholar]
3. G. Mohan and M. M. Subashini, “MRI based medical image analysis: Survey on brain tumor grade classification,” Biomedical Signal Processing and Control, vol. 39, pp. 139–161, 2018. [Google Scholar]
4. R. C. Gonzalez and R. E. Woods, Digital Image Processing, 3rd ed. New Jersey, United States: Pearson Prentice Hall, 2008. [Google Scholar]
5. E. S. A. El-Dahshan, H. M. Mohsen, K. Revett and A. B. M. Salem, “Computer-aided diagnosis of human brain tumor through MRI: A survey and a new algorithm,” Expert Systems with Applications, vol. 41, no. 11, pp. 5526–5545, 2014. [Google Scholar]
6. M. H. F. Zarandi, M. Zarinbal and M. Izadi, “Systematic image processing for diagnosing brain tumors: A type-II fuzzy expert system approach,” Applied Soft Computing, vol. 11, no. 1, pp. 285–294, 2011. [Google Scholar]
7. G. T. Reddy, M. P. K. Reddy, K. Lakshmanna, D. S. Rajput, R. Kaluri et al., “Hybrid genetic algorithm and a fuzzy logic classifier for heart disease diagnosis,” Evolutionary Intelligence, vol. 13, no. 2, pp. 185–196, 2020. [Google Scholar]
8. N. Deepa, B. Prabadevi, P. K. Maddikunta, T. R. Gadekallu, T. Baker et al., “An AI-based intelligent system for healthcare analysis using Ridge-Adaline stochastic gradient descent classifier,” Journal of Supercomputing, vol. 77, no. 2, pp. 1–20, 2020. [Google Scholar]
9. A. Onan, “Sentiment analysis on product reviews based on weighted word embeddings and deep neural networks,” Concurrency and Computation: Practice and Experience, pp. e5909, 2020. [Google Scholar]
10. A. Onan, “Sentiment analysis on massive open online course evaluations: A text mining and deep learning approach,” Computer Applications in Engineering Education, pp. 1–18, 2020. [Google Scholar]
11. A. Onan, “Mining opinions from instructor evaluation reviews: A deep learning approach,” Computer Applications in Engineering Education, vol. 28, no. 1, pp. 117–138, 2020. [Google Scholar]
12. P. K. Roy, A. K. Tripathy, T. K. Das and X. Z. Gao, “A framework for hate speech detection using deep convolutional neural network,” IEEE Access, vol. 8, pp. 204951–204962, 2020. [Google Scholar]
13. T. R. Gadekallu, D. S. Rajput, M. P. K. Reddy, K. Lakshmanna, S. Bhattacharya et al., “A novel PCA-whale optimization-based deep neural network model for classification of tomato plant diseases using GPU,” Journal of Real-Time Image Processing, vol. 2, no. 12, pp. 1–14, 2020. [Google Scholar]
14. M. A. Ozdemir, O. Guren, O. K. Cura, A. Akan and A. Onan, “Abnormal ECG beat detection based on convolutional neural networks,” in 2020 Medical Technologies Congress, Antalya, IEEE, pp. 1–4, 2020. [Google Scholar]
15. M. A. Ozdemir, D. H. Kisa, O. Guren, A. Onan and A. Akan, “EMG based hand gesture recognition using deep learning,” in 2020 Medical Technologies Congress, Antalya, IEEE, pp. 1–4, 2020. [Google Scholar]
16. T. K. Das, C. L. Chowdhary and X. Z. Gao, “Chest X-ray investigation: A convolutional neural network approach,” Journal of Biomimetics, Biomaterials and Biomedical Engineering, vol. 45, pp. 57–70, 2020. [Google Scholar]
17. S. Bhattacharya, P. K. R. Maddikunta, Q. V. Pham, T. R. Gadekallu and C. L. Chowdhary, “Deep learning and medical image processing for coronavirus (COVID-19) pandemic: A survey,” Sustainable Cities and Society, vol. 65, no. 13, pp. 102589, 2020. [Google Scholar]
18. L. Zou, J. Zheng, C. Miao, M. J. Mckeown and Z. J. Wang, “3D CNN based automatic diagnosis of attention deficit hyperactivity disorder using functional and structural MRI,” IEEE Access, vol. 5, pp. 23626–23636, 2017. [Google Scholar]
19. L. Cao, Z. Liu, X. He, Y. Cao and K. Li, “Mental disease feature extraction with MRI by 3D convolutional neural network with multi-channel input,” in 2016 IEEE Int. Conf. on Smart Cloud (SmartCloudNew York, USA, IEEE, pp. 224–227, 2016. [Google Scholar]
20. R. Li, W. Zhang, H. I. Suk, L. Wang, J. Li et al., “Deep learning based imaging data completion for improved brain disease diagnosis,” in Int. Conf. on Medical Image Computing and Computer-Assisted Intervention, Cham, Springer, pp. 305–312, 2014. [Google Scholar]
21. W. Lin, T. Tong, Q. Gao, D. Guo, X. Du et al., “Convolutional neural networks-based MRI image analysis for the Alzheimer’s disease prediction from mild cognitive impairment,” Frontiers in Neuroscience, vol. 12, pp. 1–13, 2018. [Google Scholar]
22. S. Iqbal, M. U. Ghani, T. Saba and A. Rehman, “Brain tumor segmentation in multi-spectral MRI using convolutional neural networks (CNN),” Microscopy Research and Technique, vol. 81, no. 4, pp. 419, 2018. [Google Scholar]
23. A. S. Lundervold and A. Lundervold, “An overview of deep learning in medical imaging focusing on MRI,” Zeitschrift für Medizinische Physik, vol. 29, no. 2, pp. 102–127, 2019. [Google Scholar]
24. A. Farooq, S. M. Anwar, M. Awais and S. Rehman, “A deep CNN based multi-class classification of Alzheimer’s disease using MRI,” in 2017 IEEE Int. Conf. on Imaging Systems and Techniques, Beijing, China, IEEE, pp. 1–6, 2017. [Google Scholar]
25. F. Ramzan, M. U. G. Khan, A. Rehmat, S. Iqbal, T. Saba et al., “A deep learning approach for automated diagnosis and multi-class classification of Alzheimer’s disease stages using resting-state fMRI and residual neural networks,” Journal of Medical Systems, vol. 44, no. 2, pp. 37, 2020. [Google Scholar]
26. https://www.kaggle.com/navoneel/brain-mri-images-for-brain-tumor-detection, 2019. [Google Scholar]
27. J. Amin, M. Sharif, M. Yasmin and S. L. Fernandes, “Big data analysis for brain tumor detection: Deep convolutional neural networks,” Future Generation Computer Systems, vol. 87, no. 8, pp. 290–297, 2018. [Google Scholar]
28. J. Seetha and S. S. Raja, “Brain tumor classification using convolutional neural networks,” Biomedical & Pharmacology Journal, vol. 11, no. 3, pp. 1457–1461, 2018. [Google Scholar]
29. S. Deepak and P. M. Ameer, “Brain tumor classification using deep CNN features via transfer learning,” Computers in Biology and Medicine, vol. 111, no. 103345, pp. 1–7, 2019. [Google Scholar]
30. S. Nemaa, A. Dudhanea, S. Muralaa and S. Naidu, “RescueNet: An unpaired GAN for brain tumor segmentation,” Biomedical Signal Processing and Control, vol. 55, no. 101641, pp. 1–8, 2020. [Google Scholar]
31. S. Sajid, S. Hussain and A. Sarwar, “Brain tumor detection and segmentation in MR images using deep learning,” Arabian Journal for Science and Engineering, vol. 44, no. 11, pp. 9249–9261, 2019. [Google Scholar]
32. A. E. K. Isselmou, G. Xu, S. Zhang, S. Saminu and I. Javaid, “Deep learning algorithm for brain tumor detection and analysis using MR brain images,” in Proc. of the Int. Conf. on Intelligent Medicine and Health, Ningbo, China, pp. 28–32, 2019. [Google Scholar]
33. M. Togaçar, B. Ergen and Z. Cömert, “BrainMRNet: Brain tumor detection using magnetic resonance images with a novel convolutional neural network model,” Medical Hypotheses, vol. 134, no. 20, pp. 109531, 2019. [Google Scholar]
34. T. Kalaiselvi, S. T. Padmapriya, P. Sriramakrishnan and K. Somasundaram, “Deriving tumor detection models using convolutional neural networks from MRI of human brain scans,” International Journal of Information Technology, vol. 12, no. 2, pp. 403–408, 2020. [Google Scholar]
35. M. Havaei, A. Davy, F. D. Warde, A. Biard, A. Courville et al., “Brain tumor segmentation with deep neural networks,” Medical Image Analysis, vol. 35, pp. 18–31, 2017. [Google Scholar]
36. T. Hossain, F. S. Shishir, M. Ashraf, M. A. A. Nasim and F. M. Shah, “Brain tumor detection using convolutional neural network,” in 1st Int. Conf. on Advances in Science, Engineering and Robotics Technology, Dhaka, Bangladesh, pp. 1–6, 2019. [Google Scholar]
 | This work is licensed under a Creative Commons Attribution 4.0 International License, which permits unrestricted use, distribution, and reproduction in any medium, provided the original work is properly cited. |