DOI:10.32604/cmc.2021.016214
| Computers, Materials & Continua DOI:10.32604/cmc.2021.016214 | |
| Article |
Ensembling Neural Networks for User’s Indoor Localization Using Magnetic Field Data from Smartphones
Department of Information and Communication Engineering, Yeungnam University, Gyeongsan-si, 38541, Korea
*Corresponding Author: Yongwan Park. Email: ywpark@yu.ac.kr
Received: 27 December 2020; Accepted: 03 February 2021
Abstract: Predominantly the localization accuracy of the magnetic field-based localization approaches is severed by two limiting factors: Smartphone heterogeneity and smaller data lengths. The use of multifarious smartphones cripples the performance of such approaches owing to the variability of the magnetic field data. In the same vein, smaller lengths of magnetic field data decrease the localization accuracy substantially. The current study proposes the use of multiple neural networks like deep neural network (DNN), long short term memory network (LSTM), and gated recurrent unit network (GRN) to perform indoor localization based on the embedded magnetic sensor of the smartphone. A voting scheme is introduced that takes predictions from neural networks into consideration to estimate the current location of the user. Contrary to conventional magnetic field-based localization approaches that rely on the magnetic field data intensity, this study utilizes the normalized magnetic field data for this purpose. Training of neural networks is carried out using Galaxy S8 data while the testing is performed with three devices, i.e., LG G7, Galaxy S8, and LG Q6. Experiments are performed during different times of the day to analyze the impact of time variability. Results indicate that the proposed approach minimizes the impact of smartphone variability and elevates the localization accuracy. Performance comparison with three approaches reveals that the proposed approach outperforms them in mean, 50%, and 75% error even using a lesser amount of magnetic field data than those of other approaches.
Keywords: Indoor localization; magnetic field data; long short term memory network; data normalization; gated recurrent unit network; deep learning
The last decade witnessed a wide attraction for indoor positioning and localization research area by industry and academia alike. The wide spreading of smartphones gave rise to many new services like online shopping, online marketing, and on-the-go services, etc.; such services are collectively called location-based services (LBS). The quality of LBS primarily depends on the knowledge of the location of the consumer, so precise location information serves as the pivotal element of LBS. Undoubtedly, the global positioning system (GPS) is one of the widely used outdoor localization technology that can provide the location with a few meters of accuracy [1]. Despite that many factors like signal blocking off the roofs, walls, tall buildings, and canyons deteriorate its performance for indoor environments [2].
Consequently, a rich variety of alternative positioning and localization technologies for indoor environments have been presented including but not limited to radio frequency identification (RFID), Wi-Fi, Bluetooth, ultra-wideband (UWB), and pedestrian dead reckoning [3–6]. Although each of these technologies has its advantages, every technique is accompanied by limitations as well. These limitations are in terms of achievable accuracy, cost, and infrastructure dependence, etc. For example, UWB requires the installation of sensors, Bluetooth involves the use of beacons and PDR needs the starting/previous position to track a user. The wide prevalence of Wi-Fi access points (APs) in the majority of the buildings made Wi-Fi positioning the leading technology for indoor positioning and localization that can provide an average accuracy of 2 to 5 m. Even so, its performance is severely affected in complex environments owing to several factors like signal absorption, shadowing, multipath, and human mobility, etc. [7].
Recently, the magnetic field (earth’s natural magnetic field) based indoor positioning and localization received a keen interest. The earth’s magnetic field is a natural phenomenon, and pervasive, and does not require additional infrastructures like UWB, Bluetooth, and Wi-Fi, etc. The availability of embedded magnetic sensors in smartphones makes it more attractive. As a result, many indoor localization approaches using the magnetic field data have been presented already [8,9]. Predominantly, the fingerprinting approach is most commonly used for magnetic field-based positioning and localization. However, owing to its limited accuracy, often sequences of the magnetic field data are used for matching than mere value matching. The magnetic field-based localization approaches are affected by two factors in essence: Smartphone heterogeneity, and the length of the magnetic field data used for localization. The former limitation is on account of a diverse number of smartphones that are in use. Various smartphones have embedded microelectromechanical sensors (MEMS) sensors for divergent manufacturers that support different sensitivity and noise resistance. Consequently, the magnetic field intensity has substantial variability when different smartphones are used for data collection. It ultimately affects the accuracy of the magnetic field based localization. The latter limitation points to the impact of data length used for localization. Increasing the length of the magnetic field data for localization tends to improve localization accuracy. However, often, longer data is not available for complex and small indoor environments. The above-mentioned limitations cripple the performance of the magnetic field based indoor localization approaches.
This study proposes the use of normalized magnetic field data to overcome the device heterogeneity by leveraging multiple neural networks for localization. Neural networks are trained on the collected data at ground truth points while predictions of locations are made using the user collected test data. In brief, this study makes the following contributions:
• A localization approach is contrived that benefits from the magnetic field data from the embedded magnetic sensor of the smartphone. A data normalization method is introduced that helps to minimize the impact of smartphone heterogeneity.
• Three neural networks are formulated to estimate the user’s current location including deep neural network (DNN), long-short term memory network (LSTM), and gated recurrent unit (GRU). Neural networks are trained using the normalized magnetic field data.
• The predictions from the networks are incorporated using the devised algorithm to calculate the user’s indoor location.
• Experiments are carried out to analyze the impact of device and time variability. Three smartphones are utilized for experimentation, i.e., LG G7, Galaxy S8, and LG Q6. Results are analyzed for normalized and non-normalized magnetic field data.
• The impact of the length of the magnetic field data used for localization is studied extensively to analyze the change in localization accuracy.
The organization of the paper is as follows. Section 2 discusses localization approaches related to the current study. Section 3 gives a short description of magnetic field characteristics while Section 4 draws the problem statement. Section 5 is about the proposed indoor localization approach and its working methodology. Results are discussed in Section 6 while the conclusion is given in Section 7.
The current study is focused mainly on the models that predict the severity or mortality among COVID patients, statistical models for COVID-19, how various genders are affected in the wake of coronavirus. Additionally, the impact of pre-existing medical conditions like diabetes, hypertension, and heart disease, etc., as well as, the exposure of COVID-19 patients to other diseases are also analyzed. Because there exists a large number of review papers that cover the machine and deep learning works on imaging technology, this study.
The widespread use of smartphones led to the acceleration of smartphone-based localization. The introduction of MEMS sensors paved the way for magnetic field-based indoor localization. Concerning technique, magnetic field-based localization approaches can be grouped under four categories: Pure fingerprint approaches, fingerprint approaches with additional sensors, approaches based on indirect use of deep learning and directly using deep learning approaches.
Pure fingerprinting approaches utilized the data from the magnetic sensors alone for positioning and localization. Initial studies conducted using magnetometer fall in this category. For example, the authors performed indoor localization using the geomagnetic field data from a smartphone in [10,11]. Fingerprinting, however, involves wardriving which is labor-intensive and time-consuming. So, crowdsourced fingerprinting approaches are presented, as in [12]. Even so, fingerprinting based localization has limited accuracy, and data from additional sensors is fruitful to increase the accuracy.
Predominantly, magnetic field fingerprinting is used with other technologies like Wi-Fi and additional sensors to elevate the performance of indoor localization approaches. For example, research [13] presents the use of WiFi aided magnetic field fingerprinting to improve accuracy. Wi-Fi helps to restrict the search space with the help of Wi-Fi access points (APs). Similarly, [14] uses the smartphone camera to assist magnetic field-based indoor positioning. The above-cited approaches anyhow, do not study device heterogeneity. Data from accelerometer, gyroscope, and barometer, etc. can also be used to improve the localization performance. As in [15], where authors perform sensor fusion with magnetometer, accelerometer, and gyroscope for indoor localization. Experiments involve two smartphones from different companies to study the impact of device heterogeneity. In the same way, research [16], makes the use of a modified particle filter approach for indoor localization. Sensor fusion is performed and device heterogeneity is studied as well. Research works that focus on improving the fingerprinting process have also been done. For example, the authors in [17] propose a hybrid approach that fuses the existing magnetic field intensity fingerprinting with a new fingerprinting model. This approach improves the performance as well as, releases the localization process from the calibration process. Further, the localization accuracy is enhanced using a motion model that carries out dynamic step length estimation and augments a particle filter with step length estimation and heuristic particle resampling. Despite the modifications offered by the discussed research works, the localization involves using a longer sequence of the magnetic field data to achieve higher accuracy.
In recent years, deep learning-based approaches are investigated using magnetic field data. Both indirect and direct use of deep learning models on the magnetic field data is examined. The indirect application of deep learning models refers to using these models as assistive modules to improve localization performance. In these approaches, the magnetic field data is not used with deep learning models, as in [18] where a convolutional neural network (CNN) is used to identify an indoor scene. Images are captured during the fingerprint collection at each step. These captured images are fed to a Caffe-trained CNN model to recognized scenes. The identified in turn is used to narrow the search space for magnetic field data matching. Similarly [19] uses CNN to improve localization accuracy in a multi-floor environment. These approaches do not leverage the magnetic field data to train deep learning models, so the potential of deep learning models is not utilized.
Deep learning models are trained on the magnetic field data as well where the prediction is made based on the user collected magnetic field. The approaches in this category collect the magnetic field data at designated locations. The collected data is later used to train and test the models. The localization is considered as a classification problem where the trained models are used to classify the test data, where each class corresponds to a specific location. The maximum error in such approaches may be high, so accelerometer and gyroscope data can be used to overcome this limitation. For example, research [20] proposes the use of DNNs and MEMS sensor data to perform indoor localization. DNNs are trained on the magnetic field data while MEMS data is used to filter out outlier predictions from DNNs. CNN has been also utilized with magnetic data to perform indoor localization. For example, authors in [21] devise an indoor localization method that uses the magnetic field data from a smartwatch. The magnetic field data with smartwatch orientation is collected to train CNNs. Experiments indicate promising results.
The performance of the above-cited research works can be degraded due to many factors. For example, approaches that use fingerprinting have limited accuracy and do not meet the standards of indoor localization. On the other hand, localization approaches that leverage WiF- data to refine location accuracy increase latency. Obstacles, furniture, and human mobility degrade the localization performance of such approaches [22,23]. Besides, Wi-Fi signals are sensitive to random noise, path loss, multipath interference, and shadowing [24]. Not to mention the fact that Android’s recent versions introduced ‘throttle’ that limits the scanning frequency for such approaches. Often, the amount of the magnetic field data used for location estimation is large. The use of heterogeneous smartphones makes it further complicated to devise an approach capable of working seamlessly with different smartphones.
For that reason, we aim to contrive an approach that can minimize such limitations without relying on Wi-Fi APs data, and Bluetooth, etc. and utilizing only the magnetic field data.
3 Background of Geomagnetic Field
The magnetic field is the natural phenomenon of the earth that is caused by the flow of convection currents in its outer core. Absent man-made structures, the change in the magnetic field is slow and the magnetic field intensity varies between 20 to 65
Fig. 1a shows the components of the magnetic field while Fig. 1b shows how the smartphone embedded magnetometer represents various elements of the magnetic field data. There are two well-known representations for the magnetic field data. The first representation is through x, y, and z which show the north, east and downward components of the magnetic field, respectively. The second representation would be to use F, I, and D that shows the total intensity, the inclination angle, and the declination angle, respectively [25]. Often, H called total horizontal intensity is used as well to increase the feature vector for the magnetic field-based indoor positioning approaches. The F and H are calculated as
where
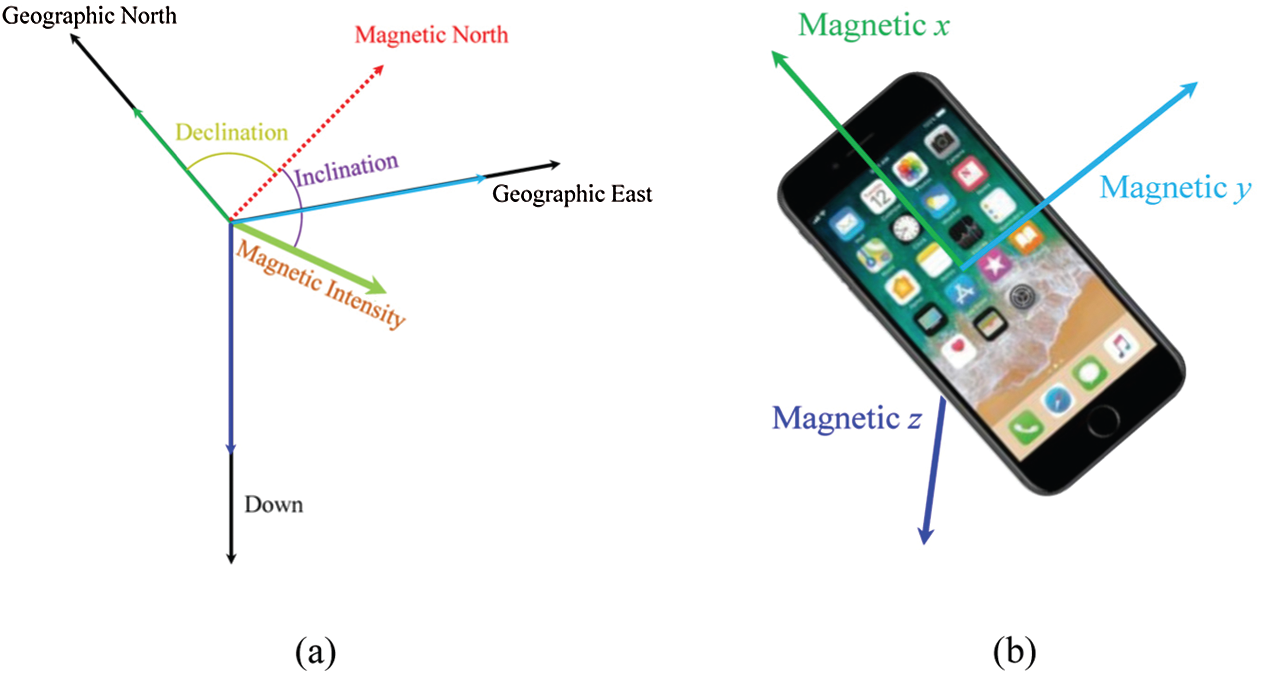
Figure 1: Description of the magnetic field. (a) The components of the magnetic field for magnetic north, (b) the measurement for magnetic field components with smartphone embedded magnetometer
Even though recent years have seen many indoor positioning approaches using the magnetic field data, the main challenge for its wide applications is device heterogeneity. Heterogeneity of devices and variability of the magnetic field data in space and time pose a real challenge to the systems based on the magnetic field data. Consider, for example, the data shown in Fig. 2. Figs. 2a and 2b show the magnetic field data that is collected for the same location during different times with S8 and G7 smartphones respectively. The magnetic field intensity is different for various scans, despite being collected for the same location.
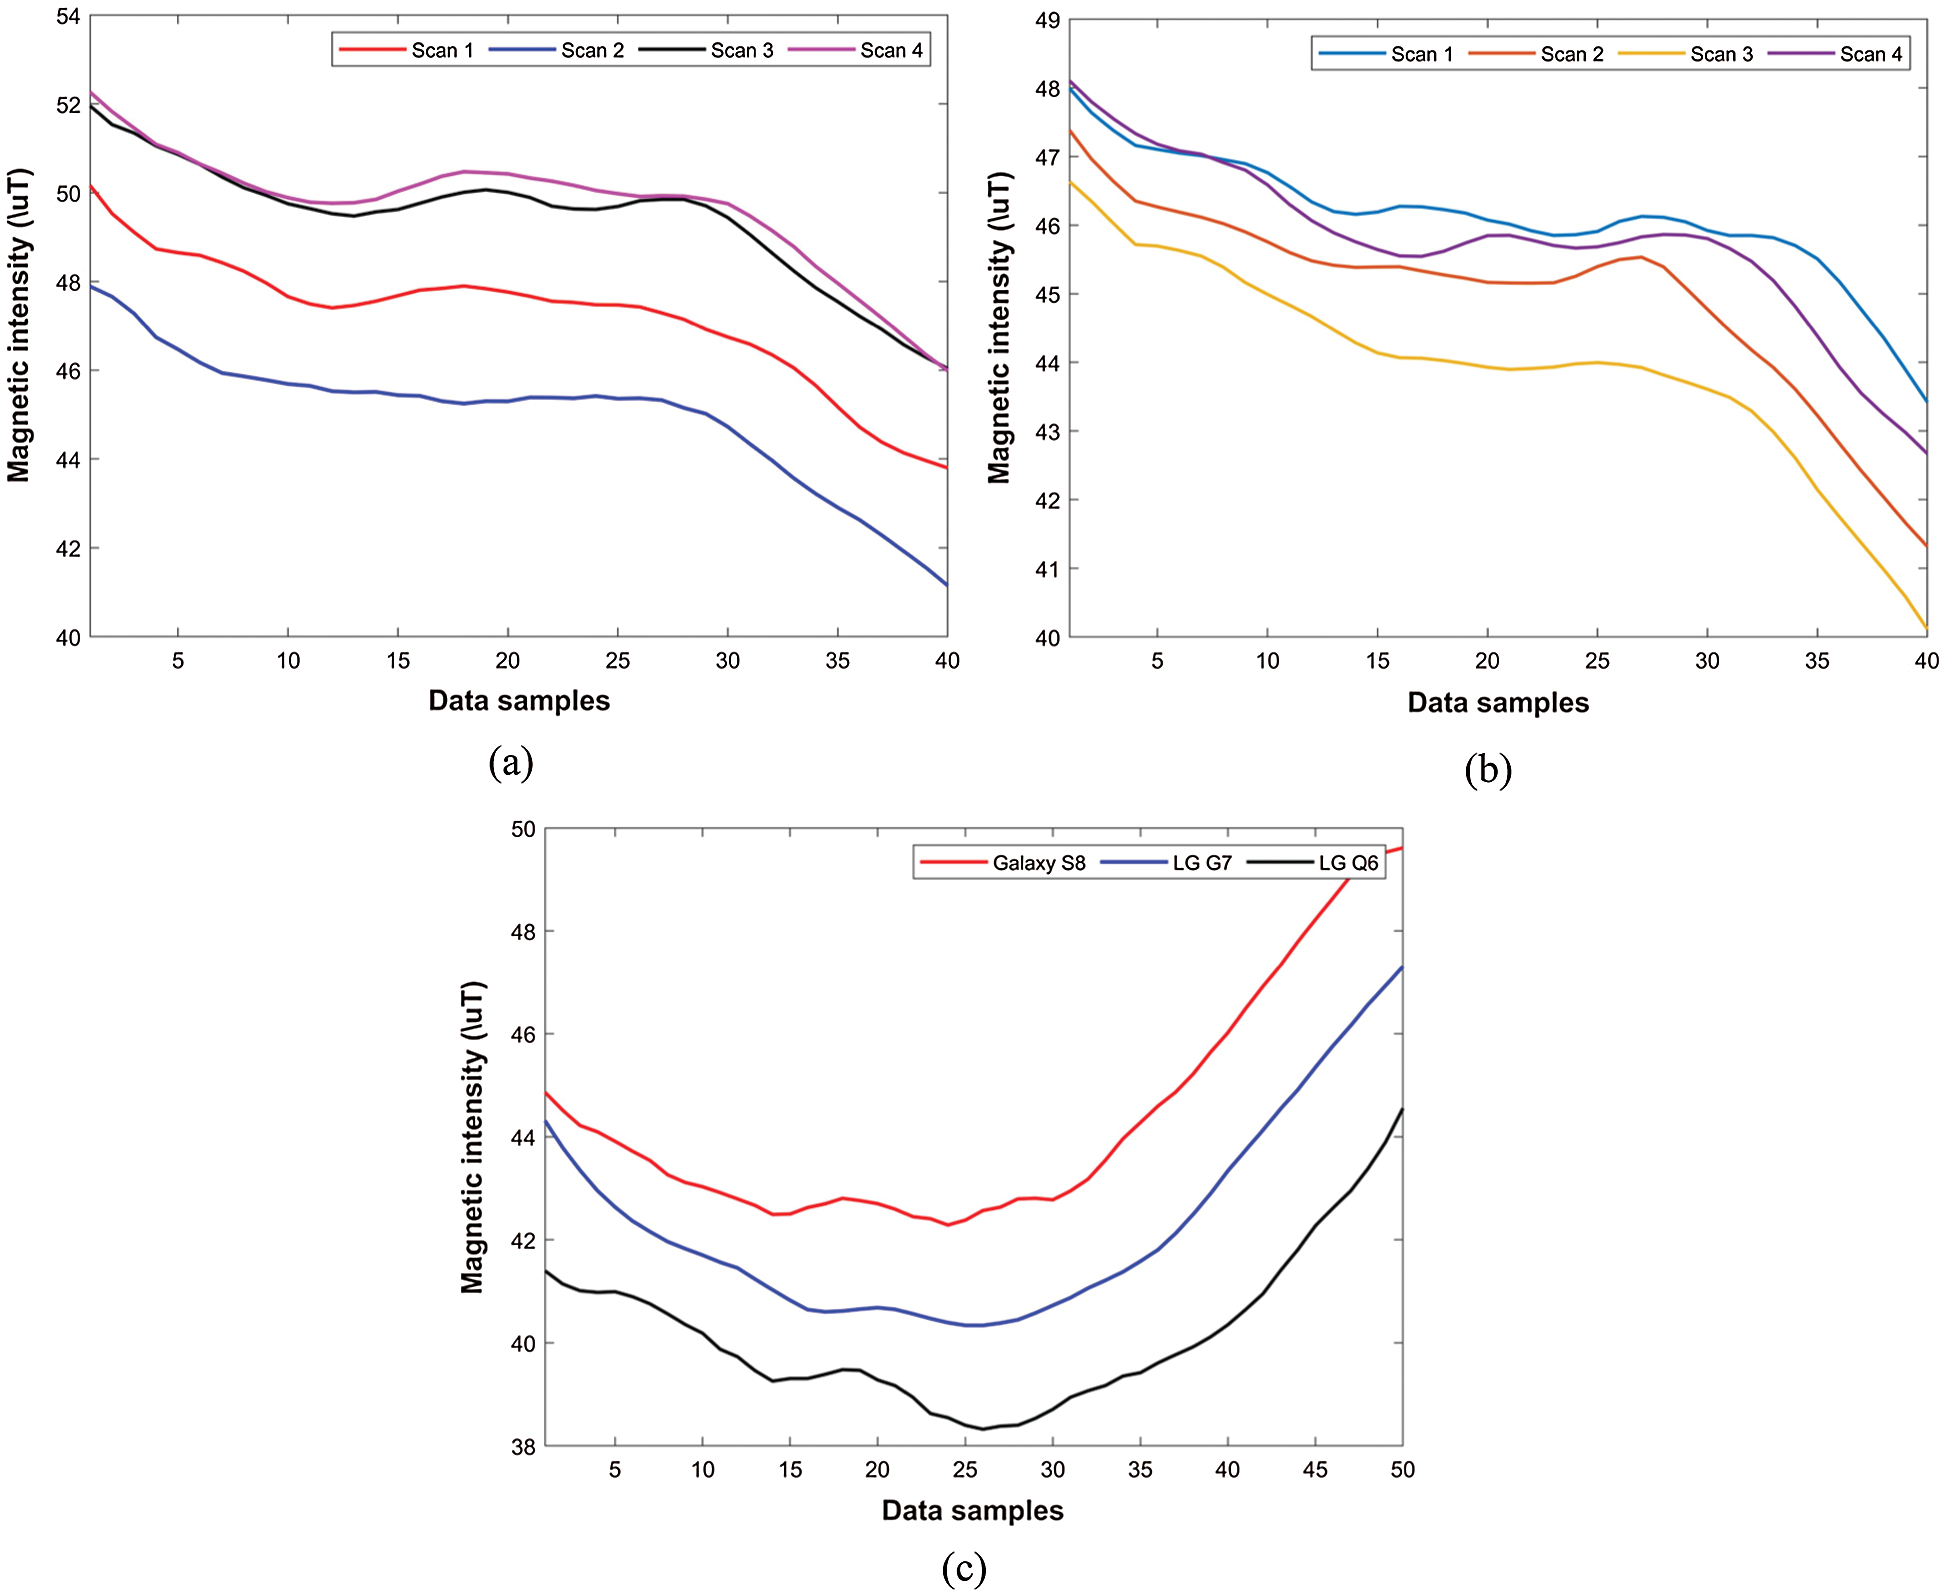
Figure 2: Magnetic field data at different times, and with different devices. (a) The data collected during different times at the same location using S8, (b) The data collected during different times at the same location using G7, (c) The magnetic field data collected using S8, G7, and Q6 for the same location
There are few solutions to solve the heterogeneity and data variability. First, an approach that can work with various fingerprint databases for the device used for localization. One solution would be to make the fingerprint database for each device and use it accordingly. However, it is not very feasible due to the rich variety and models of smartphones. The second option is to use the sequence of values instead of a single value for matching. Although this solution tends to be accurate than the first, yet it is not very ideal. Dynamic time warping (DTW) is utilized as well for matching when the data being matched is of different lengths. Still, DTW matches the values and often expensive for computational resources when the matching data is longer. Pattern matching has shown promising results for magnetic field-based indoor localization in many research works. However, it comes with two main limitations, i.e., the length of the data required for matching is often big, and the computational complexity. So, the problem addressed in this study is to achieve accurate indoor positioning, with a smaller length of data from heterogeneous devices.
This section discusses the working process of the proposed approach. We consider the magnetic field-based localization task as the classification problem and leverage a variety of neural networks including DNN, LSTM, and GRN. The localization is carried out through the training and testing phases that are discussed here separately.
The training phase comprises data collection, noise removal, data normalization, and training using the neural networks.
This phase involves the data collection at the indoor place where the localization is intended. First, the ground truths are determined for data collection. The indoor area is divided into a grid which is a standard step followed in the majority of indoor localization systems. The points on this grid are separated by a 1 m distance. This helps to evaluate the localization error, i.e., difference in the user ground truth location and the predicted location by a classifier. Although smartphones support the data collection at a higher sampling rate, we collect it at 10 Hz which is also followed in other research works [26,27].
The size of the feature set for the training data is very important and plays a pivotal role to achieve high accuracy. Predominantly, a larger feature vector proves to be more accurate in determining the class of new data. However, too large a feature set often degrades the classifier performance as well. On the other hand, increasing the size of the feature set using the magnetic field data requires longer data sequences that may not be available in many cases, for example, when the indoor area is complex or very small or the user changing directions or stopping frequently. Such situations make it very difficult to get the desired feature set or the feature set may not be suitable enough to get the desired results.
Henceforth, this study makes the use of a short feature set than those of previous studies whereby large sequences of magnetic field data are used for indoor localization. We conduct experiments with only 2 s data from the smartphone magnetometer.
The data from smartphone sensors contain noise due to the sensitivity of the sensors as well as, the slight movements of the user’s hand. Similarly, certain abrupt movements or shaking can cause such noise in the data and needs to be removed to improve the training process and performance of the classifier. Fig. 3a shows the raw data from Galaxy S8 for the indoor area intended for localization. It can be seen that the data contains frequent peaks and valleys. We perform wavelet denoising to remove this noise. Fig. 3b shows the data after the noise is removed. The spikes in the data have been smoothed.
Figure 3: Collected magnetic field data using S8. (a) Raw data, (b) data after denoising is done
A big challenge using the magnetic field data for indoor localization is to cope with the data variability. As stated earlier, the data values are different for different smartphones, so are they for the same smartphone when used at different times. DTW is used to mitigate the impact of data variability, however, it matches the values instead of magnetic field patterns. Research shows that despite the variability in the magnetic field data for various smartphones, the patterns have a high resemblance [28]. We propose the use of data normalization to overcome this limitation. We make use of a modified min–max normalization approach for this purpose. Data normalization is done using
where
The length of the data sample used in this study is 20 samples which comprise 2 s data at a sampling rate of 10 Hz from the magnetic sensor of the smartphone. Traditionally, min–max normalization takes the global minimum and maximum for normalization, however, we take local minimum and maximum for this purpose.
Fig. 4 shows the process followed to normalize the magnetic field data collected from the smartphone embedded magnetic sensor. Fig. 5 shows the data before and after normalization is done. The distance between the data samples of various smartphones is decreased due to the normalization. Our experiments reveal that when the normalization is performed, the classifiers perform better than when non-normalized data is used.
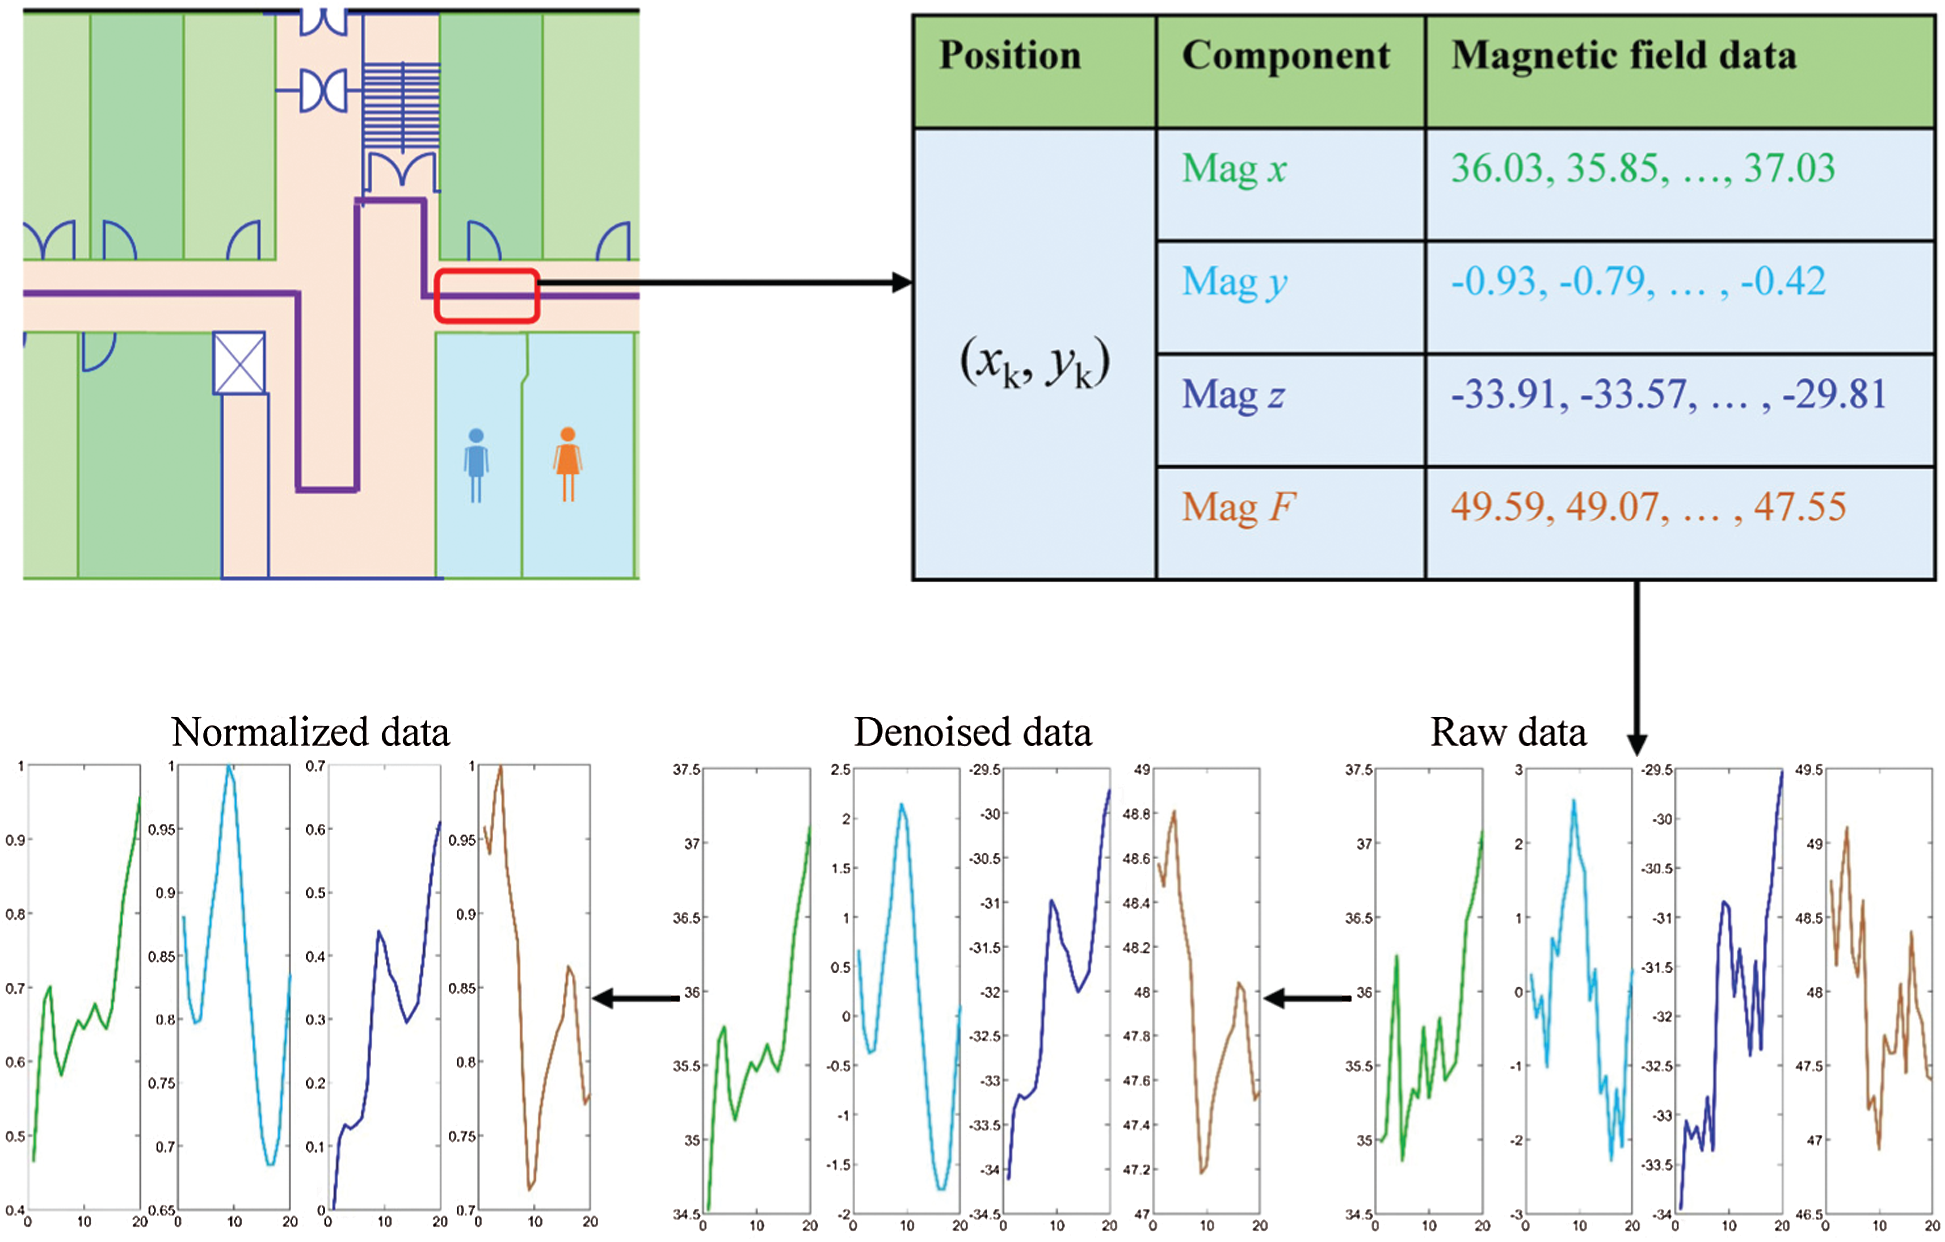
Figure 4: The normalization process for the magnetic field data
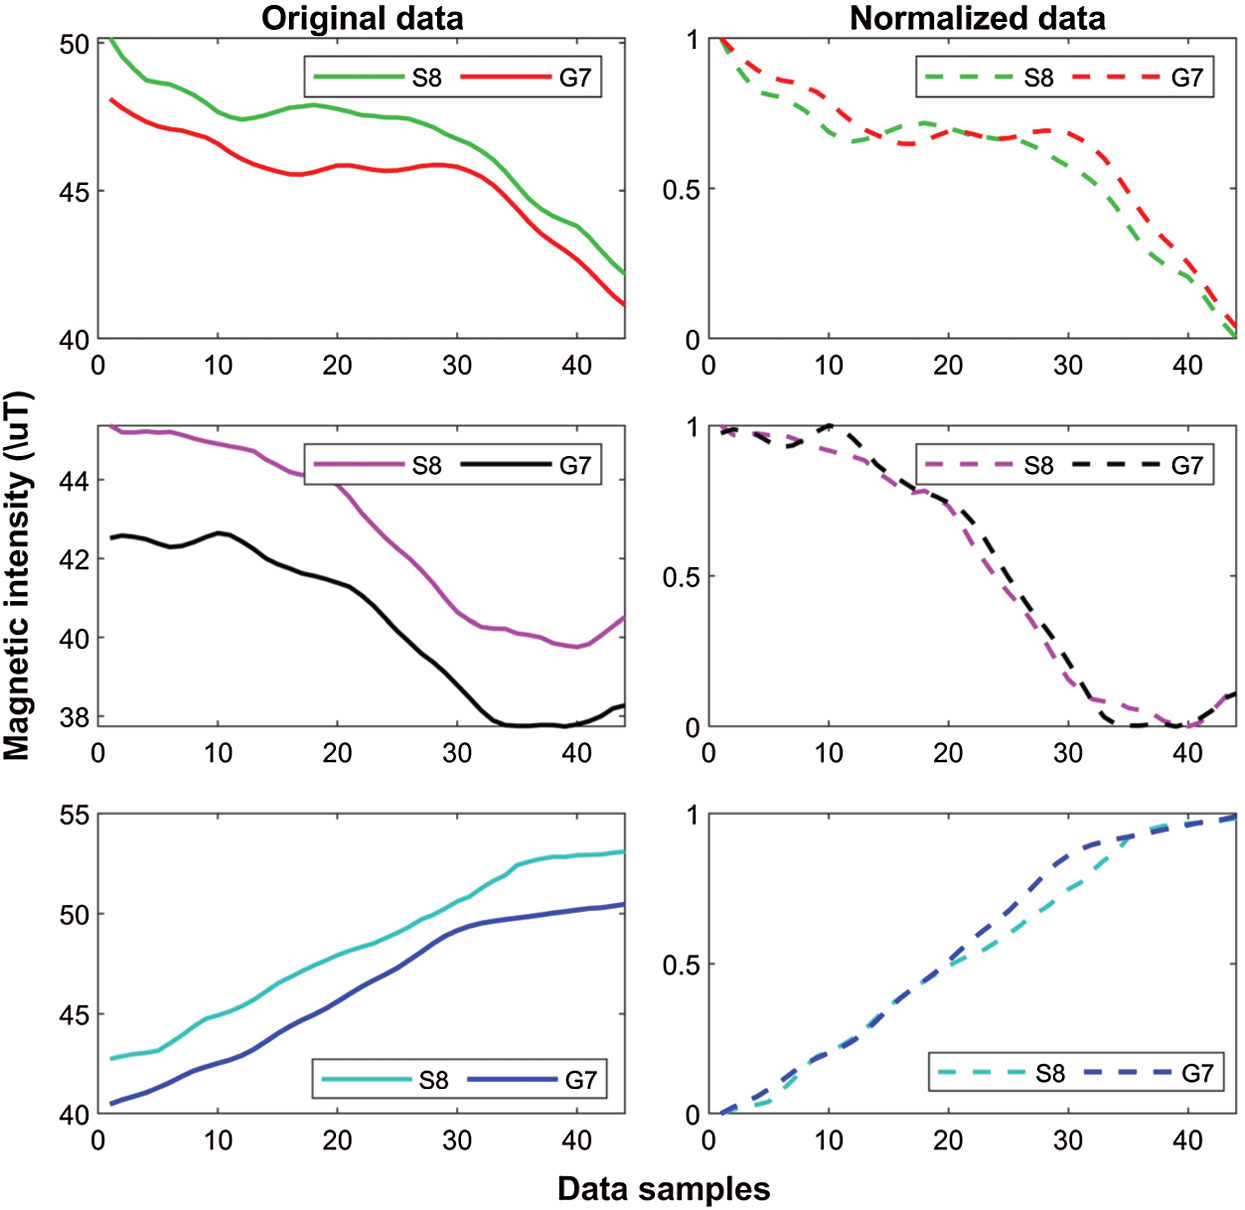
Figure 5: Denoised and normalized data. Normalization tends to reduce the distance between the data from different smartphones
5.1.4 Training Using the Neural Networks
This study uses the normalized data to train three neural networks DNN, LSTM, and GRN. Three networks are used so that the output from multiple networks can be leveraged to increase the indoor localization accuracy. The length of each normalized data sample is 20 at any given location and it is used to train all the neural networks. The same data is used for training all the networks. Each network, however, has a different architecture. Fig. 6 shows the architecture of each network used in the current study.
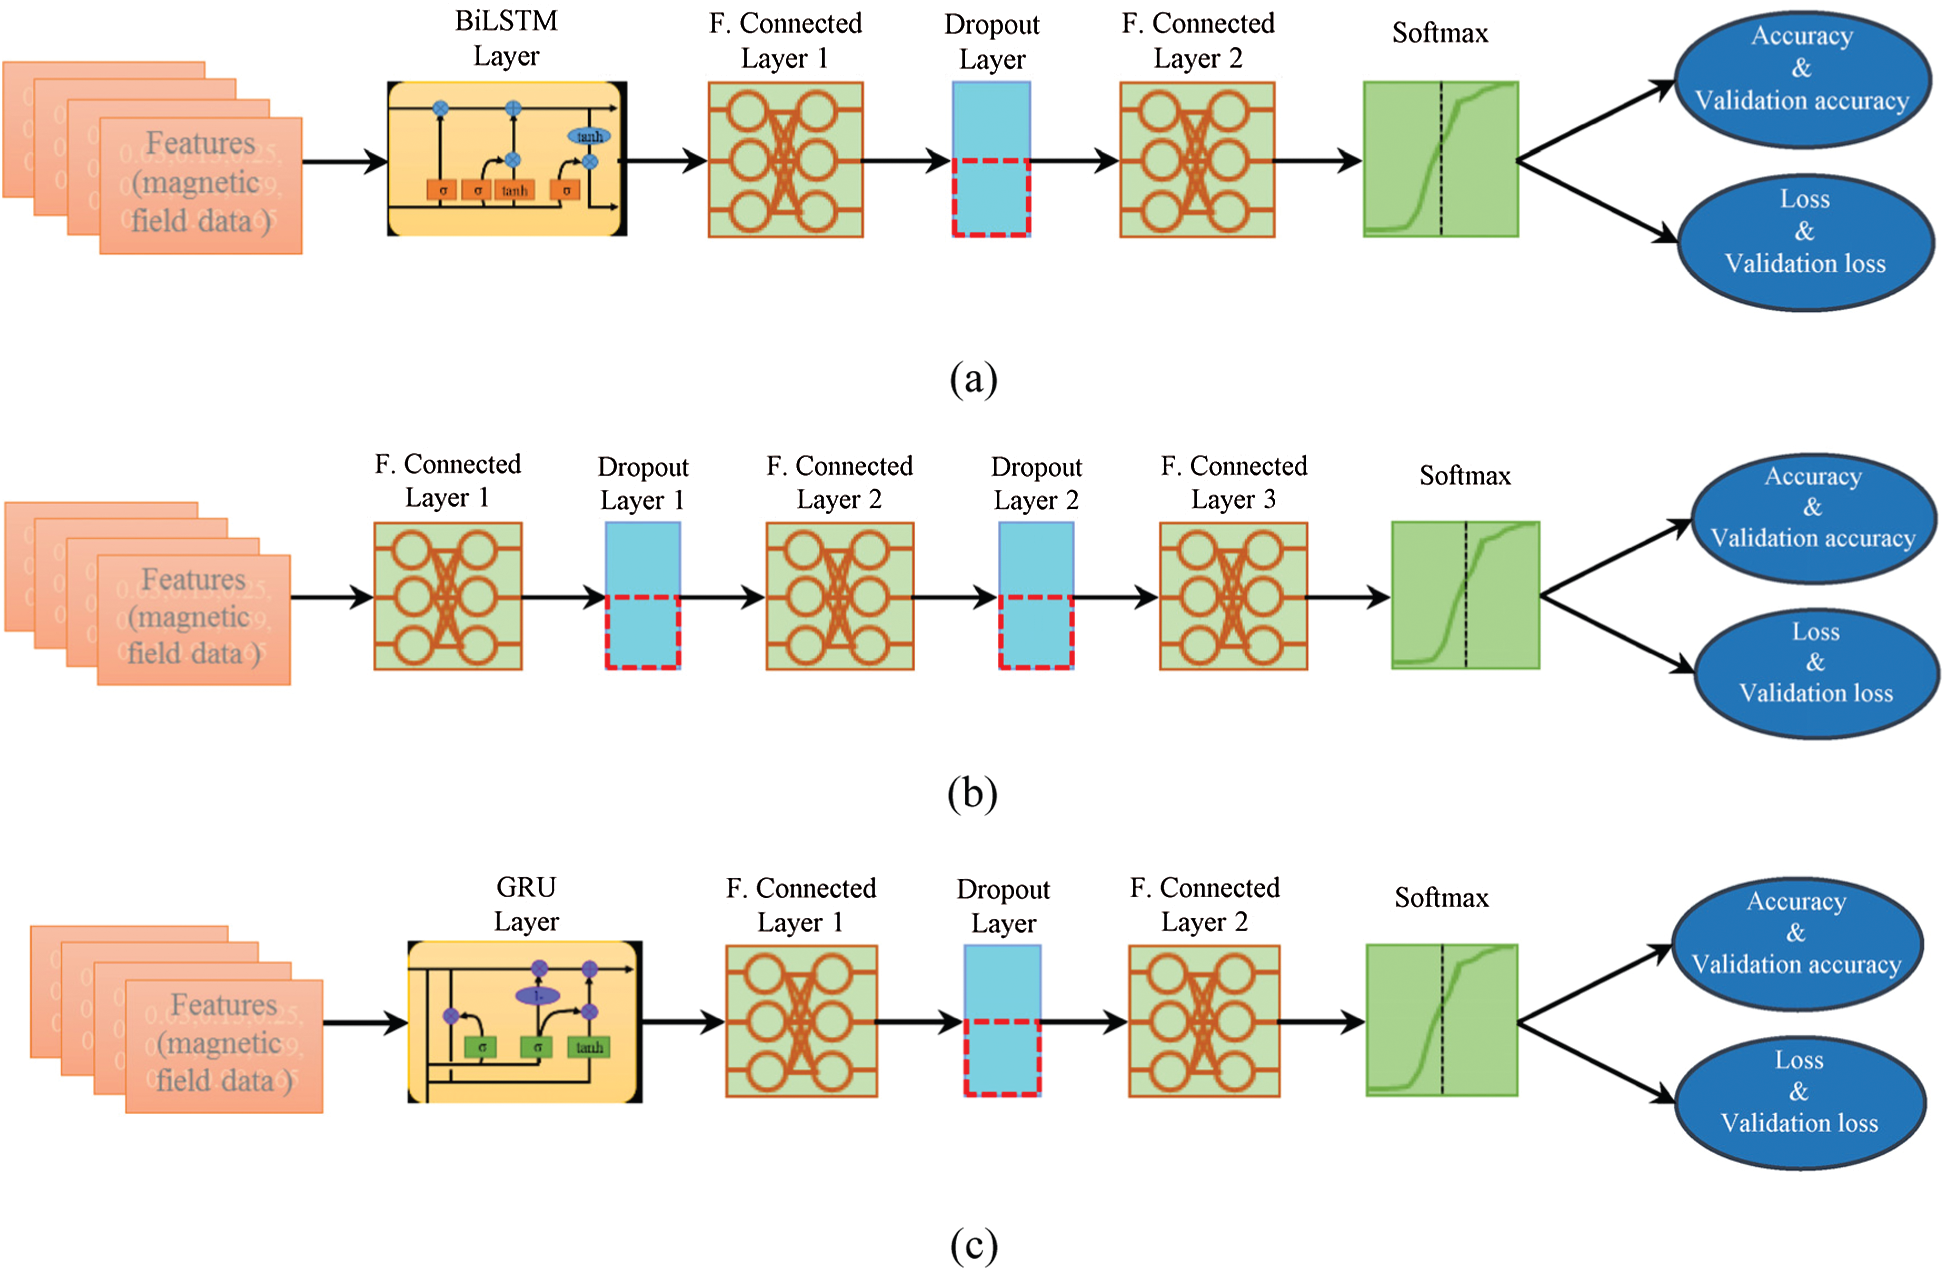
Figure 6: The architecture of the neural networks used in the proposed approach. (a) Long short term memory network (b) deep neural network, (c) gated recurrent unit network
The recurrent neural network is an artificial neural sequence model that forms a directed cycle through the connections [29]. It comprises of a hidden unit h and an optional output y. T shows the last time step and also the length of the input sentence used for learning. The hidden state h is computed using the previous hidden state ht −1 and current step xt
where U and W are weight matrices and g is the activation function.
LSTM and BiLSTM are variations of the RNN model, proposed to overcome the vanishing gradient problem [30]. As the names suggest, LSTM uses a single layer while LSTM makes the use of two layers to learn from the input sequence. The input sequence is processed both from left to right and right to left and context representations are concatenated into one vector.
DNN consists of layers containing elements called neurons/nodes. These layers are often fully connected layers where each connection carries a weight that determines the importance of the received input. Layers are divided into input, hidden, and output layers. For each neuron, a function is used that determines the activation of a neuron. Neural networks become overfit when they learn noise in the training data that results in poor performance. So, the dropout layer is used to deal with model overfit. Predominantly, a dropout layer with 0.5 is used for this purpose. It discards information by randomly dropping data in hidden nodes during the training phase and alleviates overfitting [31].
The gated recurrent unit (GRU) was proposed in [32] to perform adaptive learning of dependencies of different time scales. The gate units modulate the flow of information. The activation of GRU is done through the linear interpolation of previous activation and the candidate action at time t.
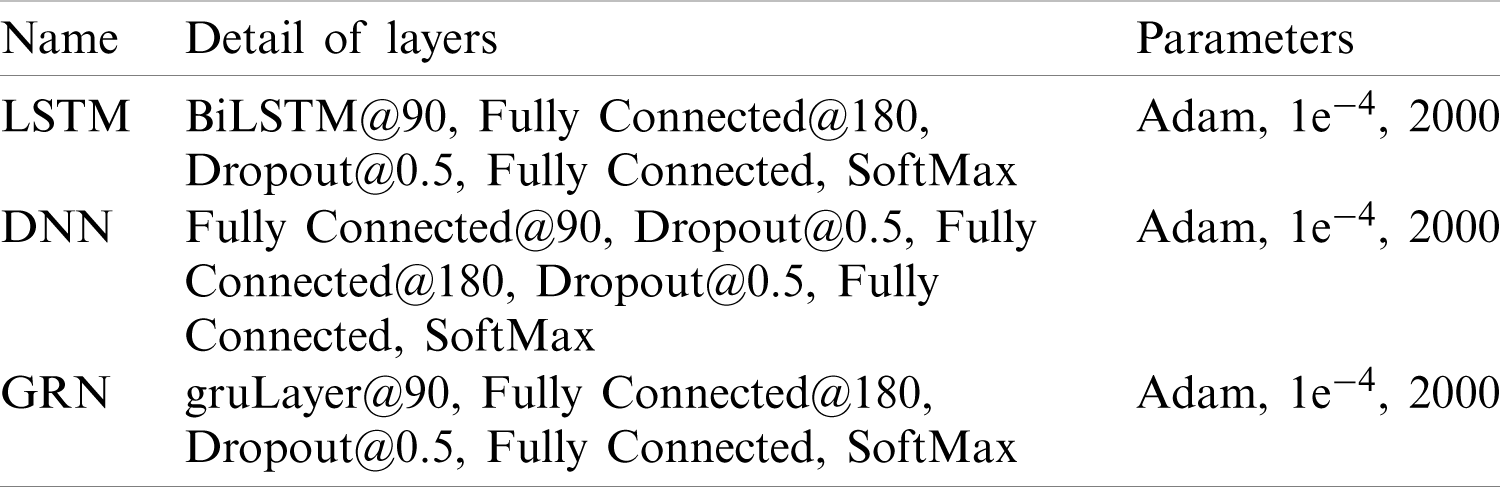
Tab. 1 shows the details of the layers used for each network as well as, the list of parameters set for training the networks. In the end, a Softmax layer is used to get the desired output as the probability score for each class for testing data samples. The ‘adam’ optimizer is used for training with a learning rate of ‘
Table 1: Details of the parameters used for each network
The testing phase comprises of data collection, denoising and normalization, and user location prediction. Each phase is discussed here separately.
5.2.1 Data Collection, Denoising, and Normalization
The testing data is collected considering the following three perspectives:
• Device diversity
• Time diversity
• User diversity
Three devices are used for data collection including LG G7, Samsung Galaxy S8, and LG Q6. The prime objective is to evaluate the performance of the proposed approach with heterogeneous devices. Often, the localization results of an approach are largely different when heterogeneous devices are used for localization. As pointed out before, the magnetic field data shows variability concerning time as well as, users. So the data is collected at different times and by different users. The time for data collection is approximately ten months and includes morning, afternoon, and night time. Data denoising and data normalization are carried out as described in Sections 5.1.2 and 5.1.3. Once the data is denoised and normalized, it is used as an input to the trained models. The output from the trained models is then fed to Algorithm 1 to estimate the user’s current location.
5.2.2 Localization Using Neural Networks and Magnetic Field Data
This study makes use of three deep learning-based neural networks including DNN, LSTM, and GRN. Algorithm 1 is used to estimate the user’s current position by leveraging the predictions from three networks. Fig. 7 shows the methodology adopted to estimate the location of the user.
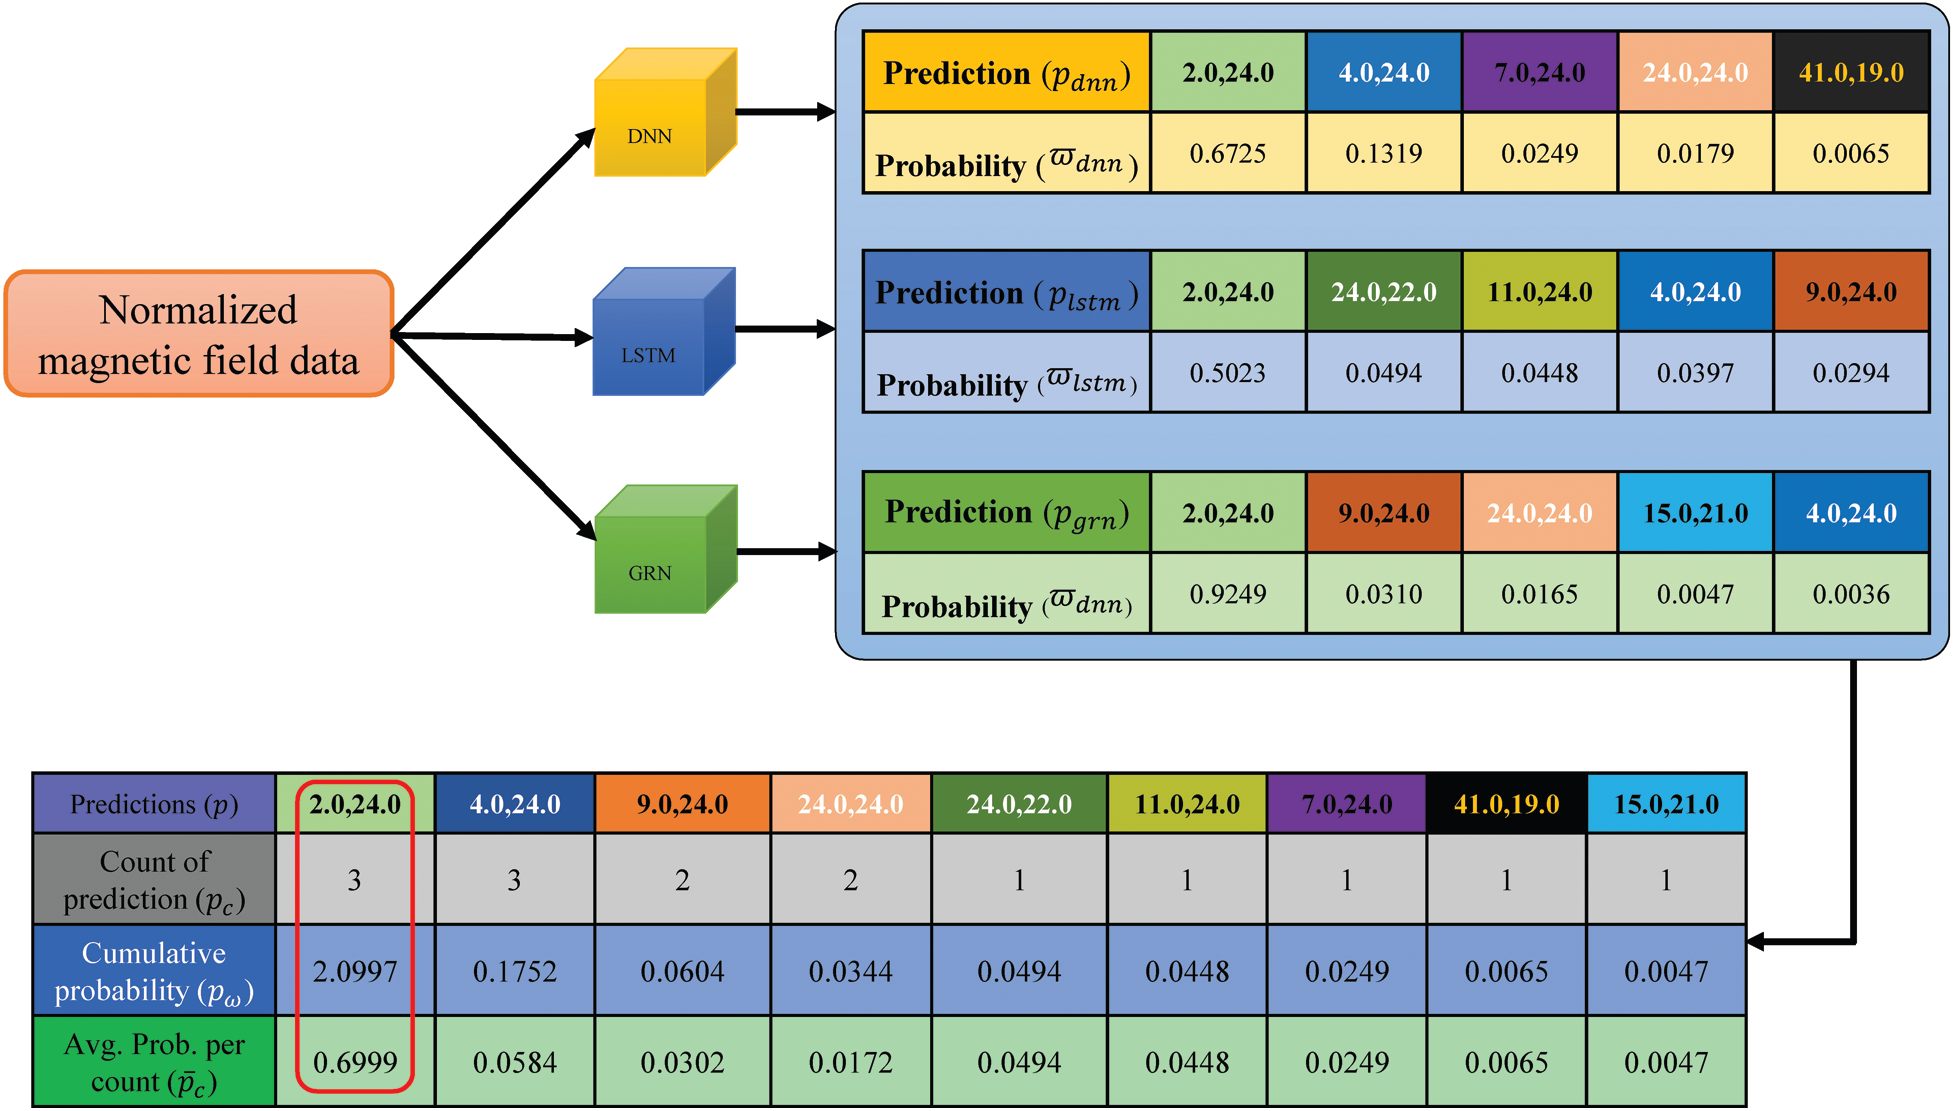
Figure 7: Methodology used to estimate the user’s current location from the predictions of LSTM, GRN, and DNN
Lines 1–2: The input to Algorithm 1 are the predictions from three networks as well as, the probability score for each prediction. The purpose of taking the prediction probability is to analyze how important a given prediction is? As the first step, n predictions are taken from each network with and n as five. The value of n is an empirical value based on the experiments. Increasing the number of n increases the probability of finding the correct solution for the user’s location, however, requires increased computational processing and time. On the other hand, reducing it causes errors and uncertainty in the user’s position. Experiments reveal that using n as five gives higher accuracy. So, the input to the algorithm is five predictions each from
Lines 4–13: Predictions from these networks serve to estimate a single position of the user. So a procedure for calculating the user’s position is devised. Three elements are needed for this purpose including unique predictions
where d shows the error margin or difference in predictions of various classifiers. If the difference between such predictions is less than the defined threshold
The associated weights are summed and added in
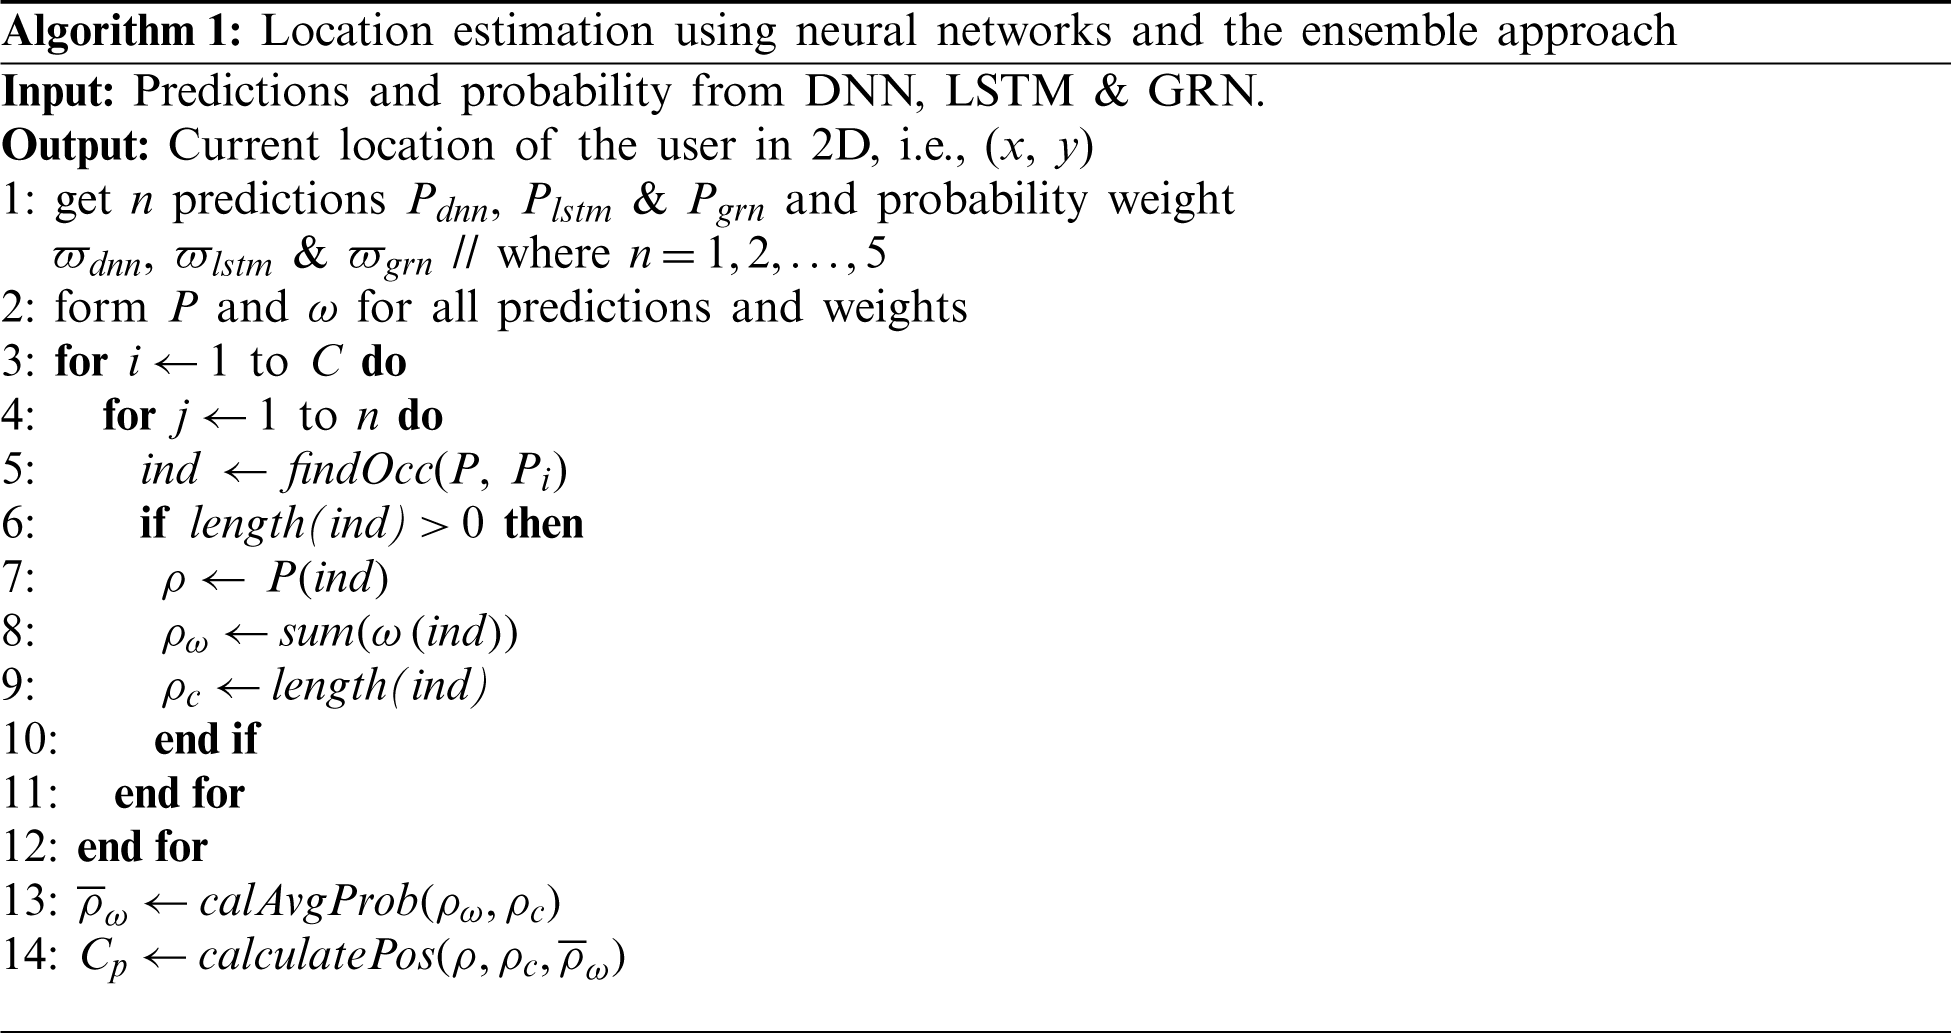
Line 14: Average probability weight is calculated for each unique prediction
where
Line 15: Finally the user’s current position is calculated using three criteria. First, the position with a higher
Three smartphones are used to evaluate the performance of the proposed approach including LG G7 (LM-G710N), Samsung Galaxy S8 (SM-G910S), and LG Q6. The description of the embedded magnetic sensor and the processing capability of each smartphone is given in Tab. 2. Experiments are carried out in the Information Technology (IT) building of Yeungnam University, Korea. IT building dimensions are 9
Table 2: Details of the smartphones and embedded magnetometers used for the experiment
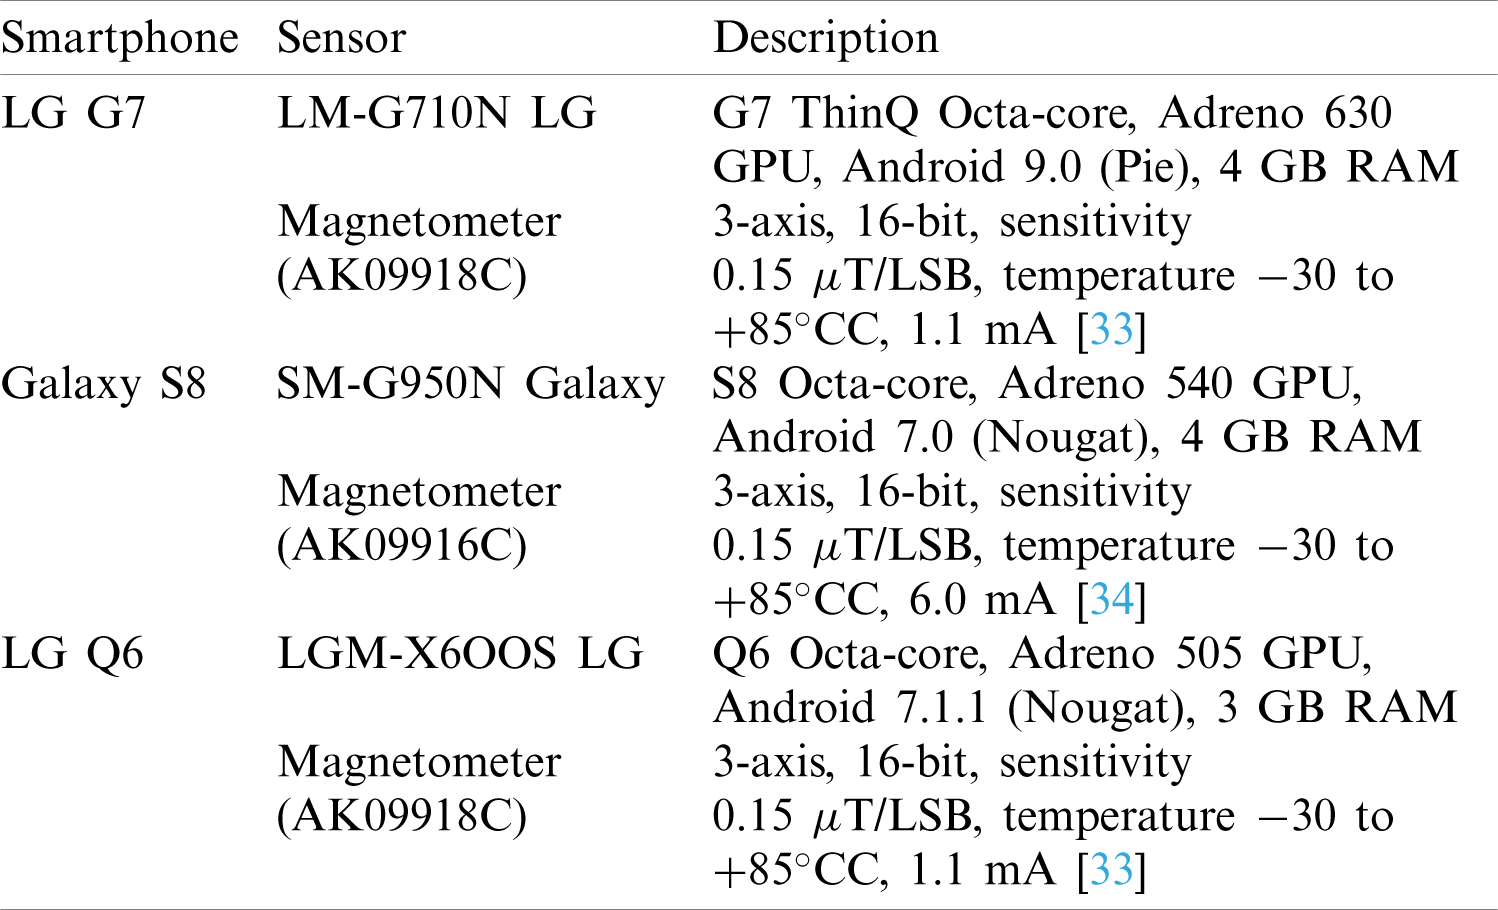
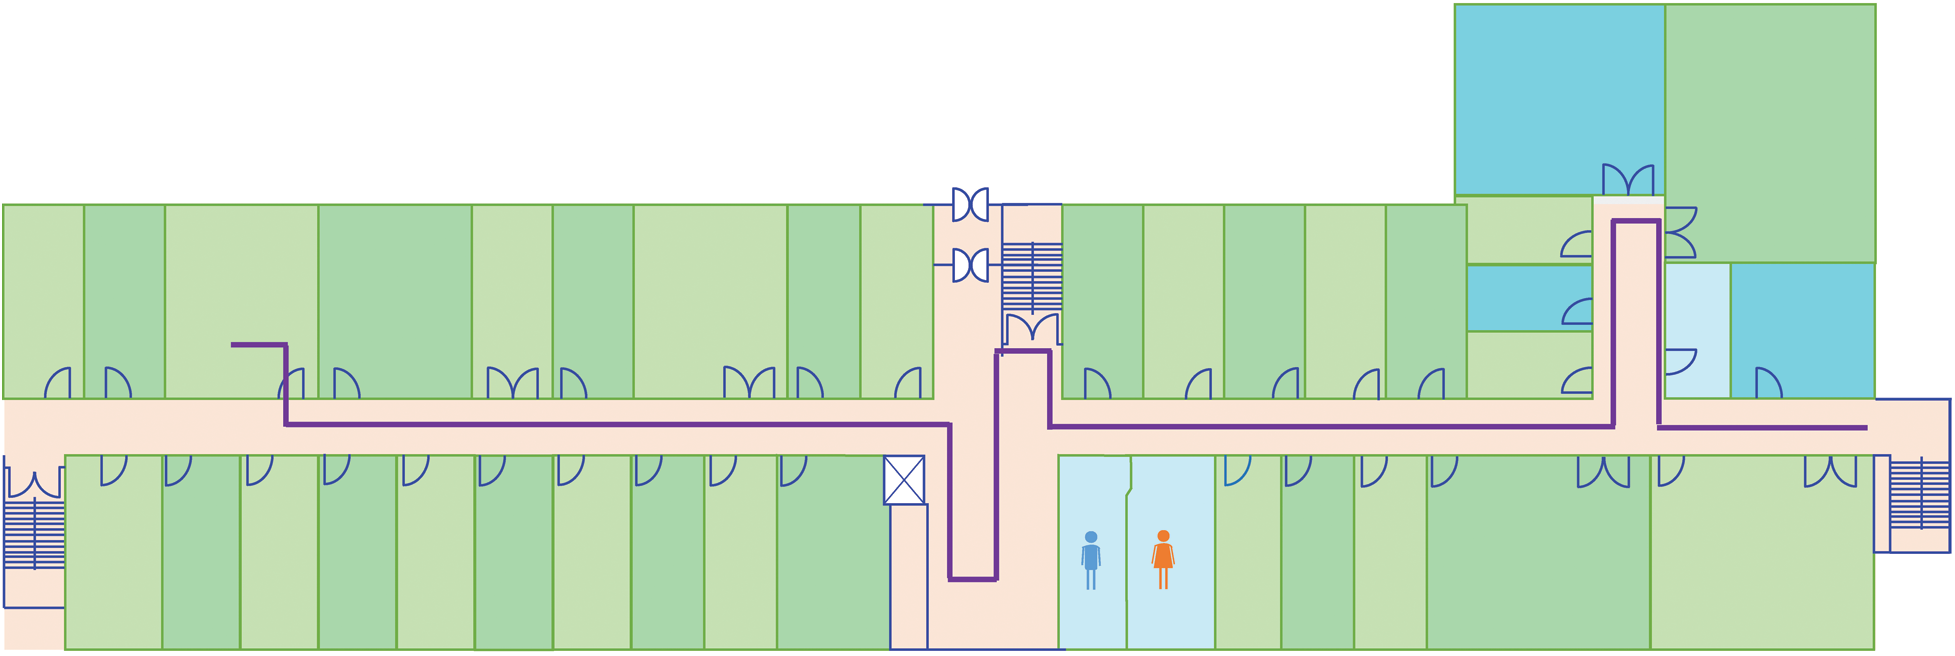
Figure 8: Path geometry used for experiments in the IT building
Experiments are performed to utilize as much smaller magnetic field data as possible to find the user’s position with minimum error. Unlike previous studies where the length of the magnetic field data for positioning is 14, 8, and 6 s, the current study utilizes only 2 s data from the smartphone magnetometer. The objective to use a smaller amount of data is to work out the scenarios where the indoor structure is complex and a larger amount of data is not available for positioning.
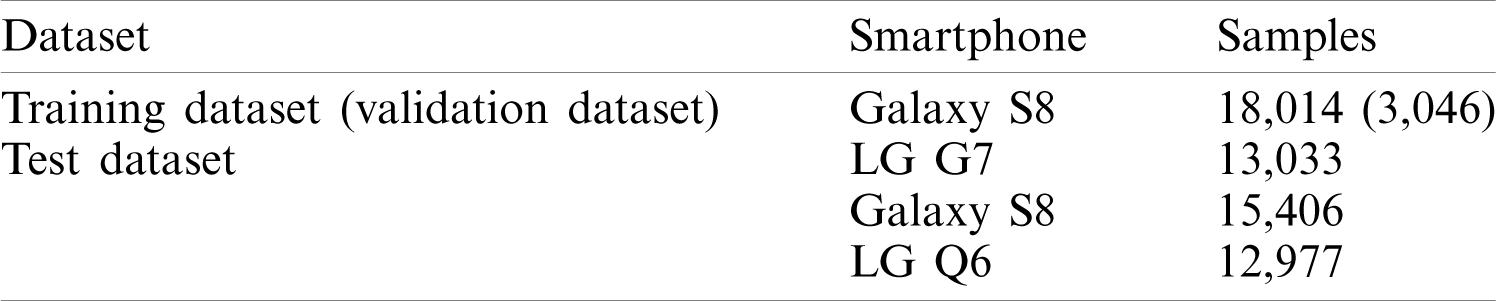
In this paper, we collect the magnetic field data at a 10 Hz sampling rate (new magnetic field sample every 100 ms) using Google device driver API. The data is split into training, validation, and testing for the experiments. The split ratio is 40%, 10%, and 50% for training, validation, and testing, respectively. Training and validation are done using Galaxy S8 data alone, while testing is carried out with all three smartphones. The division of the dataset and details about the number of samples are given in Tab. 3.
Table 3: Details of the dataset used for the experiment
The current study performs several experiments to evaluate the performance of the proposed technique on three different smartphones. Moreover, the performance is compared against three state-of-the-art indoor localization techniques. Experiments are carried out to investigate the efficacy of data normalization over magnetic field data intensity for localization. So, experiments are performed with the following perspectives
• Localization accuracy using the denoised magnetic field data without normalization
• Localization accuracy with normalized data
• Impact of using larger magnetic field data on the localization accuracy.
6.1 Analysis of Indoor Localization Accuracy Without Normalization
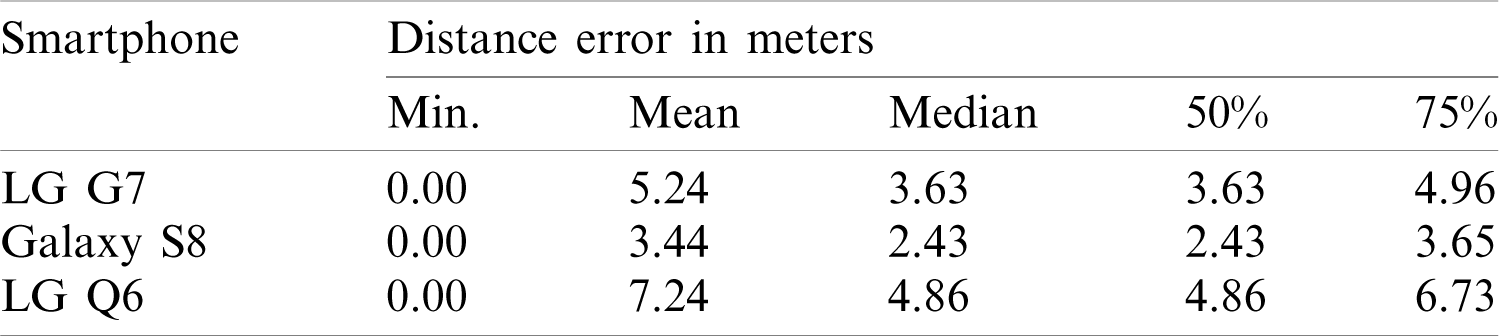
Experiments involve using three smartphones including LG G7, Galaxy S8, and LG Q6. The objective of using multiple smartphones is to analyze the difference in localization accuracy when heterogeneous smartphones are used. Fig. 9 shows the results for all the smartphones used for the experiments. Results prove that the impact of smartphone heterogeneity is huge and visible. Additionally, the maximum error is also high and does not fulfill the standards set for indoor localization.
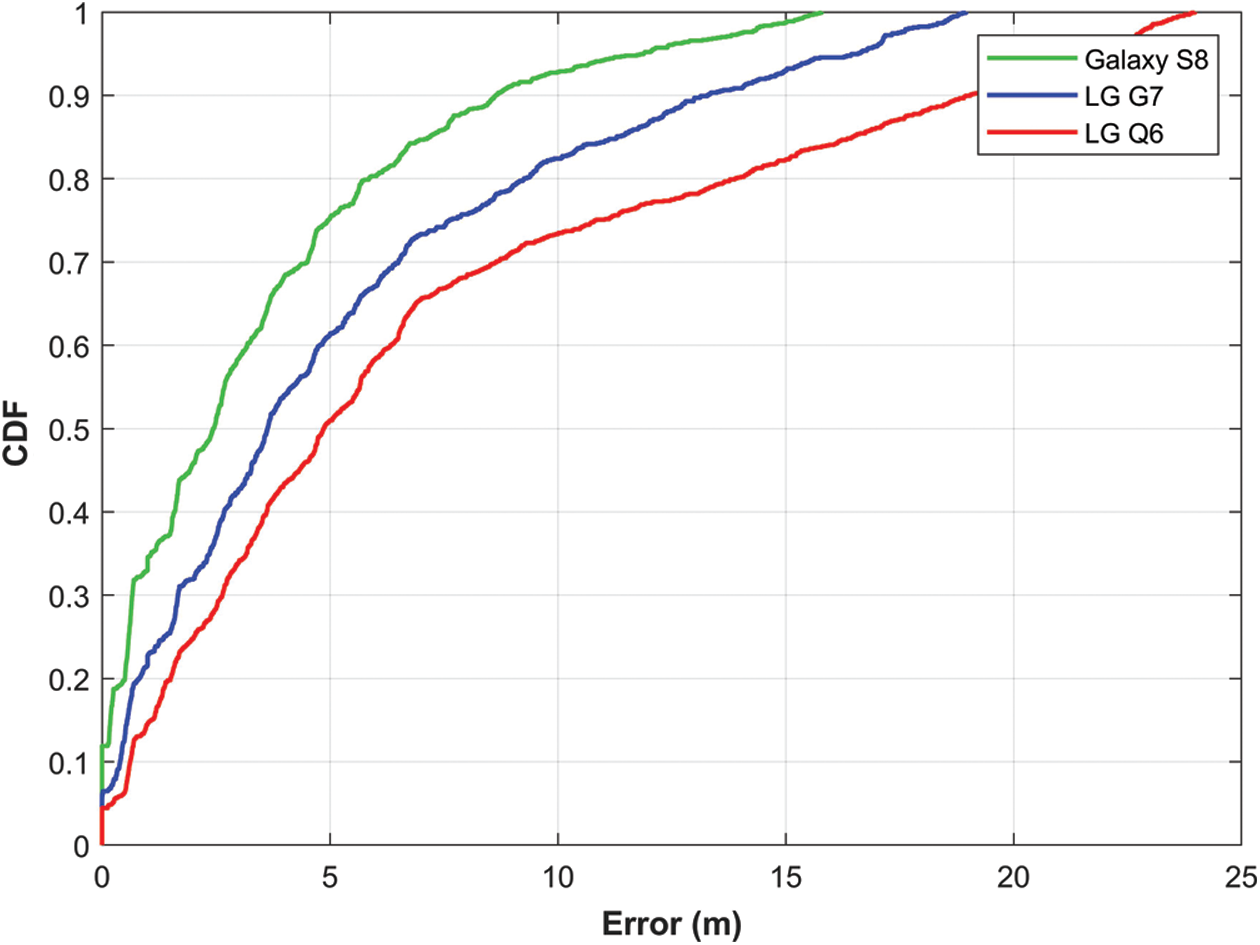
Figure 9: The CDF graph for localization accuracy using the magnetic field data without normalization
Tab. 4 shows the detailed statistics for experiment results for all the smartphones. It can be seen that the mean as well as, the standard deviation is high and different for each smartphone. The performance of Galaxy S8 is better than those of G7 and Q6 since the training data comprises features from the Galaxy S8 magnetometer alone. As said before, the magnetic data intensity from various smartphones may vary significantly even for the same location and influential to impact the localization accuracy even when the same positioning approach is used. The results show the same respectively.
Table 4: Details of results for localization accuracy for all the smartphones used for experiments with magnetic field intensity data
6.2 Indoor Localization Accuracy Using Normalized Magnetic Field Data
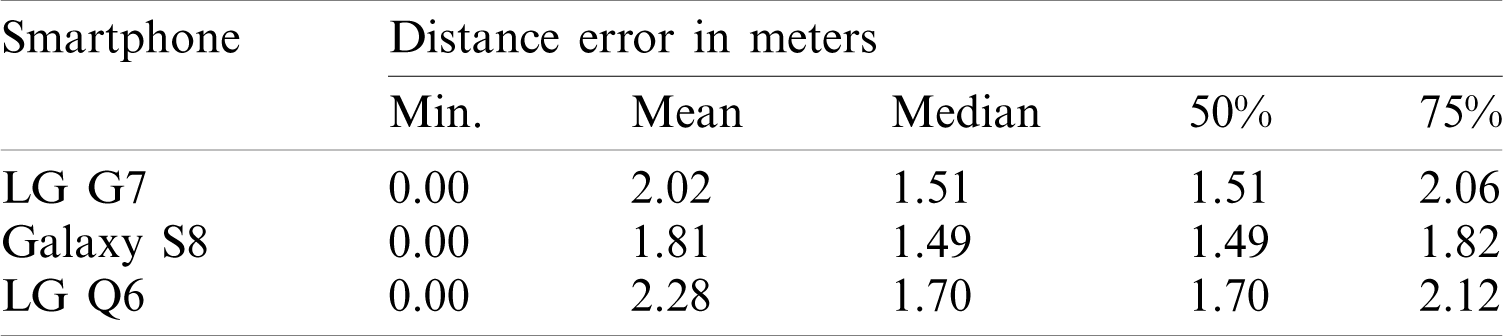
Further experiments leverage the use of normalized magnetic field data both for training the neural networks as well as, the testing. Fig. 10 shows the graph for localization accuracy with the normalized data. It is obvious that the impact of device heterogeneity has been reduced. Although the localization with G7, S8, and Q6 is not the same, yet, the difference is marginal.
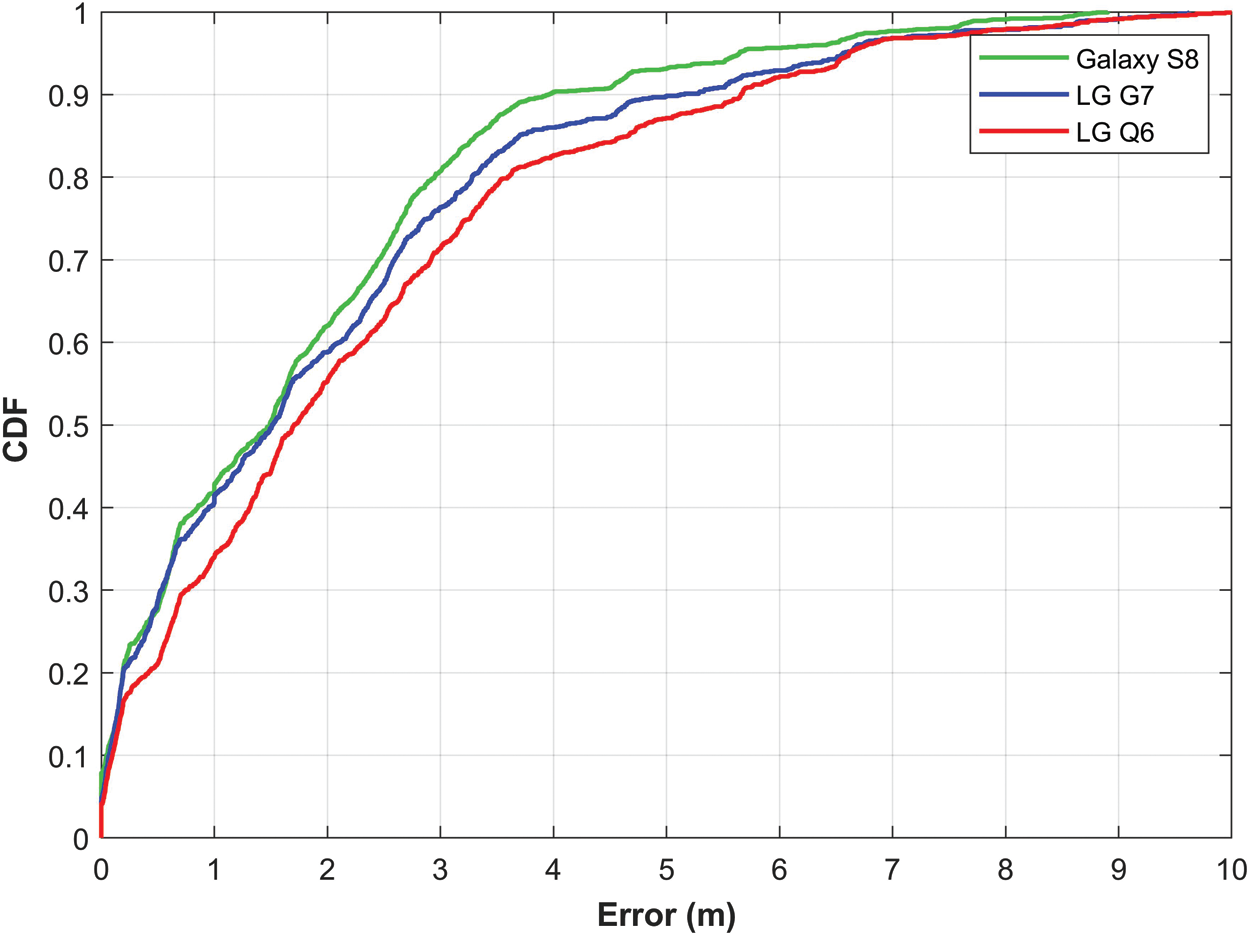
Figure 10: The CDF graph for localization accuracy using normalized magnetic field data
The difference in the localization accuracy may happen due to many reasons. We have seen that the magnetic field data intensity is different with different devices, however, the patterns of the magnetic field data are not the same either [self paper]. Such patterns may change even when the same smartphone is used. In the same way, the change in the smartphone height and position also affects the shape of such patterns. All these factors degrade the performance of indoor localization with the magnetic field data. Despite the degradation, the accuracy of the proposed approach is good and almost identical for three different smartphones as shown in Tab. 5. The performance of the Galaxy S8 is better than those of other smartphones. However, the performance of G7 and Q6 is similar for mean and 50% error.
Table 5: Details of results for localization accuracy for all the smartphones with the normalized magnetic field data
6.3 Comparison of Accuracy for Normalized vs. Non-Normalized Data
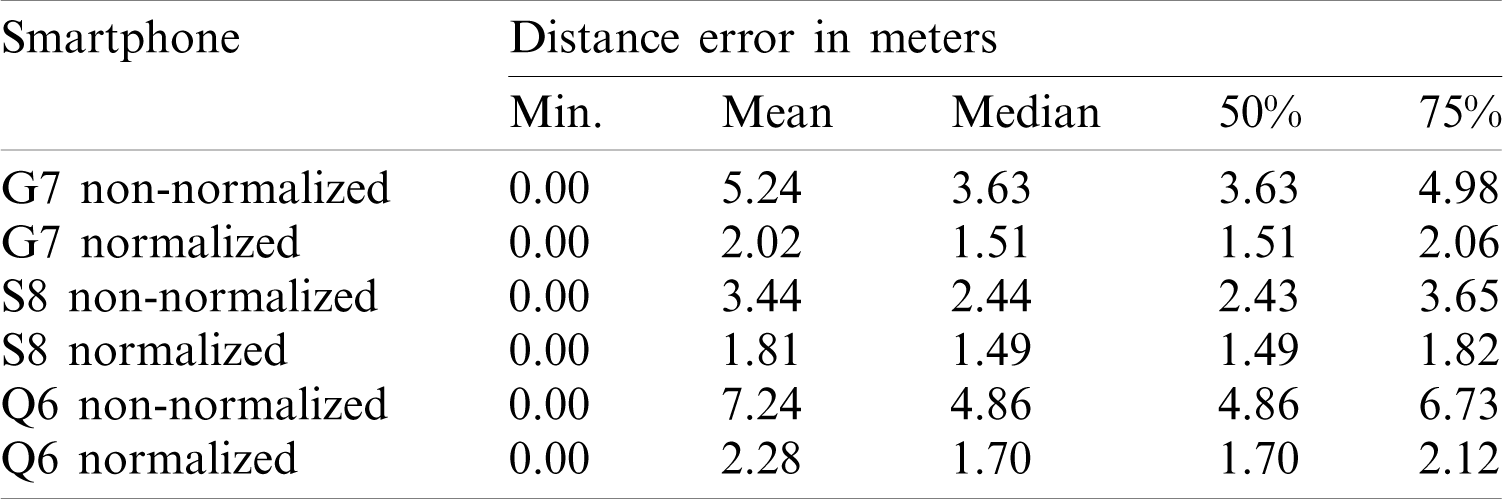
Fig. 11 shows the localization accuracy for using normalized and non-normalized magnetic field data. Figs. 9 and 10 have different lengths for the x-axis so it might hinder understanding the improvement resulted from the use of the normalized data. Fig. 11 shows a better comparison of the results as the results are shown at the same scale.
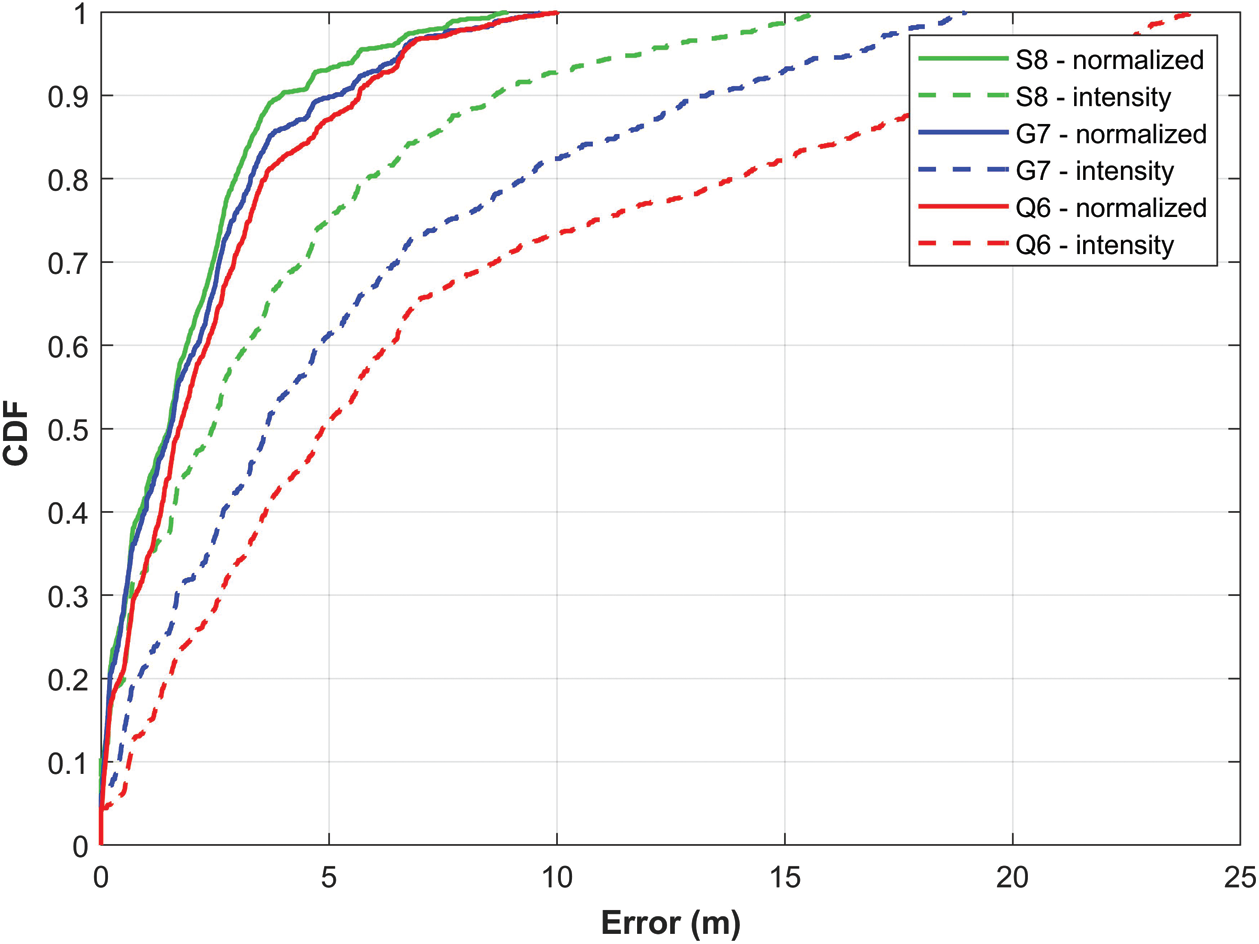
Figure 11: Comparison of localization accuracy using normalized and no-normalized magnetic field data
Unequivocally, the use of normalized magnetic field data is advantageous to reduce the impact of device heterogeneity and increase the localization accuracy. Tab. 6 shows the comparison of mean, median, standard deviation, and 50% error for both methods. It reflects that the localization accuracy has increased substantially. The mean error is reduced to 2.02, 1.81, and 2.28 from 5.24, 3.44, and 7.24 for G7, S8, and Q6, respectively. Similarly, the 50\% error has been reduced as well. As, Fig. 5 showed that the distance between the patterns formed by the magnetic field data decreases when the data is normalized, so the normalization process helps to achieve high localization accuracy. Further, even though the magnetic field data intensity is different for different smartphones, the normalization process helps to overcome this limitation and put the patterns on the same scale which helps to overcome device heterogeneity.
Table 6: Comparison of results for localization accuracy for all the smartphones with the normalized and non-normalized magnetic field data
6.4 Performance Analysis of the Proposed Approach with GUIDE, mPILOT, and DeepLocate
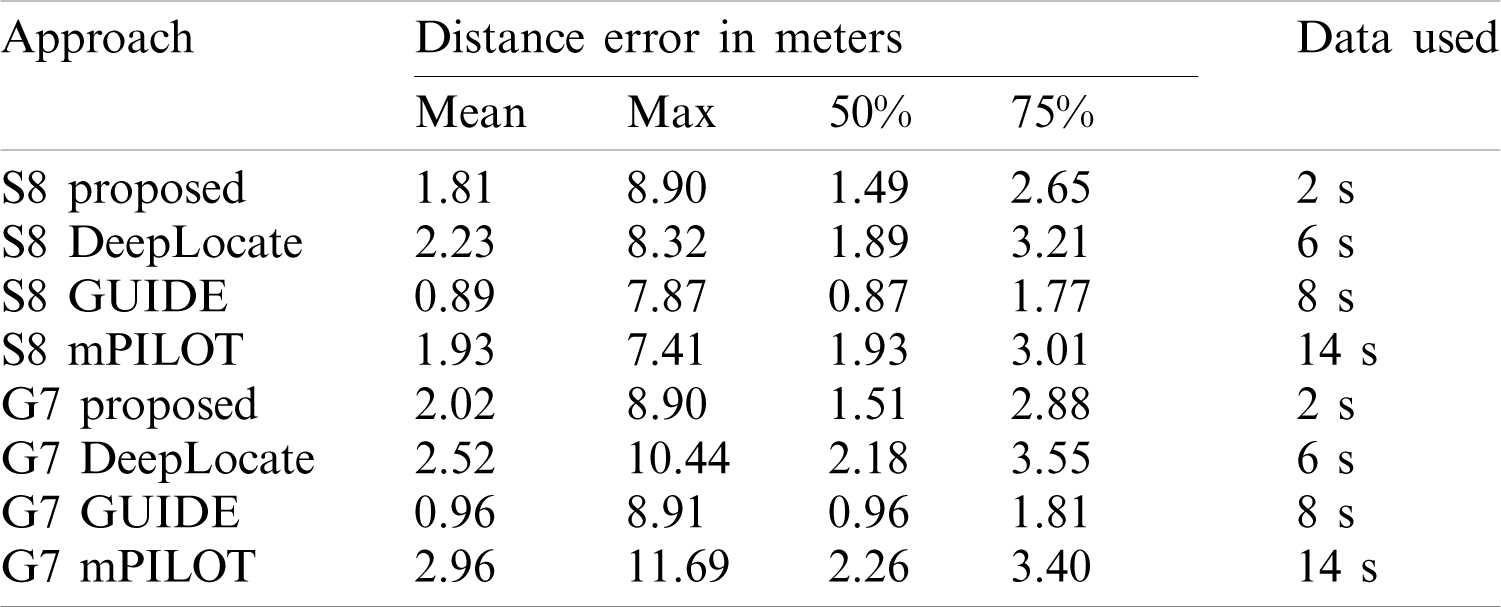
The performance of the proposed approach is analyzed against three approaches based on the magnetic field data including DeepLocate [20], GUIDE [16], and mPILOT [15]. The former technique is based on deep neural networks while the latter two follow the modified particle filter approach for indoor localization. The objective of the comparison is to evaluate how well the proposed approach performs even with the smaller amount of magnetic field data. Fig. 12 shows the results of the comparison.
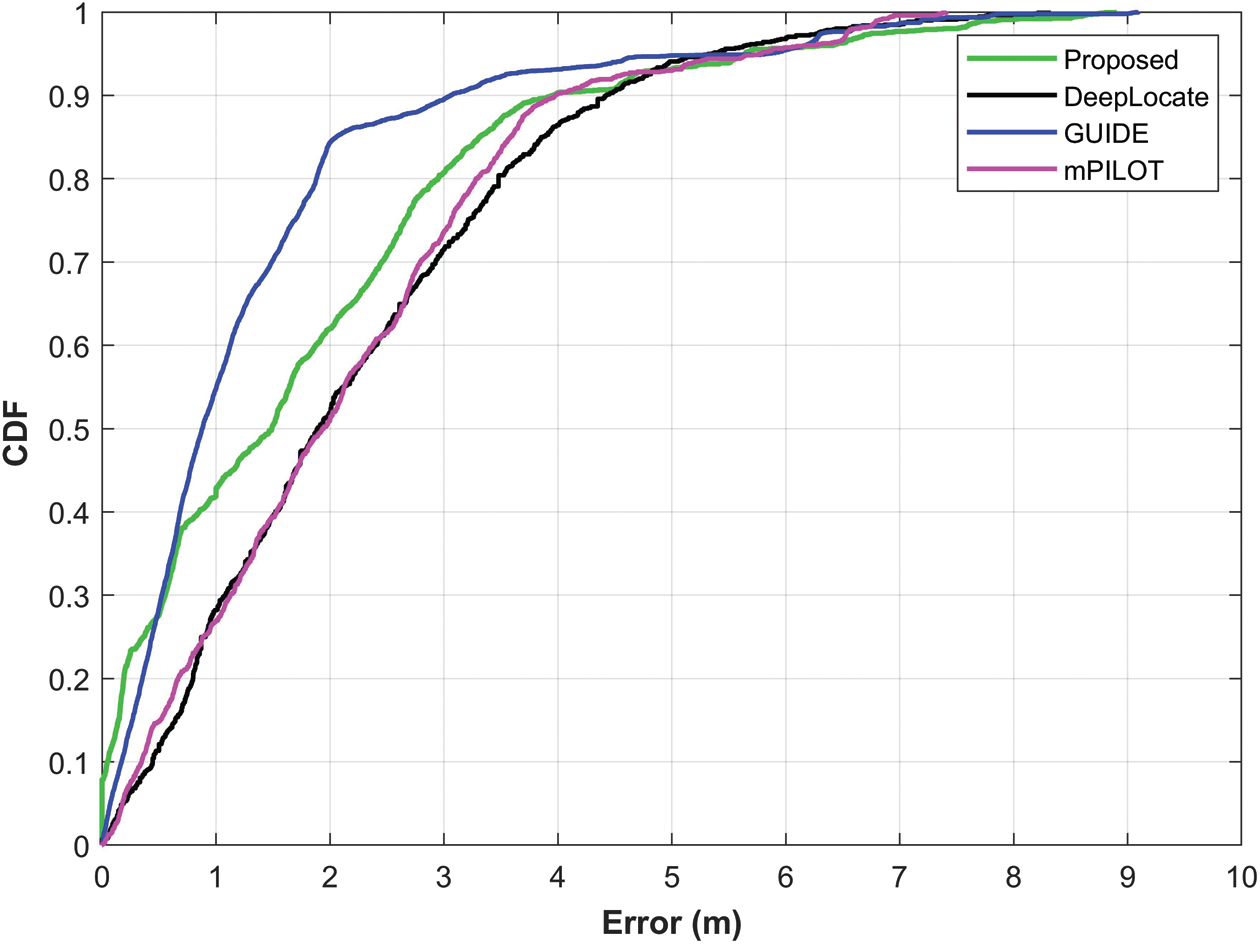
Figure 12: Performance comparison of the proposed approach against DeepLocate [20], mPILOT [16], and GUIDE [15]
Results demonstrate that the proposed approach performs better than DeepLocate and mPILOT, even using much smaller data than those of other techniques. However, the accuracy of the GUIDE is higher than that of the proposed approach. Certain factors are responsible for the superior performance of GUIDE over the proposed approach. First of all, GUIDE uses 8 s data from the magnetometer and a higher amount of data leads to higher accuracy. Secondly, GUIDE leverages the data from additional sensors including an accelerometer and gyroscope that also help to enhance its performance. On the other hand, the proposed approach is based on the use of the magnetic field data alone and uses only 2 s data. Even with 25% of the data used by GUIDE, the results are still competitive as shown in Tab. 7.
Table 7: Comparison of localization accuracy with DeepLocate [20], mPILOT [16], and GUIDE [15]
6.5 The Impact of Using Larger Data on the Localization Accuracy
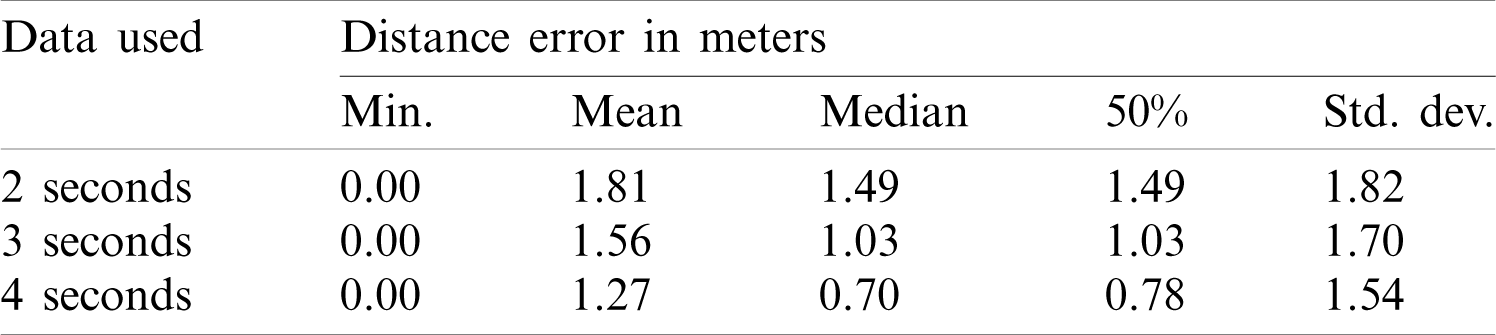
Given the results gained using the magnetic field data of 2 s, further experiments are performed to analyze the potential of the proposed approach with a larger amount of data. So, many experiments are carried out using various lengths of the magnetic field data. Fig. 13 shows the graphs for localization accuracy using the magnetic field data of 2, 3, and 4 s lengths.
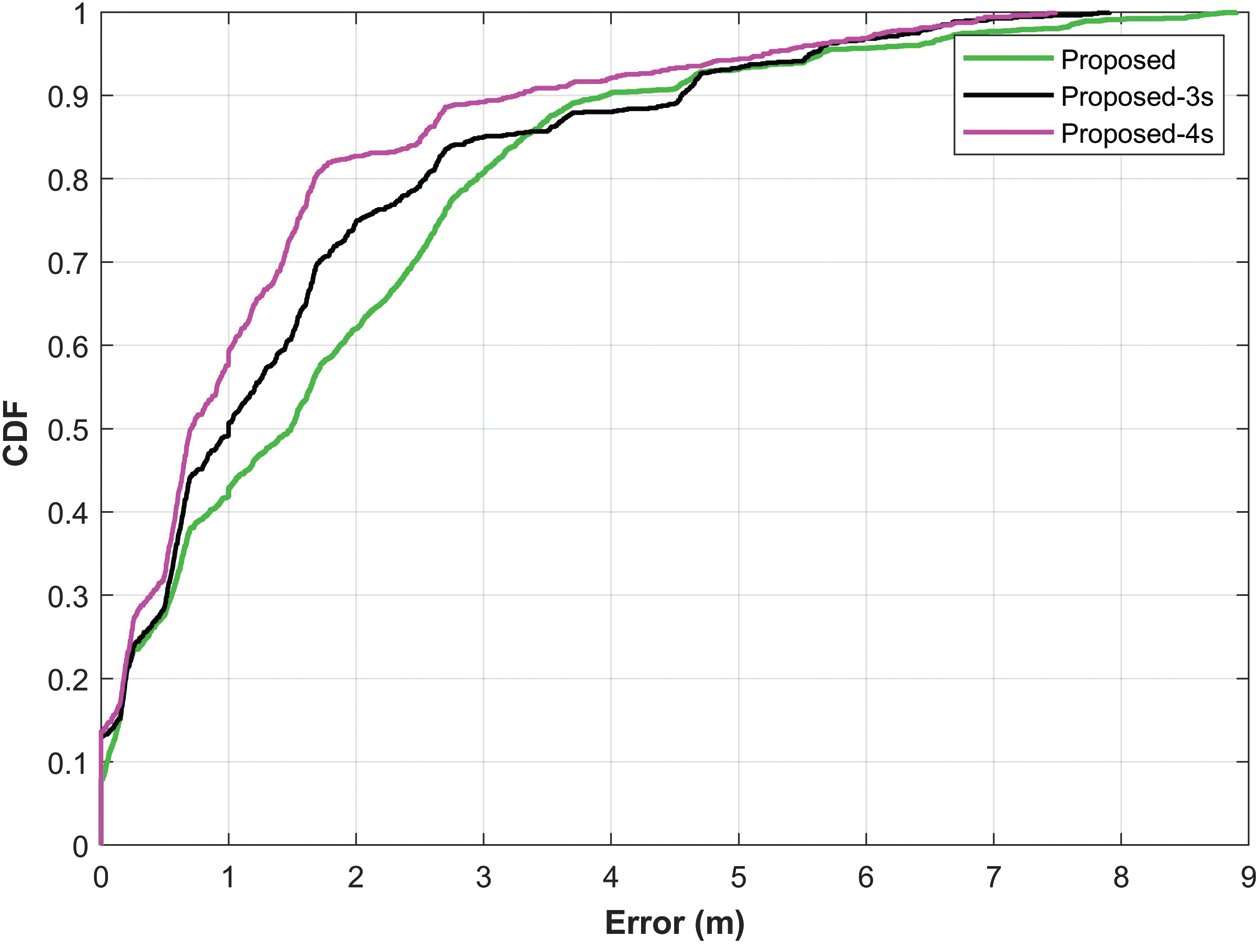
Figure 13: The CDF graphs for localization accuracy with various lengths of the magnetic field data
Results show that a higher length of the magnetic field increases the localization accuracy. It is so because the feature vector that is used to train and test the neural networks is increasing when larger data is used. It results in higher localization accuracy. Tab. 8 shows the results for mean, median, and 50% error for the data lengths that are used for the experiments. Mean error is reduced to 1.27 from 1.81 when the magnetic field data of 4 s is used. Similarly, the median, 50% error, and the standard deviation is reduced as well.
Table 8: Details of results for localization accuracy for all the smartphones used for experiments
6.6 Performance Analysis of the Proposed Approach Using 4 Seconds Data Against GUIDE, mPILOT, and DeepLocate
A performance analysis is made of the proposed approach using the magnetic field data of 4 s length with DeepLocate, GUIDE, and mPILOT. Fig. 14 shows the results of comparing the localization accuracy. Now the localization of the proposed approach is better than those of other techniques. This performance is better, in terms of mean, 50% error as well as, maximum and 75% error.
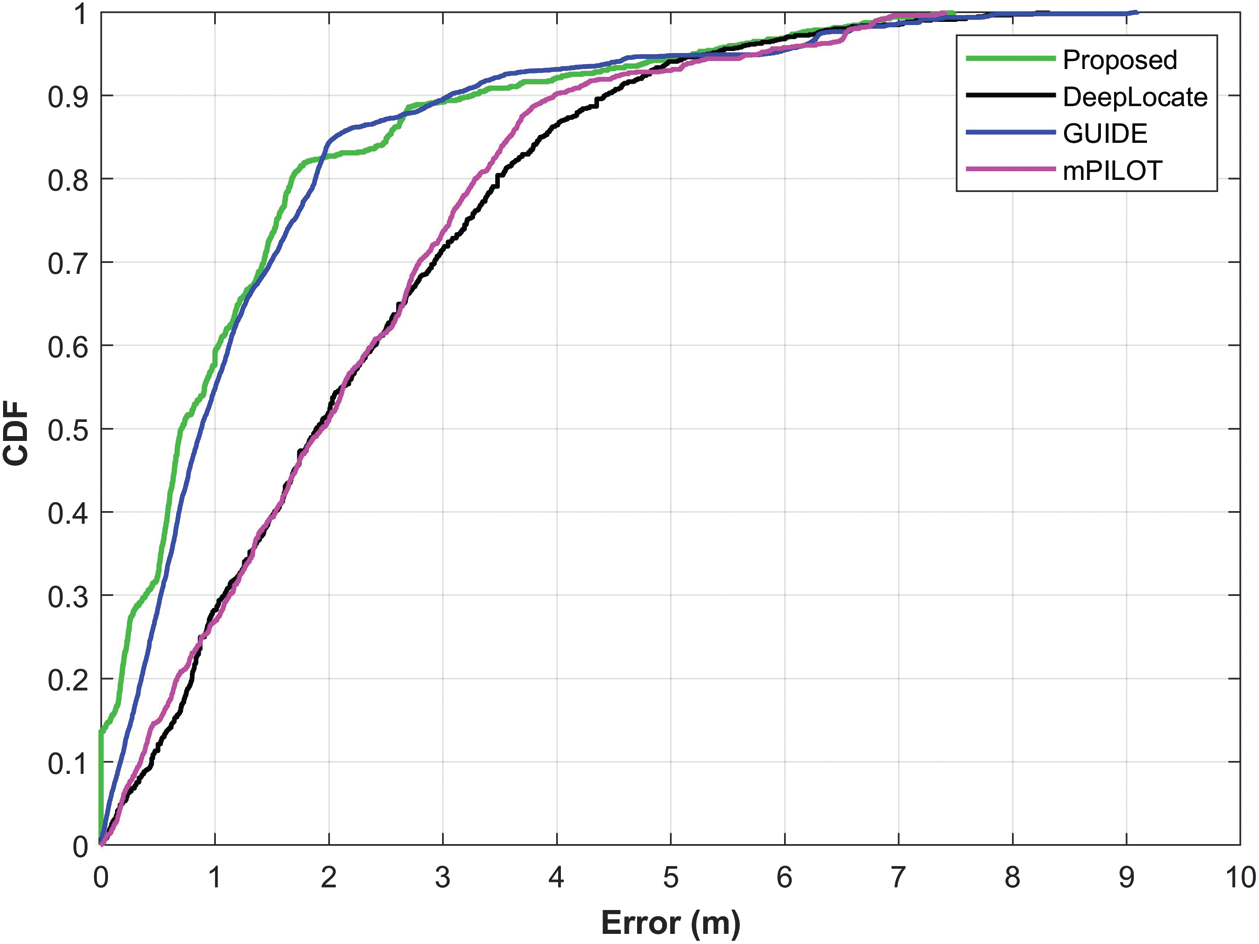
Figure 14: The CDF graphs for localization accuracy with various approaches
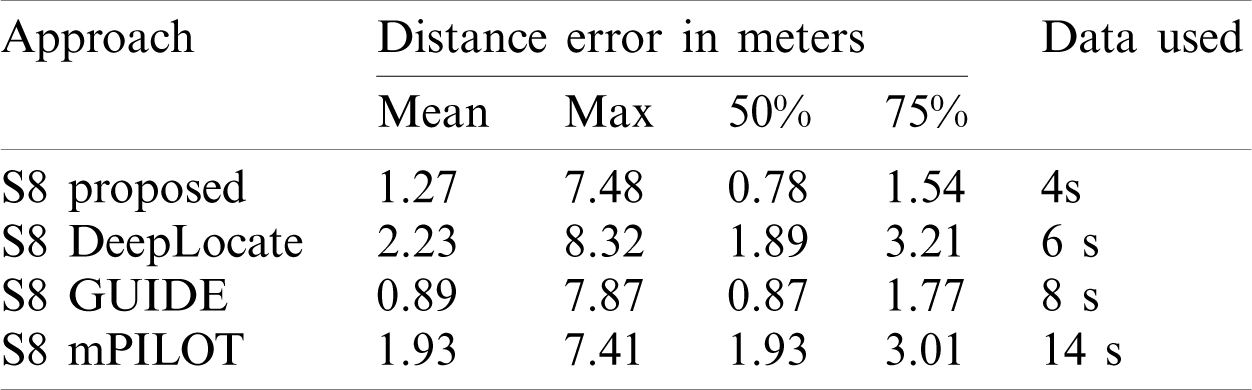
Tab. 9 shows the comparison of mean, maximum, 50%, and 75% errors for all the approaches. The results of the proposed approach are shown with the magnetic field data of 4 s. It goes without saying that the performance of the proposed approach is superior to those of other approaches, even when the length of the data used for localization is smaller. The proposed approach outperforms DeepLocate which uses 6 s data length for localization. The maximum error of the proposed approach is lower than that of other approaches except for mPILOT with a marginal difference of 0.07 m. Similarly, 50% and 75% errors are less than all the three approaches that are used for the comparison.
Table 9: Comparison of localization accuracy with DeepLocate, GUIDE, and mPILOT
This study proposes the use of multiple neural networks including DNN, LSTM, and GRN to perform indoor localization leveraging the embedded magnetic sensor of the smartphone. The prime goal of this research is to minimize the impact of heterogeneous smartphones and achieve high localization accuracy using smaller data lengths. The research takes advantage of using three neural networks to enhance the performance of the magnetic field-based indoor localization approach. Contrary to previous approaches that make use of magnetic field intensity data, this approach leverages the use of normalized magnetic field data. Results demonstrate that the localization accuracy is higher with normalized data than that of non-normalized data. The performance of the proposed approach is almost identical with multiple smartphones including LG G7, Samsung Galaxy S8, and LG Q6. Although the magnetic field intensity varies significantly for these smartphones, yet, normalization helps to achieve similar performance. The mean error is 1.27 while 50% and 75% errors are 0.78, and 1.54, respectively. Comparison of localization results from three other approaches DeepLocate, GUIDE, and mPILOT reveals that the proposed approach shows first-rate performance, even with a lesser amount of magnetic field data than those of other approaches. In the future, we intend to perform localization involving complex phone orientations during the localization like call listening, phone in front and back pocket, etc.
Funding Statement: This research was partially supported by the MSIT (Ministry of Science and ICT), Korea, under the ITRC (Information Technology Research Center) support program (IITP-2019-2016-0-00313) supervised by the IITP (Institute for Information & communication Technology Promotion). This research was partially supported by Basic Science Research Program through the National Research Foundation of Korea (NRF) funded by the Ministry of Science, ICT and Future Planning (2017R1E1A1A01074345).
Conflicts of Interest: The authors declare that they have no conflicts of interest to report regarding the present study.
1. H. A. Karimi, Advanced Location-based Technologies and Services. Tayler & Francis, FL, USA: CRC Press, 2013. [Google Scholar]
2. N. Bulusu, J. Heidemann and D. Estrin, “GPS-less low-cost outdoor localization for very small devices,” IEEE Personal Communications, vol. 7, no. 5, pp. 28–34, 2000. [Google Scholar]
3. L. M. Ni, Y. Liu, Y. C. Lau and A. P. Patil, “Landmarc: Indoor location sensing using active rfid,” in Proc. PerCom, Fort Worth, TX, USA, pp. 407–415, 2003. [Google Scholar]
4. P. Bahl and V. N. Padmanabhan, “Radar: An in-building rfbased user location and tracking system,” Proc. INFOCOM, vol. 2, pp. 775–784, 2000. [Google Scholar]
5. N. B. Priyantha, A. Chakraborty and H. Balakrishnan, “The cricket location-support system,” in Proc. MobiCom, Boston, MA, USA, pp. 32–43, 2000. [Google Scholar]
6. M. U. Ali, S. Hur, S. Park and Y. Park, “Harvesting indoor positioning accuracy by exploring multiple features from received signal strength vector,” IEEE Access, vol. 7, pp. 52110–52121, 2019. [Google Scholar]
7. Y. Gu, A. Lo and I. Niemegeers, “A survey of indoor positioning systems for wireless personal networks,” IEEE Communications Surveys & Tutorials, vol. 11, no. 1, pp. 13–32, 2009. [Google Scholar]
8. K. P. Subbu, B. Gozick and R. Dantu, “Locateme: Magnetic-fields-based indoor localization using smartphones,” ACM Transactions on Intelligent Systems and Technology, vol. 4, no. 4, pp. 1–27, 2013. [Google Scholar]
9. P. Davidson and R. Piché, “A survey of selected indoor positioning methods for smartphones,” IEEE Communications Surveys & Tutorials, vol. 19, no. 2, pp. 1347–1370, 2016. [Google Scholar]
10. B. Li, T. Gallagher, A. G. Dempster and C. Rizos, “How feasible is the use of magnetic field alone for indoor positioning?,” in Proc. IPIN, Sydney, Australia, pp. 1–9, 2012. [Google Scholar]
11. B. Li, T. Gallagher, C. Rizos and A. G. Dempster, “Using geomagnetic field for indoor positioning,” Journal of Applied Geodesy, vol. 7, no. 4, pp. 299–308, 2013. [Google Scholar]
12. C. Zhang, K. P. Subbu, J. Luo and J. Wu, “Groping: Geomagnetism and crowdsensing powered indoor navigation,” IEEE Transactions on Mobile Computing, vol. 14, no. 2, pp. 387–400, 2014. [Google Scholar]
13. Y. Li, Y. Zhuang, H. Lan, P. Zhang, X. Niu et al., “Wifi-aided magnetic matching for indoor navigation with consumer portable devices,” Micromachines, vol. 6, no. 6, pp. 747–764, 2015. [Google Scholar]
14. Z. Liu, L. Zhang, Q. Liu, Y. Yin, L. Cheng et al., “Fusion of magnetic and visual sensors for indoor localization: Infrastructure-free and more effective,” IEEE Transactions on Multimedia, vol. 19, no. 4, pp. 874–888, 2016. [Google Scholar]
15. I. Ashraf, S. Hur and Y. Park, “mPILOT-magnetic field strength based pedestrian indoor localization,” Sensors, vol. 18, no. 7, pp. 2283, 2018. [Google Scholar]
16. I. Ashraf, S. Hur, M. Shafiq, S. Kumari and Y. Park, “Guide: Smartphone sensors-based pedestrian indoor localization with heterogeneous devices,” International Journal of Communication Systems, vol. 32, no. 15, pp. e4062, 2019. [Google Scholar]
17. H. Xie, T. Gu, X. Tao, H. Ye and J. Lv, “Maloc: A practical magnetic fingerprinting approach to indoor localization using smartphones,” in Proc. UbiComp, Seattle, WA, USA, pp. 243–253, 2014. [Google Scholar]
18. M. Liu, R. Chen, D. Li, Y. Chen, G. Guo et al., “Scene recognition for indoor localization using a multi-sensor fusion approach,” Sensors, vol. 17, no. 12, pp. 2847, 2017. [Google Scholar]
19. I. Ashraf, S. Hur and Y. Park, “Application of deep convolutional neural networks and smartphone sensors for indoor localization,” Applied Sciences, vol. 9, no. 11, pp. 2337, 2019. [Google Scholar]
20. I. Ashraf, S. Hur, S. Park and Y. Park, “DeepLocate: Smartphone based indoor localization with a deep neural network ensemble classifier,” Sensors, vol. 20, no. 1, pp. 133, 2020. [Google Scholar]
21. F. Al-homayani and M. Mahoor, “Improved indoor geomagnetic field fingerprinting for smartwatch localization using deep learning,” in Proc. IPIN, Nantes, France, pp. 1–8, 2018. [Google Scholar]
22. L. Sun, Z. W. Zheng, T. He and F. Li, “Multifloor wi-fi localization system with floor identification,” International Journal of Distributed Sensor Networks, vol. 11, no. 7, pp. 131523, 2015. [Google Scholar]
23. M. A. Bitew, R. S. Hsiao, H. P. Lin and D. B. Lin, “Hybrid indoor human localization system for addressing the issue of RSS variation in fingerprinting,” International Journal of Distributed Sensor Networks, vol. 11, no. 3, pp. 831423, 2015. [Google Scholar]
24. A. Bensky, Wireless Positioning Technologies and Applications. Norwood, MA, USA: Artech House, 2016. [Google Scholar]
25. E. L. Gunnarsdóttir, “The earth’s magnetic field,” Iceland: University of Iceland, Ph.D. dissertation, 2012. [Google Scholar]
26. C. E. Galván-Tejada, J. P. García-Vázquez, J. I. Galván-Tejada, J. R. Delgado-Contreras, R. F. Brena et al., “Infrastructureless indoor localization using the microphone, magnetometer and light sensor of a smartphone,” Sensors, vol. 15, no. 8, pp. 20355–20372, 2015. [Google Scholar]
27. W. Shao, F. Zhao, C. Wang, H. Luo, T. M. Zahid et al., “Location fingerprint extraction for magnetic field magnitude based indoor positioning,” Journal of Sensors, vol. 2016, pp. 1–17, 2016. [Google Scholar]
28. I. Ashraf, S. Hur and Y. Park, “Enhancing performance of magnetic field based indoor localization using magnetic patterns from multiple smartphones,” Sensors, vol. 20, no. 9, pp. 2704, 2020. [Google Scholar]
29. J. L. Elman, “Finding structure in time,” Cognitive Science, vol. 14, no. 2, pp. 179–211, 1990. [Google Scholar]
30. G. Lample, M. Ballesteros, S. Subramanian, K. Kawakami and C. Dyer, “Neural architectures for named entity recognition. in Proc. of the 2016 Conf. of the North American Chapter of the Association for Computational Linguistics, Human Language Technologies, pp. 260–270, 2016. [Google Scholar]
31. N. Srivastava, G. Hinton, A. Krizhevsky, I. Sutskever and R. Salakhutdinov, “Dropout: A simple way to prevent neural networks from overfitting,” Journal of Machine Learning Research, vol. 5, no. 1, pp. 1929–1958, 2014. [Google Scholar]
32. K. Cho, B. V. Merriënboer, D. Bahdanau and Y. Bengio, “On the properties of neural machine translation: Encoder-decoder approaches,” in Proc. of SSST-8, Eighth Workshop on Syntax, Semantics and Structure in Statistical Translation, ACM, pp. 103–111, 2014. [Google Scholar]
33. Asahi Kasei Microdevices Corporation, “AK09918C,” Online: accessed 19 April 2020, [Online]. Available: https://www.akm.com/global/en/products/electronic-compass/ak09918c/ 2016. [Google Scholar]
34. Asahi Kasei Microdevices Corporation, “AK09916C,” Online: accessed 20 April 2020, [Online]. Available: https://www.akm.com/akm/en/file/datasheet/AK09916C.pdf 2016. [Google Scholar]
 | This work is licensed under a Creative Commons Attribution 4.0 International License, which permits unrestricted use, distribution, and reproduction in any medium, provided the original work is properly cited. |