DOI:10.32604/cmc.2021.016141
| Computers, Materials & Continua DOI:10.32604/cmc.2021.016141 | |
| Article |
VGG-CovidNet: Bi-Branched Dilated Convolutional Neural Network for Chest X-Ray-Based COVID-19 Predictions
1Information Systems, King Abdulaziz University, Jeddah, Saudi Arabia
2Department of Science, Umm Al Qura University, Mecca, Saudi Arabia
*Corresponding Author: Muhammed Binsawad. Email: mbinsawad@kau.edu.sa
Received: 24 December 2020; Accepted: 27 February 2021
Abstract: The coronavirus disease 2019 (COVID-19) pandemic has had a devastating impact on the health and welfare of the global population. A key measure to combat COVID-19 has been the effective screening of infected patients. A vital screening process is the chest radiograph. Initial studies have shown irregularities in the chest radiographs of COVID-19 patients. The use of the chest X-ray (CXR), a leading diagnostic technique, has been encouraged and driven by several ongoing projects to combat this disease because of its historical effectiveness in providing clinical insights on lung diseases. This study introduces a dilated bi-branched convoluted neural network (CNN) architecture, VGG-COVIDNet, to detect COVID-19 cases from CXR images. The front end of the VGG-COVIDNet consists of the first 10 layers of VGG-16, where the convolutional layers in these layers are reduced to two to minimize latency during the training phase. The last two branches of the proposed architecture consist of dilated convolutional layers to reduce the model’s computational complexity while retaining the feature maps’ spatial information. The simulation results show that the proposed architecture is superior to all the state-of-the-art architecture in accuracy and sensitivity. The proposed architecture’s accuracy and sensitivity are 96.5% and 96%, respectively, for each infection type.
Keywords: Coronavirus disease 2019; prognosis; X-ray images; deep learning; artificial intelligence
Coronavirus disease 2019 (COVID-19) has been spreading exponentially; thus, it has become a pandemic. Its transmission process has not been fully comprehended. The virus often causes few or no symptoms; however, in 2%–8% of infected individuals, rapidly advancing and, frequently, deadly pneumonia can occur [1–3]. The precise prevalence, mortality, and transmission approaches are still not completely understood partly because of the distinct issues posed by severe acute respiratory syndrome coronavirus 2 (SARS-CoV-2) infection. They include peak infectiousness at or immediately preceding symptom onset and a poorly understood multi-organ pathophysiology with major features and fatality within the lungs [4]. Because of the rapid transmission rate of infection, healthcare systems worldwide have been affected by the unavailability of key protective gear and qualified providers [5]. In addition, practitioners have varied access to point-of-care testing techniques, such as reverse transcription-polymerase chain reaction (RT-PCR) [6]. Despite the increase in the availability of rapid RT-PCR testing, challenges persist. They include high rates of false negatives, delays in processing, changes in testing methodologies, and sensitivity rates that are often found to be low [7,8].
Radiography is a technique that has been applied to COVID-19 screening. Chest radiography (e.g., computed tomography [CT] or [CXR]) is performed and read by radiologists to visually identify infection-related features. Initial studies have shown irregularities in patients’ chest radiographs. This is typically the case in those infected with COVID-19 [9–11]. Studies have indicated that radiographic assessments could serve as the main technique for COVID-19 screening in epidemic regions [12]. For example, Guan et al. [11] found that radiographic irregularities, including bilateral abnormalities, interstitial irregularities, and ground-glass opacity in CT and CXR images, were present in COVID-19 positive cases. Huang et al. [10] found bilateral radiographic inconsistencies in the CXR images of most COVID-19 positive cases. Most new studies have focused on CT imaging because of the higher image detail. However, the use of CXR imaging for COVID-19 screening during the pandemic has several benefits, especially for resource-limited and highly affected regions.
Rapid training: Through CXR images, patients with suspected COVID-19 infection can be rapidly trained. This can be performed along with viral testing (the results of which take time) to bring relief to the large number of patients, particularly those in the highly affected regions (e.g., Spain and Italy) where hospitals have exceeded capacity. CXRs can also be performed alone when viral testing is not possible because of low supplies. In addition, CXR imaging is highly effective for triaging in geographical regions (e.g., in New York City) where patients are given instructions to stay at home until they start experiencing more advanced symptoms. The reason is that abnormalities are frequently observed in patients presenting with suspected COVID-19 at clinics [13].
Availability and accessibility: Many clinics and imaging centers have easily available and accessible CXR imaging because most healthcare systems consider it standard equipment. Particularly in developing countries, CT imaging is less available than CXR imaging because of the high acquisition and maintenance costs.
Portability: Imaging can be performed in isolation rooms because of the availability of portable CXR systems. This considerably decreases the risk of COVID-19 transmission in rooms with fixed imaging systems or during patient transport to these rooms [13].
Therefore, it is possible to perform radiographic assessments more rapidly. In addition, these systems have become more widely available, as is clear from the availability of chest radiographic systems and portable equipment in modern healthcare systems. Hence, computer-assisted diagnostic systems that can improve the accuracy of radiologists’ interpretations of images to determine the status of COVID-19 cases are highly desirable. Several models have been proposed and implemented. Most have limitations, such as computational overhead, a limited number of training or testing sets, the requirement for a separate training session, and the need to train a large number of parameters. Thus, the development of accurate diagnostic methods is important.
Consequently, the present study has proposed VGG-COVIDNet, a dilated bi-branched convoluted neural network (CNN) system for COVID-19 detection on the basis of CXR images. The motivation is the growing need for solutions to combat the pandemic. A review of the literature indicates that COVIDx is the most extensive open-access benchmark dataset on the number of publicly available COVID-19 positive cases. Furthermore, the predictive effectiveness of VGG-COVIDNet was investigated by leveraging the transfer-learning capability of the first 10 layers of VGG-16 and dilated convolution to capture the feature maps’ spatial information to reduce the complexity of the model.
With the rapid increase in the number of suspected cases, artificial intelligence methods may play a role in the identification and characterization of COVID-19 through imagery. CXR gives this process a clear and expedited window. Deep learning from large CXR multinationals could provide automated reproducible biomarkers to classify and to quantify COVID-19. This study aimed to develop and to evaluate a CNN-based model to classify three types of infections. The focus was the high-accuracy detection of normal, COVID-19, and non-COVID-19 cases. The rationale behind the choice of these categories was the opportunity for clinicians to prioritize patients for COVID-19 testing and to determine the appropriate care on the basis of the cause of infection because of the differences in the treatment of COVID19 and non-COVID-19 infections. The main contributions of this work are as follows:
1. A dilated convolution and branching strategy model are proposed. The dilated convolution aims to grab spatial information from the feature maps by avoiding pooling layers, which increase complexity.
2. Given the nature of the problem, the first 10 layers of the VGG-16 model [14] are used as the front end of the architecture because of the model’s flexibility and transfer-learning capability. These first 10 layers extract and use the high-level feature and provide the generated outputs to the two branches to further extract and to incorporate low-level features throughout the training process.
This paper is organized as follows. Section 2 discusses the methods employed in the detection of COVID-19 and other diseases. Section 3 explains the use of the dataset for infection detection. In Section 4, the benefits of the proposed architecture and dilated convolution are discussed. Section 5 explains the efficiency of the architecture through evaluation matrices and provides a comparison with the state-of-the-art methods. Finally, conclusions are drawn, and future directions are discussed in Section 6.
Studies have examined the potential of CXR and CT scans in the detection of COVID-19 [15–17]. Most have sought to generate automatic COVID-19 classification systems that typically employ CNNs [18]. Xu et al. [19] initially used a pre-trained three-dimensional CNN to extract potentially infected regions via CT scans. The samples were then added to another CNN and sorted with 86.7% accuracy into three categories: non-infection, influenza viral pneumonia, and COVID-19. Wang et al. [20] first extracted candidates by employing a threshold-based strategy. Next, for every case, a random selection of two or three regions was used to create the dataset, which was used to fine-tune a pre-trained CNN. Finally, features were removed from the CNN and added to a group of classifiers for predicting COVID-19 with 88% accuracy. The authors in [21] used CT scans to identify positive COVID-19 cases in which all the slices were separately fed into the model and a max-pooling function was used to combine all the outputs, thereby achieving 90% sensitivity. In [22], a pretraining CNN model was initially trained on the ImageNet dataset [23]. Next, it was refined through the use of a CXR image dataset to classify the samples as normal, bacterial, COVID-19 viral infection, and non-COVID-19 viral infection with 83.5% accuracy. Sethy et al. [24] conducted similar research in which they trained different CNN models on CXR images, then an SVM classifier used to detect positive COVID-19 cases with 95.38% accuracy. In [25], capsule networks, COVID-CAPS, were proposed. This model, which includes capsule and convolution layers, attained an accuracy of 95.7%, a sensitivity of 90%, a specificity of 95.8%, and an area under the curve (AUC) of 0.97%.
CXRs have been widely used to identify COVID-19 positive cases [22,24,26,27]. Chen et al. [28] found bilateral pneumonia in patient CXRs in a sample of 99 cases. Interestingly, the link between CXRs and CT images was noted by Yoon et al. [26] in a study of nine COVID-19 positive cases. Other studies have focused on neural network-tailored deep-learning (DL) models, such as ResNet50 [24] and COVID-Net [22]. ResNet50 was tested on 25 positive COVID-19 cases, and COVID-Net was used on just 31 positive cases. A classic deep-learning model was employed by Zhang et al. [27] on 100 COVID-19 samples to detect positive cases. This method exhibited a high accuracy of 90%. To detect COVID-19 positive cases from CXRs, Ozturk et al. [29] developed a deep neural network (DNN)-based method that achieved 98.08% accuracy in 125 positive cases. Moreover, the model also achieved 87.02% accuracy by employing the multi-class scenario. Narin et al. [16] used three types of DNN architecture (Inception-ResNetV2, ResNet50, and InceptionV3) to identify COVID-19 positive cases from a total of 50 samples. They achieved accuracy levels of 97%, 98%, and 87%, respectively. Using a sample of 155 COVID-19 positive cases, Mangal et al. [30] proposed a DL-based system, CovidAID, to determine positive cases from CXRs. The study achieved 90.5% accuracy and 100% sensitivity.
To detect COVID-19 cases from CT images with weak labels, Wang et al. [31] proposed a DL-based method, which was trained by using 499 volumes and tested with an additional 131 volumes. The authors achieved specificity and sensitivity values of 0.911 and 0.907, respectively. Farooq et al. [17] proposed a DL-based approach to distinguish COVID-19 cases on the basis of CXRs. Using eight COVID-19 positive cases, the study achieved 96.23% accuracy. A DL-based method was used by Hall et al. [32] to determine COVID-19 cases from CXRs. From 135 COVID-19 positive cases, the authors achieved 89.2% accuracy, exhibiting a true positivity rate of 0.8039 and an AUC of 0.95. An ensemble-based method that was used to test a group of 33 CXRs achieved 91.24% accuracy and an AUC of 0.7879. The authors in [33] employed CXRs and CT scans to test a proposed CNN-tailored DNN, with 96.28% accuracy (
The present study used the COVIDx dataset proposed by [22]. It consisted of 13,975 CXR images across 13,870 patient cases. The dataset was generated through the integration and modification of five publicly available data archives:
1. COVID-19 Image Data Collection [36]
2. COVID-19 Chest X-Ray Dataset Initiative [37]
3. ActualMed COVID-19 Chest X-Ray Dataset Initiative [38]
4. RSNA Pneumonia Detection Challenge Dataset [39]
5. COVID-19 Radiography Database [40].
Some images from the COVIDx dataset are shown in Fig. 1. All the combined images from the above archives were divided into the following three categories.
1. Normal: This comprised 7,983 normal images, i.e., the absence of chest disease.
2. Non-COVID 19: This contained 5,475 images with signs of non-COVID-19-related chest disease.
3. COVID-19: This included 517 images of COVID-19 patients.

Figure 1: Sample images from the COVIDx dataset. (1) COVID-19 images, (2) non-COVID-19 images, (3) normal images
The data distribution by infection type is presented in Fig. 2. It illustrates the paucity of COVID-19 patient data in the publicly available repositories. Fig. 2 also indicates the need for additional COVID-19 data to improve the results and to reduce the false-negative and false-positive rates in the testing phase. Tab. 1 presents the distribution of the images in the training and testing sets.
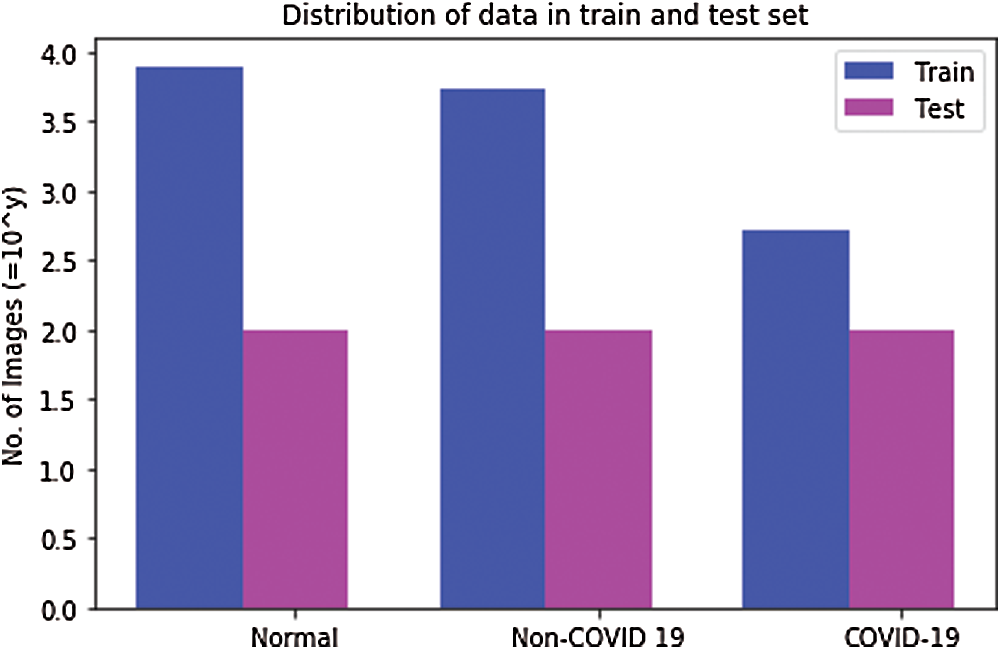
Figure 2: Distribution of COVIDx dataset in training and testing datasets. The values are represented on the y-axis after taking log with base 10
Table 1: Image distribution in training and testing sets

This study presents a hybrid bi-branched CNN model based on dilated convolution to classify CXR images in three infection types: COVID-19, non-COVID-19, and normal. The first 10 layers of the VGG-16 architecture were used as the front end of the proposed model, VGG-COVIDNet. The back end was based on dilated kernels, which are explained in the succeeding sections. The main idea of the proposed solution was the deployment of a deeper CNN to produce high-level features without losing detailed information in the images. In addition, it has large receptive fields and classifies the CXRs in the respective categories without the negative exploitation of network complexity. This section describes the proposed architecture and presents the training method.
Initially, the input images were converted to the JPEG format and resized to 480
Here, Iout and Iin are the output and input images, respectively, where c = 1 and
4.2 Architecture of the Proposed VGG-CovidNet Model
The proposed model consists of VGG-16 [14] and some CNN layers with expanded convolutional layers to classify the CXR images in the respective classes. VGG-16 was chosen as the front-end architecture on the basis of [41–43] because of its strong transfer learning ability and the flexibility to easily concatenate the back end for the desired task. In the absence of a back end, the VGG-16 performs supportive tasks without boosting performance, and this results in very low accuracy. In the present study, the fully connected VGG-16 layers (classification part) are removed, and the proposed VGG-CovidNet is made by appending the convolutional layers in VGG-16. The front-end network’s output size is one-eighth of the original input size, and upon stacking multiple layers, the information in the images is lost. In turn, it affects classification performance. Inspired by the work of [41–43], the study incorporated dilated convolutional layers as the back end to extract deeper patency information, which is crucial for classification tasks (Fig. 3).

Figure 3: Proposed VGG-CovidNet hybrid architecture. The parameters of the convolutional layers are denoted as Conv-(kernel size), and the second line represents (number of filters) − (dilation rate)
In the proposed model, one of the crucial components is the dilated convolution inspired by [44]. The mathematical formulation of the dilated convolution can be given in Eq. (3).
O(m, n) is the resultant output of the dilated convolution, where I(.) and kernel K(i, j) are the inputs to convolution with the length and width of m and n, respectively. The stride s determines the dilation size, where for s = 1, the convolution becomes the normal dilation. An alternative to pooling layers, dilated convolution for segmentation tasks has been found to yield significant improvements in accuracy [39–41]. Pooling is used to maintain invariance and to avoid overfitting in the learning model. However, it reduces the spatial resolution of the input, and this in turn causes the spatial information of the feature map to be lost. This information loss can be ameliorated through the deconvolutional layers but at the cost of increased complexity and latency, which may not be suitable in every case. Dilated convolution is the solution to avoid the disadvantages of using the pooling and deconvolutional layer. In the dilated convolutional layers, sparse kernels that replace the pooling and deconvolutional layers are used by enlarging the receptive field to avoid information loss and to control complexity. In addition, they reduce the number of operations by performing down-sampling followed by up-sampling. Thus, it facilitates the flexible aggregation of the multiscale contextual information with the same resolution. The dilated convolution demonstration is illustrated in Fig. 4, which shows an enlargement of a small

Figure 4: 3
This subsection describes the proposed VGG-CovidNet architecture, which has the same front end, which consists of the first 10 layers of the VGG-16 model. The back end is two branches with different dilation rates. Each branch extracts pieces of spatial information missed by the other processes during dilation. In the end, both outputs are combined to enhance classification accuracy. Moreover, the pooling layers in VGG-16 are reduced to two instead of three layers to overcome the detrimental effects on output accuracy.
To train the VGG-CovidNet, the procedure of [22] was followed. However, instead of being pretrained on the ImageNet [45] dataset, the VGG-CovidNet was trained afresh with the Adam optimizer The hyperparameter values were adjusted, as indicated below:
4.6 Hyper-Parameter Adjustment
The hyper-parameters of a neural network are variables that represent the network structure and training methods on the conditions provided. To avoid the fluctuation of the weight values and direct them toward the minimum solution, the learning rate was set to 2e −4. The dropout rate at the last layers was set to 20% because the high value would lead to underfitting, and the low value would have a minimal effect. Based on the network results during training, the number of layers after VGG-16 was set to 6. The activation function is also an important factor in network architecture. Therefore, in the hidden layers, the rectified linear unit activation function was used to avoid negative values during the process, and in the last layer, the softmax entropy was used for multi-class predictions.
To evaluate the effectiveness of the proposed architecture, the results were analyzed to better observe the classification performance and to evaluate it against various types of DNN architecture.
In this section, the effects of the VGG-CovidNet architecture are analyzed in terms of the performance balance in the classification process on the resulting network architecture. For comparison, an in-depth analysis and evaluation of the performance of the following DNN architecture were performed:
VGG-19 [14]: A DNN architecture with low architectural diversity that does not use residual design principles.
ResNet-50 [47]: A DNN architecture that uses lightweight patterns and moderate architectural diversity with minimal long-range connectivity (it does not leverage lightweight PEPX patterns).
COVID-Net [22]: A deep convolutional multistage neural network design. In the first stage, the design principle was adopted to enable reliable high-performance trainable neural network structures. In the second stage, a design pattern for projection expansion and projection was used to provide a better representation while retaining computational efficiency.
To analyze the quantitative performance of the proposed model, the test accuracy, positive predictive value (PPV), and sensitivity were recorded for each infection type on the COVIDx dataset. In addition to these performance measures, the architectural complexity regarding the parameters and computation complexity in terms of the multiplier–accumulator (MAC) numbers were also measured (Tab. 1). The values of the number of parameters and MAC of VGG-16 of all 16 layers [14] were 138 M and 15.4 G, respectively, because of the large number and channels of the convolutional layers. However, in the present study, they were reduced to 13.24 M and 14.3 G, respectively, by decreasing the number of convolutions in each layer to two instead of three and by using just 10 layers of VGG-16. One of the main reasons for these lower values was dilated convolution, which reduces the number of parameters and MACs. The accuracy achieved through the proposed model is 96.5%, which is superior to that of all other types of architecture (Tab. 2). However, the architectural and computational complexity of the proposed model are slightly higher than that of [22]. Unlike the model in [22], this model did not require continuous retraining whenever new data were collected. Tab. 2 indicates that the complexity of the proposed model was the result of the higher transfer learning based on VGG-16. Therefore, it will incur higher computational costs than other models during retraining. However, if the first 10 layers of the model are kept frozen, then the computational complexity in retraining the model will become reasonable.
Table 2: Performance comparison of state-of-the-art architecture

To gain deeper insights into the proposed model, the sensitivity and PPV were computed (Tabs. 3 and 4, respectively). Figs. 5 and 6 illustrate the comparison of the PPV and sensitivity of the proposed model with those of other models. These measures, sensitivity and PPV, were derived from the confusion matrix (Fig. 7) and compared with the confusion matrix for COVID-Net in Fig. 8, which resulted from the testing phase. The proposed model’s sensitivity is 96%, which is the highest value achieved so far for COVID-19 cases. This high sensitivity suggests that the rate of missed COVID-19 positive cases is lower than that in the other state-of-the-art methods (Tab. 3). The PPV value is comparable to that of [22], which shows fewer incorrectly classified COVID-19 cases. As shown in Fig. 7, two of the four patients were classified as non-COVID-19 patients, and two were classified as normal. In sum, the results indicate that the proposed model outperformed the state-of-the-art method in terms of accuracy and sensitivity on the COVIDx dataset.
Table 3: Sensitivity for each infection type

Table 4: Positive predictive value for each infection type


Figure 5: Comparison of positive predictive values of VGG-CovidNet and those of other models

Figure 6: Comparison of sensitivity of VGG-CovidNet and that of other models

Figure 7: Confusion matrix for the proposed model on the COVIDx dataset

Figure 8: Confusion matrix for the COVID-Net on the COVIDx dataset [22]
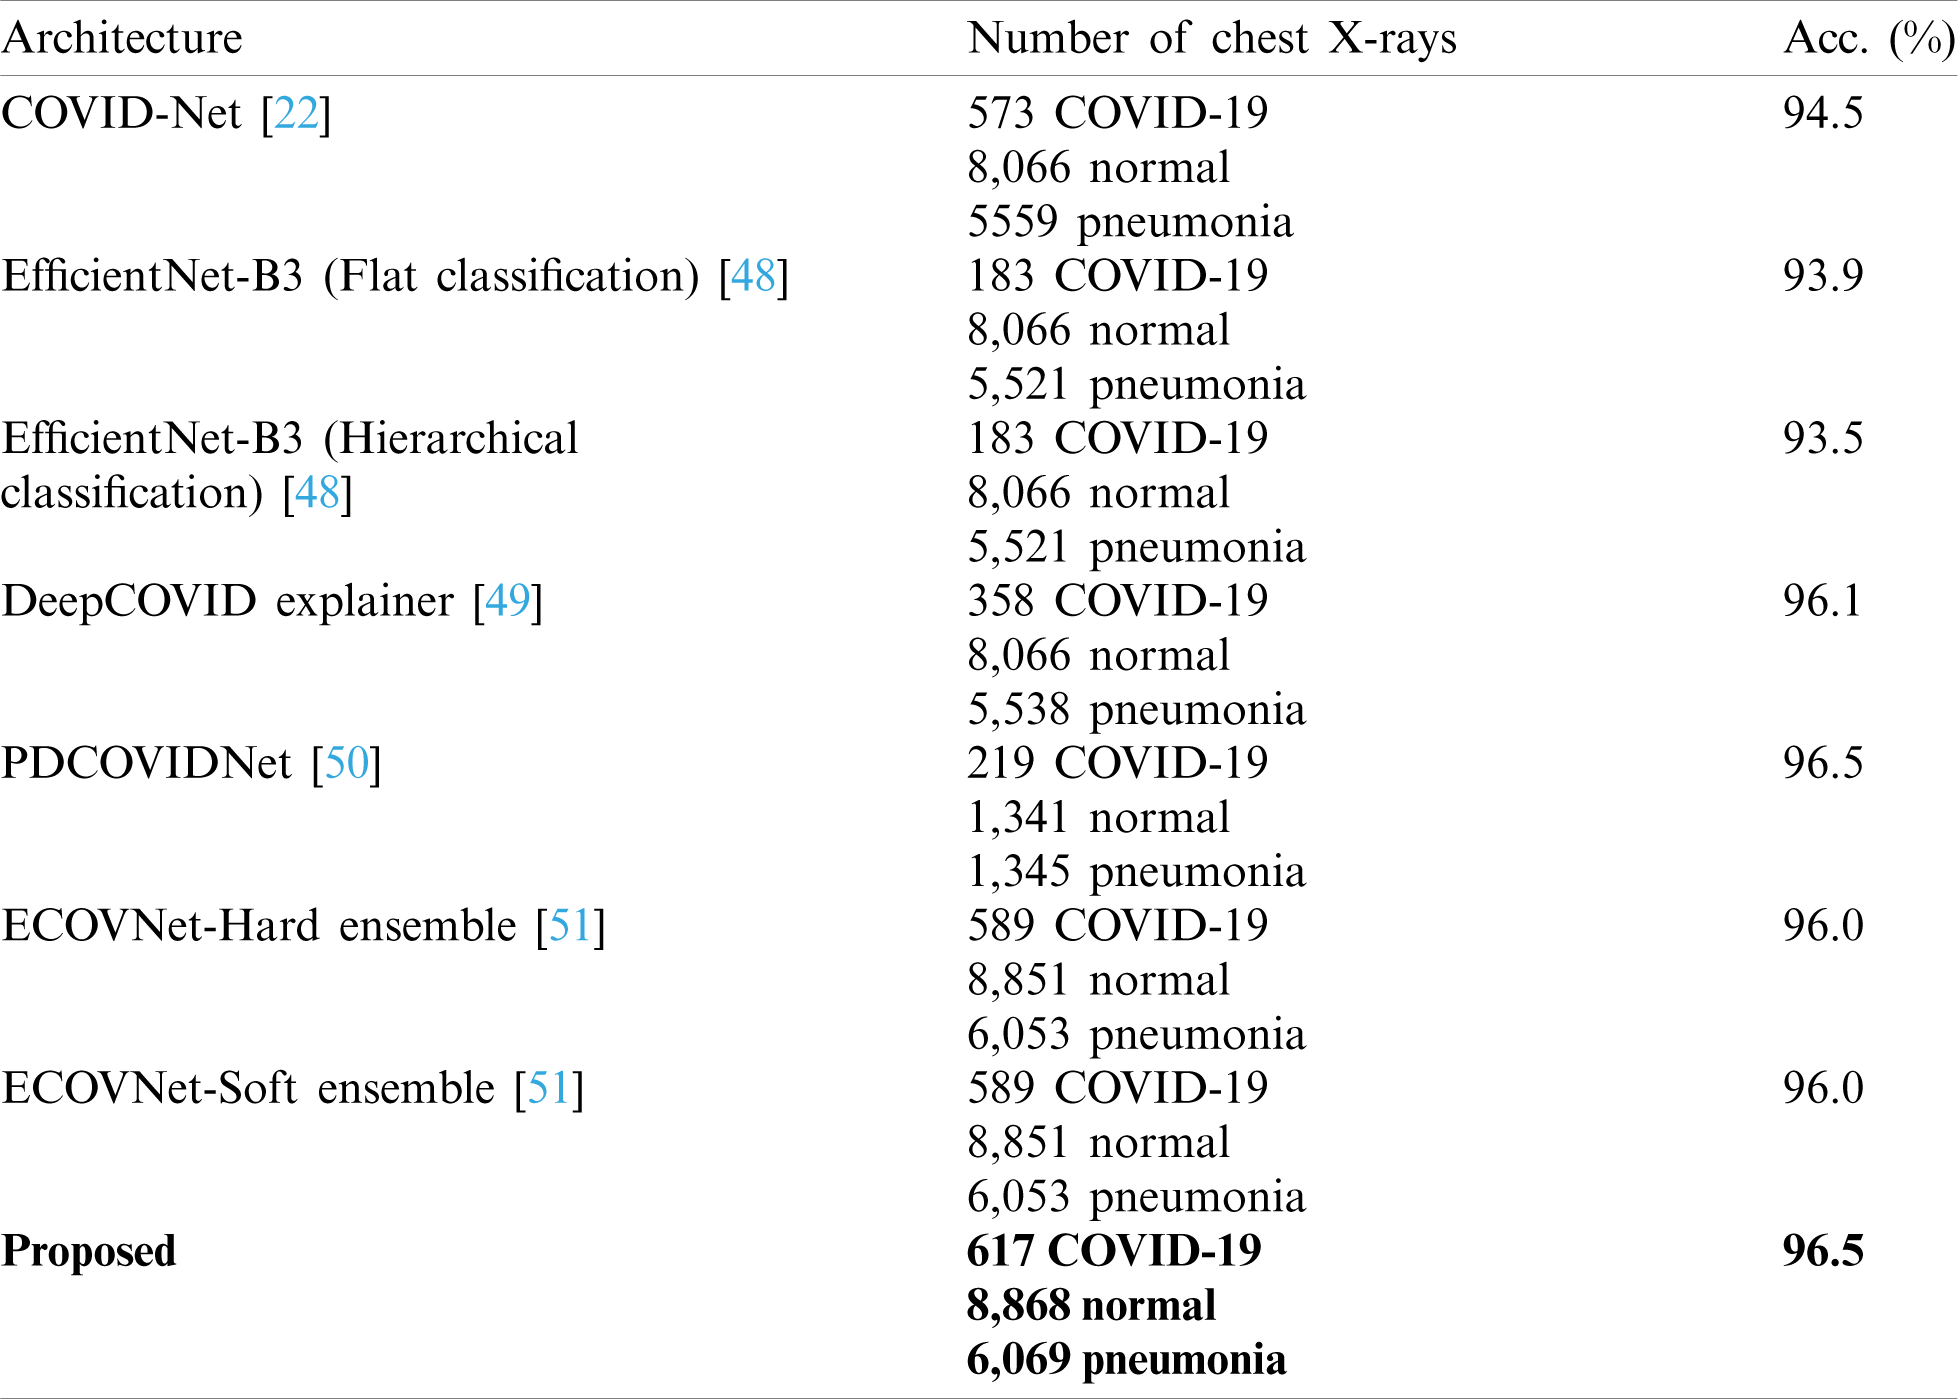
The comparison of VGG-COVIDNet and the latest models to detect COVID-19 is shown in Tab. 5. The proposed model is superior to the other models because it identifies the features that distinguish COVID-19 from other classes. The same dataset (COVIDx) and ImageNet were used in most of the models. The DeepCOVIDExplainer method employed two ensemble strategies, and ECOVNet used an EfficientNet base model with ImageNet pre-trained weights. Similar to the present work, PDCOVIDNet is a dilated convolution-based COVID-19 detection network. The accuracy of PDCOVIDNet has been found to be comparable to that of the proposed method. However, in PDCOVIDNet, training and testing were performed on a limited dataset. The other ensemble models have limited applicability because of the computational cost of training multiple DL models for ensemble prediction. COVID-Net used many parameters that produced a high computational overhead; therefore, it is not very practicable.
Table 5: Comparison of the proposed model and other models for COVID-19 detection
The proposed study has a few limitations, such as model complexity and the unavailability of a large set. The minimal number of images in the dataset restricted system performance in terms of the high false-positive rate. The false positive rate can be reduced with the availability of additional COVID-19 images. The proposed model has a higher degree of complexity than the network proposed by [22], as can be observed from the number of parameters shown in Tab. 2. There is a need to reduce the complexity without affecting or degrading performance; however, there is a trade-off. Regardless, model retraining will be required with the availability of more images to further increase performance.
This paper has introduced VGG-CovidNet, a dilated convolution-based bi-branched architecture for classifying infectious images into corresponding classes. The front end of VGG-CovidNet is integrated with the first 10 layers of the VGG-16 model. In these layers, the convolution is reduced to two instead of three to reduce computational complexity. The back end of VGG-CovidNet consists of six parallel convolutional layers with different strides of the convolutional kernel. Using the dilated convolution facilitated the capture of the feature maps’ spatial information and the reduction of the model’s complexity. A benchmark dataset (COVIDx) was used to train and to test the proposed model. Further, VGG-CovidNet was quantitatively analyzed on the basis of accuracy, sensitivity, and PPV matrices. Comparisons with the state-of-the-art models indicate that VGG-CovidNet undoubtedly yields promising results with 96.5% accuracy, 96.0% sensitivity, and 98% PPV.
Funding Statement: This work was funded by Institutional Fund projects (Grant No. IFPHI-255-611-2020). The authors therefore gratefully acknowledge the technical and financial support from the Ministry of Education and King Abdulaziz University, DSR, Jeddah, Saudi Arabia.
Conflicts of Interest: The authors declare that they have no competing interests.
1. S. Hoehl, H. Rabenau, A. Berger, M. Kortenbusch, J. Cinatl et al., “Evidence of SARS-CoV-2 infection in returning travelers from Wuhan,” China New England Journal of Medicine, vol. 382, no. 13, pp. 1278–1280, 2020. [Google Scholar]
2. S. N. Atluri, The Meshless Method (MLPG) for Domain & BIE Discretization. Henderson, NV, USA: Tech Science Press, 2004. [Google Scholar]
3. C. C. Lai, Y. H. Liu, C. Y. Wang, Y. H. Wang, S. C. Hsueh et al., “Asymptomatic carrier state, acute respiratory disease, and pneumonia due to severe acute respiratory syndrome coronavirus 2 (SARS-CoV-2Facts and myths,” Journal of Microbiology, Immunology and Infection, vol. 53, no. 3, pp. 404–412, 2020. [Google Scholar]
4. X. He, E. H. Y. Lau, P. Wu, X. Deng, J. Wang et al., “Temporal dynamics in viral shedding and transmissibility of COVID-19,” Nature Medicine, vol. 26, no. 5, pp. 672–675, 2020. [Google Scholar]
5. M. L. Ranney, V. Griffeth and A. K. Jha, “Critical supply shortages—The need for ventilators and personal protective equipment during the Covid-19 pandemic,” New England Journal of Medicine, vol. 382, no. 18, pp. e41, 2020. [Google Scholar]
6. W. Wang, Y. Xu, R. Gao, R. Lu, K. Han et al., “Detection of SARS-CoV-2 in different types of clinical specimens,” JAMA, vol. 323, no. 18, pp. 1843–1844, 2020. [Google Scholar]
7. Y. Yang, M. Yang, J. Yuan, F. Wang, Z. Wang et al., “Laboratory diagnosis and monitoring the viral shedding of SARS-CoV-2 infection,” Innovation, vol. 1, no. 3, pp. 100061, 2020. [Google Scholar]
8. Y. Fang, H. Zhang, J. Xie, M. Lin, L. Ying et al., “Sensitivity of chest CT for COVID-19: Comparison to RT-PCR,” Radiology, vol. 296, no. 2, pp. 115–117, 2020. [Google Scholar]
9. M. Y. Ng, E. Y. P. Lee, J. Yang, F. Yang, X. Li et al., “Imaging profile of the COVID-19 infection: Radiologic findings and literature review,” Radiology: Cardiothoracic Imaging, vol. 2, no. 1, pp. e200034, 2020. [Google Scholar]
10. C. Huang, Y. Wang, X. Li, L. Ren, J. Zhao et al., “Clinical features of patients infected with 2019 novel coronavirus in Wuhan, China,” Lancet, vol. 395, no. 10223, pp. 497–506, 2020. [Google Scholar]
11. W. Guan, Z. Ni, Y. Hu, W. Liang, C. Ou et al., “Clinical characteristics of coronavirus disease 2019 in China,” New England Journal of Medicine, vol. 382, no. 18, pp. 1708–1720, 2020. [Google Scholar]
12. T. Ai, Z. Yang, H. Hou, C. Zhan, C. Chen et al., “Correlation of chest CT and RT-PCR testing for coronavirus disease 2019 (COVID-19) in China: A report of 1014 Cases,” Radiology, vol. 296, no. 2, pp. 32–40, 2020. [Google Scholar]
13. G. D. Rubin, C. J. Ryerson, L. B. Haramati, N. Sverzellati, J. P. Kanne et al., “The role of chest imaging in patient management during the COVID-19 pandemic: A multinational consensus statement from the Fleischner society,” Radiology, vol. 296, no. 1, pp. 172–180, 2020. [Google Scholar]
14. K. Simonyan and A. Zisserman, “Very deep convolutional networks for large-scale image recognition,” arXiv preprint arXiv: 1409.1556, 2014. [Google Scholar]
15. O. Gozes, M. Frid-Adar, H. Greenspan, P. D. Browning, H. Zhang et al., “Rapid AI development cycle for the coronavirus (COVID-19) pandemic: Initial results for automated detection & patient monitoring using deep learning CT image analysis,” arXiv e-prints, arXiv: 2003.05037, 2020. [Google Scholar]
16. A. Narin, C. Kaya and Z. Pamuk, “Automatic detection of coronavirus disease (COVID-19) using X-Ray images and deep convolutional neural networks,” arXiv e-prints, arXiv: 2003.10849, 2020. [Google Scholar]
17. M. Farooq and A. Hafeez, “COVID-ResNet: A deep learning framework for screening of COVID19 from radiographs,” arXiv e-prints, arXiv: 2003.14395, 2020. [Google Scholar]
18. R. Yamashita, M. Nishio, R. K. G. Do and K. Togashi, “Convolutional neural networks: An overview and application in radiology,” Insights into Imaging, vol. 9, no. 4, pp. 611–629, 2018. [Google Scholar]
19. X. Xu, X. Jiang, C. Ma, P. Du, X. Li et al., “A deep learning system to screen novel coronavirus disease 2019 pneumonia,” Engineering, vol. 6, no. 10, pp. 1122–1129, 2020. [Google Scholar]
20. S. Wang, B. Kang, J. Ma, X. Zeng, M. Xiao et al., A Deep Learning Algorithm using CT images to Screen for Coronavirus Disease (COVID-19). United States: Cold Spring Harbor Laboratory, 2020. [Google Scholar]
21. L. Li, L. Qin, Z. Xu, Y. Yin, X. Wang et al., “Using artificial intelligence to detect COVID-19 and community-acquired pneumonia based on pulmonary CT: Evaluation of the diagnostic accuracy,” Radiology, vol. 296, no. 2, pp. 65–71, 2020. [Google Scholar]
22. L. Wang, Z. Q. Lin and A. Wong, “Covid-Net: A tailored deep convolutional neural network design for detection of COVID-19 cases from chest X-ray images,” Scientific Reports, vol. 10, no. 1, pp. 1–12, 2020. [Google Scholar]
23. A. Krizhevsky, I. Sutskever and G. E. Hinton, “ImageNet classification with deep convolutional neural networks,” Communications of the ACM, vol. 60, no. 6, pp. 84–90, 2017. [Google Scholar]
24. P. K. Sethy and S. K. Behera, “Detection of coronavirus disease (COVID-19) based on deep features and support vector machine,” MDPI AG, Preprints, 2020. [Google Scholar]
25. P. Afshar, S. Heidarian, F. Naderkhani, A. Oikonomou, K. N. Plataniotis et al., “COVID-CAPS: A capsule network-based framework for identification of COVID-19 cases from X-Ray images,” Pattern Recognition Letters, vol. 138, no. 4, pp. 638–643, 2020. [Google Scholar]
26. S. H. Yoon, K. H. Lee, J. Y. Kim, Y. K. Lee, H. Ko et al., “Chest radiographic and CT findings of the 2019 novel coronavirus disease (COVID-19Analysis of nine patients treated in Korea,” Korean Journal of Radiology, vol. 21, no. 4, pp. 494, 2020. [Google Scholar]
27. J. Zhang, Y. Xie, G. Pang, Z. Liao, J. Verjans et al., “Viral pneumonia screening on chest X-Rays using confidence-aware anomaly detection,” IEEE Transactions on Medical Imaging, vol. 40, no. 3, pp. 1, 2020. [Google Scholar]
28. N. Chen, M. Zhou, X. Dong, J. Qu, F. Gong et al., “Epidemiological and clinical characteristics of 99 cases of 2019 novel coronavirus pneumonia in Wuhan, China: A descriptive study,” Lancet, vol. 395, no. 10223, pp. 507–513, 2020. [Google Scholar]
29. T. Ozturk, M. Talo, E. A. Yildirim, U. B. Baloglu, O. Yildirim et al., “Automated detection of COVID-19 cases using deep neural networks with X-Ray images,” Computers in Biology and Medicine, vol. 121, no. 7798, pp. 103792, 2020. [Google Scholar]
30. A. Mangal, S. Kalia, H. Rajgopal, K. Rangarajan, V. Namboodiri et al., “Covidaid: COVID-19 detection using chest X-Ray,” arXiv preprint arXiv: 2004.09803, 2020. [Google Scholar]
31. X. Wang, X. Deng, Q. Fu, Q. Zhou, J. Feng et al., “A weakly-supervised framework for COVID-19 classification and lesion localization from chest CT,” IEEE Transactions on Medical Imaging, vol. 39, no. 8, pp. 2615–2625, 2020. [Google Scholar]
32. L. Hall, D. Goldgof, R. Paul and G. M. Goldgof, “Finding COVID-19 from chest X-Rays using deep learning on a small dataset,” arXiv: 2004.02060, 2020. [Google Scholar]
33. H. Mukherjee, S. Ghosh, A. Dhar, S. M. Obaidullah, K. C. Santosh et al., “Deep neural network to detect COVID-19: One architecture for both CT scans and chest X-rays,” Applied Intelligence, vol. 44, no. 5, pp. 1, 2020. [Google Scholar]
34. M. A. Mohammed, K. H. Abdulkareem, B. G. Zapirain, S. A. Mostafa, M. S. Maashi et al., “A comprehensive investigation of machine learning feature extraction and classification methods for automated diagnosis of COVID-19 based on X-Ray images,” Computers, Materials & Continua, vol. 66, no. 3, pp. 3289–3310, 2021. [Google Scholar]
35. A. S. Al-Waisy, S. A. Fahdawi, M. A. Mohammed, K. H. Abdulkareem, S. A. Mostafa et al., “COVID-CheXNet: Hybrid deep learning framework for identifying COVID-19 virus in chest X-Ray images,” Soft Computing, pp. 1–16, 2020. [Google Scholar]
36. J. P. Cohen, P. Morrison, L. Dao, K. Roth, T. Duong et al., “COVID-19 image data collection: Prospective predictions are the future,” arXiv preprint arXiv: 2006.11988, 2020. [Google Scholar]
37. A. Chung, “Figure 1 COVID-19 chest x-ray data initiative,” [Online]. Available: https://github.com/agchung/Figure1-COVID-chestxray-dataset (Accessed 2 July 2020). [Google Scholar]
38. A. Chung, “Actualmed COVID-19 chest x-ray data initiative,” [Online]. Available: https://github.com/agchung/Actualmed-COVID-chestxray-dataset (Accessed 2 July 2020). [Google Scholar]
39. R. S. of North America, “Rsna a pneumonia detection challenge,” [Online]. Available: https://www.kaggle.com/c/rsna-pneumonia-detection-challenge/data (Accessed 2 December 2019). [Google Scholar]
40. T. Rahman, “COVID-19 radiography database,” [Online]. Available: https://www.kaggle.com/tawsifurr-ahman/covid19-radiography-database (Accessed 2 July 2020). [Google Scholar]
41. D. B. Sam, S. Surya and R. V. Babu, “Switching convolutional neural network for crowd counting,” in 2017 IEEE Conf. on Computer Vision and Pattern Recognition, Honolulu, HI, USA, pp. 4031–4039, 2017. [Google Scholar]
42. V. A. Sindagi and V. M. Patel, “Generating high-quality crowd density maps using contextual pyramid CNNs,” in Proc. of the IEEE Int. Conf. on Computer Vision, Venice, pp. 1861–1870, 2017. [Google Scholar]
43. L. Boominathan, S. S. Kruthiventi and R. V. Babu, “Crowdnet: A deep convolutional network for dense crowd counting,” in Proc. of the 24th ACM Int. Conf. on Multimedia, New York, NY, USA, pp. 640–644, 2016. [Google Scholar]
44. F. Yu and V. Koltun, “Multi-scale context aggregation by dilated convolutions,” CoRR abs/ 1511.07122, 2016. [Google Scholar]
45. J. Deng, W. Dong, R. Socher, L. J. Li, K. Li et al., “Imagenet: A large-scale hierarchical image database,” in 2009 IEEE Conf. on Computer Vision and Pattern Recognition, Miami, FL, pp. 248–255, 2009. [Google Scholar]
46. N. Ketkar, Introduction to PyTorch. In: Deep Learning with Python. Heidelberg, Germany: Springer, pp. 195–208, 2017. [Google Scholar]
47. K. He, X. Zhang, S. Ren and J. Sun, “Deep residual learning for image recognition,” in IEEE Conf. on Computer Vision and Pattern Recognition, Las Vegas, NV, pp. 770–778, 2016. [Google Scholar]
48. E. Luz, P. L. Silva, R. Silva, L. Silva, G. Moreira et al., “Towards an effective and efficient deep learning model for COVID-19 patterns detection in X-Ray images,” arXiv: 2004.05717, 2004. [Google Scholar]
49. M. R. Karim, T. Döhmen, D. Rebholz-Schuhmann, S. Decker, M. Cochez et al., “DeepCOVID explainer: Explainable COVID-19 diagnosis based on chest X-Ray images,” arXiv: 2004.04582, 2004. [Google Scholar]
50. N. K. Chowdhury, M. M. Rahman and M. A. Kabir, “Pdcovidnet: A parallel-dilated convolutional neural network architecture for detecting COVID-19 from chest X-Ray images,” arXiv: 2007.14777, 2007. [Google Scholar]
51. N. K. Chowdhury, M. A. Kabir, M. M. Rahman and N. Rezoana, “ECOVNet: An ensemble of deep convolutional neural networks based on EfficientNet to detect COVID-19 from chest X-rays,” arXiv: 2009.11850, 2009. [Google Scholar]
 | This work is licensed under a Creative Commons Attribution 4.0 International License, which permits unrestricted use, distribution, and reproduction in any medium, provided the original work is properly cited. |