DOI:10.32604/cmc.2021.015925
| Computers, Materials & Continua DOI:10.32604/cmc.2021.015925 | |
| Article |
Automatic Data Clustering Based Mean Best Artificial Bee Colony Algorithm
1Deanship of Information and Communication Technology, Imam Abdulrahman bin Faisal University, Dammam, Saudi Arabia
2Computer Department, Imam Abdulrahman bin Faisal University, Dammam, Saudi Arabia
3School of Electrical and Computer Engineering, Department of Information and Communication Technology, Xiamen University Malaysia, Sepang, 43900, Malaysia
4Department of Computer Science, College of Computer Science and Information Technology, Imam Abdulrahman bin Faisal University, Dammam, Saudi Arabia
5Center for Artificial Intelligence Technology (CAIT), Faculty of Information Science and Technology, Universiti Kebangsaan Malaysia, 43600 Bangi, Malaysia
6School of Computer Sciences, Universiti Sains Malaysia, 11800, Penang, Malaysia
7Faculty of Computer Sciences and Informatics, Amman Arab University, Amman, Jordan
*Corresponding Author: Mohammed Alswaitti. Email: alswaitti.mohammed@xmu.edu.my
Received: 14 December 2020; Accepted: 28 January 2021
Abstract: Fuzzy C-means (FCM) is a clustering method that falls under unsupervised machine learning. The main issues plaguing this clustering algorithm are the number of the unknown clusters within a particular dataset and initialization sensitivity of cluster centres. Artificial Bee Colony (ABC) is a type of swarm algorithm that strives to improve the members’ solution quality as an iterative process with the utilization of particular kinds of randomness. However, ABC has some weaknesses, such as balancing exploration and exploitation. To improve the exploration process within the ABC algorithm, the mean artificial bee colony (MeanABC) by its modified search equation that depends on solutions of mean previous and global best is used. Furthermore, to solve the main issues of FCM, Automatic clustering algorithm was proposed based on the mean artificial bee colony called (AC-MeanABC). It uses the MeanABC capability of balancing between exploration and exploitation and its capacity to explore the positive and negative directions in search space to find the best value of clusters number and centroids value. A few benchmark datasets and a set of natural images were used to evaluate the effectiveness of AC-MeanABC. The experimental findings are encouraging and indicate considerable improvements compared to other state-of-the-art approaches in the same domain.
Keywords: Artificial bee colony; automatic clustering; natural images; validity index; number of clusters
Clustering of data is a statistical approach used for managing large data volume. It is a multivariate analytical approach, which identifies patterns and relationships that exist amongst data. By data clustering, a user could divide data into relatively homogeneous groups. By reorganizing these groups, the user may be able to utilize the original data volume efficiently. Clustering accuracy is crucial because, according to [1–3], clustered data that does not accurately denote the original data will have adverse consequences. In other words, data clustering is a set of patterns or points represented as vectors of attributes, measurement methods, or objects that exist in multidimensional feature space [4,5].
Clustering algorithms consist of two types, namely, the partitional clustering, which generates several partitions, and hierarchical clustering, which generates only one partition [4,5]. As highlighted by [5,6], there are two types of partitional clustering, namely, hard (crisp) and fuzzy (soft). Every data point in crisp clustering belongs to one cluster only. In the latter clustering of fuzzy, at the same time, data points might relate to much more than single cluster based on a certain degree of fuzzy membership. Between these two types (crisp and fuzzy), fuzzy clustering appears to be more acceptable for datasets that exhibit undefined bounds between regions or clusters.
Over the last few years, clustering methods have been demonstrated to be effective, particularly in tasks of categorization, requiring semi or full automation [7,8]. Clustering is employed to classify identical data points according to similarity and distance, based on the standard approach. In inter-cluster, the similarity increases as the distances decrease while in intra-cluster, simultaneously increasing distances will reduce similarity.
Clustering has many useful features, making it one of the most well-known in many fields of image segmentation, pattern recognition, machine learning, data mining, etc. [3,9]. One of its features is the partitional method of clustering [2]. It is free from issues such as static-behaviour, where the elements of data of a cluster are unmovable to another cluster. Additionally, this type of clustering also does not have the problem of overlapping clusters’ separation inability, which is common in hierarchical clustering. Amongst these fuzzy clustering techniques, FCM algorithm [10] is a useful approach that has been applied in many domains because it has robust ambiguity characteristics and can maintain rather more information than hard segmentation techniques [11,12].
However, the Fuzzy clustering-based approach still has significant weaknesses; for instance, its ability to obtain an automatic approach without prior knowledge of the number of clusters and centroid locations. Furthermore, determining the number of clusters within a particular dataset is a significant challenge and the unavailability of experts, operators, and any prior knowledge has contributed to this challenge as well. Accordingly, many researchers have worked on the successful implementation of clustering methods in the last few years to find the number of the appropriate clusters within a particular dataset without experts and operators.
Metaheuristic optimization search algorithms such as artificial bee colony (ABC) [13], bees algorithm (BA) [14,15], harmony search (HS) [16,17], firefly algorithm (FA) [18,19], and cuckoo search (CS) [20,21], have shown success in many fields such as clustering [11,22], image processing [23], scheduling [24] and others real-world applications [25]. Moreover, a fuzzy clustering approach based on metaheuristic optimization search algorithms is considered a suitable choice for solving the problems related to fuzzy clustering [3,26]. The following is a discussion of some of the methods.
A fuzzy clustering FCM was proposed in Ouadfel et al. [27] based on a modified ABC called MoABC-FCM. Additionally, Hancer et al. [28] presented an image segmentation approach using ABC algorithm to detect tumours from MRI images. In Alrosan et al. [29], ABC algorithms and fuzzy c-means were combined and called ABC-FCM. The combination used two types of MRI brain images namely simulated brain data, and actual MRI images, for its performance. Automatic Clustering-based Improved Binary ABC (IDisABC) which was proposed by [30]. In Kuo et al. [3] an automatic customer segmentation method based on an improved artificial bee colony and fuzzy clustering was proposed. Further, Kuo et al. [3], Alrosan et al. [23] proposed a new image clustering method based on improved ABC called (MeanABC-FCM). This method used MRI images, and the outcomes show promising results in this field.
A method, fuzzy automatic clustering named AFDE for image segmentation problem was proposed by [31]. Relevantly, Alia et al. [32] proposed a novel automatic algorithm of fuzzy clustering (DC) by the hybrid harmony search HS with FCM to produce an automatic segment method called DCHS. Further, an automatic hard clustering algorithm called DCPSO was proposed by [33–35]. While an algorithm called Fuzzy based genetic algorithm with variable string length FVGA to automatically find a fitting clusters number with the matching fuzzy clustering outcomes was proposed by [36]. A fuzzy clustering algorithm was proposed in Alomoush et al. [37] using a combination of a firefly optimizer with an FCM algorithm named FFCM [38]. In Agbaje et al. [26] an automatic data clustering method was proposed based on improved FA algorithm combined with the Particle Swarm Optimization (PSO) algorithm.
This paper proposes an automatic fuzzy clustering approach based on mean artificial bee colony called (AC-MeanABC). The proposed method uses the (MeanABC) algorithm to determine the appreciate cluster number and initial location of centroids. The method modifies the search equation depending on mean previous and global best solutions to reach the best balance between exploration and exploitation. The remaining portions of the paper are as follows. The type 2 fuzzy set is described in Section 2, related background on the employed techniques are presented in Sections 4 and 5. The proposed method is presented in Section 5, and Section 6 presents the experiments and results, wherein Section 7 concludes the paper.
FCM is an unsupervised method that can identically partite objectives based on the similarity attribute, which tends to increase the similarities of entities within the same set and decrease the similarities of entities within different sets [2,39]. The objective function defined by FCM is reformulated using type 2 fuzzy set as in Eq. (1) below.
3 The Artificial Bee Colony (ABC)
A standard ABC algorithm was proposed in Karaboga et al. [13] and this algorithm was inspired by the life of bee swarm. The bees in ABC are divided into three kinds: the employed bees focus on seeking sources of food and transmitting their search information to the onlookers. Meanwhile, the onlooker bees retain more searches to achieve better solutions depending on the quality of the discovered food sources. A source of food in the flock is a possible solution, and the amount of nectar determines their fitness values. The ABC algorithm randomly initializes the source of food as in Eq. (5).
where (
where:
That onlooker selects solutions with certainty. This certainty means that correlation exists between the fitness value of a source of food and the bees employed. The probability of fitness is as in Eq. (8).
In this regard, when several trials of the solution are not changing, the “limit,” is reached, and employee bees are converted to scout bees to abandon their solutions. Accordingly, Eq. (5) shows how the scout bees start new searches and solutions randomly until they reached the criterion of termination.
4 The Mean Artificial Bee Colony (MeanABC)
The ABC has some disadvantages in terms of unbalanced search behaviour, and this has become a common limitation with other optimization algorithms. The authors used an improved ABC based mean global best (MeanABC) [23] to solve these disadvantages. In Alrosan et al. [23] an improved ABC algorithm called MeanABC was proposed, and this algorithm presents a unique modified search formula for the bee phase employed based on the knowledge about the best candidates to produce a new neighbourhood source of food as in Eq. (9)
where xi, j would be the first expression for the present position,
The second concerns with switching the present mean position value of (pbest), which is the positive way of own best position and the (–gbest) negative way of the best global position.
Based on the above:
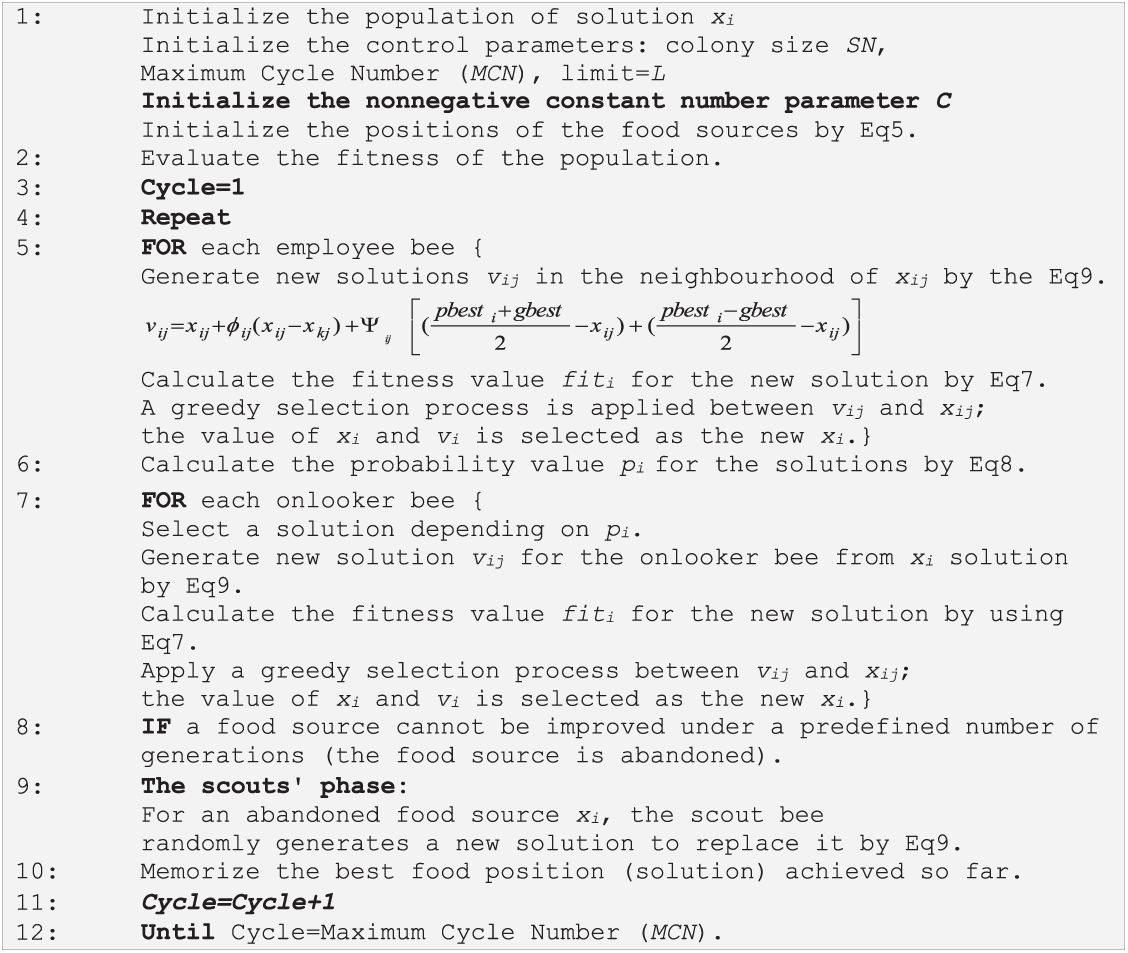
Figure 1: The pseudo-code of MeanABC algorithm
5 The Proposed Method (AC-MeanABC)
AC-MeanABC is an unsupervised data clustering method that employs the ability of MeanABC to seek the best solution that comprises a set number of clusters and centroids’ location. The pseudo-code for AC-MeanABC algorithm is available in Fig. 2. The steps of AC-MeanABC are described as follows.
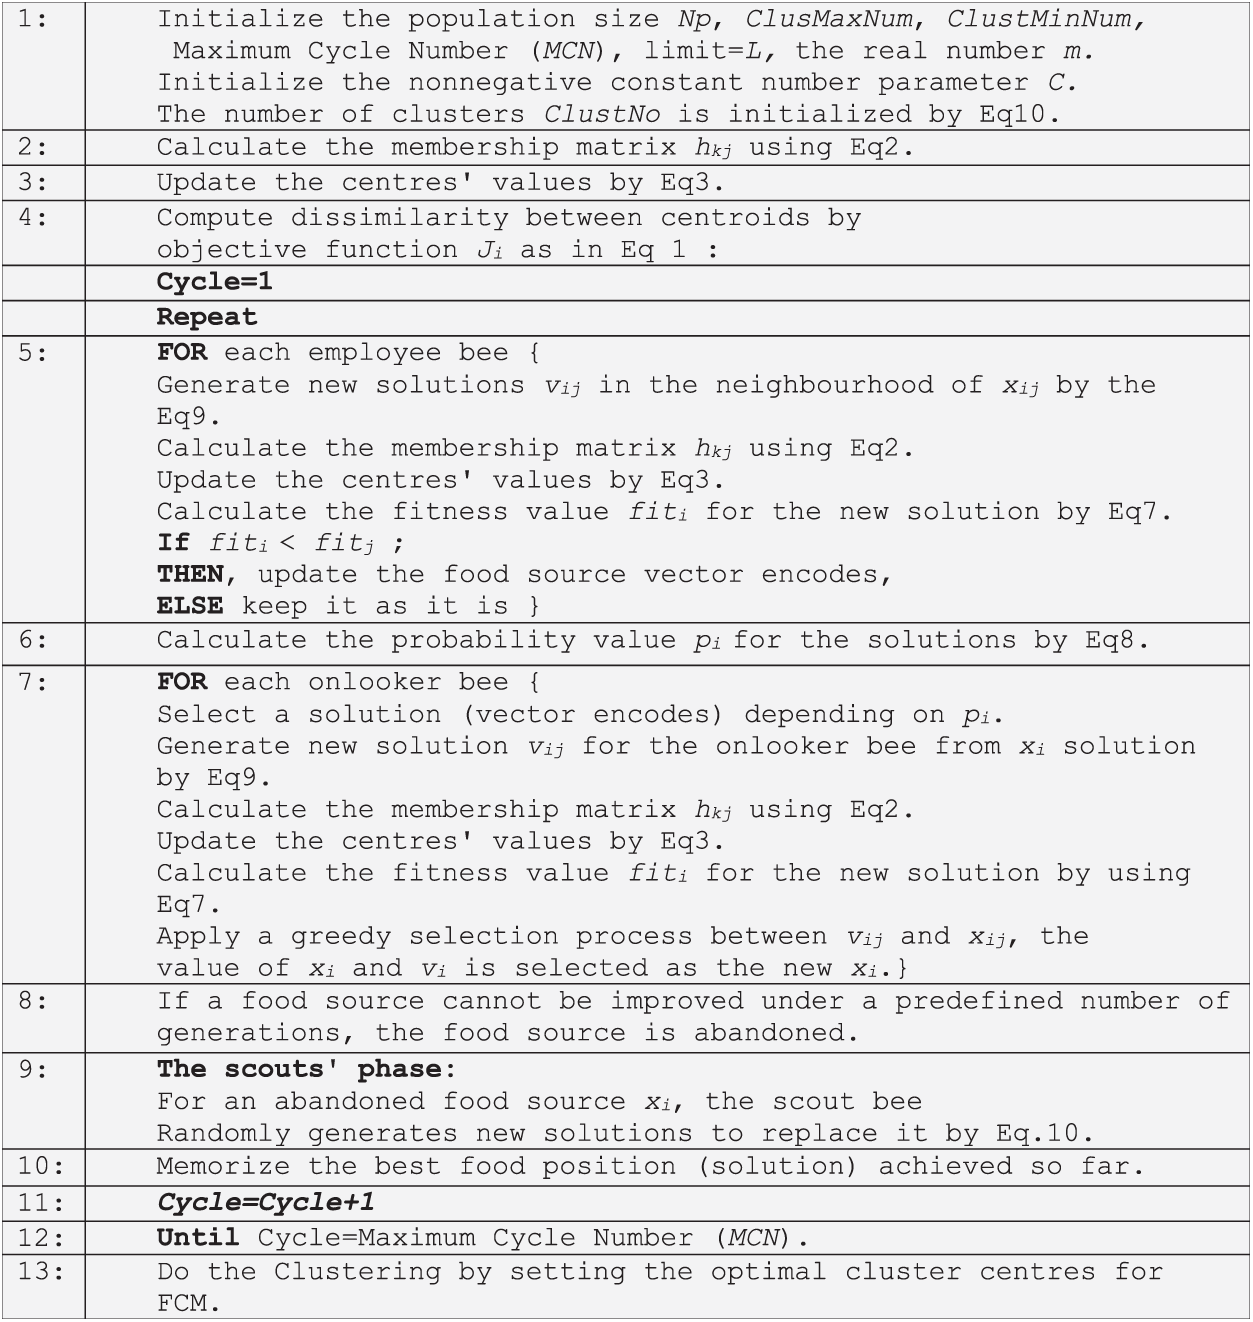
Figure 2: The pseudo-code of AC-MeanABC algorithm
The AC-MeanABC algorithm begins by initializing the Np food sources. Each food source Np represents a vector that encodes the cluster number and centroid. Each Np food sources’ vector length can change based on the randomly generated number of clusters for each vector. Also, the Np size range (number of clusters) depends on the dataset. Each Np vector encodes several clusters, denoted by ‘ClustNo,’ which is the number of Np vector encode between the maximum number of clusters (ClusMaxNum) and the minimum number of clusters (ClustMinNum). The food source initialization initializes the number of clusters and centroids value in MeanABC as in Eq. (10).
The values of ClusMaxNum and ClustMinNum are chosen based on the images used for segmentation. In this regard, the length of the vector is allowed to change if ClustNo is changed. Additionally, each length of a vector in Np must reach to highest clusters number (ClusMaxNum). Thus, for a matrix representation, it consists of d-dimensional space and the Np vector length (ClusMaxNum,d), where d represents the centroid locations. In case the vector number of clusters is less than ClusMaxNum, the vector is taken by centroids in random locations, while the rest of unused vector elements are represented as don’t care ‘#’ sign [32,40]. To clarify the ‘don’t care’ elements, let
This phase of AC-MeanABC clustering algorithm includes finding the best Np vector with the optimal number of clusters and centroid locations. To update the Np vector value, the new food source position is calculated using previously mentioned Eq. (9) in section (4).
Here,
In the onlooker bee stage, each onlooker selects a source of food with a probability determined by the amount of nectar (fit) from a source of food exchanged by employed bees. As in Eq. (8), the probability is determined. When the probability for fiti of the vector encodes is high, the food source is selected. Else, the vector will be considered as don’t care ‘#’ solution. After the employed bee phase and a food source have been chosen, a neighbour source vi is calculated by Eq. (9), and its f(x) is calculated. Then, the process of greedy is used between vi and xi.
When trials of solutions are not changing, and it reached to “limit,” employee bees become scout bees and abandon their solutions. Here, is where, the scout bees begin new searches and solutions, randomly via Eq. (10). These aspects are iterated until the criterion of termination has been reached.
5.5 Solutions Evaluation and Clustering
The degree of appropriateness or goodness is measured by its fitness value of each MeanABC solution. Each data is allocated to one or more clusters by using the fuzzy membership categories. These fuzzy membership values are determined using the fuzzy membership equation. Consequently, a cluster validity index is used as an indicator for the appropriateness of the clustering. This index is typically exercised to establish the quality of different solutions obtained using different settings in a particular clustering algorithm (or for solutions given by different algorithms).
In this paper, the cluster validity index of VI is used for the appropriateness of the clustering [35]. The VI index is presented as follows:
where s is a constant number, and
Eqs. (13) and (14) represent these intra clusters and the inter-cluster.
where Np is the number of patterns in a dataset, Zp is a pattern in the cluster, while mk, and cn is the kth centroids of the cluster and the number of clusters.
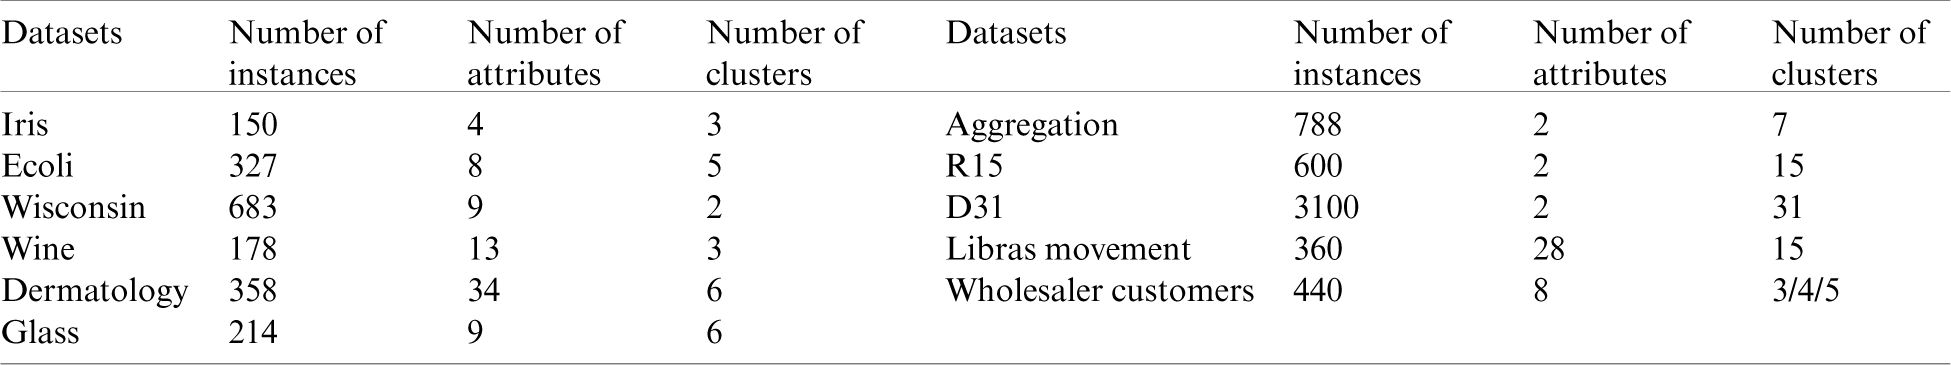
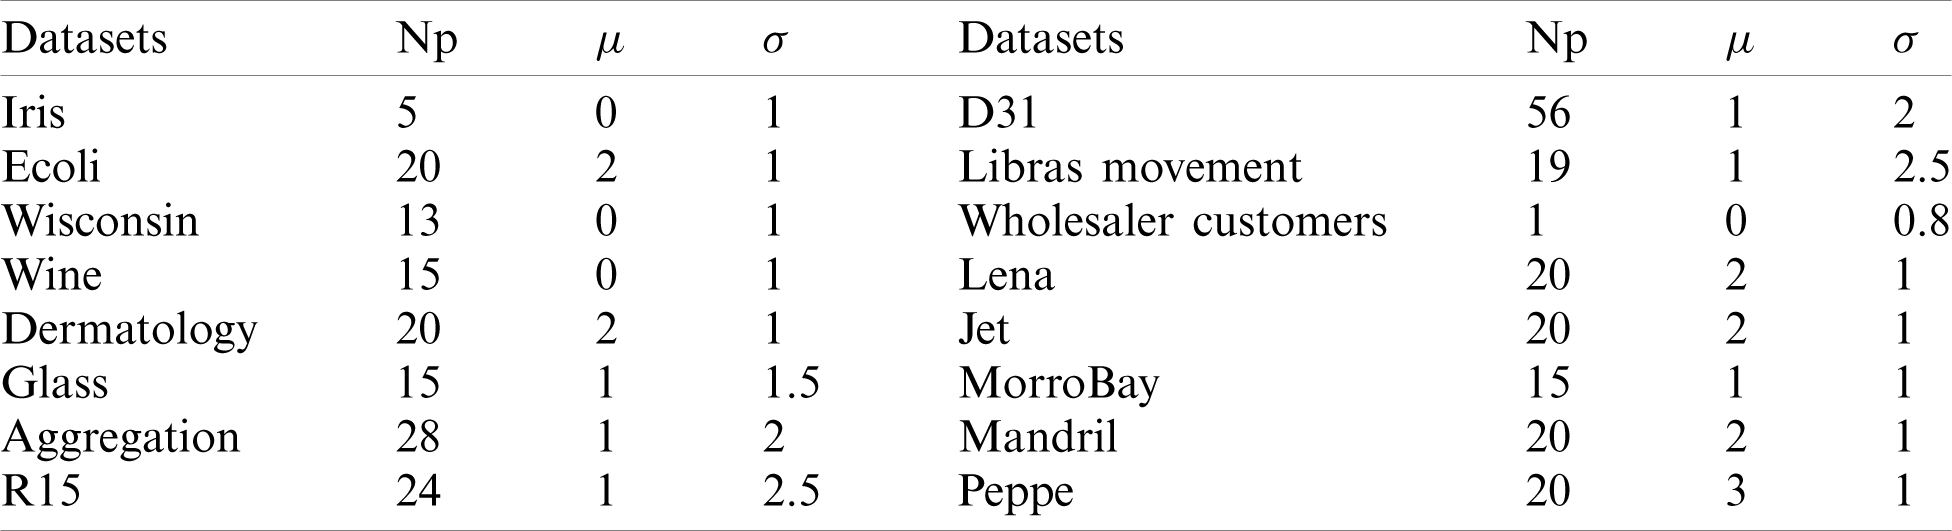
The AC-MeanABC fuzzy clustering algorithm is conducted as a fully automatic data clustering to find the number of clusters in datasets. The experiments and results are represented in three parts. Firstly, the AC-MeanABC parameters setting and the most appropriate values are chosen. Secondly, AC-MeanABC is conducted on 11 benchmark clustering datasets selected from the UCI databases such as Iris, Ecoli, Wisconsin, Wine, Dermatology, Glass, Aggregation, R15, D31, Libras movement and Wholesaler customers. Some details about these datasets are given in Tab. 1.
Table 1: Clustering datasets details
The third part includes AC-MeanABC being conducted with five natural images obtained from the Berkeley1 dataset [30,41] such as Lena, Jet, MorroBay, Mandril, and Pepper. All-natural images have the size is
6.1 AC-MeanABC Parameters Setting
To obtain the best outcomes from any clustering optimization algorithm, the suitable selection of parameters is critical because these parameters are essential in the algorithm’s performance and accuracy. To determine the values of parameters of AC-MeanABC (i.e., Population size SN, limit, maximum cycle number (MCN), nonnegative constant parameter (C), and Termination criterion TC) have to be determined. The values of these parameters were set in Tab. 2 based on related works [3,30]. In Tab. 3, other relevant parameters to the dataset, such as the maximum number of clusters Np,
Table 2: AC-MeanABC parameters settings
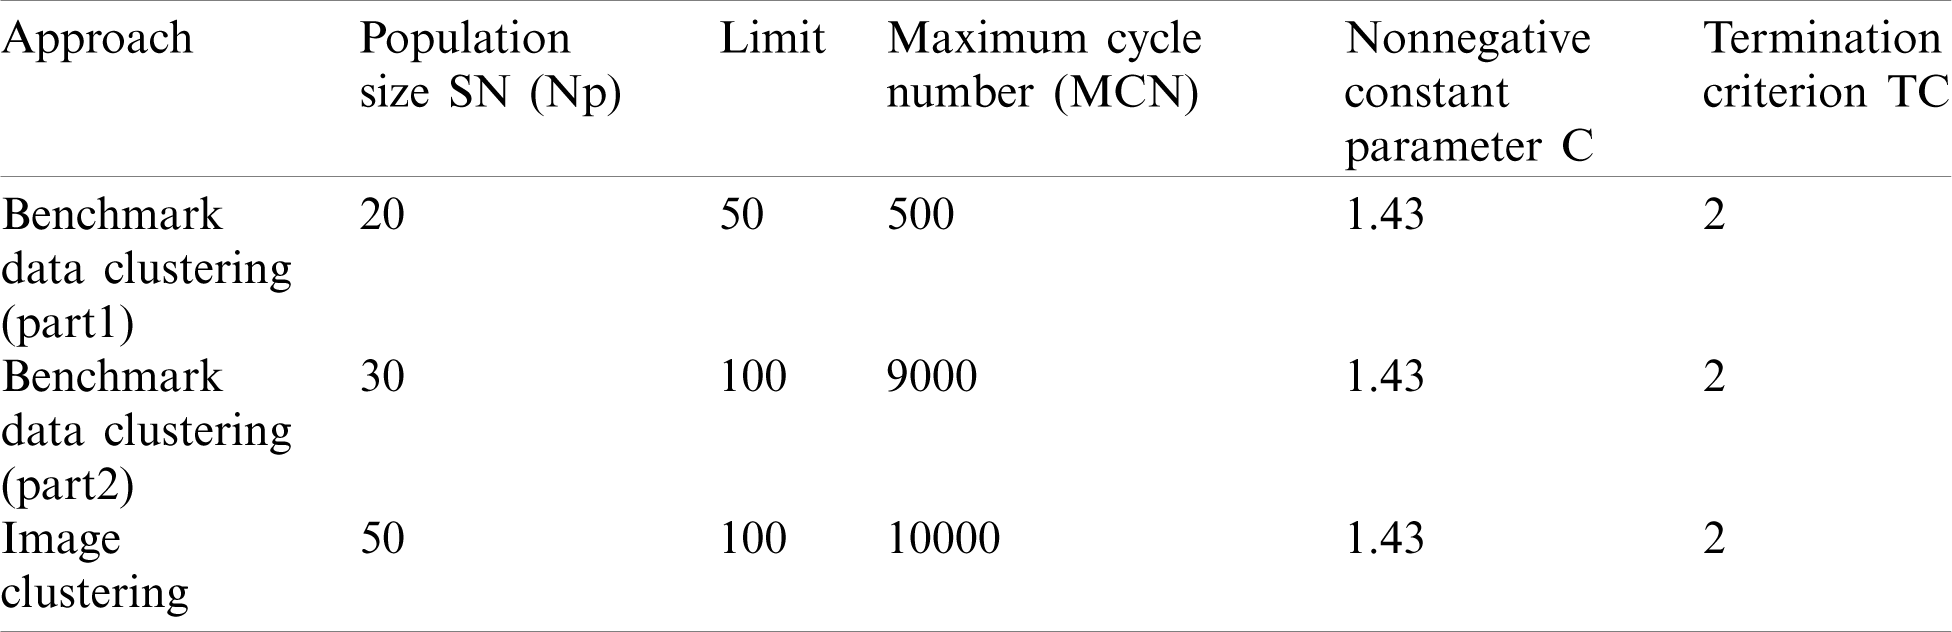
Table 3: Other parameters settings
6.2 Benchmark Clustering Datasets
In this experiment, AC-MeanABC was performed with 11 benchmark clustering datasets, which were chosen from the UCI database. The benchmark datasets were divided into two parts, whereby part1 of the benchmark datasets included Glass, Aggregation, R15, D31, Libras movement and wholesaler customers, while part2 of the benchmark datasets included Iris, Ecoli, Wisconsin, Wine and Dermatology.
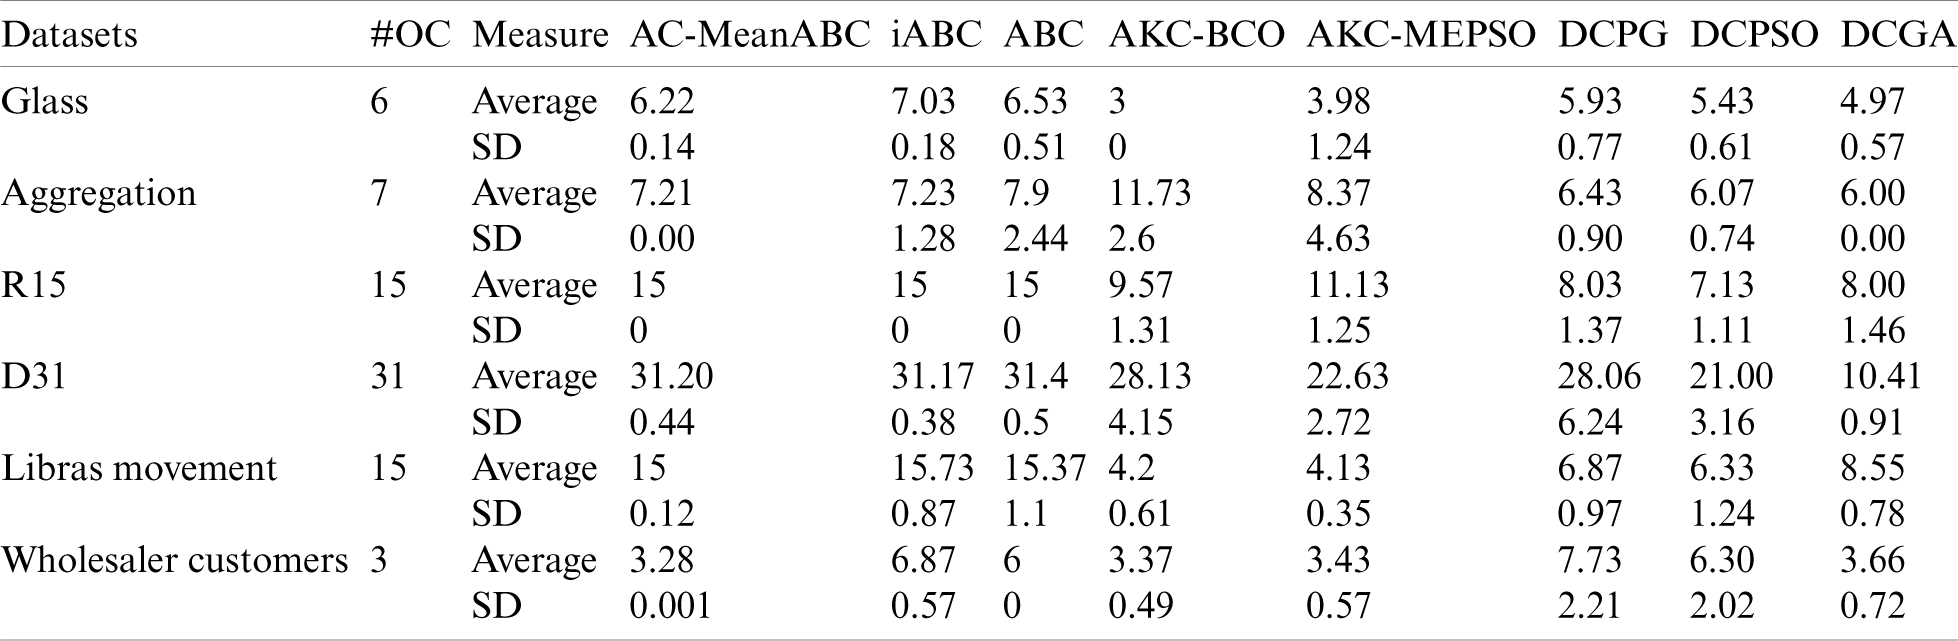
In this part, the AC-MeanABC outcomes were compared with the standard ABC algorithm and other related works such as iABC, AKCBCO, AKC-MEPSO, DCPG, DCPSO and DCGA [3,42,43]. The parameter settings for AC-MeanABC algorithm were selected as in Tabs. 2 and 3 based on the same parameter setting in [3]. Accordingly, Tabs. 4 and 5 illustrate these benchmark data clustering, the results of VI index, and their optimal cluster numbers (# OC). Tab. 4 shows that AC-MeanABC outperforms other related works in minimizing the VI index in most of the outcomes, where iABC outperforms AC-MeanABC in R15 and D31. Additionally, Tab. 5 indicates that AC-MeanABC exceeds other state-of-the-art methods in finding the optimal number of clusters for Glass, Aggregation, R15, Libras movement and wholesaler customers, while iABC outperforms AC-MeanABC in D31.
Table 4: Benchmark data clustering part1 outcomes of VI index
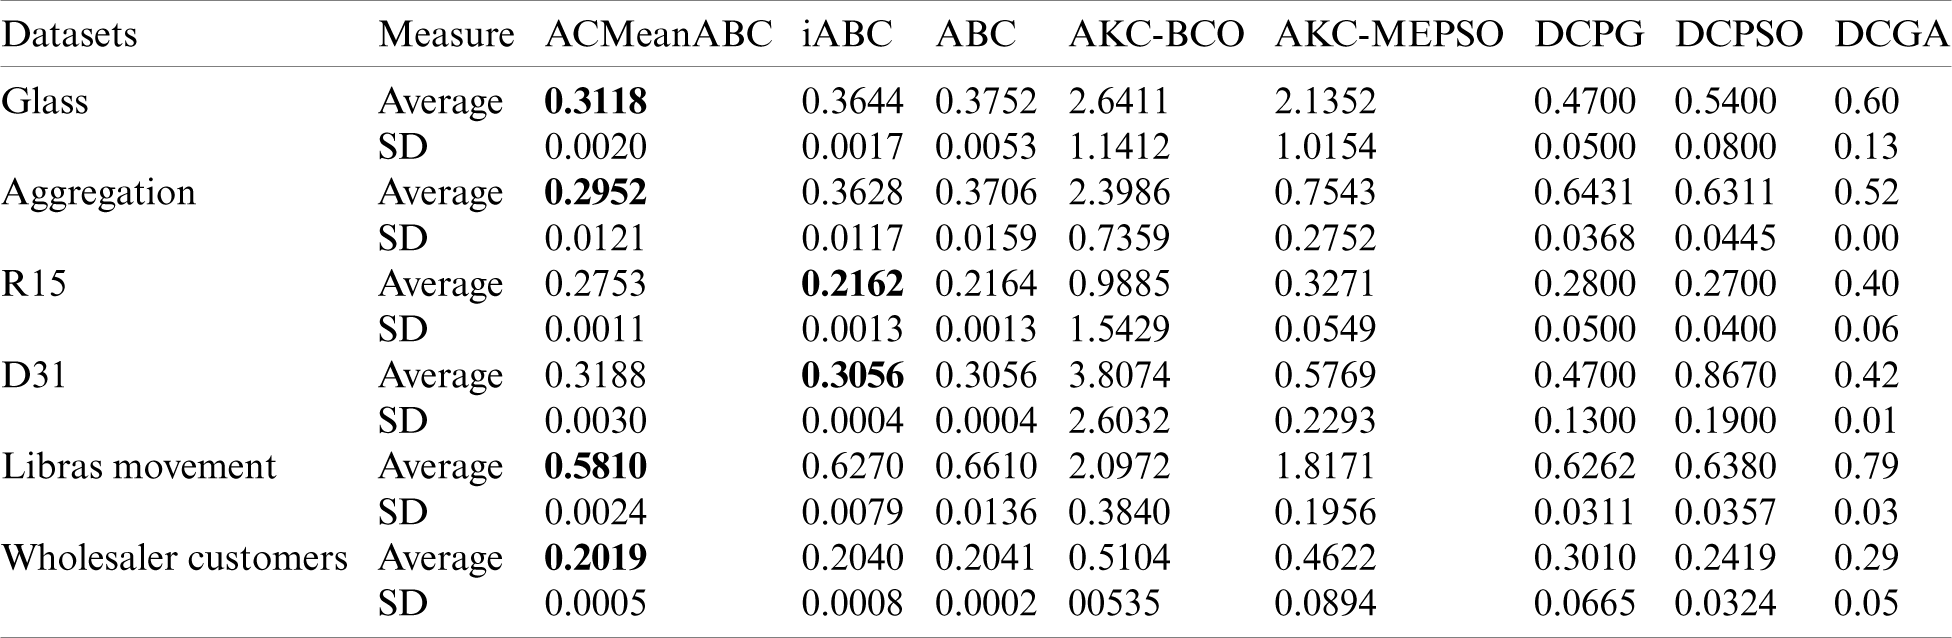
Table 5: Benchmark data clustering part1 outcomes of clusters number
In Tab. 6, the Friedman test was carried out and the results were used in comparing the performance of AC-MeanABC and other related works. As shown, the proposed algorithm outperforms all comparable methods in Tab. 6. The box whisker for the results of clustering algorithms in Tab. 4 is displayed in Fig. 3.
Table 6: Mean ranks obtained by Friedman test for the clustering algorithms outcomes in Tab. 4
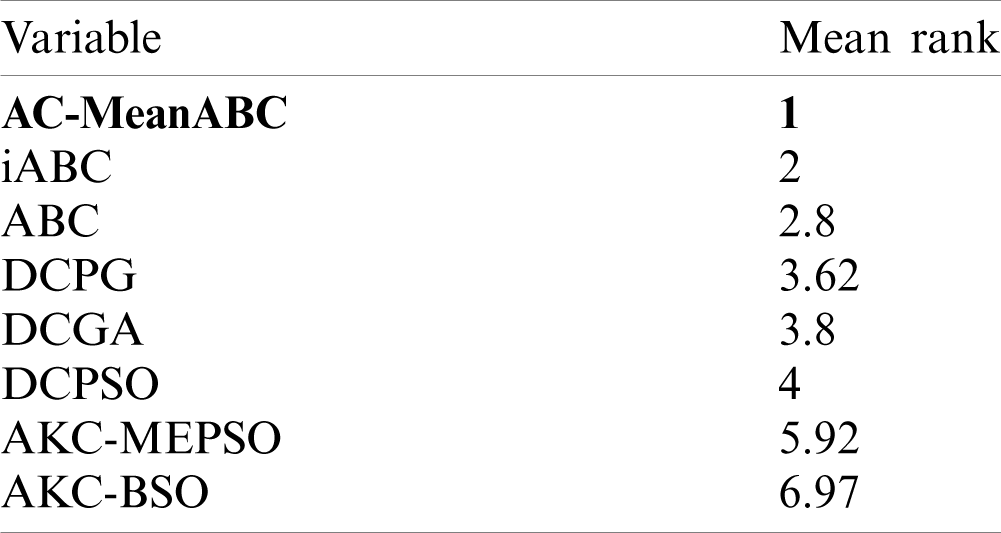
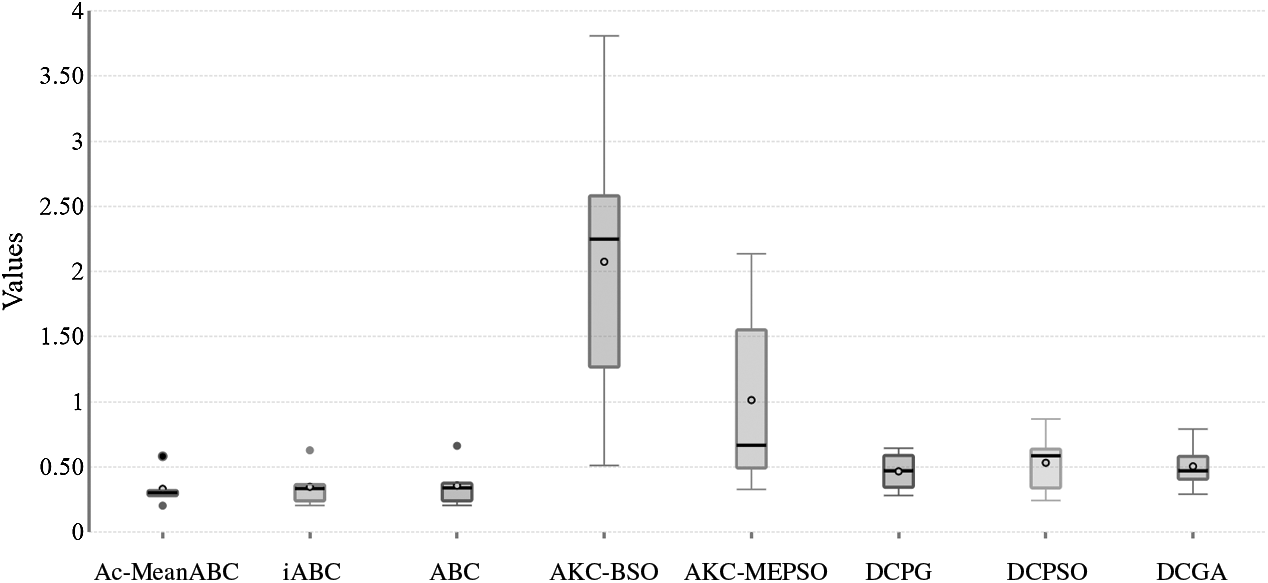
Figure 3: Box-whisker to present the outcomes of five clustering algorithms in Tab. 4
In this part, the AC-MeanABC outcomes were compared with other related works such as discrete binary artificial bee colony DisABC, GA based clustering algorithms, improved discrete binary artificial bee colony IDisABC [28] and dynamic clustering based particle swarm optimization DCPSO [33]. The parameter settings for DC-MeanABC algorithm were selected as in Tabs. 2 and 3 based on the same parameter setting in [28].
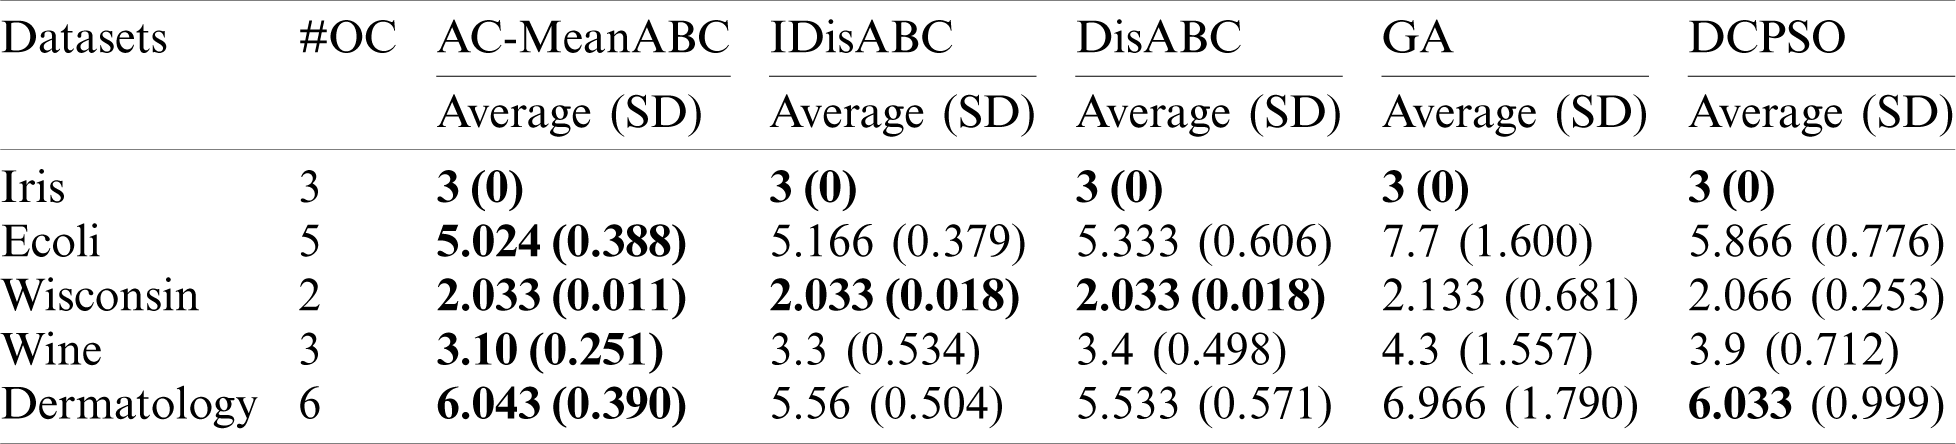
Tabs. 7 and 8 illustrate these benchmark data clustering, the results of VI index, and their optimal cluster numbers (# OC). Tab. 7 shows that AC-MeanABC outperforms other related works in minimizing the VI index in all outcomes. Additionally, Tab. 8 indicates that AC-MeanABC exceeds other state-of-the-art methods in finding the optimal number of clusters for Ecoli and Wine datasets. In the rest of the three cases, all approaches reached an optimal number of clusters in the Iris dataset. Further, AC-MeanABC, IDisABC, and DisABC obtained the same outcomes in Wisconsin dataset with a preference for AC-MeanABC in standard deviation value. In the Dermatology dataset, DCPSO and AC-MeanABC are very close in terms of result to find the best number of clusters. Still, the DCPSO standard deviation value is much higher than that of AC-MeanABC.
Table 7: Benchmark data clustering part2 outcomes of VI index
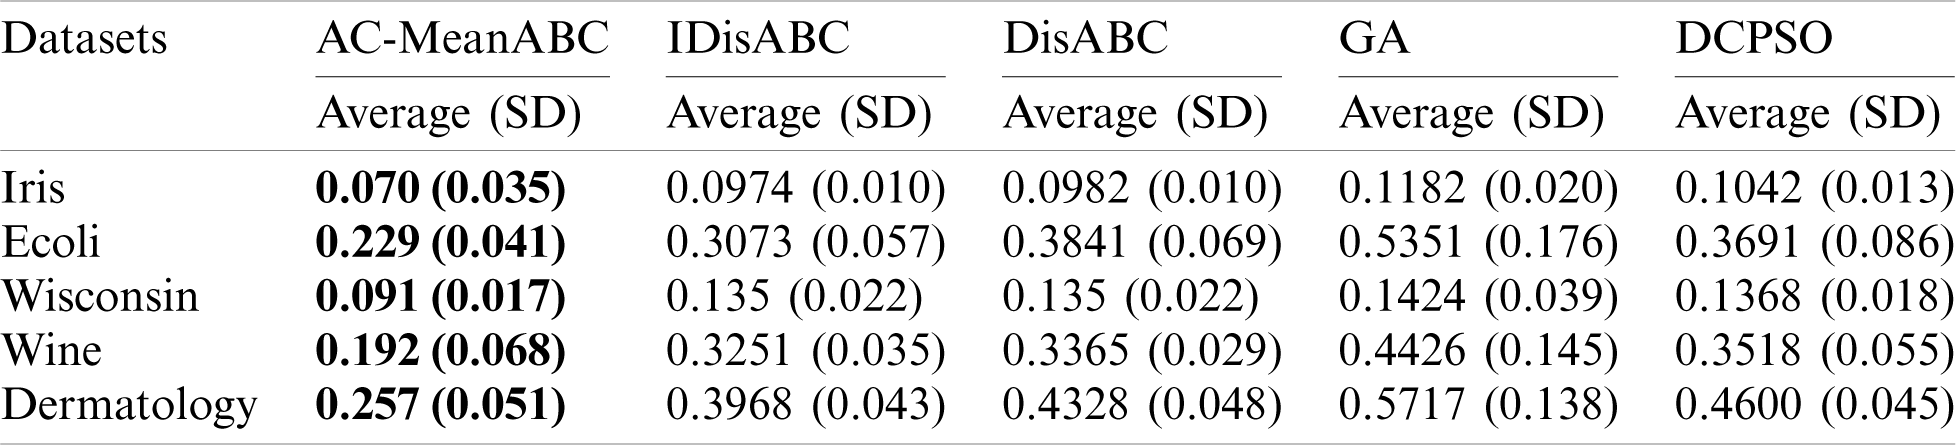
Table 8: Benchmark data clustering part2 outcomes of clusters number
To show the significance of improvement of the AC-MeanABC, Friedman test was performed and the results are shown in Tab. 9. As shown clearly, the mean ranking value of AC-MeanABC is higher than that of IDisABC, DisABC, DCPSO and GA. where the best value is the minimum value and it’s represented in bold. Also, Fig. 4 represents the box whisker for the results of five clustering algorithms as in Tab. 7.
Table 9: Mean ranks obtained by Friedman test for the five clustering algorithms outcomes in Tab. 7
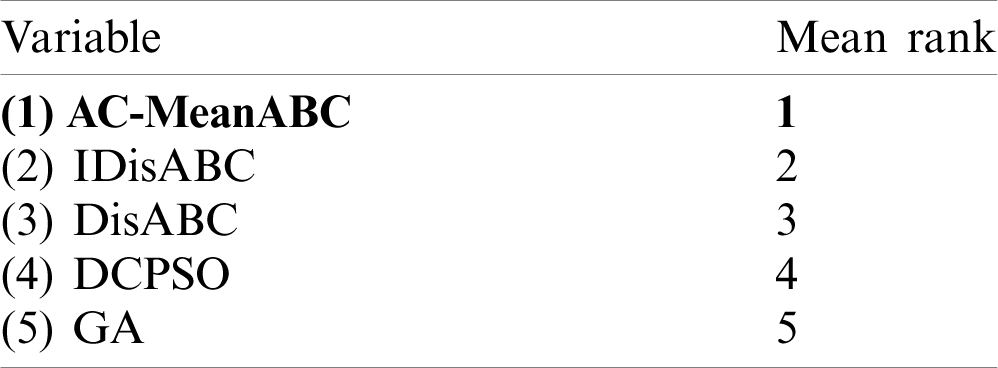
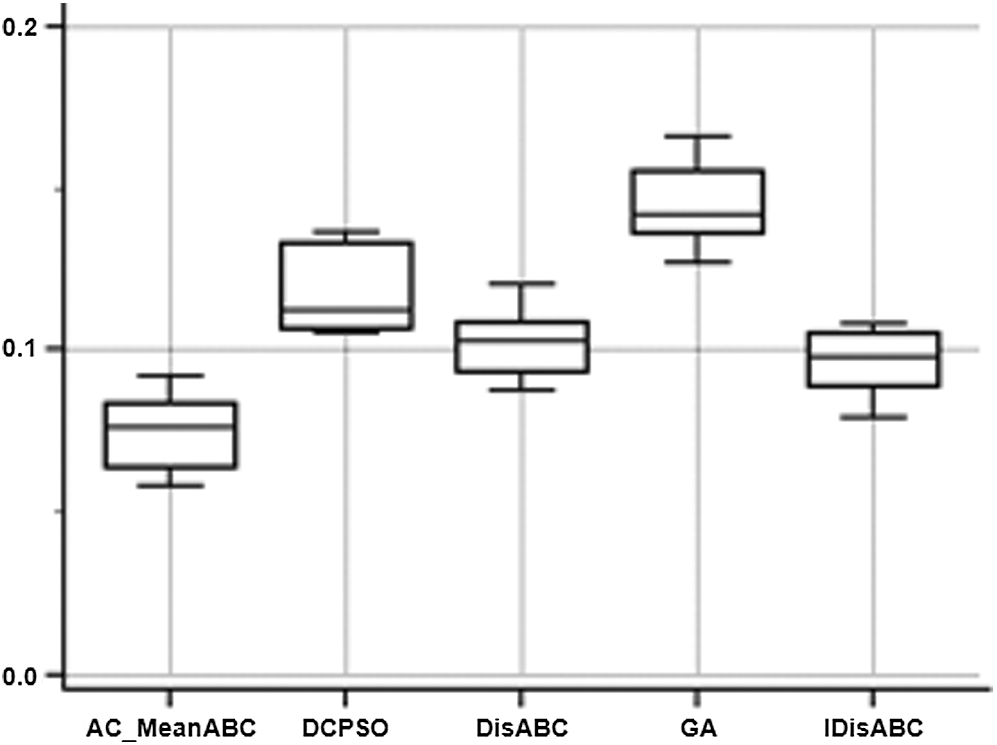
Figure 4: Box-whisker to present the outcomes of five clustering algorithms in Tab. 7
In this experiment, five natural images were obtained from the Berkeley1 segmentation dataset [30,41] such as Lena, Jet plane, MorroBay, Mandril, and Pepper images. In this experiment, the AC-MeanABC outcomes were compared with other related works such as discrete binary artificial bee colony DisABC, GA based clustering algorithms, and improved discrete binary of ABC called IDisABC [30] and dynamic clustering based PSO that is called DCPSO [35]. The parameter settings for AC-MeanABC algorithm were selected based on the same parameters settings in [30], as in Tabs. 2 and 3.
Tabs. 10 and 11 illustrate these natural images, the VI index results, and the corresponding cluster numbers from ground truth image (# AC). Tab. 10 shows that AC-MeanABC outperforms other related works in minimizing the VI index in all cases. Tab. 11 shows the number of clusters that are determined automatically using algorithm AC-MeanABC and other state-of-the-art methods. Tab. 8 shows that AC-MeanABC-FCM outperforms other related works in finding the optimal number of clusters for Lena, Jet plane, MorroBay, and Pepper images. In contrast, the IDisABC approach outperforms AC-MeanABC and other approaches in finding the optimal number of clusters for the Mandrill image, but AC-MeanABC-FCM and IDisABC are very close in terms of the result of Mandrill image. Figs. 5a, 6a, 7a, 8a and 9a show the original image of MorroBay, Lena, Mandrill, Jet plane and Pepper, where Figs. 5b, 6b, 7b, 8b and 9b show the clustering images by AC-MeanABC of MorroBay, Lena, Mandrill, Jet plane and Pepper images.
Table 10: Natural image clustering outcomes of VI index
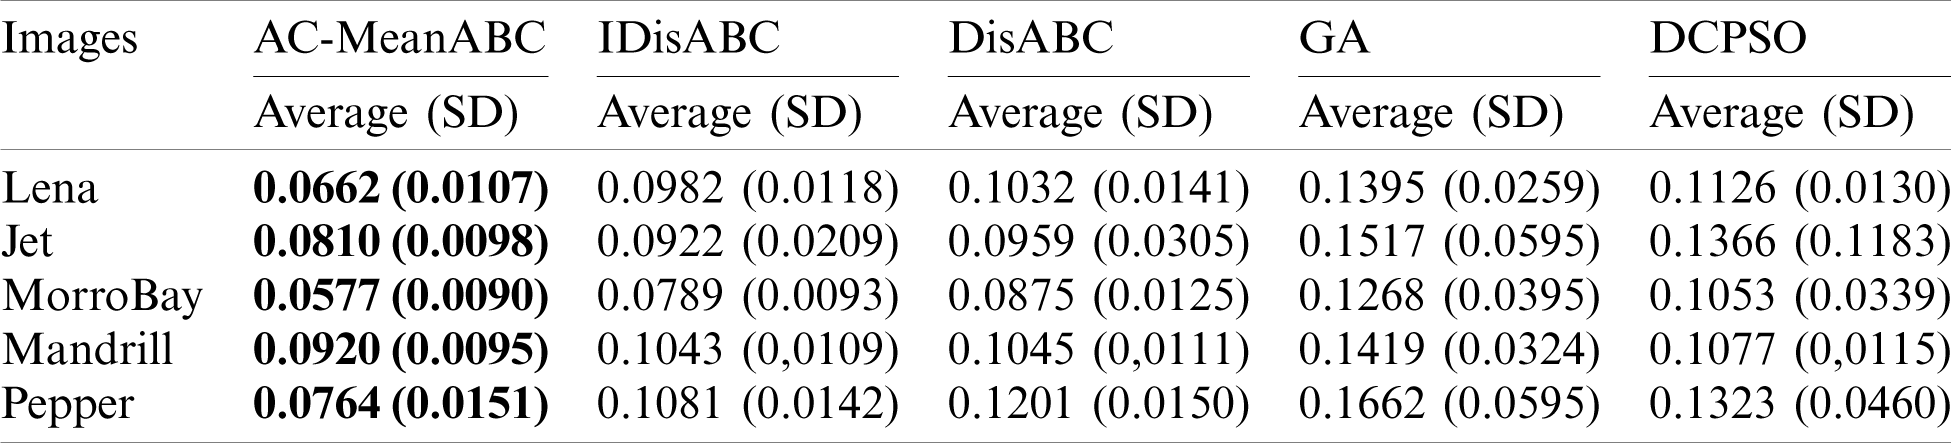
Table 11: Obtained number of clusters for natural image by clustering approaches
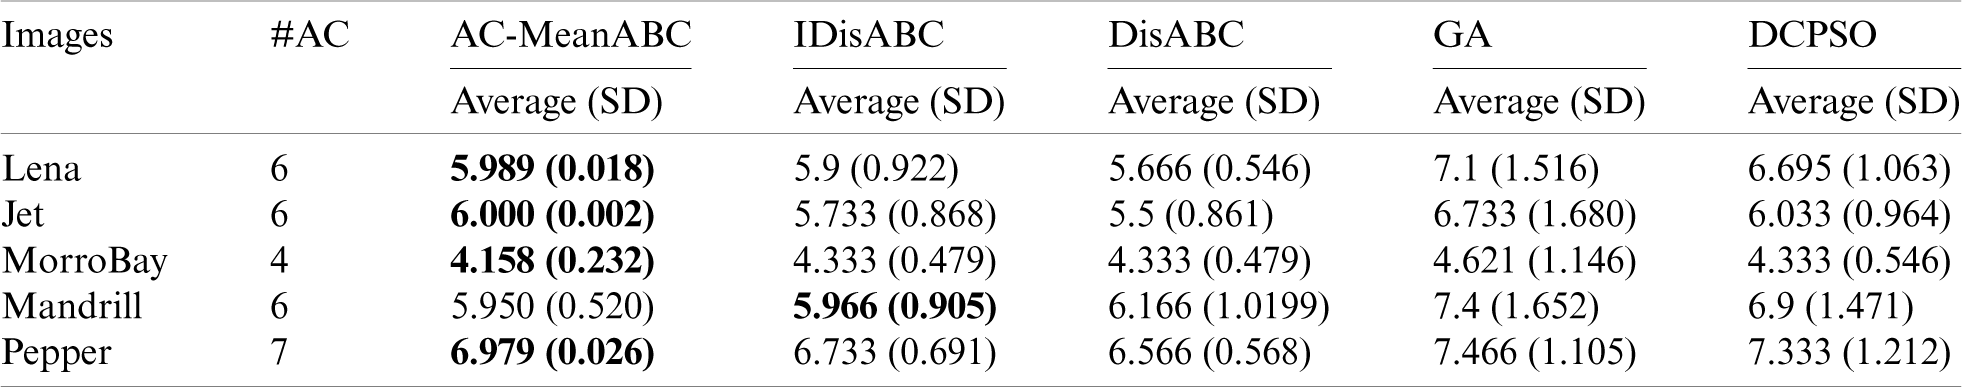
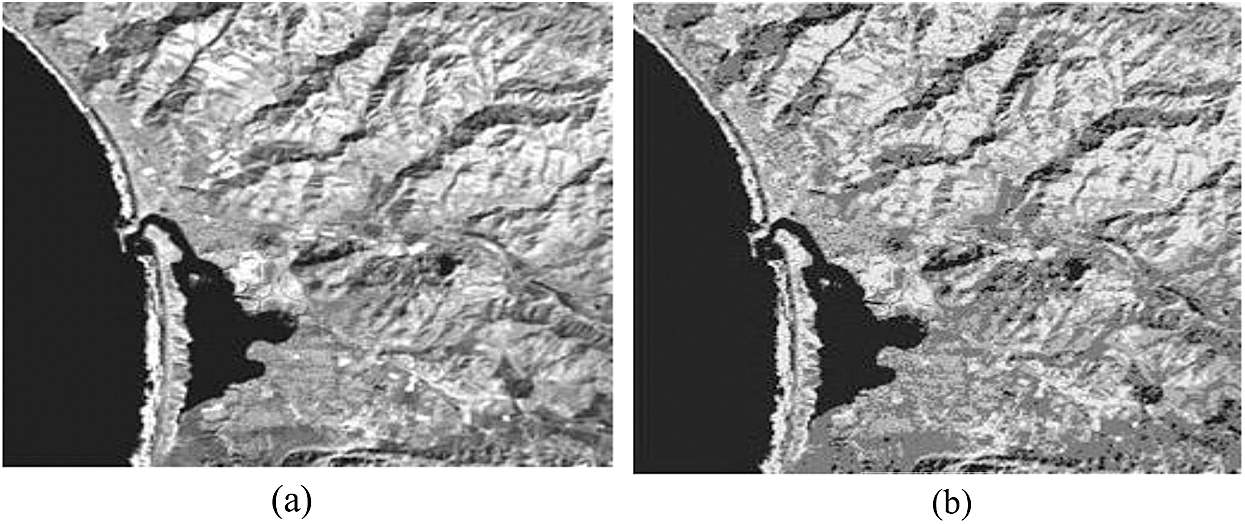
Figure 5: (a) Original MorroBay and (b) segmented MorroBay by DC-MeanAB
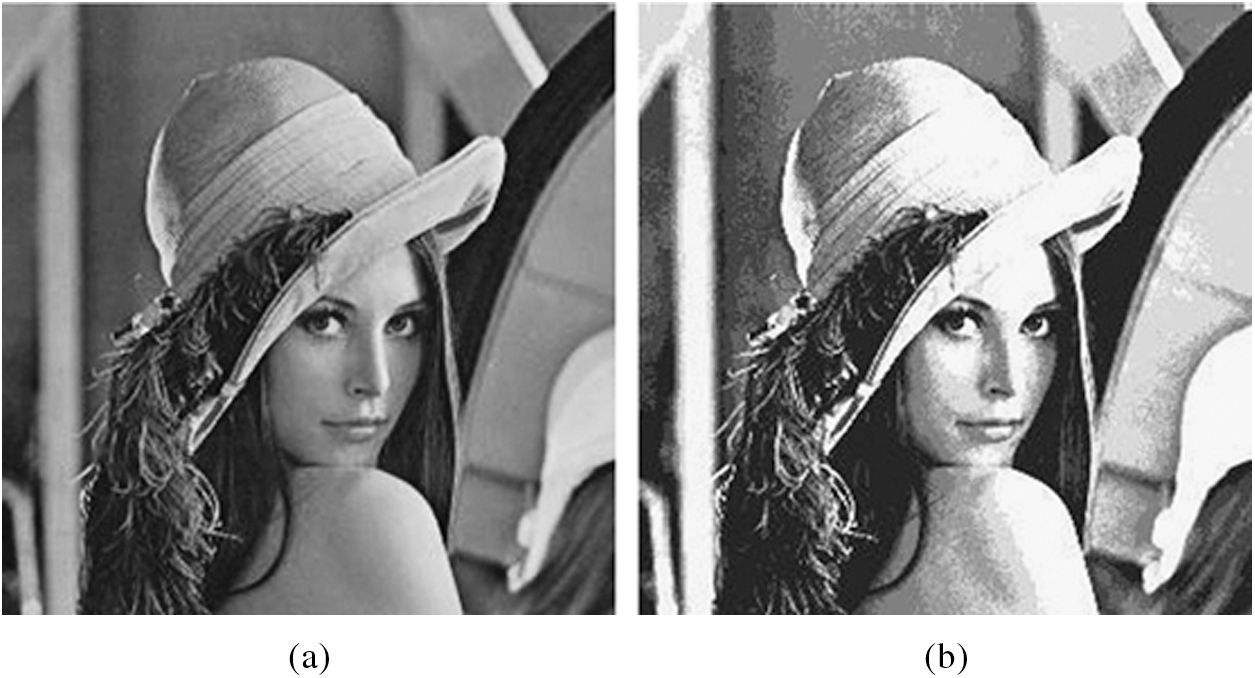
Figure 6: (a) Original Lena and (b) segmented Lena by (AC-MeanABC)
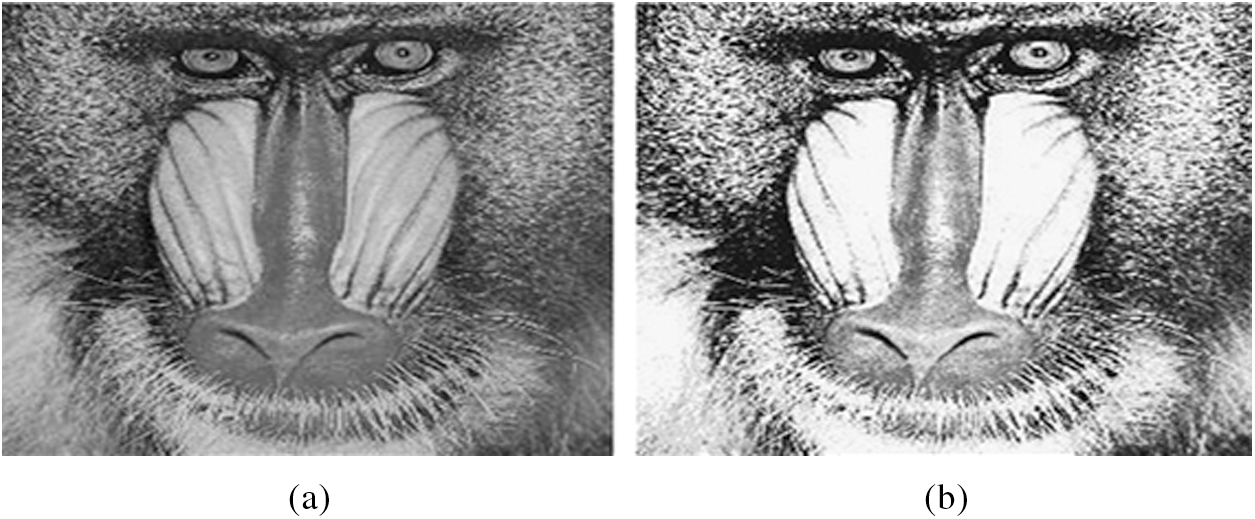
Figure 7: (a) Original mandrill and (b) segmented mandrill by (AC-MeanABC)
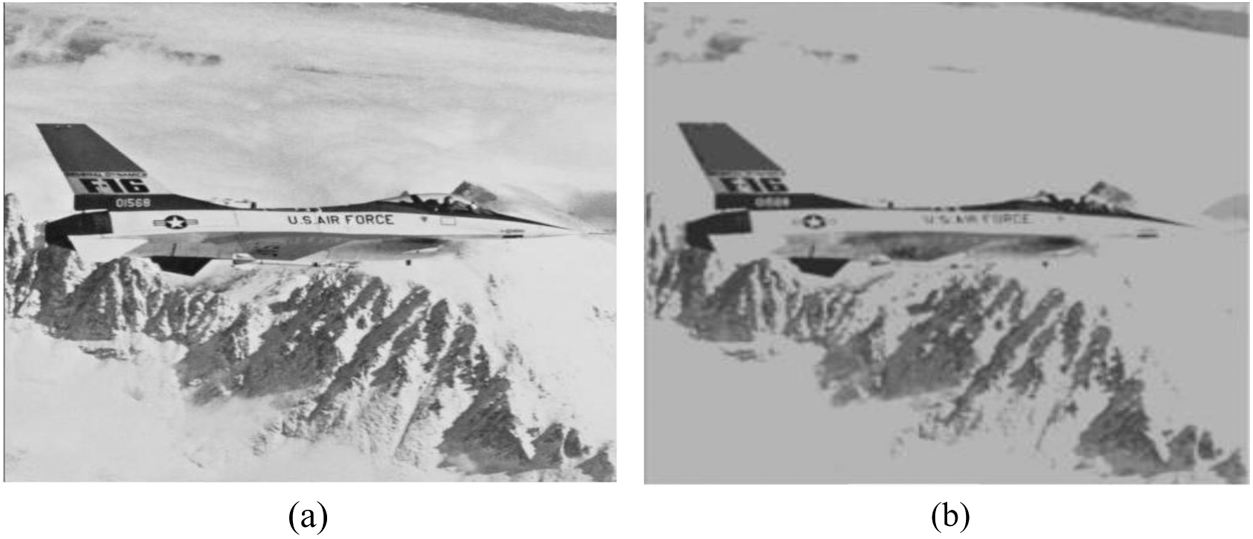
Figure 8: (a) Original jet and (b) segmented jet by (AC-MeanABC)
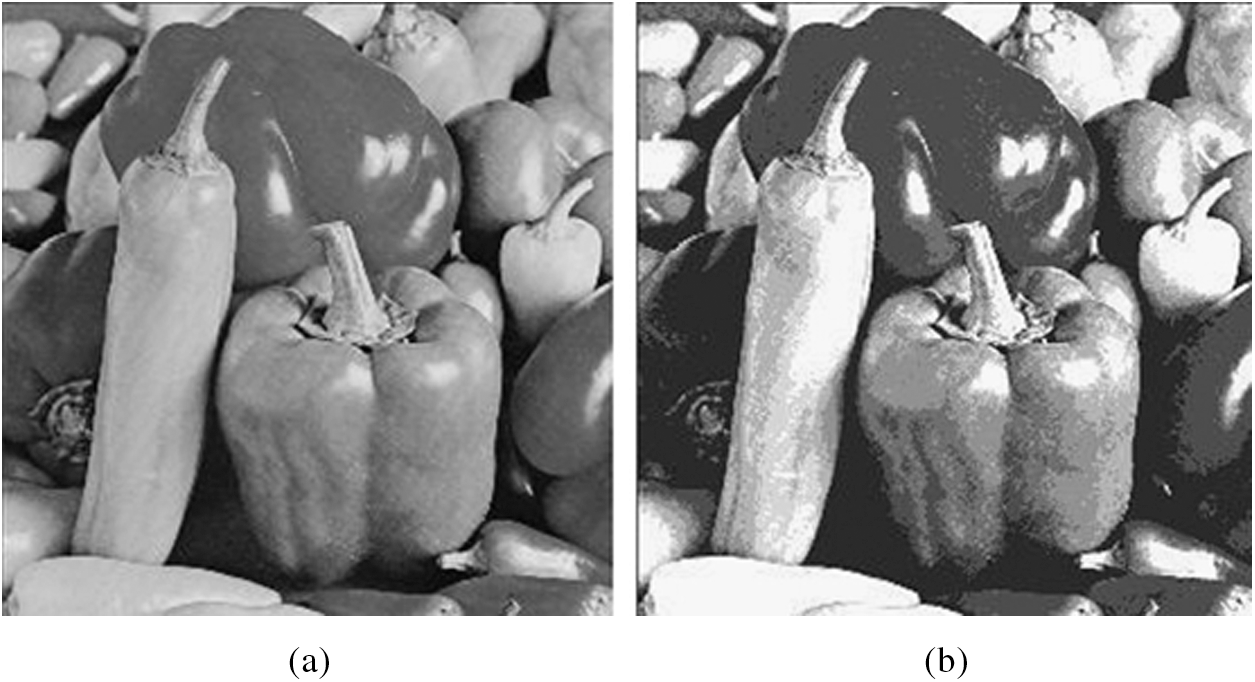
Figure 9: (a) Original pepper and (b) segmented pepper by (AC-MeanABC)
In Tab. 12, the Friedman test was carried out to compare the performance between the proposed algorithm and other related works. As shown, AC-MeanABC outperforms IDisABC, DisABC, DCPSO and GA and the best value is presented in bold; the best value is considered the minimum value of all clustering algorithms in Tab. 9. The box whisker for the results of five clustering algorithms in Tab. 10 is displayed in Fig. 10.
Table 12: Mean ranks obtained by Friedman test for the five clustering algorithms outcomes in Tab. 10

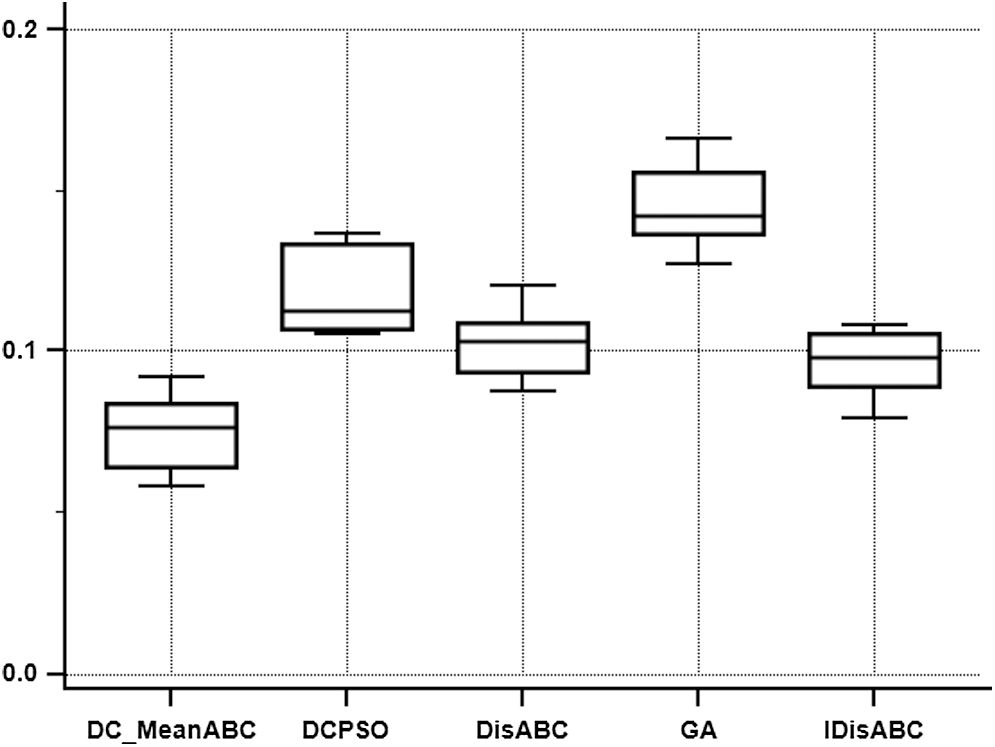
Figure 10: Box-whisker to present the outcomes of five clustering algorithms in Tab. 10
In this paper, the automatic fuzzy clustering based on the MeanABC search method called AC-MeanABC was proposed to solve the challenges of determining the number of clusters (region) and cluster centroids. AC-MeanABC clustering method used the capability of the MeanABC algorithm to explore the search space in positive and negative directions to search for the near-optimal number of clusters and centroids values. The experiments and results were obtained using 11 benchmark datasets and 5 natural images. These experiments compared the AC-MeanABC with other clustering methods such as iABC, ABC, AKCBCO, AKC-MEPSO, DCPG, DCGA IDisABC, DisABC, DCPSO, and GA. In conclusion, the clustering results of the AC-MeanABC are better than those of the state-of-the-art techniques in determining the optimal number of clusters and the value of validity index VI.
Acknowledgement: Thanks to our families & colleagues who supported us morally.
Funding Statement: This research was supported by the Research Management Center, Xiamen University Malaysia under XMUM Research Program Cycle 4 (Grant No: XMUMRF/2019-C4/IECE/0012).
Conflicts of Interest: The authors declare that they have no conflicts of interest to report regarding the present study.
1. A. Bose and K. Mali, “Fuzzy-based artificial bee colony optimization for gray image segmentation,” Signal Image and Video Processing, vol. 10, no. 6, pp. 1–8, 2016. [Google Scholar]
2. J. Nayak, B. Naik and H. Behera, “Fuzzy c-means (FCM) clustering algorithm: A decade review from 2000 to 2014,” Computational Intelligence in Data Mining, vol. 2, pp. 133–149, 2015. [Google Scholar]
3. R. Kuo and F. E. Zulvia, “Automatic clustering using an improved artificial bee colony optimization for customer segmentation,” Knowledge and Information Systems, vol. 57, no. 2, pp. 331–357, 2018. [Google Scholar]
4. A. K. Jain, “Data clustering: 50 years beyond k-means,” Pattern Recognition Letters, vol. 31, no. 8, pp. 651–666, 2010. [Google Scholar]
5. A. E. Ezugwu, “Nature-inspired metaheuristic techniques for automatic clustering: A survey and performance study,” SN Applied Sciences, vol. 2, no. 2, pp. 273, 2020. [Google Scholar]
6. N. Jain and V. Srivastava, “Data mining techniques: A survey paper,” IJRET International Journal of Research in Engineering and Technology, vol. 2, no. 11, pp. 2319–1163, 2013. [Google Scholar]
7. H. Zhou and G. Schaefer, “An overview of fuzzy c-means based image clustering algorithms,” Foundations of Computational Intelligence, vol. 2, pp. 295–310, 2009. [Google Scholar]
8. R. Kuo and F. E. Zulvia, “An improved differential evolution with cluster decomposition algorithm for automatic clustering,” Soft Computing, vol. 23, no. 18, pp. 8957–8973, 2019. [Google Scholar]
9. S. S. Nikam, “A comparative study of classification techniques in data mining algorithms,” Oriental Journal of Computer Science & Technology, vol. 8, no. 1, pp. 13–19, 2015. [Google Scholar]
10. J. C. Bezdek, “Pattern recognition with fuzzy objective function algorithms,” in Advanced Applications in Pattern Recognition, 1st ed., USA: Springer Press, pp. 1–272, 1981. [Google Scholar]
11. W. Alomoush, A. Alrosan, N. Norwawi, Y. M. Alomari, D. Albashish et al., “A survey: Challenges of image segmentation based fuzzy C-means clustering algorithm,” Journal of Theoretical & Applied Information Technology, vol. 96, no. 16, pp. 5153–5170, 2018. [Google Scholar]
12. W. Alomoush and A. Alrosan, “Metaheuristic search-based fuzzy clustering algorithms,” arXiv preprint arXiv: 1802.08729, 2018. [Google Scholar]
13. D. Karaboga and B. Basturk, “A powerful and efficient algorithm for numerical function optimization: Artificial bee colony (ABC) algorithm,” Journal of Global Optimization, vol. 39, no. 3, pp. 459–471, 2007. [Google Scholar]
14. W. A. Hussein, S. Sahran and S. N. H. Sheikh Abdullah, “The variants of the bees algorithm (BAA survey,” Artificial Intelligence Review, vol. 47, no. 3, pp. 67–121, 2017. [Google Scholar]
15. W. A. Hussein, S. Sahran and S. N. H. S. Abdullah, “A fast scheme for multilevel thresholding based on a modified bees algorithm,” Knowledge-Based Systems, vol. 101, pp. 114–134, 2016. [Google Scholar]
16. Z. W. Geem, J. H. Kim and G. V. Loganathan, “A new heuristic optimization algorithm: Harmony search,” Simulation, vol. 76, no. 2, pp. 60–68, 2001. [Google Scholar]
17. A. A. Alomoush, A. A. Alsewari, H. S. Alamri, K. Z. Zamli, W. Alomoush et al., “Modified opposition based learning to improve harmony search variants exploration,” in Int. Conf. of Reliable Information and Communication Technology, Johor, Malaysia, pp. 279–287, 2019. [Google Scholar]
18. X. S. Yang, “Firefly algorithm, stochastic test functions and design optimisation,” arXiv preprint arXiv: 1003.1409, 2010. [Google Scholar]
19. W. Alomoush, K. Omar, A. Alrosan, Y. M. Alomari, D. Albashish et al., “Firefly photinus search algorithm,” Journal of King Saud University—Computer and Information Sciences, vol. 32, no. 5, pp. 599–607, 2018. [Google Scholar]
20. X. S. Yang and S. Deb, “Cuckoo search via lévy flights,” in 2009 World Congress on Nature & Biologically Inspired Computing (NaBIC), Coimbatore, India, 210–214, 2009. [Google Scholar]
21. W. Alomoush, “Cuckoo search algorithm based dynamic parameter adjustment mechanism for solving global optimization problems,” International Journal of Applied Engineering Research, vol. 14, no. 24, pp. 4434–4440, 2019. [Google Scholar]
22. D. Karaboga and C. Ozturk, “A novel clustering approach: Artificial bee colony (ABC) algorithm,” Applied Soft Computing, vol. 11, no. 1, pp. 652–657, 2011. [Google Scholar]
23. A. Alrosan, W. Alomoush, N. Norwawi, M. Alswaitti and S. N. Makhadmeh, “An improved artificial bee colony algorithm based on mean best-guided approach for continuous optimization problems and real brain MRI images segmentation,” Neural Computing and Applications, vol. 62, no. 3, pp. 736, 2020. [Google Scholar]
24. B. A. Aldeeb, M. A. Al-Betar, A. O. Abdelmajeed, M. J. Younes, M. AlKenani et al., “A comprehensive review of uncapacitated university examination timetabling problem,” International Journal of Applied Engineering Research, vol. 14, no. 24, pp. 4524–4547, 2019. [Google Scholar]
25. M. Alauthman, A. Almomani, M. Alweshah, W. Omoushd and K. Alieyane, Machine Learning for Phishing Detection and Mitigation, Machine Learning for Computer and Cyber Security: Principle, Algorithms, and Practices, 1st ed., vol. 1. Boca Raton, Florida, USA: CRC Press, pp. 26, 2019. [Google Scholar]
26. M. B. Agbaje, A. E. Ezugwu and R. Els, “Automatic data clustering using hybrid firefly particle swarm optimization algorithm,” IEEE Access, vol. 7, pp. 184963–184984, 2019. [Google Scholar]
27. S. Ouadfel and S. Meshoul, “Handling fuzzy image clustering with a modified ABC algorithm,” International Journal of Intelligent Systems and Applications, vol. 4, no. 2, pp. 65, 2012. [Google Scholar]
28. E. Hancer, C. Ozturk and D. Karaboga, “Extraction of brain tumors from MRI images with artificial bee colony based segmentation methodology,” in 2013 8th Int. Conf. on Electrical and Electronics Engineering (ELECOBursa, Turkey, pp. 516–520, 2013. [Google Scholar]
29. A. Alrosan, N. Norwawi, W. Ismail and W. Alomoush, “Artificial bee colony based fuzzy clustering algorithms for MRI image segmentation,” in Int. Conf. on Advances in Computer Science and Electronics Engineering—CSEE, Kuala Lumpur, Malaysia, pp. 225–228, 2014. [Google Scholar]
30. C. Ozturk, E. Hancer and D. Karaboga, “Dynamic clustering with improved binary artificial bee colony algorithm,” Applied Soft Computing, vol. 28, no. 3, pp. 69–80, 2015. [Google Scholar]
31. S. Das and A. Konar, “Automatic image pixel clustering with an improved differential evolution,” Applied Soft Computing, vol. 9, no. 1, pp. 226–236, 2009. [Google Scholar]
32. O. Alia, R. Mandava and M. E. Aziz, “A hybrid harmony search algorithm for MRI brain segmentation,” Evolutionary Intelligence, vol. 4, no. 1, pp. 31–49, 2011. [Google Scholar]
33. M. G. Omran, “Particle swarm optimization methods for pattern recognition and image processing,” Ph.D. dissertation. University of Pretoria, South Africa, 2006. [Google Scholar]
34. M. G. Omran, A. P. Engelbrecht and A. Salman, “Dynamic clustering using particle swarm optimization with application in unsupervised image classification,” in Fifth World Enformatika Conf. (ICCIPrague, Czech Republic, pp. 199–204, 2005. [Google Scholar]
35. M. G. Omran, A. Salman and A. P. Engelbrecht, “Dynamic clustering using particle swarm optimization with application in image segmentation,” Pattern Analysis and Applications, vol. 8, no. 4, pp. 332–344, 2006. [Google Scholar]
36. U. Maulik and S. Bandyopadhyay, “Fuzzy partitioning using a real-coded variable-length genetic algorithm for pixel classification,” IEEE Transactions on Geoscience and Remote Sensing, vol. 41, no. 5, pp. 1075–1081, 2003. [Google Scholar]
37. W. Alomoush, S. N. H. S. Abdullah, S. Sahran and R. I. Hussain, “MRI brain segmentation via hybrid firefly search algorithm,” Journal of Theoretical & Applied Information Technology, vol. 61, no. 1, pp. 73–90, 2014. [Google Scholar]
38. W. K. Alomoush, S. Abdullah, S. Sahran and R. I. Hussain, “Segmentation of MRI brain images using FCM improved by firefly algorithms,” Journal of Applied Sciences, vol. 14, no. 1, pp. 66–71, 2014. [Google Scholar]
39. J. C. Bezdek, C. Coray, R. Gunderson and J. Watson, “Detection and characterization of cluster substructure i. linear structure: Fuzzy c-lines,” SIAM Journal on Applied Mathematics, vol. 40, no. 2, pp. 339–357, 1981. [Google Scholar]
40. S. Saha and S. Bandyopadhyay, “A new point symmetry based fuzzy genetic clustering technique for automatic evolution of clusters,” Information Sciences, vol. 179, no. 19, pp. 3230–3246, 2009. [Google Scholar]
41. D. Martin, C. Fowlkes, D. Tal and J. Malik, “A database of human segmented natural images and its application to evaluating segmentation algorithms and measuring ecological statistics,” in Computer Vision, 2001, ICCV, Vancouver, British Columbia, Canada, pp. 416–423, 2001. [Google Scholar]
42. R. Kuo, Y. Huang, C. C. Lin, Y. H. Wu and F. E. Zulvia, “Automatic kernel clustering with bee colony optimization algorithm,” Information Sciences, vol. 283, pp. 107–122, 2014. [Google Scholar]
43. R. Kuo, Y. Syu, Z. Y. Chen and F. C. Tien, “Integration of particle swarm optimization and genetic algorithm for dynamic clustering,” Information Sciences, vol. 195, no. 1, pp. 124–140, 2012. [Google Scholar]
 | This work is licensed under a Creative Commons Attribution 4.0 International License, which permits unrestricted use, distribution, and reproduction in any medium, provided the original work is properly cited. |