DOI:10.32604/cmc.2021.015874
| Computers, Materials & Continua DOI:10.32604/cmc.2021.015874 | |
| Article |
Modeling Bacterial Species: Using Sequence Similarity with Clustering Techniques
1University of Alcalá, Alcalá de Henares (Madrid), 28871, Spain
2Camilo José Cela University, Madrid, 28007, Spain
*Corresponding Author: Miguel-Angel Sicilia. Email: msicilia@uah.es
Received: 11 December 2020; Accepted: 25 January 2021
Abstract: Existing studies have challenged the current definition of named bacterial species, especially in the case of highly recombinogenic bacteria. This has led to considering the use of computational procedures to examine potential bacterial clusters that are not identified by species naming. This paper describes the use of sequence data obtained from MLST databases as input for a k-means algorithm extended to deal with housekeeping gene sequences as a metric of similarity for the clustering process. An implementation of the k-means algorithm has been developed based on an existing source code implementation, and it has been evaluated against MLST data. Results point out to potential bacterial clusters that are close to more than one different named species and thus may become candidates for alternative classifications accounting for genotypic information. The use of hierarchical clustering with sequence comparison as similarity metric has the potential to find clusters different from named species by using a more informed cluster formation strategy than a conventional nominal variant of the algorithm.
Keywords: Clustering; bacterial species; k-means; sequence alignment
In contrast to eukaryotic organisms, divergence between different species in bacteria is not completely irreversible, and different named species are not ecologically distinct. In consequence, a named bacterial species is more like a genus than a species [1]. Bacterial systematics has been characterized by improvements in methods for demarcating species as phenotypic and genetic clusters, but species demarcation has not been guided by a theory-based concept of species, like in the eukaryote. Genotypic data has been used as the basis to characterize bacterial isolates, as a complement to the use of named species. Concretely, multilocus sequence typing (MLST) is a procedure for characterizing isolates of bacterial species using the sequences of internal fragments of a limited number of house-keeping genes [2]. MLST has proved to be useful for epidemiological studies [3] and for the analysis of specific bacterial strains [4], and it is based on existing research on sequence-based characterizations of bacterial strands. MLST analysis reduces the problem of identifying bacterial categories by selecting a number of 450–500 bp internal fragments of each gene, as these can be accurately sequenced on both strands using an automated DNA sequencer. For each house-keeping gene, the different sequences present within a bacterial species are assigned as distinct alleles and, for each isolate, the alleles at each of the loci define the allelic profile or sequence type (ST).
In spite of the effort in classifying bacteria, previous studies [5] have challenged the current definition of named bacterial species, especially in the case of highly recombinogenic bacteria. This has led to considering the use of procedures beyond MLST to examine potential bacterial clusters that are not identified by species naming [6]. Existing research based on MLST data has used phylogenetic trees for that purpose. However, the analysis of such trees (called MLSA, multilocus sequence analysis) requires human inspection, and automated clustering algorithms could be used as an alternative in which segments are identified from sequence data.
This paper describes a new software tool that uses sequence data obtained from MLST databases as input for well-known clustering algorithms. Concretely, the k-means algorithm is extended to deal with housekeeping gene sequences as a metric of similarity for the clustering process. The k-means algorithm does not assume any kind of probability distribution on the data it segments, so it provides an adequate starting point for research in clustering applied to MLST databases, which are unbalanced in their coverage of bacteria, since they are basically built by non-planned contributions from researchers worldwide, as occurs with many other biological databases.
2.1 The Definition of Bacterial Species
Prokaryotes reproduce asexually and are thus in principle unable to conform to Ernst Mayr’s popular Biological Species Concept “groups of actually or potentially interbreeding natural populations which are reproductively isolated from other such groups”. So currently the practical need for identification and naming is addressed by some broadly agreed but provisional bacterial species definition. A theory for a unifying species concept that would explain patterns of microbial diversity in ecological and population genetic terms could then be found in the future from the examination and continuous analysis of bulks of biological data using among others, bioinformatics techniques.
Related bacteria were at the beginning identified by careful analysis of phenotypes (typically, metabolic traits), but nowadays sequence similarity approaches are used as a source of potential units or as a way of finding supporting evidence for named species. Operationally, molecular de nitions are often used, and species are usually expected to share at least 70% binding in standardized DNA–DNA hybridization [7] and/or over 97% gene-sequence identity for 16S ribosomal RNA (rRNA).
The criterion of a threshold of DNA–DNA hybridization says that strains that show approximately 70% or greater DNA–DNA relatedness are considered to belong to the same species and those that have less than this value are different species. DNA–DNA hybridization is considered to be the best method for assigning bacteria to taxonomic units. However, the technique is time consuming, expensive and requires considerable human effort. This has led to using lighter techniques for the same purpose, being identification with 16S rRNA the most widespread today, and in fact, the increase of registered species is attributed to the use of that technique [8].
The use of 16S rRNA sequences to study bacterial species has been considered as especially appropriate for the following reasons [9]:
• Its presence in almost all bacteria.
• The function of the 16S rRNA gene over time has not changed, suggesting that random sequence changes are a more accurate measure of time (evolution).
• The 16S rRNA gene (1500 bp) is large enough for bio-informatics analysis.
As mentioned by Hanage et al. [10], bacterial strains exhibiting more than 70% DNA–DNA hybridization (or which have more than 94% average nucleotide identity over all shared genes) have been shown to be extremely similar in their 16S rRNA gene sequences. However, strains that have almost identical 16S rRNA sequences may not be closely related, whether this is evaluated by DNA–DNA hybridization or the average nucleotide identity between all the shared genes [8]. This suggests that species identification using rRNA sequences may be problematic in some cases as it lacks the required level of resolution to distinguish similar species or to address the question of whether species exist and can be clearly resolved [11]. The existence of a wide diversity of potential bacterial clusters is reflected in that few 16S sequences qualify the 97% threshold even in the case of isolates of the same sampling site. This is a phenomenon of “microdiversity” that calls for exploring new methods of sequence clustering that might be helpful to differentiate bacterial groups that have interesting traits in common.
There are other important concepts related with the study of bacterial species. Some of them which are present in MLST databases are briefly discussed here. An important consideration regarding methodology is that a very low percentage of bacterial species are cultivable with today’s techniques. So, laboratory studies cannot cover the diversity of bacterial units, and molecular techniques suggest that there could be billions of potential species [12], contrasting with the few thousands available in the lists of approved bacteria names. This has as an important methodological consequence that identification techniques should seek
A strain is a subset of a bacterial species differing from other bacteria of the same species by some minor but identifiable difference. Strain have been defined as “populations of organisms that descends from a single organism or pure culture isolate. Strains within a species may differ slightly from one another in many ways.” Strains are often created in the laboratory by mutagenizing existing strains or wild type examples of bacterial species.
A serovar is a strain differentiated by serological means. For example, individual strains of Salmonella are often distinguished and distinguishable by serological means. Serovars allow organisms to be classified at the sub-species level. An isolate is a microbial or viral sample that has been obtained from an infected individual, rather than grown in a laboratory. In chemistry and bacteriology, the verb isolate means to obtain a pure chemical, bacteriological or viral sample. The noun ‘isolate’ refers to the sample itself. MLST databases register isolate information, thus the data included is determined by that particular data gathering practice.
2.2 Challenges in Bacterial Species Identification
The definition of bacterial species has been recently challenged, especially in the case of highly recombinogenic bacteria [5,13]. Current species names are assigned to groups of organisms sharing many common phenotypical traits and a certain minimum level of genomic similarity. However, clustering studies have revealed that groups of genomic similarity do not always perfectly match named species [5], and the same could be applied to bacterial strains determined by serogroup. In consequence, the existing classifications for species and strains of bacteria can be replaced by extended models that account for divergences in genetic profiles that apparently do not match the classifications. This could be done by automated means, as clustering algorithms, that use genotypic data as input to build the models.
The problem of determining bacterial species is also related to how far we should go in the division into subgroups. Cohan et al. [14] developed a framework for the systematics of bacteria that combines biological, physiological and ecological elements. This framework can may eventually be used for evaluating automated techniques of bacterial species units, constraining the division to meaningful clusters which determine actual ecological diversity.
Clustering is the partitioning of objects into different subgroups, with the subsets called clusters. Ideally, the data in each subset share some common trait(s) which are relevant to the problem at hand. Clustering can be considered the most important unsupervised learning technique; so, as every other problem of this kind, it deals with finding a structure in a collection of unlabeled data. Clustering algorithms can be classified along diverse dimensions [15]. One possible overlapping classification is the following:
• Exclusive Clustering, being k-means a typical representative.
• Overlapping Clustering, being fuzzy c-means (first described by Dunn [16]) a typical representative.
• Hierarchical Clustering, as the CobWeb clustering method.
• Probabilistic Clustering, as the EM clustering method.
In the first case data are grouped in an exclusive way, so that if a certain datum belongs to a definite cluster then it could not be included in another cluster. In the second type, fuzzy sets or other kind of gradual relatedness measure is used to cluster data, so that each object may belong to two or more clusters with different degrees of membership or closeness. Hierarchical clustering produces clusters contained in more general ones. Finally, probabilistic clustering uses some assumed probability distributions for the formation of clusters.
In our approach, the k-means has been selected as a first step towards using other methods. The benefit of using k-means is that it does not impose requirements on the population to be clustered (as the EM algorithm) and allows for clear groupings of bacteria that are close w.r.t. their genotypes. Although fuzzy clustering seems a good candidate for clusters with imprecise boundaries, its multiple classification makes its outcomes more difficult to interpret, and in our current research we are interested in generating first non-overlapping groupings, that in future work may be contrasted with overlapping ones.
2.4 Clustering Techniques and Sequence Information
In phylogeny, clustering is mostly used for finding 16S rRNA groups to create phylogenetic trees. But it can be used for other genomic traits also [17].
Genotypic data has been used as the basis to characterize bacterial isolates. Concretely, multilocus sequence typing (MLST) is a procedure for characterizing isolates of bacterial species using the sequences of internal fragments of a limited number of house-keeping genes [2]. It was designed originally for epidemiology studies [18]. However, it can be used for the purpose of analyzing genetic profiles of bacteria isolates efficiently, and it will be the basis for the current project.
In our context, fuzzy clustering appears to be coherent with the idea that lateral gene transfer and asexual reproduction in bacteria produce a higher level of variety in the species concept. Cohan et al. [14] graphically describe that difference from the eukaryote in the following text:
“[
However, the raw material for defining membership functions would be that of sequence similarity, and the scores produced by alignment algorithms still lack a theory–based interpretation. The estimation of significance in terms of similarity of an alignment is based on estimating the probability that the score computed or a higher one can occur simply by chance, given the probabilistic models for the sequences [19]. Translating this interpretation into a fuzzy model would require the computation of permutations which would make the clustering algorithm even more computationally intensive than it is with only the computation of alignments. Also, it would require a careful consideration of the interpretation of the probability distributions.
This later challenge also is found with probability–based clustering algorithms. For example, the expectation-maximization (EM) algorithm [20] is an iterative technique for estimating the value of some unknown quantity, given the values of some correlated, known quantity. It assumes that the quantity is represented as a value in some parameterized probability distribution. Many biological databases, including MLST databases, are unbalanced in their coverage of species. The overrepresentation of some of them is a natural consequence of the unplanned way of gathering data. Researchers worldwide submit their information on isolates, and this results in some species to be more abundant, as determined by a variety of reasons including its ease of cultivation or their epidemiological interest. Using techniques for balancing the data (by generating random data or cutting overrepresented isolate types) may result in losing the original interest of discovering varieties in existing named species, so it is a challenge in itself.
Hierarchical clustering appears as a reasonable approach given that at surface, they are coherent with existing approaches that use phylogenetic trees [5].
Clustering algorithms have been used for different classification or discovery purposes that use biological data as input. Particularly, in [14], a Bayesian spatial structural model representing the continuum of origins over sites within the observed sequences, including a probabilistic characterization of uncertainty related to the origin of any particular site, and illustrate the possibilities offered by their approach. More specifically, some extensions of classical clustering algorithms to sequence data have been reported. Zong et al. [21] proposed a new greedy initialization method for the K-means algorithm to improve traditional K-means clustering techniques, for the purpose of classifying proteins. Their similarity metric was based in structural folds and some particular characteristics of the aminoacid sequences, not directly in sequences.
The BURST algorithm [22] identifies mutually exclusive groups of related genotypes in the population (typically a multilocus sequence typing database), and attempts to identify the founding genotype (sequence type or ST) of each group. Every ST within an eBURST group has a user-defined minimum number of identical alleles in common with at least one other ST in the group. eBURST groups therefore are mutually exclusive; no ST can belong to more than one group. This takes into account the codified allele variants at each loci, instead of using directly the sequences as it will be done in the modified algorithm described below. That approach is different from the one described in this paper in that we consider sequence similarity instead of using only sequence types, so they can be considered complementary and may be subject to comparison in future work.
3.1 A Modified K-Means Considering Sequence Similarity
The k-means algorithm [23] is an algorithm to cluster n objects based on attributes into k partitions, k < n. It attempts to find the centers of natural clusters in the data. It assumes that the object attributes form a vector space. The objective it tries to achieve is to minimize total intra-cluster variance, or, the squared error function.
where there are k clusters Si, i = 1, 2,…, k, and
The algorithm can be applied to numerical or nominal data, or a combination of both. A common form of the algorithm uses partitions the input points into k initial sets, either at random or using some heuristic data. It then calculates the mean point, or centroid, of each set. It constructs a new partition by associating each point with the closest centroid. Then the centroids are recalculated for the new clusters, and algorithm repeated by alternate application of these two steps until convergence, which is obtained when the points no longer switch clusters (or when centroids are no longer changed).
The k-means algorithm assumes a vector space describing the instances and provides a generic arithmetic formulation in which the instances xj are considered to be numerical. Variants dealing with nominal data reduce to the numerical variant by considering value coincidence to score one, zero otherwise. A straightforward approach for considering MLST data would be that of using a special metric for object similarity. The following equation reflects this change.
Concretely, the changes are twofold:
1. The arithmetic distance in the vector space is substituted by an average estimation of the similarity of the sequences at the different loci considered.
2. Instead of computing a centroid
3.2 Estimating Object Similarity
The alignScore(x
• It should deal with actual objects in the instance space considered, to guarantee that genotipic comparisons are biologically meaningful.
• It should be flexible to consider vectors or weighted vectors of sequence fragments, thus allowing for different configurations.
The second requirement makes the algorithm flexible enough to work with different configurations:
• Several loci, as in MLST databases which typically describe bacteria with alleles in seven housekeeping genes.
• A single locus (often with a longer sequence), as is common with 16S rRNA analysis.
• Any combination of the above, including concatenations of sequences as used by Hanage et al. [5].
Sequence alignment algorithms as the Needleman-Wunsch one [24] qualify as similarity metrics, even though there are concerns on their significance [19]. Such significance measures may be included as weights in the process of computing similarities. It should be noted that another possible variant is that not all the locus need to be considered of the same weight, e.g., it is possible to perform factor analysis of some kind to inform the rest of the process.
In principle, the scores returned by the clustering algorithm may be in any range, since the computation does not depend on the range but in the discernibility of distances. Nonetheless, the scores returned by common alignment algorithm implementations are not normalized in any interval, which may require some transformation in the implementation of the algorithm, as it will be described later.
3.3 Selecting Cluster Centroids
The selection of cluster centroids is a critical aspect in the design of the algorithm, since it affects the performance and possibilities of the convergence of the iterative process of the k-means algorithm. Instead of computing the averages of vector elements, there is a search process, which again uses sequence similarity. The following formula specifies the criterion for selecting the centroid of cluster Si at iteration k.
That is, the sum of the distances of each element in the cluster to the rest of the elements is computed, and the minimum general distance is used to determine the new centroid.
3.4 Gathering and Pre-Processing MLST Data
The data gathered for testing the software and analyzing results has been downloaded from MLST databases1. MLST databases are actually a collection of databases specializing in several bacterial types. Fig. 1 provides a summary of one of its databases in the form of a relational schema. There are some attributes that occur several times depending on the kind of organism or information represented, e.g. allelic profiles. Also, the table locus can be considered a set of tables.
The data downloaded is stored in denormalized form in two tables with the following general structure.
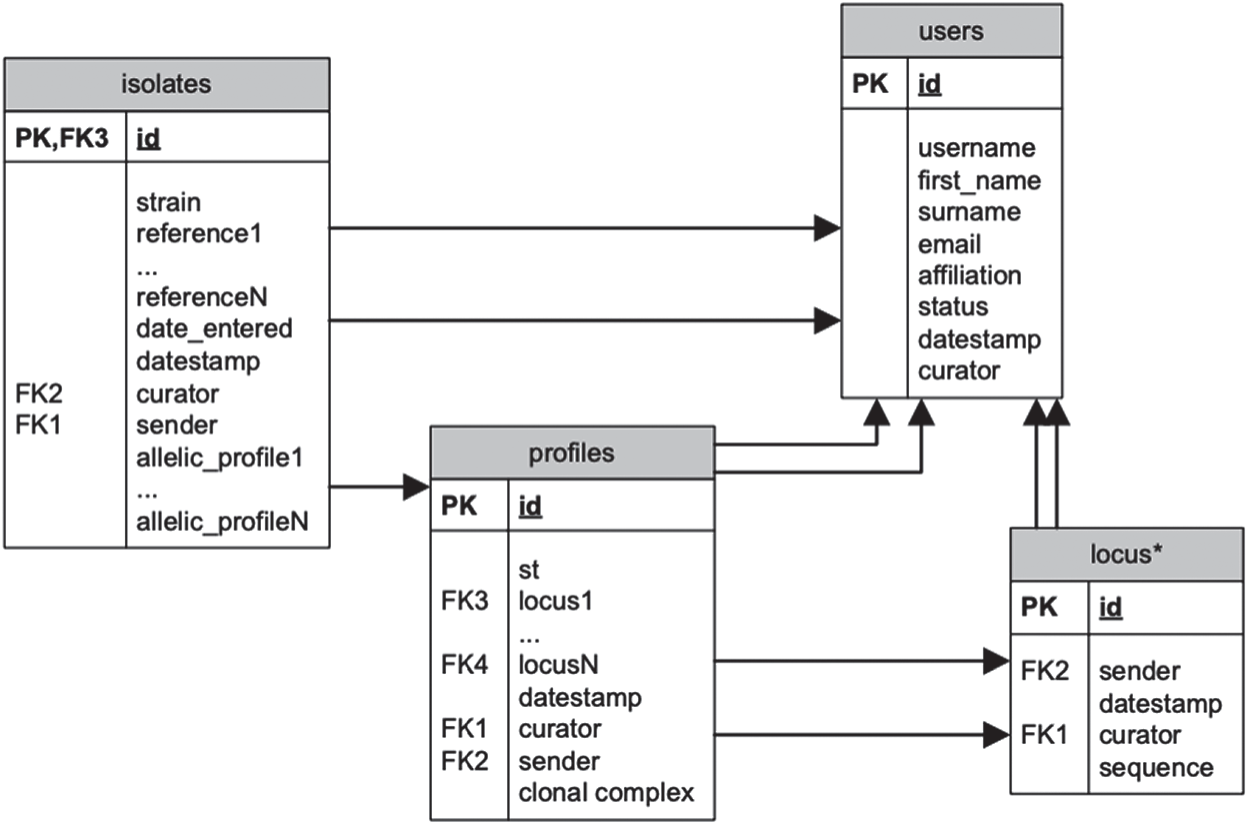
Figure 1: Relational schema for the MLST database
ISOLATES( id,
Where id identifies the isolate, and there are a number of other identification fields including origin, curator and the like, then there is a specification of species, and a list of columns depending on the database that store the allele types for the housekeeping genes that characterize that particular database. The serogroup, clonal complex and other fields can be as alternative criteria for grouping bacterial units.
ALLELES(locusid, id, seq)
Where the pair (locusid, id) identify the allele, and seq contains the sequence. The data in the relational schema is then converted to the ARFF format to make it usable with the Weka machine learning framework (described in the next section). This is accomplished by a utility program named MLST2ARFF.
The download process is implemented with a small utility program called MLSTDownloader that gets data to a local relational store. It uses the MLST SOAP API.
This is an implementation of a variant of the SimpleKMeans algorithm provided in Weka4 that uses global alignment of sequences of housekeeping genes to drive the clustering process. Weka (Waikato Environment for Knowledge Analysis) is an open source suite of machine learning software written in Java, developed at the University of Waikato.
The main classes with the implementation are the following:
• SimpleKMeans4mlst.java, the modified SimpleKMeans.
• NucleotidePairAligner.java, a utility class for getting global alignment scores.
The BioJava implementation of the Needleman-Wunsch algorithm (class NeedlemanWunsch) has been used for the similarity scoring.
This section reports on the evaluation of the algorithm on the approach presented for MLST databases.
The Neisseria MLST database has been used as the case study since they are among the most recombinogenic bacteria, and there is good evidence for relatively frequent localized recombination between the named Neisseria species [25]. Also, the public Neisseria MLST database includes a high number of sequence types (STs) of N. meningitidis and smaller numbers assigned to several other named human Neisseria species on the basis of standard phenotypic tests, thus serving as a good case for clustering.

4.1 Contrasting with Sequence Type Clustering
The modified k-means algorithm using sequence alignment scores has been contrasted with the use of the conventional k–means provided in the Weka libraries using allele attributes as nominal values. The use of nominal values for the classification is related to the eBURST algorithm.
In general, the within cluster sum of squared error results in lower values in the modified version, but this is not necessarily related to the identification of ecologically significant clusters.
A moderately extensive exploration has been carried out with the isolates identified with the ids from 1 to 400 in the Neisseria MLST database, again asking for ten clusters. The SimpleKMeans4mlst algorithm produced the following clustering.
Serotype 2a appears to determine the first cluster, which correspond to a particular virulent variant of N. meningitidis. Cluster 2 has grouped N. Lactamica with some noise. This is consistent with the findings in [5]. Cluster number 3 seem to be grouping isolates which do not fit in the rest of the clusters, since they do not have any distinguishing characteristics. Clusters 5 and 6 are to some extent blurred. Cluster 9 is clearly determined by serogroup W-135. In fact, it groups all the W-135 except those with serotype 2a, which are grouped in the first cluster.
A very relevant finding is that sequence types (ST) are only discriminating the same or similar clusters in the cases mentioned in the above table. This suggest that using sequences in turn of allele numbers provide matches with biological characteristics not covered by STs.
From the analysis above, it seems that serogroups or serotypes are determining the clusters to a great extent. This is confirming the classifications at the sub-species level.
Regarding clonal complexes, cluster 0 is basically determined by ST-11 complex/ET-37 complex, and clusters 6–9 by ST-41/44 complex/Lineage 3, ST-32 complex/ET-5 complex, ST-11 complex/ET-37 complex, ST-22 complex respectively (the latter case blurred with ST-23 complex/Cluster A3). However, the others are not clearly determined by any clonal complex, while there are attributes that may to some extent be determinant, especially if more clusters are requested to the algorithm, thus having the opportunities to split them.
The original SimpleKMeans with the same data and input parameters produces clusters less balanced. A larger cluster of 125 instances concentrates N. Lactamica (13 isolates), N. gonorrhoeae (1 isolate) and N. Meningitidis C (59 isolates), but also dispersed isolates from other serogroups.
4.2 Limitations of the Analysis
The obvious limitation is that of the size of the databases used for the evaluation, which were constrained by the computational cost of the algorithm’s implementation. In addition to that, the exploration of the clusters needs to be informed by theoretical models [14] or at least some biological insight related to the specific ecology of the bacterial family under consideration.
Regarding the similarity measure, the significance of the global alignments should be explored, to prevent low significant to be acting as noise in the clustering process.
The established naming of bacterial species is nowadays challenged by molecular level methods that suggest that there is a much rich diversity of organisms than in the non-microbial realm [7]. Lateral gene transfer coming from recombination makes it di cult to contrast sequence-based identification methods with ecological or physiological models. This has led to approaches that attempt to look for potential species of a finer grain than existing ones, and eventually, with some degree of overlapping [5].
This work has explored the possibility of extending existing clustering algorithms to deal with sequence data as a tool for identifying potential bacterial groups that may be biologically significative. Concretely, an extension of the k-means algorithm has been reported, along with its implementation. Data from MLST databases have been used for the testing.
There are several avenues for future research related to the clustering of bacteria for the identification of significant units. These include the following:
• Improving the described extended k-means implementation. Concretely, performance can be critically improved by caching sequence alignment scores, which are repeated several times and that are by themselves computationally expensive.
• Evaluating the outcomes of extended clustering algorithms, by using them systematically with MLST databases. However, the evaluation would need to analyze the result in contrast with some biological-ecological interpretation of other data items.
• Extending the analysis to other clustering schemes, as those that have been mentioned in the paper.
1http://www.mlst.net/.
Funding Statement: The authors received no specific funding for this study.
Conflicts of Interest: The authors declare that they have no conflicts of interest to report regarding the present study.
1. F. M. Cohan, “What are bacterial species?,” Annual Reviews in Microbiology, vol. 56, no. 1, pp. 457–487, 2002. [Google Scholar]
2. M. C. Maiden, J. A. Bygraves, E. Feil, G. Morelli, J. E. Russell et al., “Multilocus sequence typing: A portable approach to the identification of clones within populations of pathogenic microorganisms,” Proceedings of the National Academy of Sciences of the United States of America, vol. 95, no. 6, pp. 3140–3145, 1998. [Google Scholar]
3. S. Rajkhowa, J. Scaria, D. L. Garcia, K. A. Musser, B. L. Akey et al., “Analysis of Escherichia coli O157 clinical isolates by multilocus sequence typing,” BMC Research Notes, vol. 3, no. 1, pp. 343, 2010. [Google Scholar]
4. M. Solheim, M. C. Brekke, L. G. Snipen, R. J. Willems, I. F. Nes et al., “Comparative genomic analysis reveals significant enrichment of mobile genetic elements and genes encoding surface structure-proteins in hospital-associated clonal complex 2 Enterococcus faecalis,” BMC Microbiology, vol. 11, no. 1, pp. 3, 2011. [Google Scholar]
5. W. P. Hanage, C. Fraser and B. G. Spratt, “Fuzzy species among recombinogenic bacteria,” BMC Biology, vol. 3, no. 1, pp. 6, 2005. [Google Scholar]
6. C. J. Bishop, D. M. Aanensen, G. E. Jordan, M. Kilian, W. P. Hanage et al., “Assigning strains to bacterial species via the internet,” BMC Biology, vol. 7, no. 1, pp. 1–20, 2009. [Google Scholar]
7. L. G. Wayne, D. J. Brenner, R. R. Colwell, P. A. D. Grimont, O. Kandler et al., “Report of the ad hoc committee on reconciliation of approaches to bacterial systematics,” International Journal of Systematic and Evolutionary Microbiology, vol. 37, no. 4, pp. 463–464, 1987. [Google Scholar]
8. L. B. Reller, M. P. Weinstein and C. A. Petti, “Detection and identification of microorganisms by gene amplification and sequencing,” Clinical Infectious Diseases, vol. 44, no. 8, pp. 1108–1114, 2007. [Google Scholar]
9. J. M. Janda and S. L. Abbott, “16S rRNA gene sequencing for bacterial identification in the diagnostic laboratory: Pluses, perils, and pitfalls,” Journal of Clinical Microbiology, vol. 45, no. 9, pp. 2761–2764, 2007. [Google Scholar]
10. W. P. Hanage, C. Fraser and B. G. Spratt, “Sequences, sequence clusters and bacterial species,” Philosophical Transactions of the Royal Society B: Biological Sciences, vol. 361, no. 1475, pp. 1917–1927, 2006. [Google Scholar]
11. G. E. Fox, J. D. Wisotzkey and P. Jurtshuk Jr., “How close is close: 16S rRNA sequence identity may not be sufficient to guarantee species identity,” International Journal of Systematic and Evolutionary Microbiology, vol. 42, no. 1, pp. 166–170, 1992. [Google Scholar]
12. J. Gans, M. Wolinsky and J. Dunbar, “Computational improvements reveal great bacterial diversity and high metal toxicity in soil,” Science, vol. 309, no. 5739, pp. 1387–1390, 2005. [Google Scholar]
13. P. Marttinen, A. Baldwin, W. P. Hanage, C. Dowson, E. Mahenthiralingam et al., “Bayesian modeling of recombination events in bacterial populations,” BMC Bioinformatics, vol. 9, no. 1, pp. 421, 2008. [Google Scholar]
14. F. M. Cohan and E. B. Perry, “A systematics for discovering the fundamental units of bacterial diversity,” Current Biology, vol. 17, no. 10, pp. 373–386, 2007. [Google Scholar]
15. R. Xu and D. Wunsch, “Survey of clustering algorithms,” IEEE Transactions on Neural Networks, vol. 16, no. 3, pp. 645–678, 2005. [Google Scholar]
16. J. C. Dunn, “A fuzzy relative of the ISODATA process and its use in detecting compact well-separated clusters,” Journal of Cybernetics, vol. 3, no. 3, pp. 32–57, 1973. [Google Scholar]
17. H. Willenbrock, T. T. Binnewies, P. F. Hallin and D. W. Ussery, “Genome update: 2D clustering of bacterial genomes,” Microbiology, vol. 151, no. 2, pp. 333–336, 2005. [Google Scholar]
18. R. Urwin and M. C. Maiden, “Multi-locus sequence typing: A tool for global epidemiology,” Trends in Microbiology, vol. 11, no. 10, pp. 479–487, 2003. [Google Scholar]
19. A. Y. Mitrophanov and M. Borodovsky, “Statistical significance in biological sequence analysis,” Briefings in Bioinformatics, vol. 7, no. 1, pp. 2–24, 2006. [Google Scholar]
20. A. P. Dempster, N. M. Laird and D. B. Rubin, “Maximum likelihood from incomplete data via the EM algorithm,” Journal of the Royal Statistical Society: Series B (Methodological), vol. 39, no. 1, pp. 1–22, 1977. [Google Scholar]
21. W. Zhong, G. Altun, R. Harrison, P. C. Tai and Y. Pan, “Improved K-means clustering algorithm for exploring local protein sequence motifs representing common structural property,” IEEE transactions on Nanobioscience, vol. 4, no. 3, pp. 255–265, 2005. [Google Scholar]
22. E. J. Feil, B. C. Li, D. M. Aanensen, W. P. Hanage and B. G. Spratt, “eBURST: Inferring patterns of evolutionary descent among clusters of related bacterial genotypes from multilocus sequence typing data,” Journal of Bacteriology, vol. 186, no. 5, pp. 1518–1530, 2004. [Google Scholar]
23. J. A. Hartigan and M. A. Wong, “Algorithm AS 136: A k-means clustering algorithm,” Journal of the Royal Statistical Society. Series C (Applied Statistics), vol. 28, no. 1, pp. 100–108, 1979. [Google Scholar]
24. S. B. Needleman and C. D. Wunsch, “A general method applicable to the search for similarities in the amino acid sequence of two proteins,” Journal of Molecular Biology, vol. 48, no. 3, pp. 443–453, 1970. [Google Scholar]
25. E. Feil, M. Maiden, M. Achtman and B. Spratt, “The relative contributions of recombination and mutation to the divergence of clones of Neisseria meningitidis,” Molecular Biology and Evolution, vol. 16, no. 11, pp. 1496–1502, 1999. [Google Scholar]
 | This work is licensed under a Creative Commons Attribution 4.0 International License, which permits unrestricted use, distribution, and reproduction in any medium, provided the original work is properly cited. |