DOI:10.32604/cmc.2021.016814
| Computers, Materials & Continua DOI:10.32604/cmc.2021.016814 | |
| Article |
Cloud-Based Diabetes Decision Support System Using Machine Learning Fusion
1School of Computer Science, National College of Business Administration & Economics, Lahore, 54000, Pakistan
2Department of Computer Science, Virtual University of Pakistan, Lahore, 54000, Pakistan
3College of Computer and Information Sciences, Jouf University, Sakaka, 72341, Saudi Arabia
4Riphah School of Computing & Innovation, Riphah International University, Lahore Campus, Lahore, 54000, Pakistan
5Department of Computer Science, Lahore Garrison University, Lahore, 54000, Pakistan
6Department of Computer Science, Faculty of Computers and Artificial Intelligence, Cairo University, 12613, Egypt
*Corresponding Author: Muhammad Adnan Khan. Email: adnan.khan@riphah.edu.pk
Received: 12 January 2021; Accepted: 13 February 2021
Abstract: Diabetes mellitus, generally known as diabetes, is one of the most common diseases worldwide. It is a metabolic disease characterized by insulin deficiency, or glucose (blood sugar) levels that exceed 200 mg/dL (11.1 ml/L) for prolonged periods, and may lead to death if left uncontrolled by medication or insulin injections. Diabetes is categorized into two main types—type 1 and type 2—both of which feature glucose levels above “normal,” defined as 140 mg/dL. Diabetes is triggered by malfunction of the pancreas, which releases insulin, a natural hormone responsible for controlling glucose levels in blood cells. Diagnosis and comprehensive analysis of this potentially fatal disease necessitate application of techniques with minimal rates of error. The primary purpose of this research study is to assess the potential role of machine learning in predicting a person’s risk of developing diabetes. Historically, research has supported the use of various machine algorithms, such as naïve Bayes, decision trees, and artificial neural networks, for early diagnosis of diabetes. However, to achieve maximum accuracy and minimal error in diagnostic predictions, there remains an immense need for further research and innovation to improve the machine-learning tools and techniques available to healthcare professionals. Therefore, in this paper, we propose a novel cloud-based machine-learning fusion technique involving synthesis of three machine algorithms and use of fuzzy systems for collective generation of highly accurate final decisions regarding early diagnosis of diabetes.
Keywords: Machine learning fusion; artificial neural network; decision trees; naïve Bayes; diabetes prediction
Diabetes mellitus, widely known as diabetes, is an increasingly common physiological health issue. A patient with diabetes, or a diabetic, suffers from a critical shortage of insulin, resulting in an inability to adequately process glucose (sugar) [1]. Diabetes is generally classified into two types: type 1 and type 2. Type-1 diabetes is characterized by insulin dependency, while type-2 diabetes is characterized by insulin deficiency. Insulin is one of the vital hormones produced by the pancreas, the organ responsible for regulating glucose (blood sugar) levels in the human body. The primary underlying causes of diabetes are an imbalanced diet (i.e., one high in sugary foods), obesity, and genetic inheritance. Recent industrial and technological advancements have significantly affected the average human lifestyle, leading to the higher standard of living and accompanying decrease in physical activity commonly observed in developed countries. Accordingly, rates of diabetes have increased, and clinical analysis and effective diagnosis of diabetes have become key subjects of healthcare studies. Traditionally, diabetes has been diagnosed via clinical tests of glucose tolerance levels in patients [2]. Like many other metabolic diseases, diabetes is associated with severe complications such as heart failure, kidney problems, and eyesight issues including complete blindness [3]. An alarming report issued by the Diabetes Research Centre stated that the prevalence of diabetes has increased at a rate of 7% annually and doubled globally during the last decade, with more than 200 million now diagnosed. Research studies have indicated that 8% of the population aged 25–65 suffer from ailments linked to pancreatic dysfunction, and in a sample of 2.2 million of such patients, 17% were adults; most of these patients have high risk of developing diabetes in the near future [4]. Diabetes can be fatal and otherwise can lead to severe, often irreparable damage to multiple organs. There is an immense need for tools and technologies enabling efficient, accurate investigation and diagnosis to support the decision making of health experts in managing this disease.
Recent studies indicate that accurate and timely diagnosis may prevent 80% of complications in patients with type-2 diabetes. Accurate and timely diagnosis provides a solid basis for effective treatment, helping to minimize cost of treatment and other difficulties for patients [5]. These are the key success factors for prevention of diabetes complications and development of effective treatment strategies. Healthcare professionals can implement such strategies to reduce long-term damage caused by this disease. Due to its significant advantages, early detection has become a top priority among healthcare prognosis personnel. Notably, detection of type-2 diabetes requires a higher level of medical expertise, as this disease is more complex compared to type-1 diabetes. One of the most promising new methods for accurate early diagnosis is the use of an artificial neural network (ANN). ANN is one of a number of recently developed machine-learning methods being implemented to predict disease earlier and more accurately. According to M. S. Shanker in his research paper “Using neural networks to predict the onset of diabetes mellitus” [6], ANN is considered a more suitable approach to early diagnosis than other machine-learning methods, particularly when one considers the factor of network topology. However, parameter optimization presents a major issue when utilizing ANN. Multi-layer perceptron (MLP), a subset of Deep neural networks (DNN), has offered effective resolutions to this problem. DNN are increasingly recommended to support diagnostic processes for diverse diseases [7], as DNN facilitate disease identification and diagnosis while minimizing human error [8]. When utilizing neural networks for diagnosis, it is vital to attain a high level of accuracy, which is achieved via sufficient training and testing on patient datasets. DNN have shown particular promise for achieving maximum accuracy and minimal error through training and testing on datasets.
Machine-learning models are commonly used for diabetes prognostication and provide better results. Among machine-learning models, one of the most widely used methods for results classification is the Decision tree (DT). In machine-learning methods for disease diagnosis, the results of multiple DT can be synthesized to generate a random forest (RF) that yields a single collective final result—that is, a final diagnostic decision. The authors used RF in parallel with Principal component analysis (PCA). RF approximately obtains 80% accuracy. Historically, the primary objective of diabetes diagnosis was simply to help control the development of the disease. With support from machine learning, early diagnosis has become possible. High-risk individuals may now take precautionary measures to avoid consequences of the disease for as long as possible. Successful early diagnosis largely depends on accurate selection of classifiers and related features. Researchers have been experimenting with various machine-learning methods, testing different algorithms with the aim of achieving superior rates of prediction accuracy. Previously explored algorithms include support-vector machines (SVM), J48, naïve Bayes, and DT; studies of these algorithms have proven that machine-learning methods achieve superior diagnostic results [9]. The real strength of these algorithms lies in their flexibility to integrate data from varying sources [10].
In this study, we propose a new DNN approach for generating highly accurate predictions of type-2 diabetes. Our approach utilizes a cloud-based decision support system for early identification of diabetic patients. The proposed system uses real-time patient data as input to predict whether a particular patient has diabetes. We apply three popular machine-learning algorithms and a fuzzy system to achieve final diagnostic results with accuracy rates higher than those achieved in similar past studies.
Researchers in [11] presented a hybrid framework for detection of type-2 diabetes that uses two techniques: K-means and C4.5. They used the clustering algorithm to identify class labels and C4.5 for classification. Their experiment on the Pima Indians diabetes dataset (PIDD) yielded a 92.38% accuracy rate. Researchers in [12] proposed a model using fuzzy C-means clustering techniques to diagnose type-2 diabetes. They used 768 records with nine features in their experiment, achieving 94.3% accuracy. In [13], researchers performed a comparative analysis of various classification and clustering techniques for diabetes diagnosis. They conducted tests to evaluate the performance of applied data-mining techniques. Their results indicated that the J48 classifier outperformed all other techniques in Weka with an accuracy rate of 81.33%. Researchers in [14] proposed a framework to diagnose diabetes using DT along with a fuzzy decision boundary system. The proposed framework achieved an accuracy of 75.8%. Researchers in [15] presented a system to detect diabetes using generalized discriminant analysis and least-squares SVM. Their proposed system demonstrated 82.50% accuracy. Researchers in [16] presented a diabetes detection system using a modified artificial bee colony (ABC) optimization technique with fuzzy rules. Their proposed system showed an accuracy rate of 82.68%. Researchers in [17] proposed a model for diabetes detection that integrated ANN and SVM using a stacked ensemble technique. They applied their model to the PIDD and achieved an accuracy rate of 88.04%. In [18], researchers presented an ensemble classification model based on data streams. The proposed model was able to perform classification tasks in a data-streaming environment. Researchers in [19] also presented an ensemble classification model; theirs was designed to detect diabetic retinopathy. They used fuzzy RF and applied Dominance-based Rough Sets Theory. Their experiment used the SRJUH dataset and showed an accuracy rate of 77%. Researchers in [20] presented a heterogeneous ensemble classification model that included a fuzzy rule inference engine to tackle the issue of uncertainty in the results of base classifiers.
Early diagnosis of type-2 diabetes can offer patients the opportunity to improve their lifestyles and dietary habits. Moreover, early detection can guide patients to start taking proper medication before the disease worsens. In our study, we present a method for early detection of diabetes that uses a cloud-based intelligent framework empowered by supervised machine-learning techniques and fuzzy systems as shown in Fig. 1. Our framework consists of two layers: Training and testing. Each layer further consists of multiple stages.
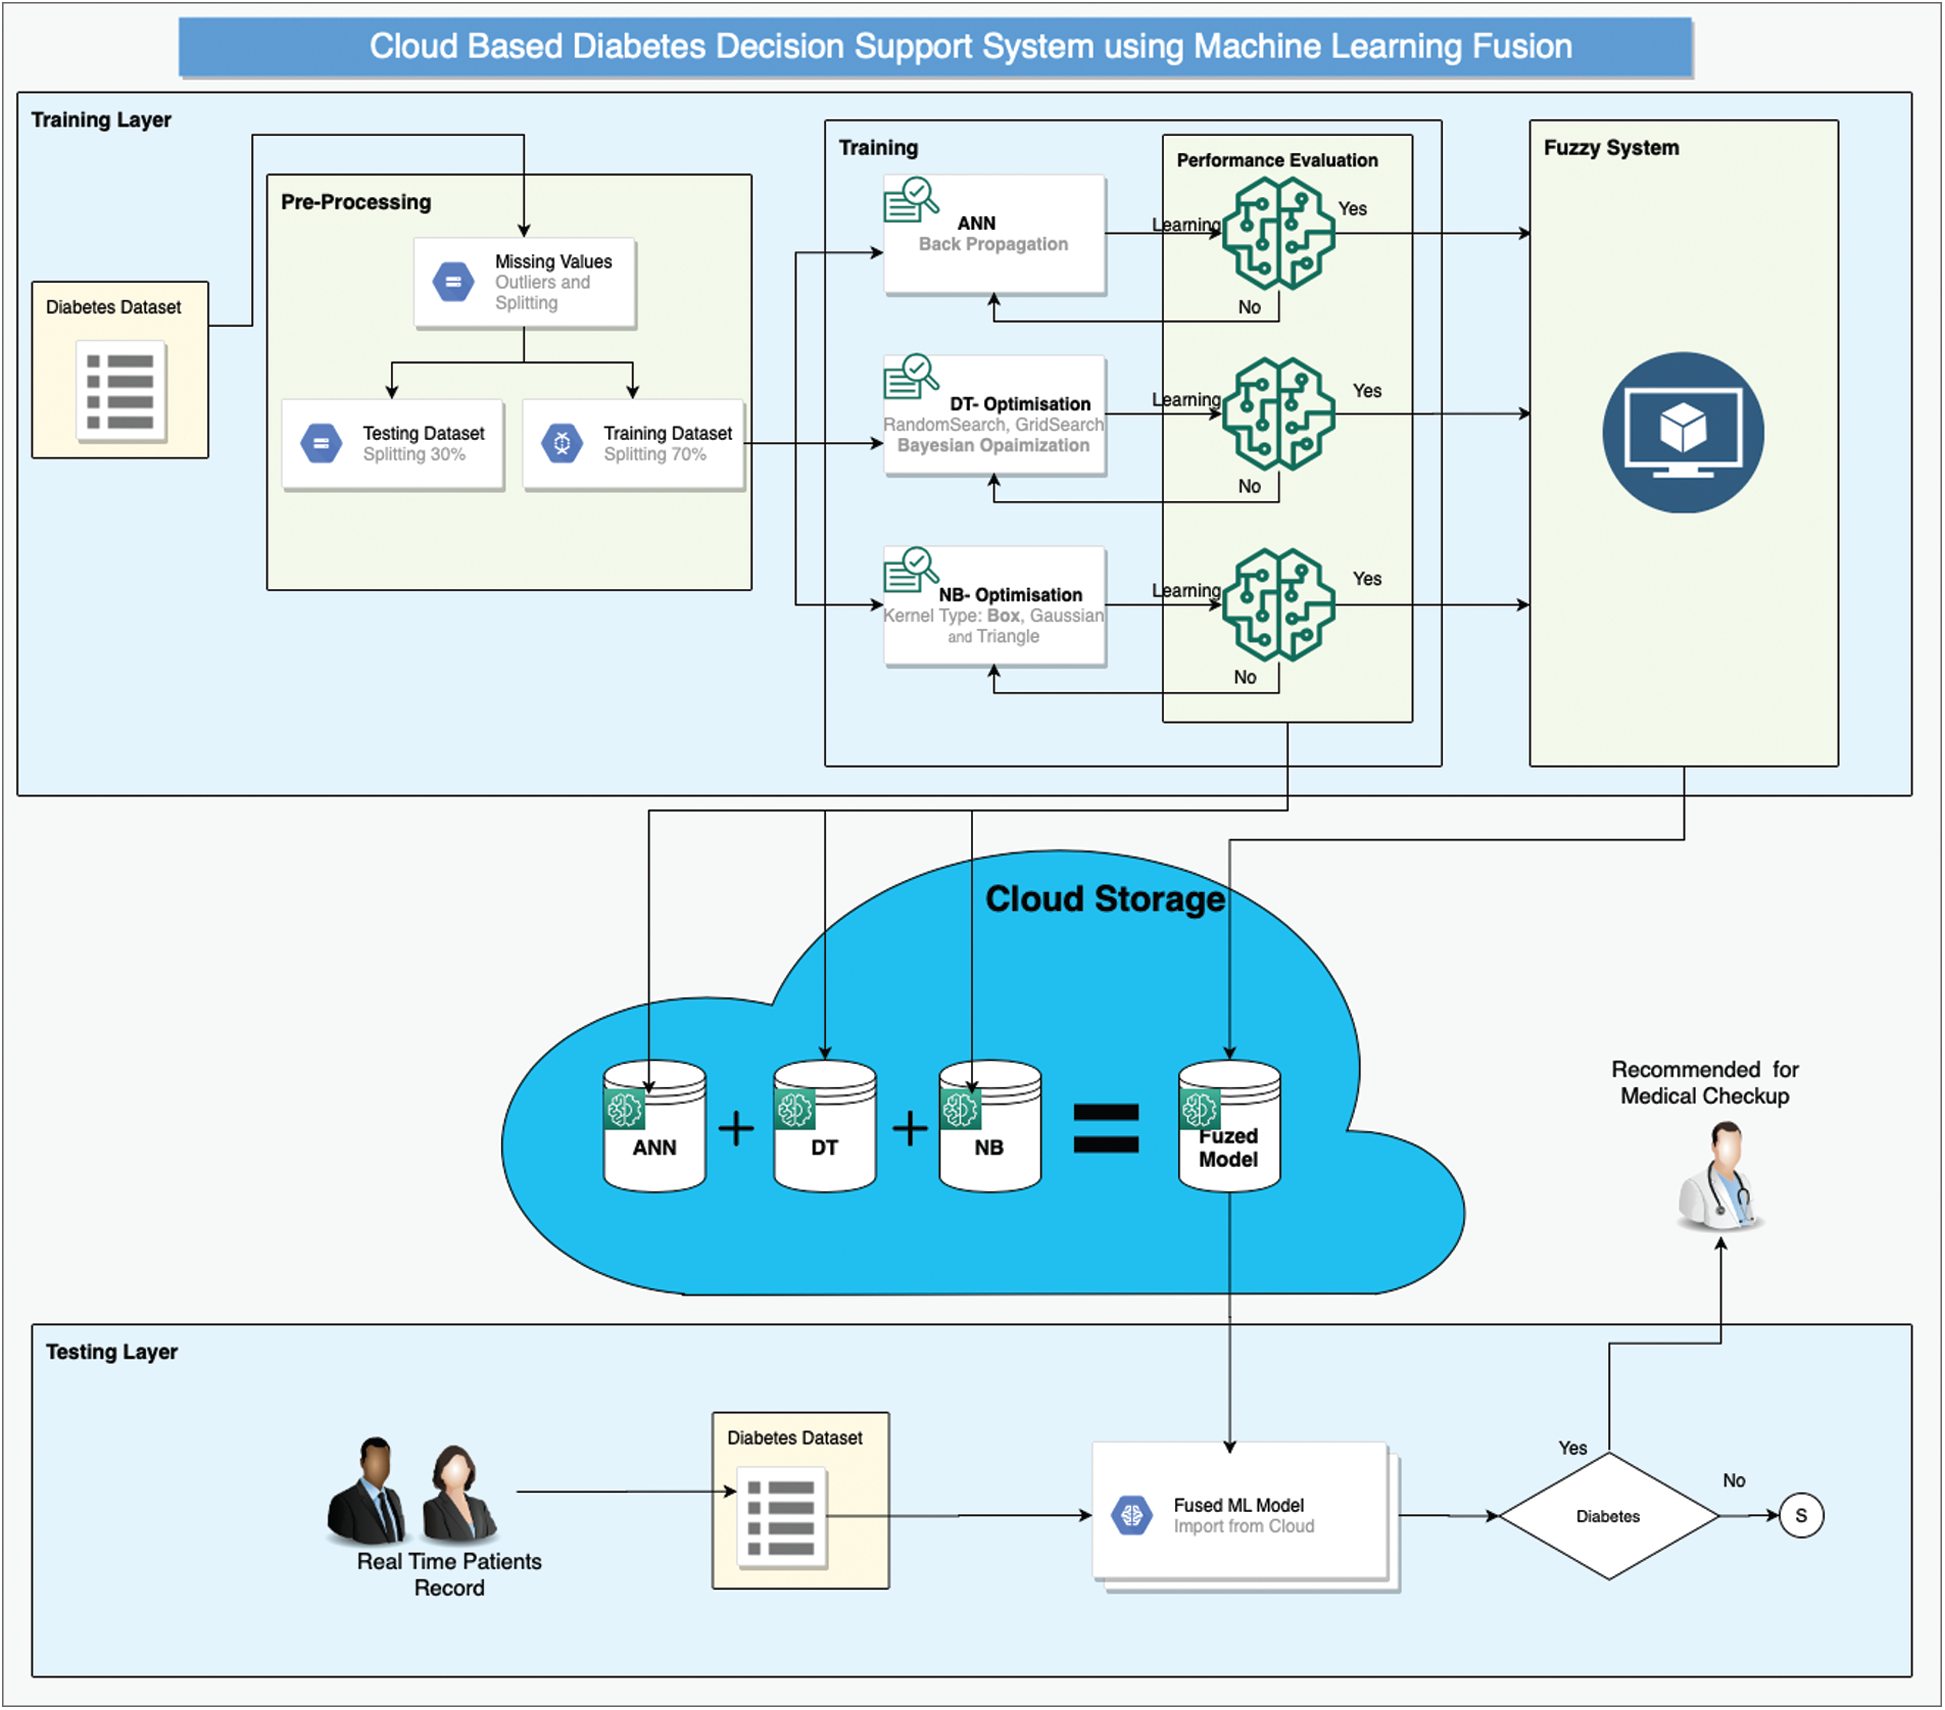
Figure 1: CBD-DSS-FM using machine-learning fusion
The training layer begins with the selection of a proper dataset. In the present study, we selected a pre-labeled dataset of diabetes patients [21] for the implementation of our proposed framework. This dataset consists of 15,000 instances and a total of 10 features, of which nine features are independent and one, the output class, is dependent. The pre-processing layer of our proposed framework involves two stages: 1) Data cleaning and normalization and 2) data splitting. Data cleaning removes missing values using the mean imputation method, while normalization brings the values of all features into a certain range. Both activities help the classification process achieve higher performance/accuracy. After data cleaning and normalization, the dataset is divided into training data and test data at a ratio of 70:30 on the basis of class split.
After pre-processing is the classification process, which consists of training of three widely-used supervised classification techniques: ANN, DT, and naïve Bayes (NB). This layer receives input from the training set and test set in the pre-processing stage and provides three prediction results for the next stage. All three classification algorithms must be optimized to achieve maximum accuracy. During ANN configuration, we used one hidden layer with 10 neurons and backpropagation technique to tune the weights. We used a multi-layer perceptron with at least one hidden layer besides the input and output layers. The steps involved in backpropagation are as follows: initialization of weight, feed forward, backpropagation of error, and updating of weight and bias. Every neuron present in the hidden layer has an activation function such as f(x) = Sigmoid(x). The sigmoid function for input and the hidden layer of the proposed BPNN can be written as
Input derived from the output layer is
The output layer activation function is
Backpropagation error is represented by the above equation, where,
After applying the chain rule method, the above equation can be stated as
By substituting the values in Eq. (7), the value of weight changed can be obtained as presented in Eq. (8).
where,
Then, we apply the chain rule method for the updating of weights between input and hidden layers:
After simplification, the above equation can be stated as
where
Eq. (10) is used for updating the weights between hidden layers and output.
Eq. (11) is used for updating the weights between the input and hidden layer.
In DT, we used three optimizers one by one: Random search, Bayesian optimization, and grid search. Bayesian optimization performed well and was hence selected for this framework.
GINI index is
and information gain is
In machine learning, information gain is used to define a desired sequence of attributes for investigation of the most rapidly reduced state of S. DT depicts how each stage depends on the outcomes of the analysis of the last attribute; applied in the area of machine learning, this is known as decision-tree learning. An element with high mutual information must be preferred to other attributes.
Here, f(z) serves to minimize error rate, or Root mean squared error (RMSE), assessed on the validation set. z can take on any value from domain Z, and z* is the set of hyper-parameters that relent the lowest value of the score. In simple terms, we aimed to find the model hyper-parameters that would deliver the best score on the validation set metric. This model is known as a “surrogate,” which is represented as
We intended to optimize expected improvement with respect to proposed set of hyper-parameters n. Here, z* is an edge value of the objective function, whereas z depicts the actual value of the function using hyper-parameters n, and
The hyper-parameters are not expected to produce any improvement if
The
z* is the minimum observed true objective function score, whereas z stands for new scores. To maximize the expected improvement result under the Gaussian Process model, the new score z must be less than the current minimum score (z < z*), hence the max (z* − z, 0) can be a large positive number where z < z* shows a lower value of the objective function than the threshold.
Our rationale for this equation is that we have two different distributions for the hyper-parameters: the first represents where the value of the objective function is less than the threshold, l(n), and the other where the value of the objective function is greater than the threshold, g(n).
To increase expected improvement, points with high probability under l(n) and low probability under g(n) might be chosen as the next hyper-parameter.
In NB, three kernel types are used: Box, Gaussian, and Triangle.
The traditional NB classifier estimates probabilities by an approximation of the data through a function, such as a Gaussian distribution:
where
and the two-parameter Box–Cox transformations as
After particular optimization, each optimized model is stored in the cloud. The next stage of the training layer in our proposed framework deals with the creation and implementation of fuzzy logic on the results of optimized classification algorithms as shown in Fig. 2. This layer receives the results of ANN, DT, and NB and generates the output using fuzzy rules as shown in Figs. 3 and 4, which is again stored in the cloud.
Conditional or if-then statements are used to make fuzzy logic. On the basis of these statements, fuzzy rules are constructed as follows:
IF (NeuralNetwork is yes and NaïveBayes is yes and DecisionTree is yes) THEN (Diabetes is yes).
IF (NeuralNetwork is yes and NaïveBayes is yes and DecisionTree is no) THEN (Diabetes is yes).
IF (NeuralNetwork is yes and NaïveBayes is no and DecisionTree is yes) THEN (Diabetes is yes).
IF (NeuralNetwork is no and NaïveBayes is yes and DecisionTree is yes) THEN (Diabetes is yes).
IF (NeuralNetwork is no and NaïveBayes is no and DecisionTree is also no) THEN (Diabetes is no).
IF (NeuralNetwork is yes and NaïveBayes is no and DecisionTree is no) THEN (Diabetes is no).
IF (NeuralNetwork is no and NaïveBayes is no and DecisionTree is yes) THEN (Diabetes is no).
IF (NeuralNetwork is no and NaïveBayes is yes and DecisionTree is no) THEN (Diabetes is no).
In formulating the rules, it is evident that if any two of the three supervised classification techniques are true, then diabetes is true; otherwise, diabetes is false.
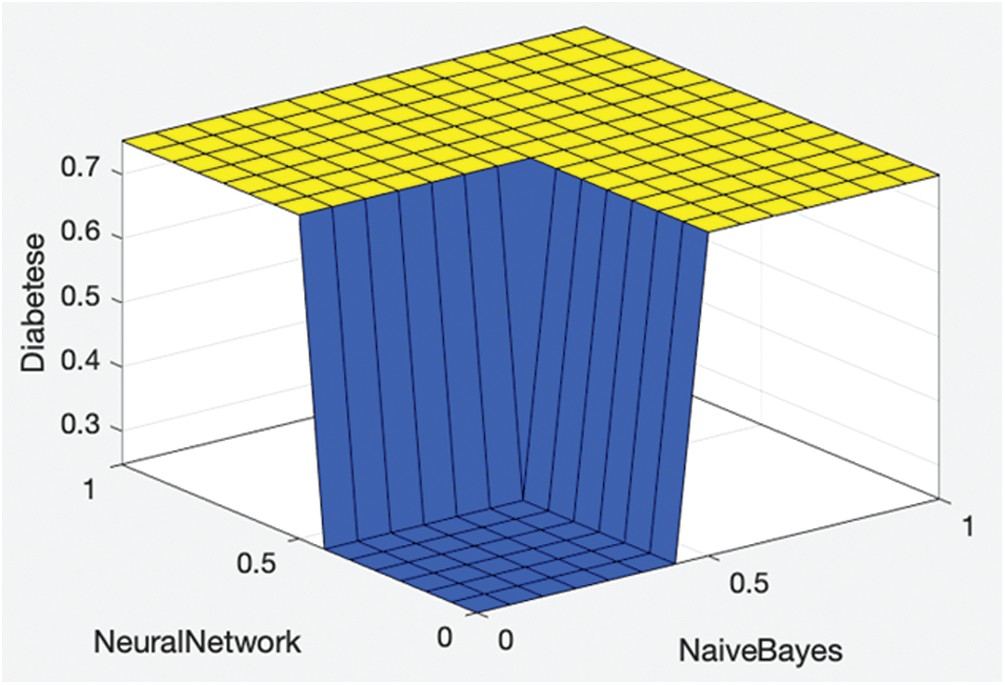
Figure 2: Proposed fused ML rule surface
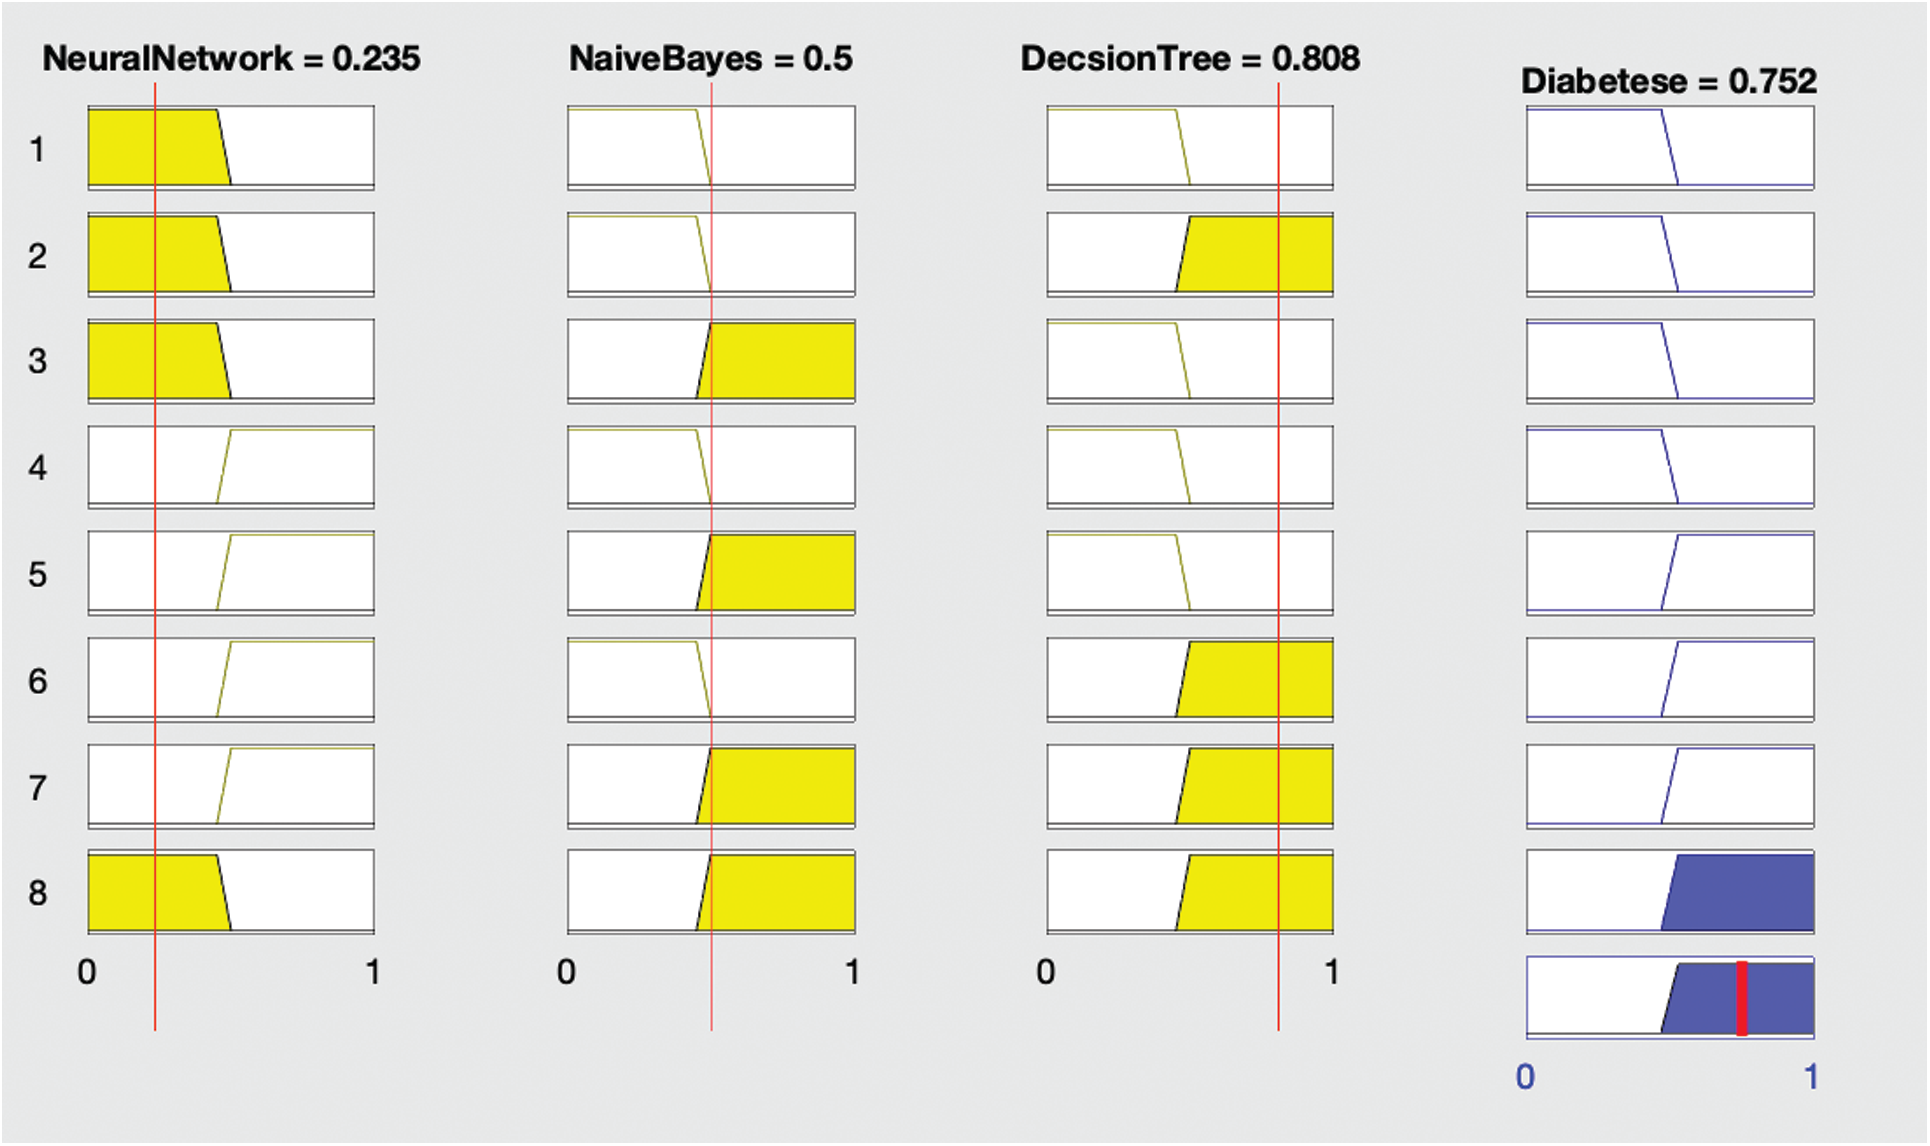
Figure 3: Proposed fused ML result with diabetes (yes)
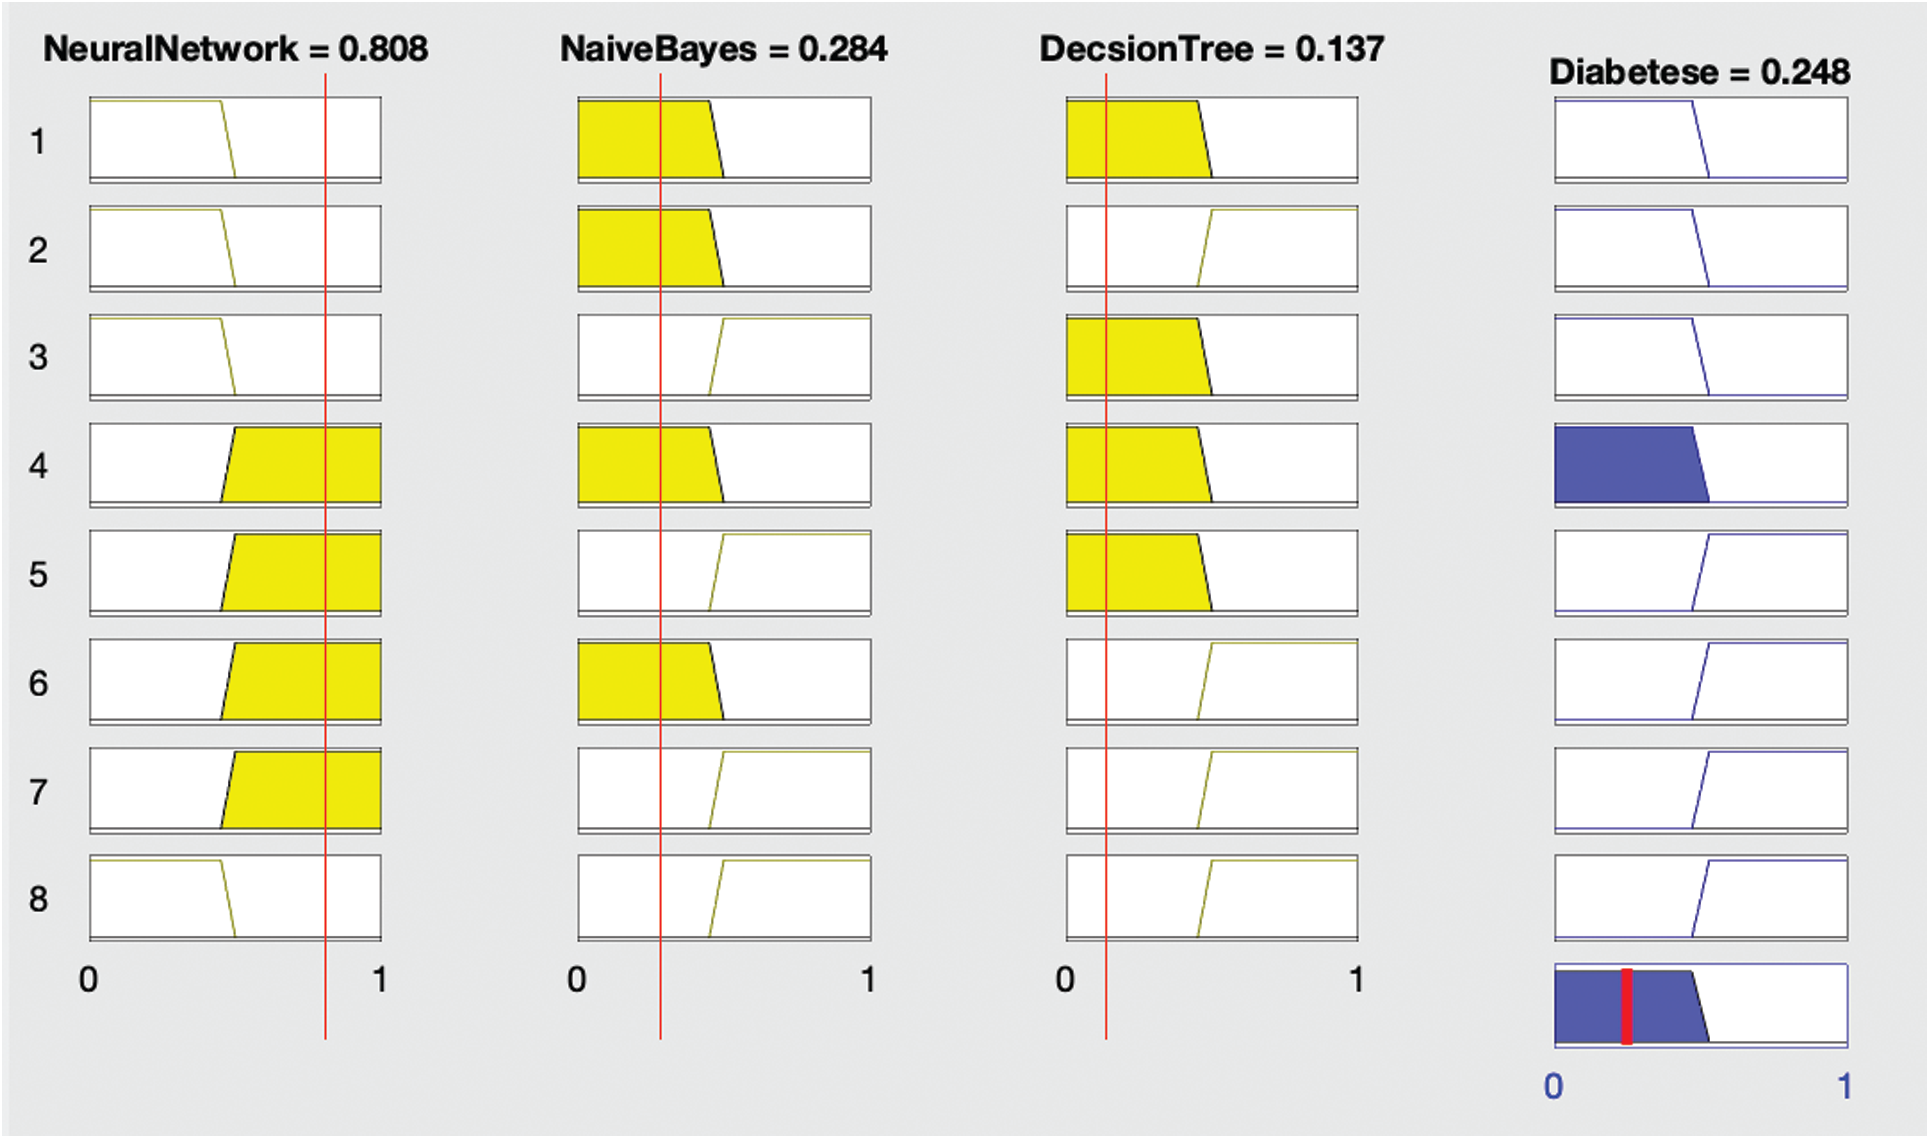
Figure 4: Proposed fused ML result with diabetes (no)
Fig. 2 shows the proposed fused ML rule surface of diabetes with respect to the neural network and naïve Bayes results. If both neural network and naive Bayes solutions predict no diabetes, then the resultant fused ML also predicts no diabetes; otherwise, the fused ML predicts diabetes.
Fig. 3 shows that if the neural network diagnoses no diabetes and remaining algorithms—naïve Bayes and decision tree—both diagnose diabetes, then the fused ML diagnoses the patient with diabetes.
Fig. 4 shows that if all three algorithms—neural network, naïve Bayes, and decision tree—diagnose no diabetes, then the fused ML also diagnoses no diabetes.
The second layer of the proposed framework deals with the real-time classification of diabetic patients. The real-time patient data can be given as input to the proposed machine-learning fuzzed model, and appointments can be made on the basis of the results. If any patient is predicted to be a diabetic, then he or she is appointed to an early slot on an emergency basis; meanwhile, if the patient is predicted to be a non-diabetic, then he or she can be given an appointment following the regular schedule.
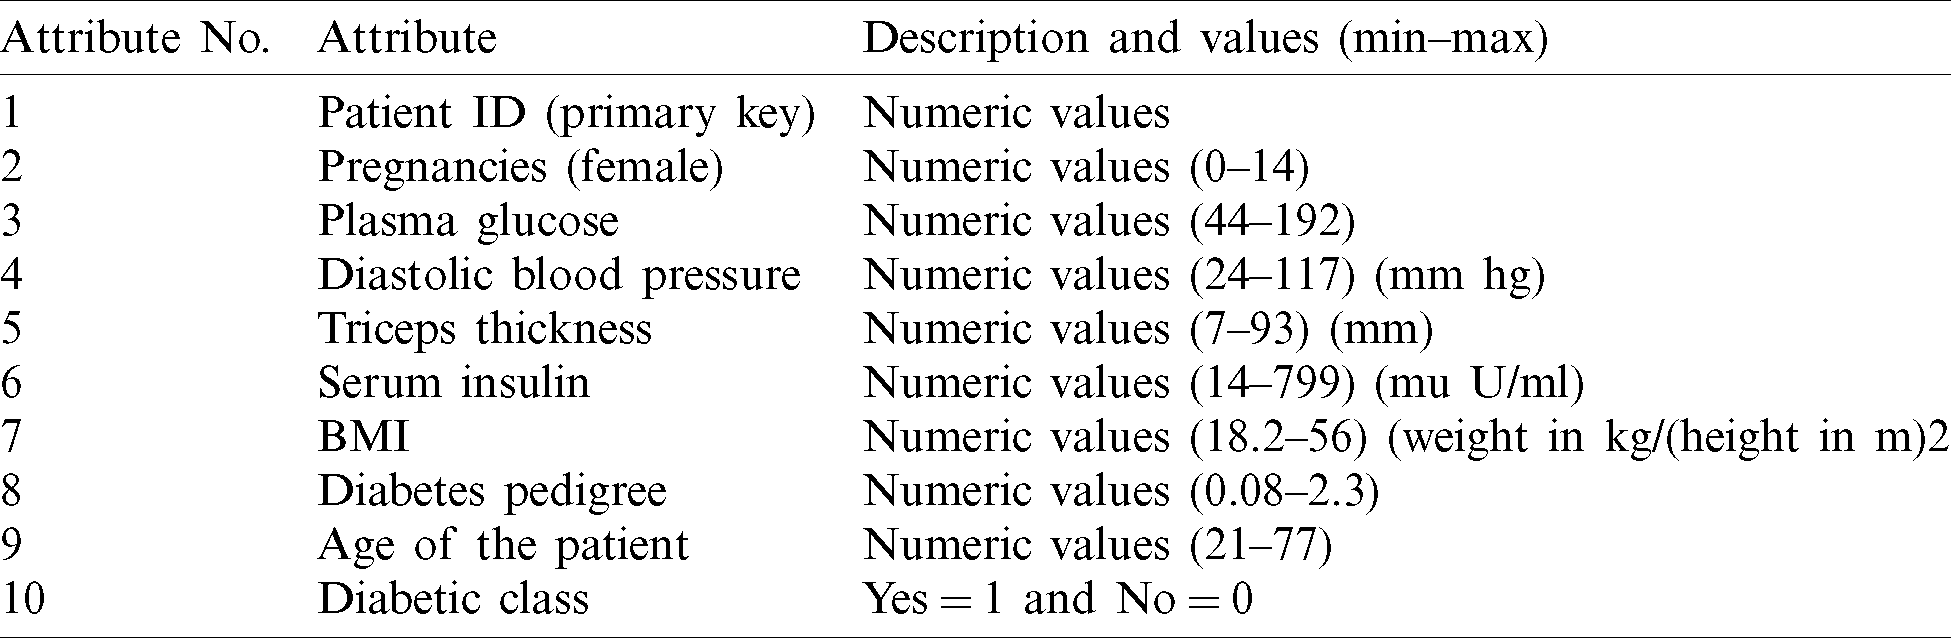
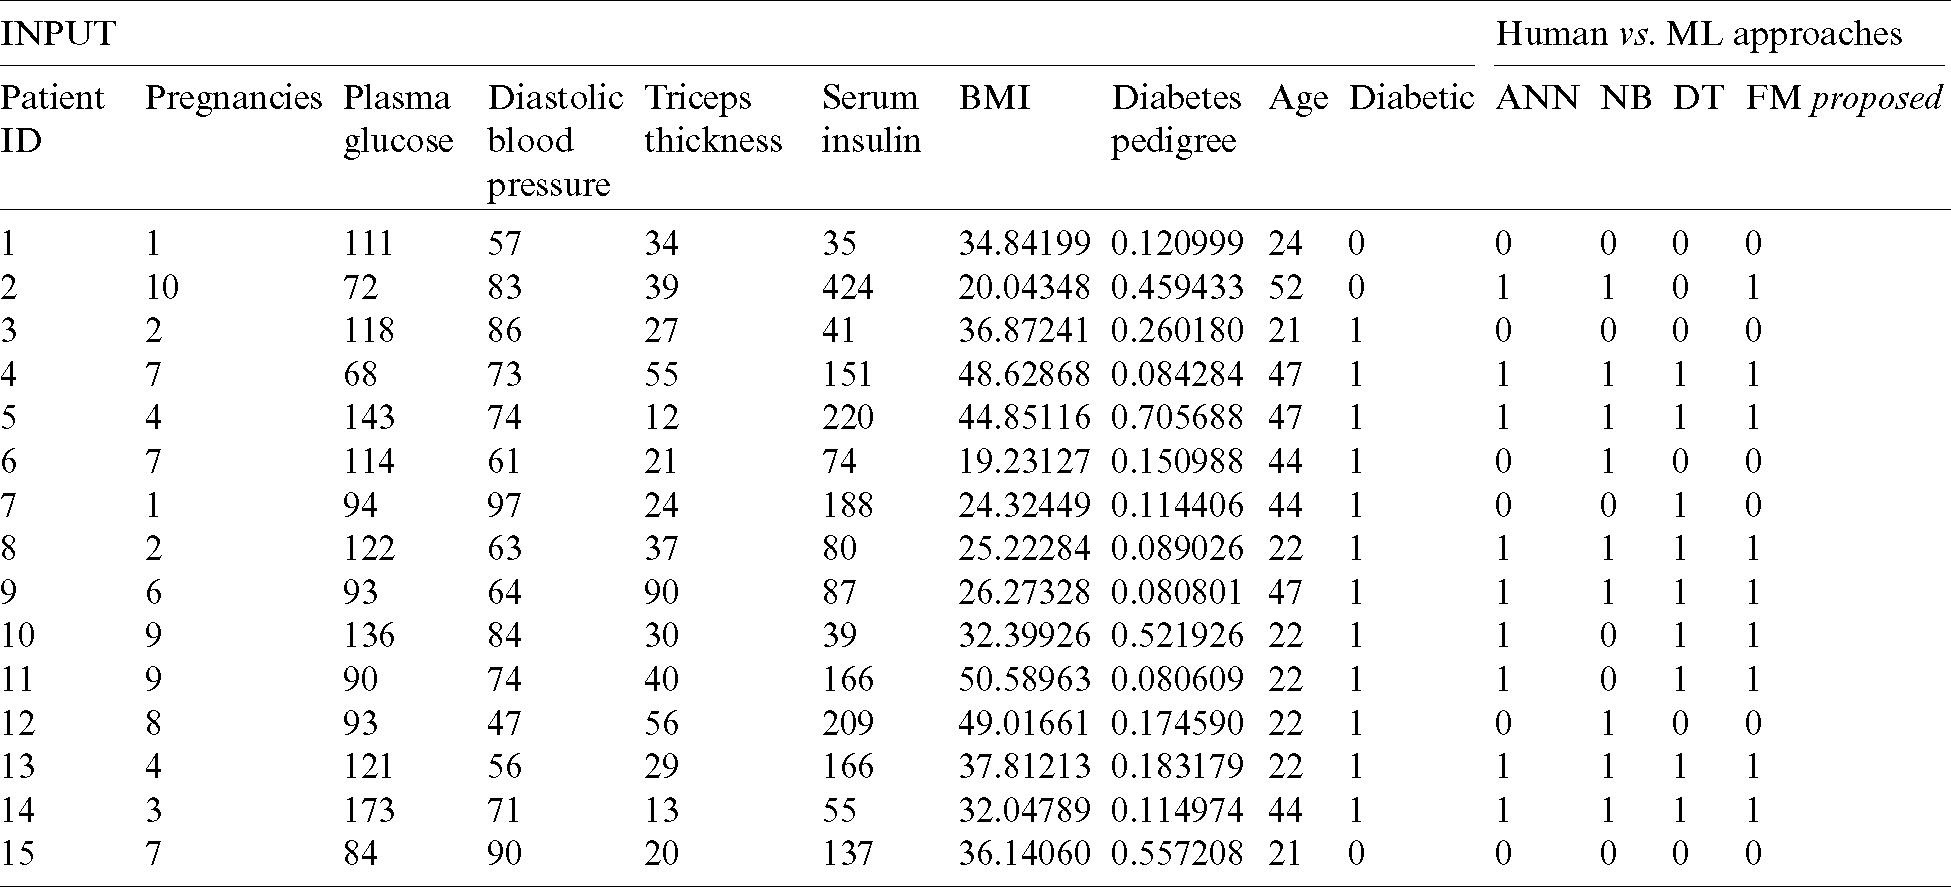
To implement the proposed framework, we used a dataset [21] consisting of 10 features and 15,000 instances as shown in Tab. 1. The first nine features were independent features used as inputs to calculate and predict the tenth feature, the output class indicating whether the particular patient is suffering from diabetes or not. If the value of this feature is 1, the patient is diabetic, and if the value is 0, the patient is non-diabetic.
We divided the dataset into two parts, 70% training data (10,500) and 30% test data (4,500). We performed the pre-processing activities of cleaning and normalization on the dataset prior to classification. For classification of the dataset, we used three machine learning algorithms: ANN, DT, and NB. We optimized these techniques iteratively until we achieved maximum performance. We applied various statistical measures to assess the performance of the classification techniques as shown below.
where RO0, RO1, EO0 and EO1 represent the predicted positive output, predicted negative output, expected positive output, and expected negative output, respectively.
First, we used ANN to classify the dataset. We used one hidden layer consisting of nine neurons while designing the structure of the neural network. We used 70% of the dataset, consisting of 10,500 records, for training the model and the remaining 30% of the dataset, consisting of 4,500 records, for testing. Of the 10,500 records reserved for training, 7,000 were negative and 3,500 were positive. During the training process with ANN, 6,801 records were classified as negative and 3,273 were classified as positive. After comparing the expected results with the output results shown in Tab. 2, we achieved 96% accuracy with a 4% miss rate. In testing with ANN, 2,831 records were classified as negative and 1,285 were classified as positive (Tab. 2). The accuracy rate of ANN in the testing stage was 91.5% and the miss rate was 8.5%.
Table 2: Artificial neural network (ANN)

During the training process with DT, 6,801 records were classified as negative and 3,273 were classified as positive. After comparison of the expected negative and positive records with the output results of the training process with DT (Tab. 3), we achieved an accuracy rate of 95.9% and miss rate of 4.1%. During the testing process with DT, 2,898 records were classified as negative while 1,404 were classified as positive (Tab. 3). During our comparison of expected output with output of the testing process with DT, we achieved an accuracy rate of 94.9% and miss rate of 5.1%.

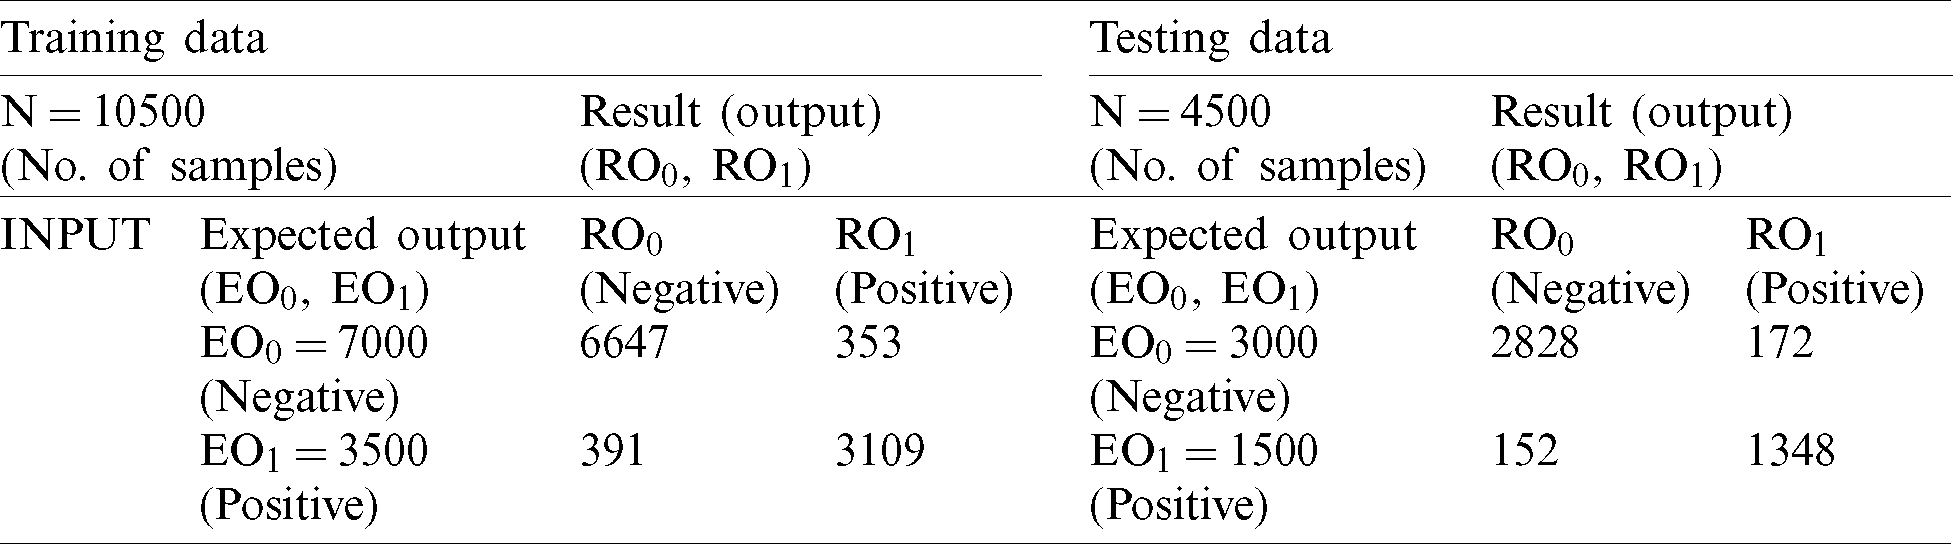
During training with NB, 6,647 records were classified as negative and 3,109 were classified as positive. After comparing the achieved output of NB in the training stage with the expected output (Tab. 4), we achieved 92.91% accuracy and a miss rate of 7.09%. During the testing process, we used 4,500 records (30% of the dataset) for validation. Of these records, 3,000 were negative and 1,500 records were positive. The NB classified 2,828 records as negative and 1,348 as positive. After comparison with the expected output (Tab. 4), the proposed model achieved an accuracy rate of 92.8% and miss rate of 7.2%.
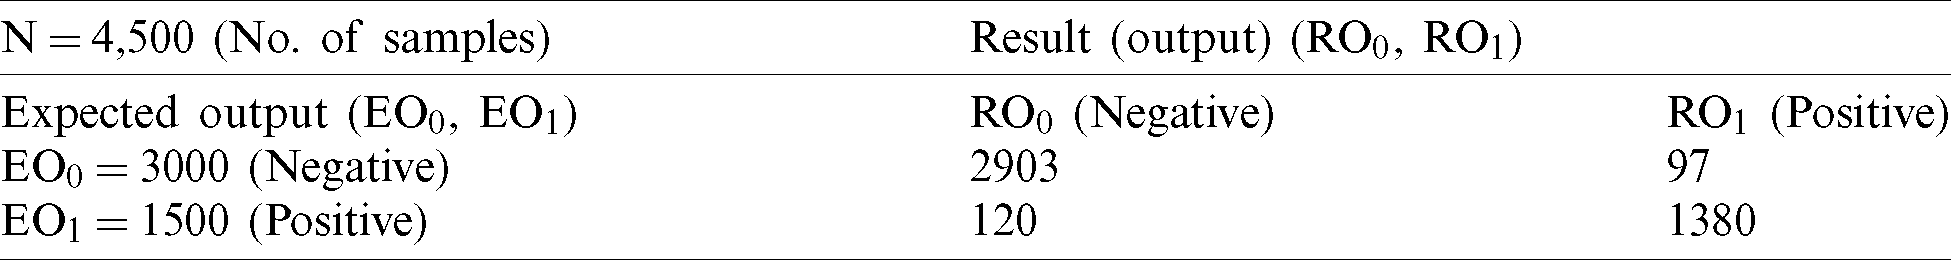
Finally, we inputted all of the records of test data into the fuzzy system along with the output class for the final decision. The fuzzy system classified 2,903 records as negative and 1,380 as positive (Tab. 5). During comparison of expected output and fuzzy system output, we achieved 95.2% accuracy with a miss rate of 4.8%.
Table 5: FM proposed (testing)
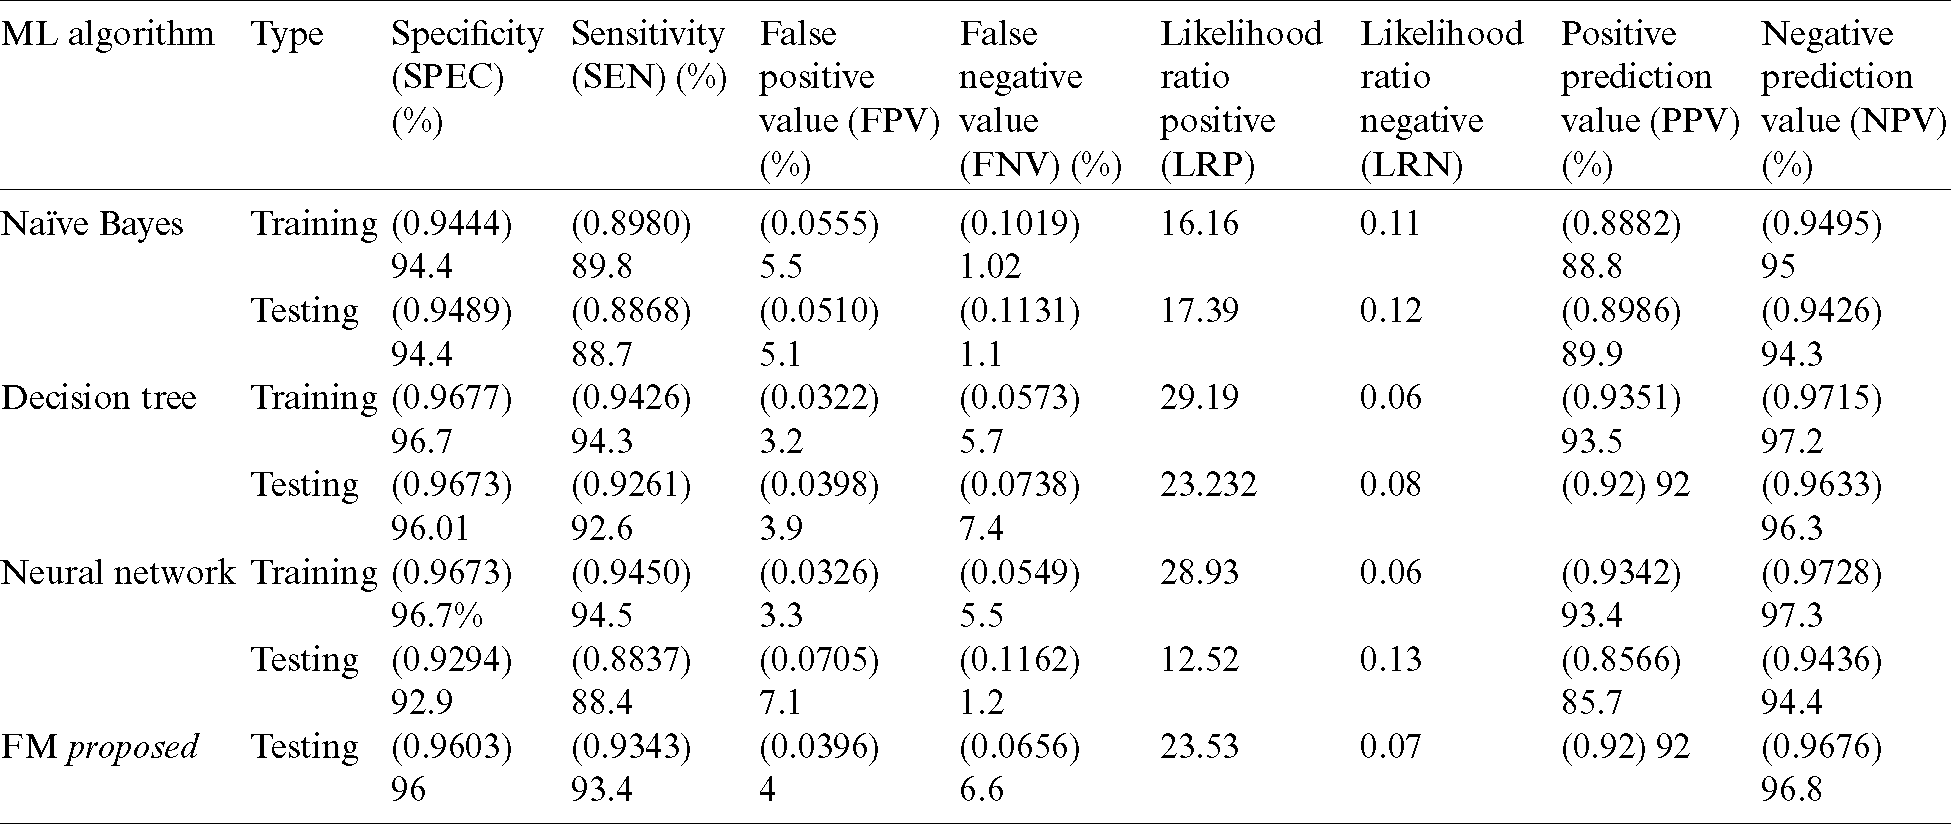
Tab. 6 presents detailed results of the three classification techniques along with those of our proposed model (FM). In testing, the fuzzy model outperformed other algorithms in all applied accuracy measures.
Table 6: Detailed results of proposed decision support system
Tab. 7 reflects the detailed results of our proposed fused model along with input and output. We can observe that the real-time input parameters of the patients were given to the decision support system, where the three classifiers individually predicted diabetes diagnosis and the fuzzy inference system then formulated the final result.
Table 7: Performance analysis of proposed decision support system
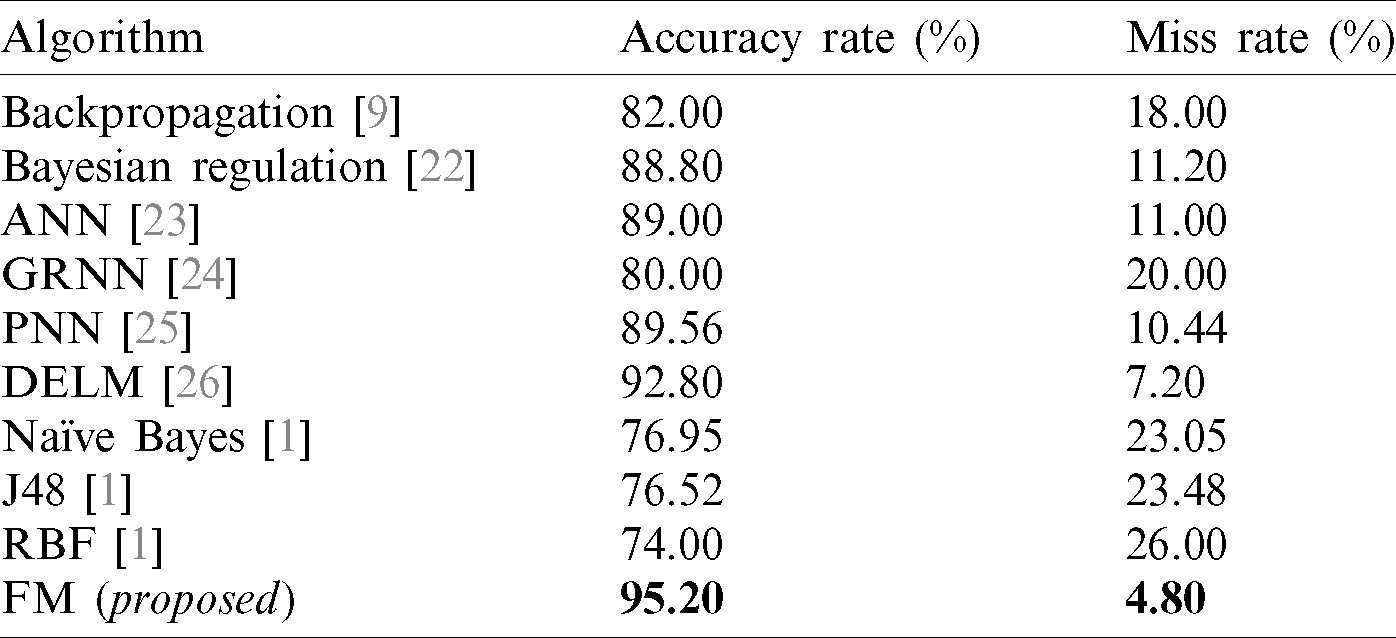
Tab. 8 displays the accuracy and error rates achieved by our proposed framework in comparison with other algorithms previously applied in diabetes diagnosis. The results obtained from the fused model in the proposed framework are compared with backpropagation [9], Bayesian regulation [22], ANN [23], GRNN [24], PNN [25], DELM [26], NB [1], J48 [1], and RBF [1]. The data indicates that our proposed FM framework significantly outperformed the algorithms used in previous research.
Table 8: Accuracy comparison of decision support systems
Early diagnosis of diabetes using machine-learning techniques is a challenging task. In this paper, we proposed a novel cloud-based decision-support system for diabetes prediction using a fused machine-learning technique. Our proposed system integrates the classification accuracy of three supervised machine-learning techniques (ANN, NB, and DT) with a fuzzy inference system to generate accurate predictions. Our system consists of two layers: training and testing. The training layer initiates with data pre-processing activities—data cleaning and normalization—and is followed by data splitting for classification. In our study, we divided the dataset for training and testing at a ratio of 70:30 to optimize classification techniques and yield more accurate results in the validation data. After pre-processing, we executed the classification process, which involved training of the three classification techniques (ANN, NB, and DT) followed by validation on our selected dataset. We optimized these techniques until maximum accuracy was achieved. Finally, using a fuzzy system, we synthesized the three prediction results from the three classification techniques to generate the final prediction output. In our study, our proposed system achieved an accuracy rate of 95.2%, outperforming previously applied machine-learning techniques for diabetes diagnosis.
Acknowledgement: The authors thank their families and colleagues for their continued support.
Funding Statement: The author(s) received no specific funding for this study.
Conflicts of Interest: The authors declare that they have no conflicts of interest to report regarding the present study.
1. S. Sadi, A. Maleki, R. Hashemi, Z. Panbechi and K. Chalabi. (2015). “Comparison of data mining algorithms in the diagnosis of type II diabetes,” International Journal on Computational Science & Applications, vol. 5, no. 5, pp. 1–12. [Google Scholar]
2. A. B. Olokoba, O. A. Obateru and L. B. Olokoba. (2012). “Type 2 diabetes mellitus: A review of current trends,” Oman Medical Journal, vol. 27, no. 4, pp. 269–292. [Google Scholar]
3. M. Khashei, S. Eftekhari and J. Parvizian. (2012). “Diagnosing diabetes type II using a soft intelligent binary classification model,” Review of Bioinformatics and Biometrics, vol. 1, no. 1, pp. 9–23. [Google Scholar]
4. S. Chatterjee, K. Khunti and M. J. Davies. (2017). “Type 2 diabetes,” Lancet, vol. 389, no. 10085, pp. 2239–2251. [Google Scholar]
5. B. Zebardast, R. Rashidi, T. Hasanpour and F. S. Gharehchopogh. (2014). “Artificial neural network models for diagnosing heart disease: A brief review,” International Journal of Academic Research, vol. 6, no. 3, pp. 73–78. [Google Scholar]
6. M. Sikandar, R. Sohail, Y. Saeed, A. Zeb, M. Zareei et al. (2020). , “Analysis for disease gene association using machine learning,” IEEE Access, vol. 8, pp. 160616–160626. [Google Scholar]
7. S. I. Ayon and M. M. Islam. (2019). “Diabetes prediction: A deep learning approach,” International Journal of Information Engineering & Electronic Business, vol. 11, no. 2, pp. 21–27. [Google Scholar]
8. N. S. E. Jerjawi and S. S. Abu-Naser. (2018). “Diabetes prediction using artificial neural network,” International Journal of Advanced Science and Technology, vol. 121, pp. 54–64. [Google Scholar]
9. B. D. Kanchan and M. M. Kishor. (2017). “Study of machine learning algorithms for special disease prediction using principal of component analysis,” in Int. Conf. on Global Trends in Signal Processing, Information Computing and Communication, Jalgaon, India, pp. 5–10. [Google Scholar]
10. A. Iyer, S. Jeyalatha and R. Sumbaly. (2015). “Diagnosis of diabetes using classification mining techniques,” International Journal of Data Mining and Knowledge Management Process, vol. 5, no. 1, pp. 1–14. [Google Scholar]
11. B. M. Patil, R. C. Joshi and D. Toshniwal. (2010). “Hybrid prediction model for type-2 diabetic patients,” Expert System and Applications, vol. 37, no. 12, pp. 8102–8108. [Google Scholar]
12. R. Sanakal and S. T. Jayakumari. (2014). “Prognosis of diabetes using data mining approach-fuzzy c means clustering and support vector machine,” International Journal of Computer Trends and Technology, vol. 11, no. 2, pp. 94–98. [Google Scholar]
13. R. M. Rahman and F. Afroz. (2013). “Comparison of various classification techniques using different data mining tools for diabetes diagnosis,” Journal of Software Engineering and Applications, vol. 6, no. 3, pp. 85–97. [Google Scholar]
14. K. V. S. R. P. Varma, A. A. Rao, T. S. M. Lakshmi and P. V. Nageswara Rao. (2014). “A computational intelligence approach for a better diagnosis of diabetic patients,” Computers & Electrical Engineering, vol. 40, no. 5, pp. 1758–1765. [Google Scholar]
15. M. W. Nadeem, H. G. Goh, A. Ali, M. Hussain and M. A. Khan. (2020). “Bone age assessment empowered with deep learning: A survey, open research challenges and future directions,” Diagnostics, vol. 10, no. 10, pp. 781–804. [Google Scholar]
16. F. Beloufa and M. A. Chikh. (2013). “Design of fuzzy classifier for diabetes disease using modified artificial bee colony algorithm,” Computer Methods and Programs in Biomedicine, vol. 112, no. 1, pp. 92–103. [Google Scholar]
17. R. Z. Islamic. (2012). “Diagnosis of diabetes in female population of pima indian heritage with ensemble of BP neural network and svm,” International Journal of Computer Engineering and Management, vol. 15, pp. 2230–7893. [Google Scholar]
18. B. Junior and M. D. C. Nicoletti. (2019). “An iterative boosting-based ensemble for streaming data classification,” Information Fusion, vol. 45, no. 2, pp. 66–78. [Google Scholar]
19. E. Saleh, J. Błaszczyński, A. Moreno, A. Valls, P. R. Aroca et al. (2018). , “Learning ensemble classifiers for diabetic retinopathy assessment,” Artificial Intelligence in Medicine, vol. 85, pp. 50–63. [Google Scholar]
20. L. Nanni, A. Lumini and N. Zaffonato. (2018). “Ensemble based on static classifier selection for automated diagnosis of mild cognitive impairment,” Journal of Neuroscience Methods, vol. 302, pp. 42–46. [Google Scholar]
21. F. Fernandez. (2018). “Diabetes from dat263x lab01, predict who has and who doesn’t have diabetes from physical data,” Kaggle.com, . [Online]. Available: https://www.kaggle.com/fmendes/diabetes-from- dat263x-lab01/metadata. [Google Scholar]
22. B. J. Lee and J. Y. Kim. (2015). “Identification of type 2 diabetes risk factors using phenotypes consisting of anthropometry and triglycerides based on machine learning,” IEEE Journal of Biomedical and Health Informatic, vol. 20, no. 1, pp. 39–46. [Google Scholar]
23. H. Khalid, M. Hussain, M. A. A. Ghamdi, T. Khalid, M. A. Khan et al. (2020). , “A comparative systematic literature review on knee bone reports from MRI, X-rays and ct scans using deep learning and machine learning methodologies,” Diagnostics, vol. 10, no. 8, pp. 518–542. [Google Scholar]
24. M. Mahmud, N. Aldhafferi and A. Alqahtani. (2018). “Security analysis of liveness authentication of human iris templates: A deep learning approach,” Journal of Medical Imaging and Health Informatics, vol. 8, no. 5, pp. 1021–1025. [Google Scholar]
25. T. A. Rashid, S. M. Abdullah and R. M. Abdullah. (2016). “An intelligent approach for diabetes classification, prediction and description,” Innovations in Bio-Inspired Computing and Applications, vol. 424, pp. 323–335. [Google Scholar]
26. A. Rehman, A. Athar, M. A. Khan, S. Abbas, A. Fatima et al. (2020). , “Modelling, simulation, and optimization of diabetes type II prediction using deep extreme learning machine,” Journal of Ambient Intelligence and Smart Environments, vol. 12, no. 2, pp. 125–138. [Google Scholar]
 | This work is licensed under a Creative Commons Attribution 4.0 International License, which permits unrestricted use, distribution, and reproduction in any medium, provided the original work is properly cited. |