DOI:10.32604/cmc.2021.016483
| Computers, Materials & Continua DOI:10.32604/cmc.2021.016483 | |
| Article |
Classification of Emergency Responses to Fatal Traffic Accidents in Chinese Urban Areas
1College of Civil Aviation, Nanjing University of Aeronautics and Astronautics, Nanjing, 211106, China
2Jiangsu Police Institute, Nanjing, 210031, China
3Department of Mechanical and Aerospace Engineering, Center for Applied Biomechanics, University of Virginia, Charlottesville, VA 22911, USA
*Corresponding Author: Qun Wang. Email: wqun@jspi.edu.cn
Received: 03 January 2021; Accepted: 10 February 2021
Abstract: Fatal traffic accidents in urban areas can adversely affect the urban road traffic system and pose many challenges for urban traffic management. Therefore, it is necessary to first classify emergency responses to such accidents and then handle them quickly and correctly. The aim of this paper is to develop an evaluation index system and to use appropriate methods to investigate emergency-response classifications to fatal traffic accidents in Chinese urban areas. This study used a multilevel hierarchical structural model to determine emergency-response classification. In the model, accident attributes, urban road network vulnerability, and institutional resilience were used as classification criteria. Each evaluation indicator was selected according to importance ranking and independence screening and was given an interpretation and a quantitative criterion. The Fuzzy Delphi Method was used to rank the importance of the evaluation indices and the combined weight of each index was calculated using the G1 method. Finally, the case of a fatal traffic accident was used to validate the model. The results showed that the multilevel hierarchical structural model, Fuzzy Delphi Method, and G1 method can effectively address the problem of emergency-response classification. Because of its simplicity and adaptability, the approach presented here could be useful for decisionmakers and practitioners for determining emergency-response classifications.
Keywords: Emergency-response classifications; fatal traffic accidents; {Chinese} urban areas; fuzzy Delphi method; G1 method; institutional resilience; evaluation
Today, various natural and manmade disasters, such as earthquakes, hurricanes, floods, epidemics, fires, terrorist attacks, chemical spills, and explosions, are frequent occurrences. An emergency can refer to more than a disaster or catastrophe; smaller disruptive incidents, such as serious traffic accidents, can be called emergencies as well [1]. The World Health Organization (WHO) reported that the number of traffic deaths has remained high, with 1.35 million fatalities worldwide in 2016, about one-fifth of which occurred in China [2]. Traffic fatalities therefore pose a public health issue in China. By the end of 2018, the number of China’s urban and town residents had reached 83.13 million, nearly 60% of whom inhabited cities [3]. A population-based study of 21 cities showed that road traffic injury prevalence among urban Chinese residents was 13.2%, based on a retrospective 12-month reporting window [4]. Compared to rural areas, urban areas are more densely populated, highly modernized, and concentrated in social wealth. Moreover, fatal traffic accidents in Chinese urban areas have a greater effect on the road traffic system in a wider scope, which poses a new challenge to the urban road traffic management. As such, quick and proper emergency-response measures must be taken when serious traffic accidents occur.
In the Procedural Regulations for Handling Road Traffic Accidents [5], traffic accidents are classified as property-damage-only accidents, injury accidents, and fatal accidents. A fatal accident is one that causes human deaths. Therefore, emergency-response activities should be conducted quickly and properly after a fatal accident in an urban area. An emergency response is a type of public service provided by the government [6]. In China, the first responders to emergencies differ based on the emergency type and scale.
The main purpose of classifying emergency responses to fatal traffic accidents in Chinese urban areas is to quickly and accurately determine the emergency-response providers, measures, and resources that must be mobilized to avoid “insufficient responses or overreactions.” Determining the appropriate emergency-response providers is the primary target of emergency response. Furthermore, in China, the higher the level of emergency response is, the higher the level of corresponding authorities is, the stronger the coordination ability is, and the wider the range of available resources becomes. Thus, the simple and easy classification of emergency responses to fatal traffic accidents is conducive to rapidly determining the appropriate emergency-response providers, emergency-management procedures, and traffic-operation measures. It is also important to minimize the impact of accidents on the urban traffic system and maintain normal traffic operations.
Emergency classifications are mainly divided into three types: early warning classifications, emergency-response classifications, and rehabilitation and reconstruction [7]. Each has different objects and evaluation indices. In early warning classification, emergency attributes such as degree, development trend, and possible damage are considered, with the purpose of determining which emergency preparedness plan should be activated. The rehabilitation and reconstruction classification, meanwhile, is a kind of accountability classification that is intended to derive lessons from emergency handling, pursue liabilities, and take improvement measures. Finally, emergency-response classification is a link between early warning classification and post-emergency evaluation classification. The evaluation index system for emergency-response classification should consider not only the attributes of the emergency but also the vulnerability of hazard-affected bodies and the institutional resilience of emergency-response providers.
Emergency classification has been widely studied in various emergency-management fields, including nuclear plant management [8,9], earthquakes [10], chemical spills [11], mine disasters [12], urban emergencies [13,14], transportation [15,16], meteorological disasters [17], and emergency supply chains [18].
There are many recent studies of emergency classification. Burnett [19] outlined a crisis-classification matrix to determine the emergency level (0–3) using a 16-cell matrix based on the threat level, response options, time pressure, and degree of control. Paul [20] proposed a five-class approach to determine emergency classification using the number of people killed (or injured/displaced/affected) and the area of impact as criteria. Emergency situations are usually classified according to the following types of criteria: time pressure, socioenvironmental factors (e.g., human victims, epidemics, and use of natural resources), socioeconomic factors (e.g., great hazard and increase in international tensions), economic factors (e.g., economic detriment, threat to financial and material resources, and traffic disruption), and organizational and managerial factors (e.g., unpredictable situations and the need to secure different types of expertise and organizations). Although the color-coded Homeland Security Advisory System has been repealed in the US, such a system is still widely adopted in China in early warning classifications, such as forecasting adverse weather, forest fire classification, and the Master State Plan for Rapid Responses to Public Emergencies [21]. Today, many practical methods have been applied to emergency classification, including the crisis matrix [17,19], analytic hierarchy process (AHP) [22], fuzzy analytic hierarchy process (FAHP) [23], fuzzy evaluation [24], support vector machine [25], cluster algorithm [26,27], decision-tree model [28], large group emergency decision [29], and other intelligent methods [30].
These previous studies have provided some classification criteria and analysis methods for emergency classification. However, the existing classification indicators mainly focus on early warning classification. There are more factors that influence emergency-response classification than early warning classification, including both internal and external factors. Some special evaluation indicators and quantitative methods should be specifically considered in the classification of emergency responses to fatal traffic accidents in Chinese urban areas.
Therefore, for the timely and effective handling of fatal traffic accidents in Chinese urban areas, it is necessary to further study the classification of emergency responses to fatal traffic accidents considering their characteristics. Such classification is a comprehensive evaluation process. The general steps in this study were as follows. First, a multilevel hierarchical structural evaluation index system was constructed based on the principles of establishing an evaluation index system. Next, a quantitative treatment of the determined evaluation index was conducted, and the index weight was calculated using the G1 method. Third, a comprehensive evaluation was carried out—that is, the comprehensive evaluation score was obtained by synthesizing all types of index values. Fourth, the comprehensive evaluation score was divided into several grades according to the preset classification method. Lastly, the emergency-response grade was determined.
3.1 Principles for Establishing Evaluation Index System
An evaluation index is the basis for accurately judging the emergency-response classification of fatal traffic accidents. Whether the index selection is appropriate will directly affect the feasibility of the evaluation process as well as the validity and reliability of the final evaluation result. In establishing a hierarchical evaluation indicator system for emergency responses, the proposed evaluation indicators should be guided by the following principles:
(1) Minimization and simplification of indicators
Rapid response is the first problem to be considered in emergency-response classification. Provided the evaluation index system can cover the basic content needed for evaluation and basic information about the evaluation objects, a concise index system can reduce the time and cost of evaluation and meet the need for a “rapid response.”
(2) Independence of indicators
Each indicator should be clear and relatively independent, and indicators of the same level should not overlap. Furthermore, the index system should be hierarchical.
(3) Representativeness and otherness of indicators
The indicators, which should be representative, should suitably reflect the characteristics of the research objects. There should also be obvious differences between the indicators (i.e., comparability).
(4) Feasibility of evaluation index
Feasibility means the evaluation indices can be obtained in a timely and effective way and be easily quantified [31]. Data collection should be simple and feasible. Hard-to-obtain indicators should not be adopted for emergency-response classification.
3.2 Construction of Evaluation Index System
Constructing an evaluation index system is a “concrete–abstract–concrete” thinking process, where the characteristics of the evaluation objects are gradually deepened, refined, and perfected. This process mainly includes the preliminary index system formulation, index system selection, and index system perfection.
3.2.1 Preliminary Index System Formulation
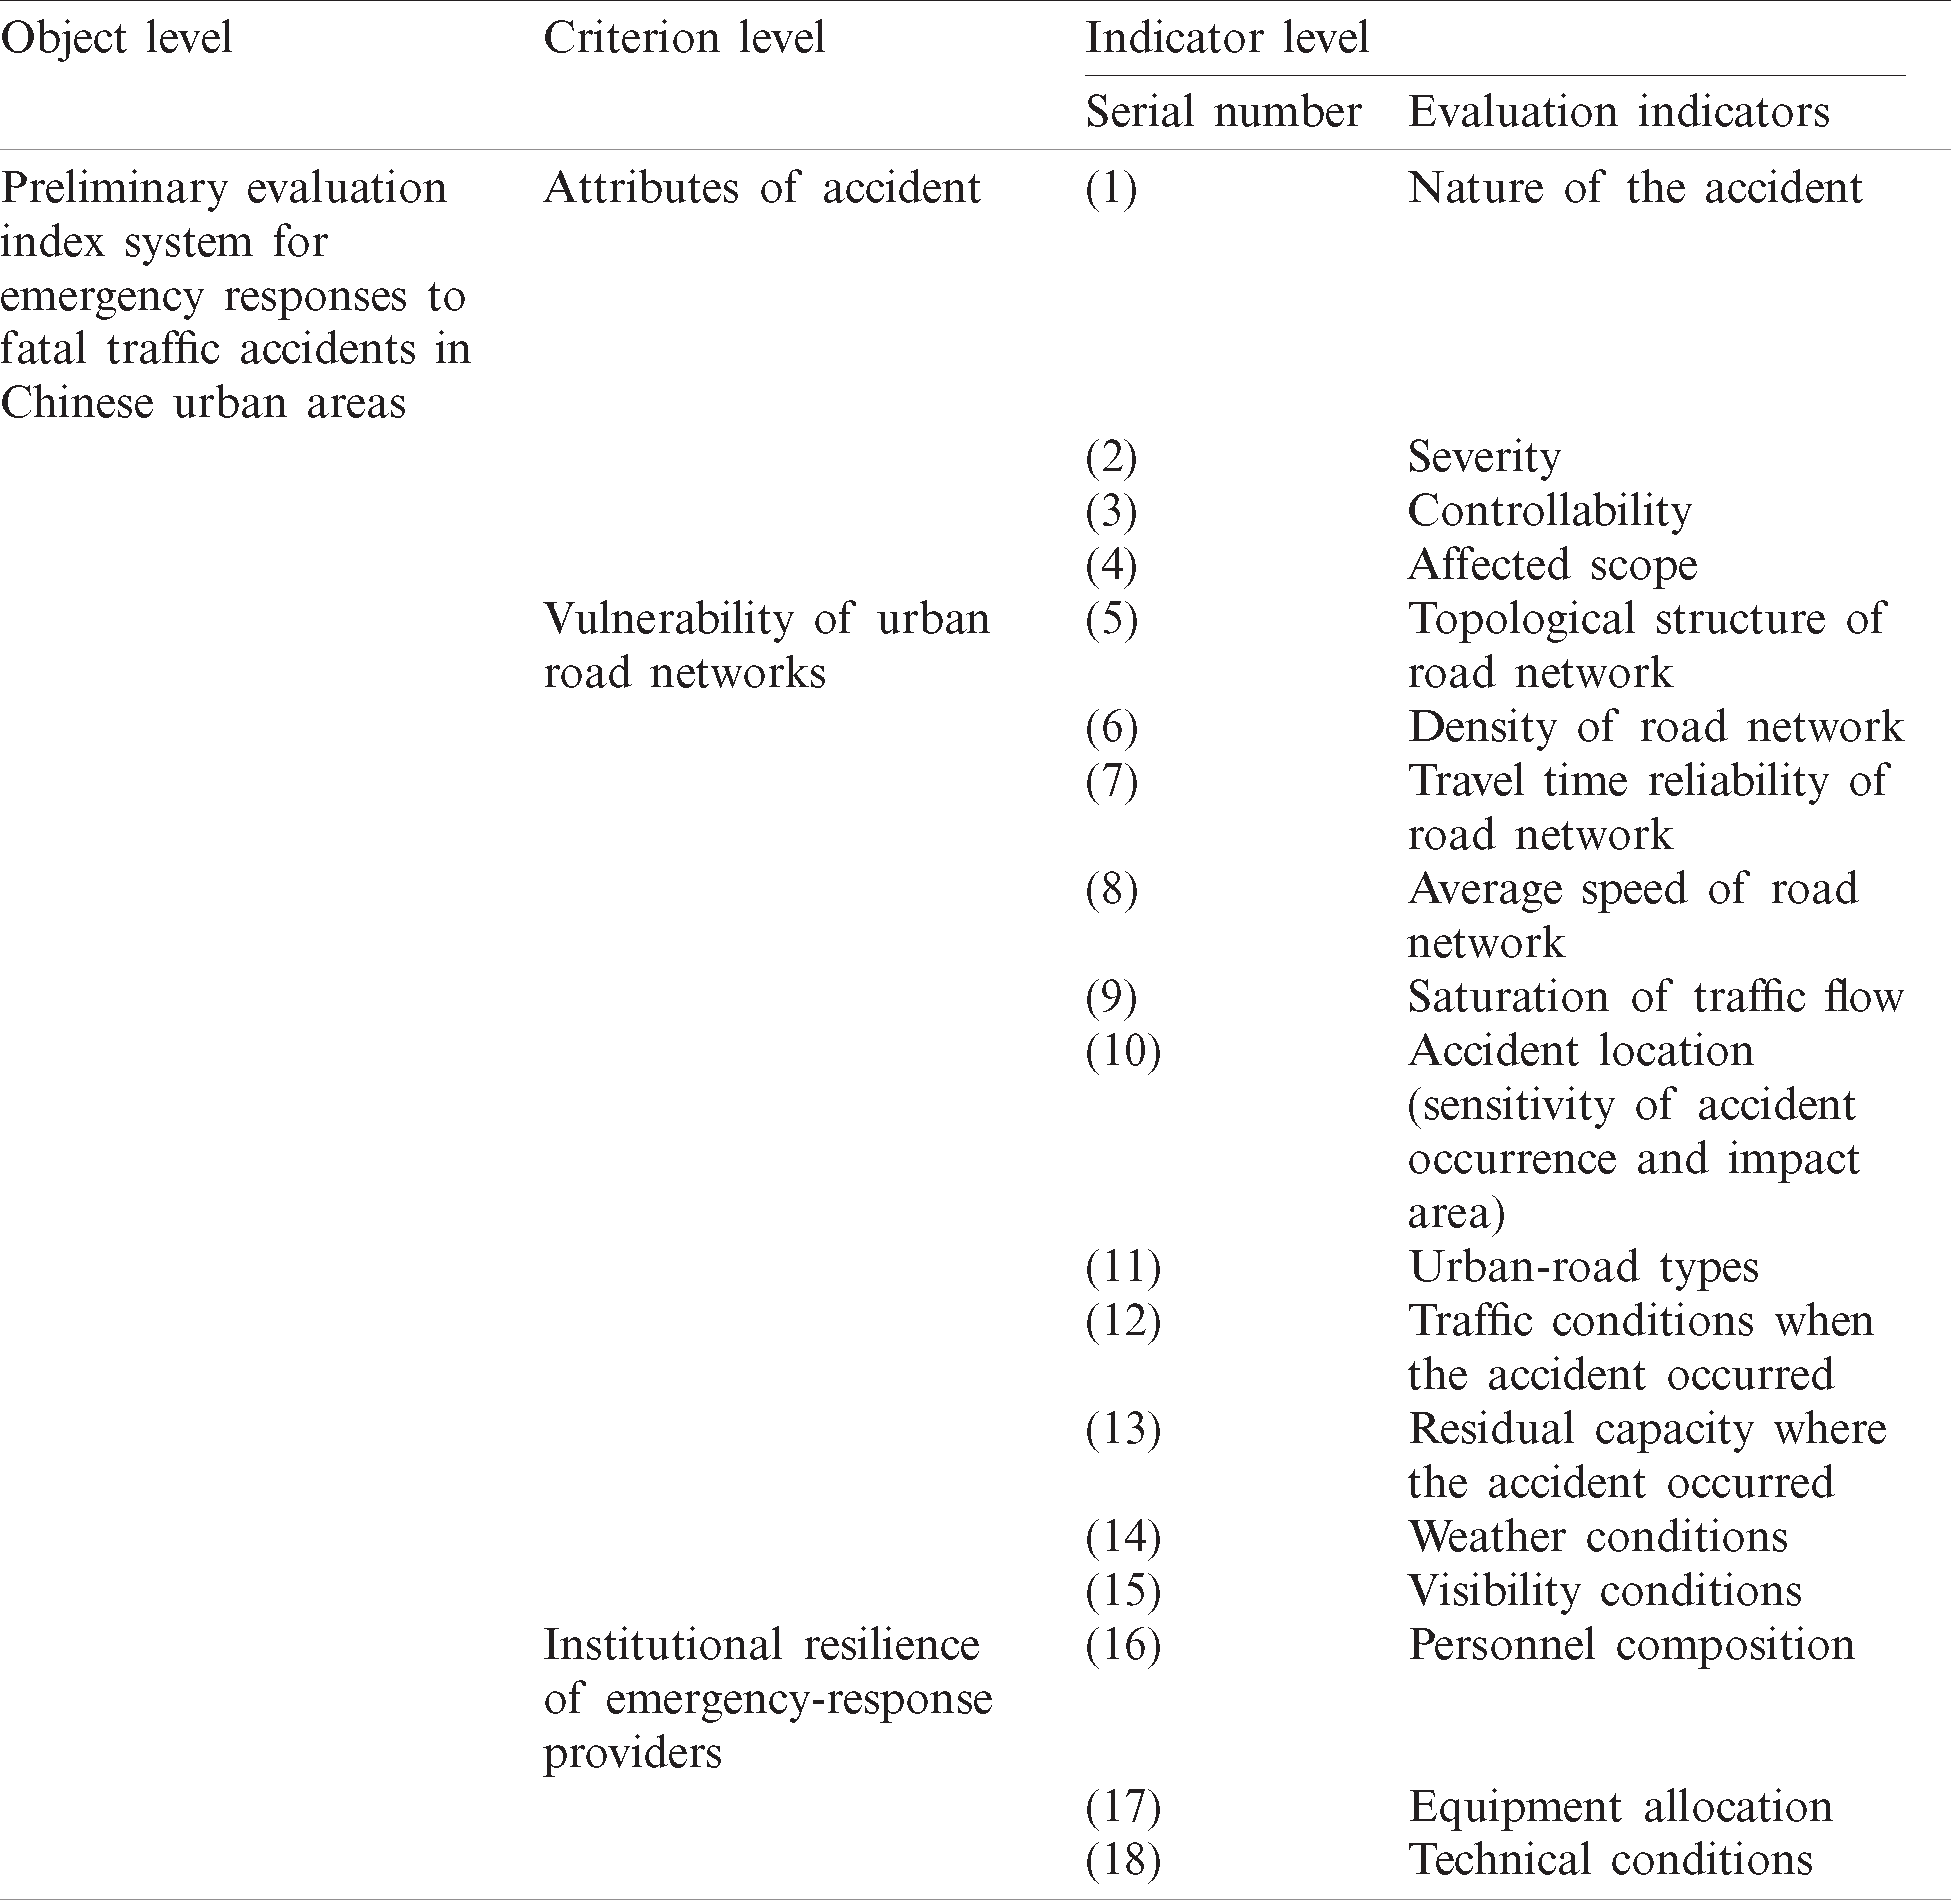
Based on the relevant literature and investigations, a three-layer evaluation index system was adopted in this study, since the purpose of emergency-response classification is to quickly and accurately determine the response providers and there should not be too many layers in the evaluation index system. The first layer was the object level. The second layer was the criterion level, containing attributes of accident, vulnerability of urban road networks, and institutional resilience of emergency-response providers. The third layer was the indicator level, containing some quantifiable indicators. A preliminary evaluation index system was proposed, as shown in Tab. 1.
Table 1: Preliminary evaluation index system for emergency responses to fatal traffic accidents in Chinese urban areas
A questionnaire was specially designed for index system selection. From March to June 2019, the questionnaire was sent to experts, scholars and professional technicians of the traffic management field by email. A total of 23 valid copies were collected. On this basis, the evaluation indices were screened and optimized.
(1) Importance ranking
Importance refers to the extent each evaluation index within the same level is relative to the upper level. Based on the analysis of the relative importance, some unimportant indices to the evaluation results were eliminated. The Fuzzy Delphi Method uses statistical analysis and fuzzy operation to transform the subjective opinions of experts into quasi objective data [32]. In this study, the Fuzzy Delphi Method based on triangular fuzzy number was used to rank the importance of the evaluation indices [33].
A fuzzy number is called triangular if the fuzzy number
where
The evaluation index “a” is experts’ most conservative evaluation value (lower bound value of
1) Establishing triangular fuzzy number
According to experts’ feedback (regardless of the influence of experts’ academic statuses and practical experience on the evaluation weight), the Fuzzy Delphi Method was used to integrate the fuzzy evaluation values of 23 experts to calculate the triangular fuzzy number of the importance of each preliminary evaluation index. Taking “the nature of the accident” as an example, no expert thought it was extremely unimportant (we assigned it to be 0.1), two experts thought it was unimportant (we assigned it to be 0.3), six experts thought it was important (we assigned it to be 0.5), eight experts thought it was very important (we assigned it to be 0.7), and seven experts thought it was extremely important (we assigned it to be 0.9). Thus,
Therefore,
2) Defuzzification
There are many methods for defuzzification [34]. The simple center of gravity method was used for deblurring in this study, and the triangular fuzzy number was transformed into a single value
Table 2: Index system selection for emergency responses to fatal traffic accidents in Chinese urban areas
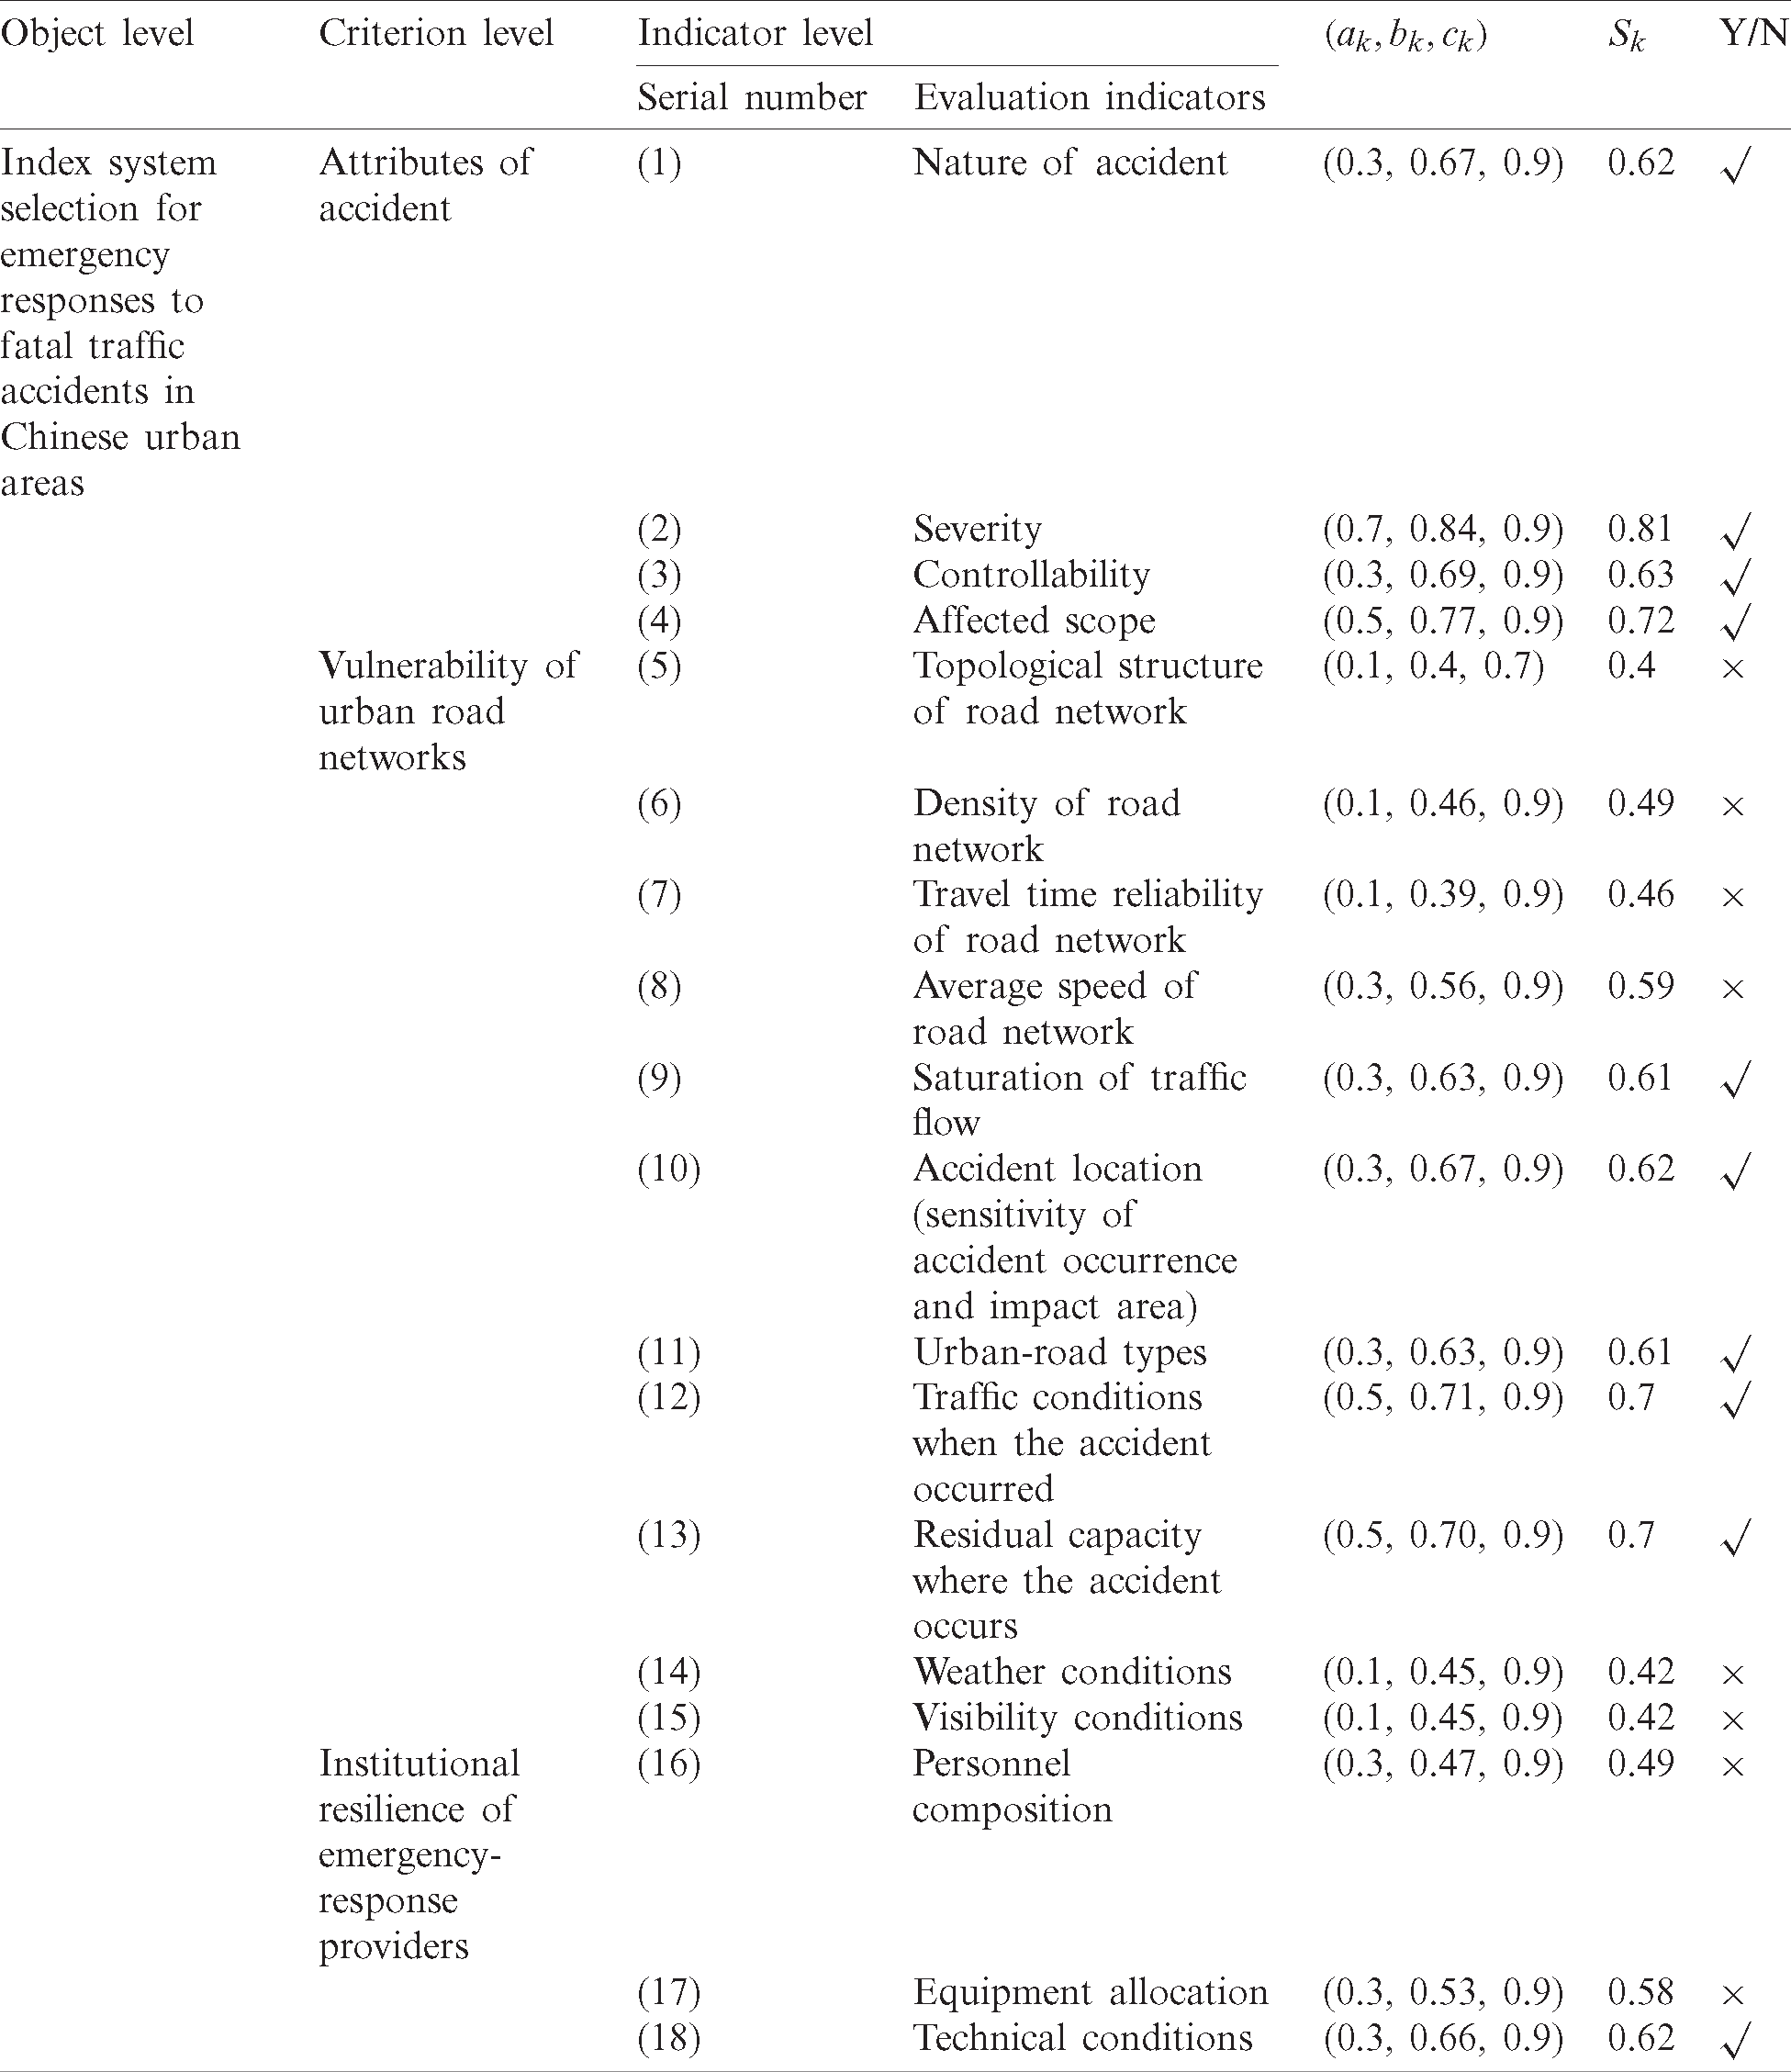
(2) Independence screening
Independence means that all indicators are relatively independent from an overall point of view, and there is no redundant crossing phenomenon. If there are highly related indicators in the index system, they will inevitably affect the objectivity of the evaluation results. Therefore, it is necessary to analyze the correlation of each index in the index system, combine or eliminate the highly correlated indicators, and ensure the independence of each evaluation index. According to experts’ suggestions, the nature of accident was combined with the controllability of the accident, and the travel time reliability of the road network, the average speed of the road network, and the saturation of the traffic flow were deleted, as they were covered by the traffic conditions when the accident occurred. The index of the road network density was also deleted because it was highly correlated with the accident location (sensitivity of accident occurrence and impact area). In addition, some professional technicians of the traffic management field believed that it was not easy to quantify the three evaluation indices of institutional resilience of the traffic administrative departments of public security organs (TADPSOs), and they recommend that the related evaluation indices be selected from the Evaluation Index System of Urban Road Traffic Management (2012) [35]. As a result, the traffic command system and the traffic management service mechanism in this study were selected from the Evaluation Index System of Urban Road Traffic Management as the evaluation indices of the institutional flexibility of TADPSOs.
Based on the preliminary index system formulation and index system selection, an evaluation index system with a hierarchical structure was then established (Fig. 1). The hierarchy is composed of the object level (O), criterion level (C), and indicator level (P). Each indicator is graded on a five-point system; the higher the score is, the higher the level of emergency response is.
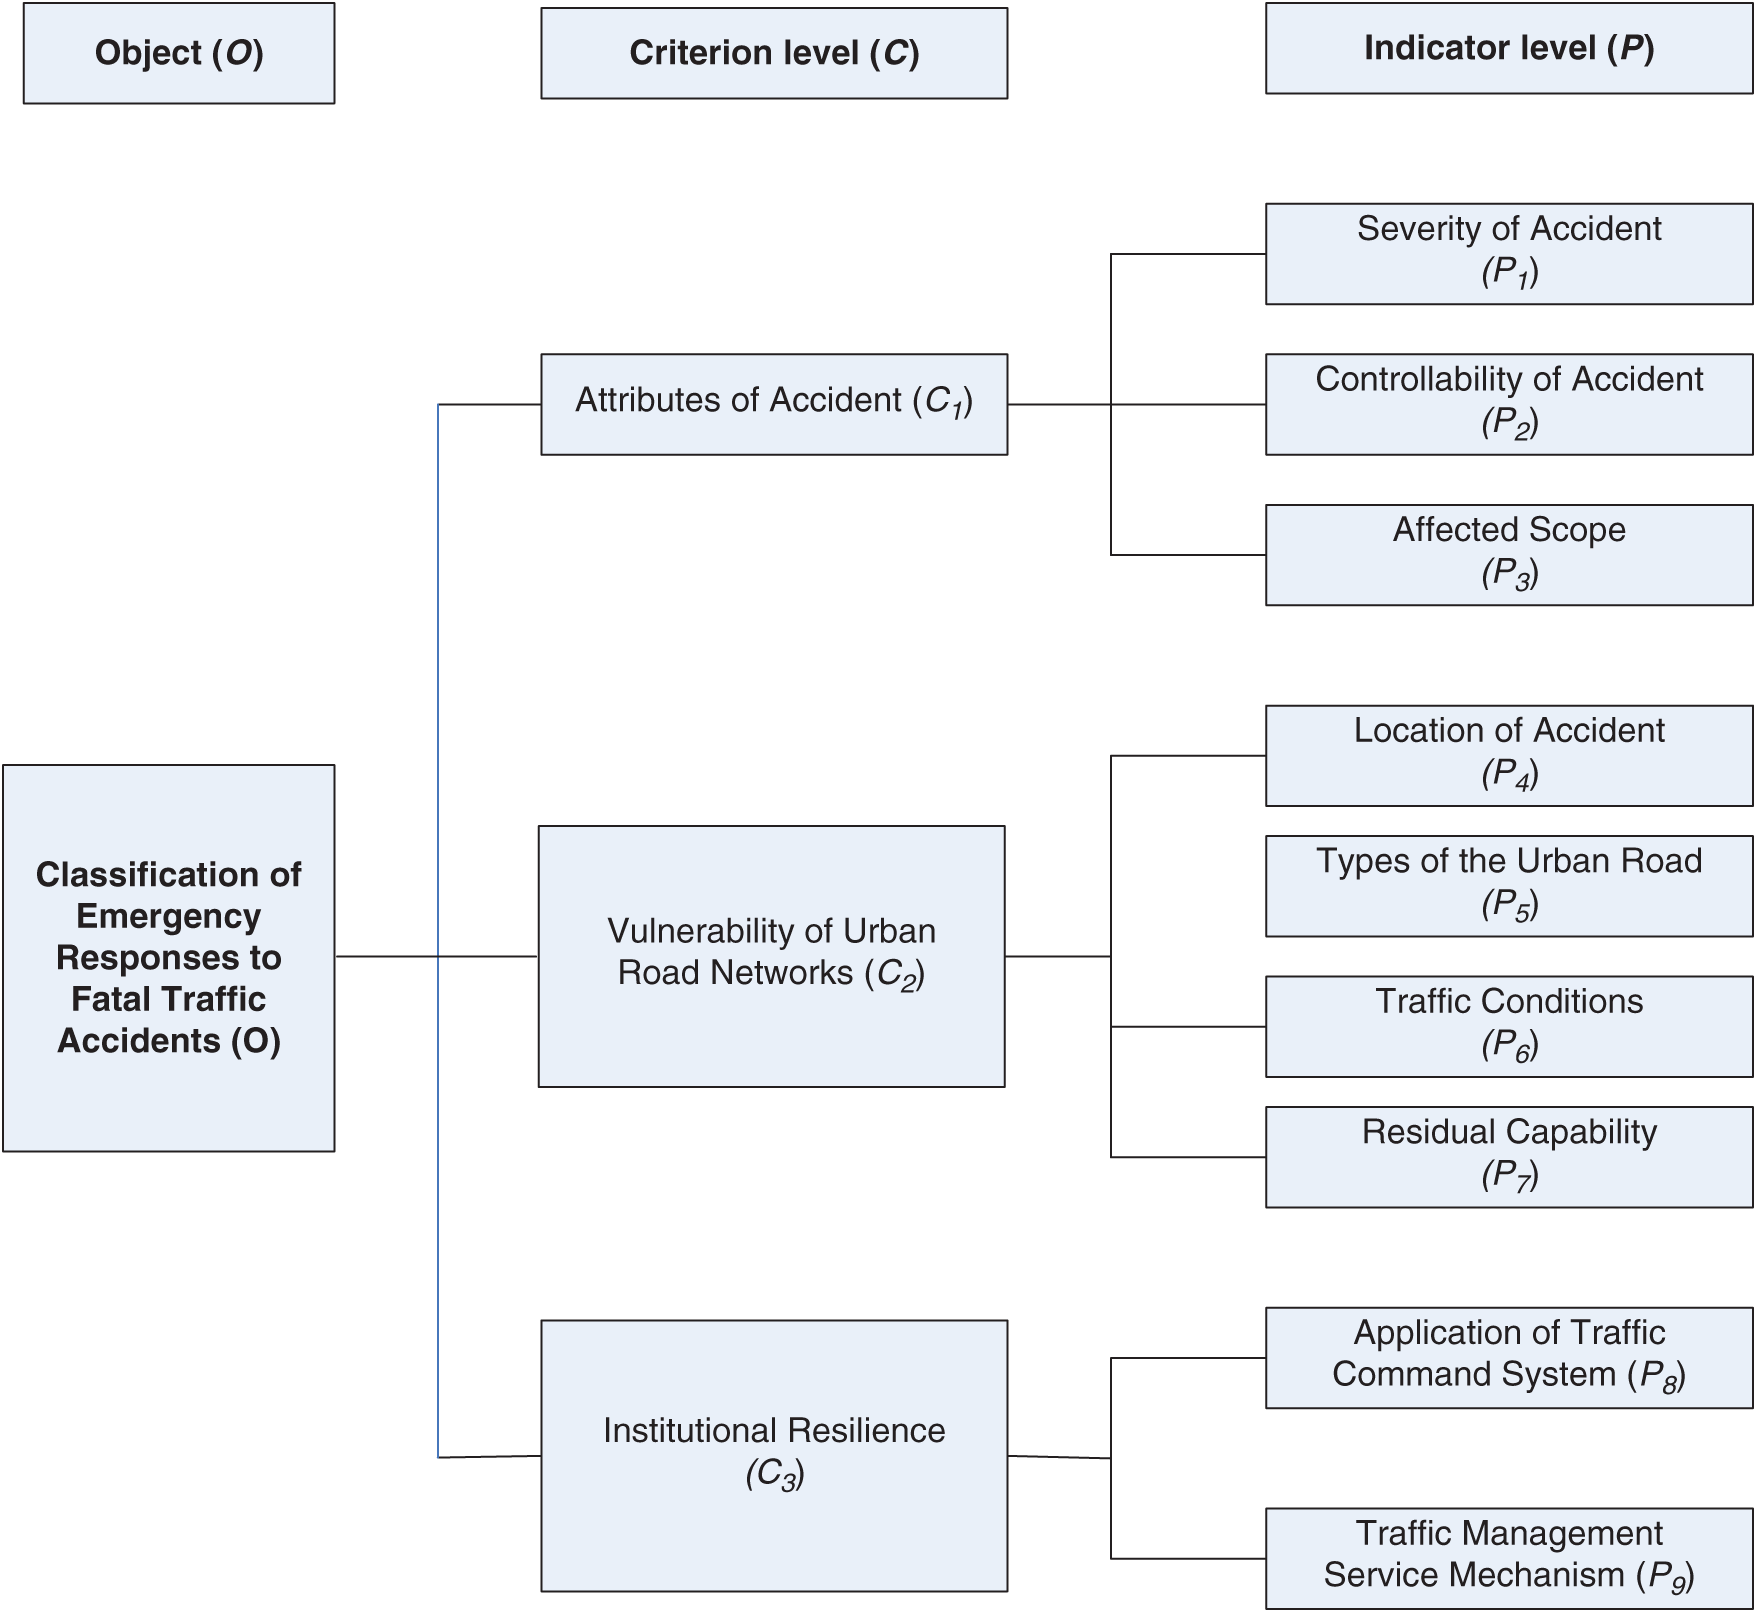
Figure 1: Classification evaluation index system for emergency responses to fatal traffic accidents in Chinese urban areas
3.3 Description and Quantification of Evaluation Indices
3.3.1 Attributes of Accident (C1)
The attributes of an accident usually include its severity, controllability, and scope of impact.
(1) Severity of accident (P1)
The direct economic loss and number of casualties are normally used to measure accident severity. Since direct economic loss is difficult to calculate in some situations, the equivalent number of deaths is adopted as the indicator to evaluate the severity of the accident [36]. According to the Announcement About Revision Standard of Road Traffic Accidents Classes released by China’s Ministry of Public Security in 1991, the equivalent number of deaths can be calculated as
where Dd is the equivalent number of deaths, D1 is the death toll, D2 is the number of disabling injuries, and D3 is the number of minor injuries.
In Road Traffic Accident Information Investigating [37], fatal accidents are divided into four levels: general fatal accidents, major fatal accidents, serious fatal accidents, and particularly serious fatal accidents. A general fatal accident causes one or two deaths, a major fatal accident causes three to nine deaths, a serious fatal accident kills 10–29 people, and a particularly serious fatal accident leads to 30 or more deaths.
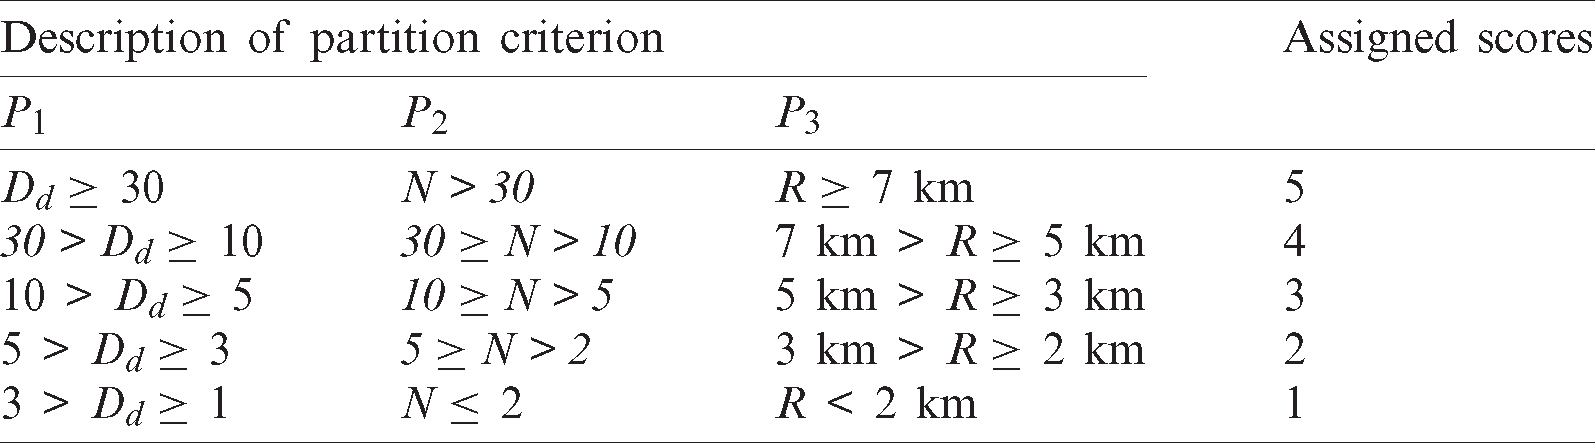
According to the Specifications for Road Traffic Accident Handling [38], traffic accidents with three to five fatalities should be submitted to the traffic administrative departments of provincial public security organs through administrative levels. Traffic accidents killing more than five people should be reported to the Traffic Management Bureau of the Public Security Ministry through administrative levels. Tab. 3 shows the scores assigned to the equivalent number of deaths.
Table 3: Quantitative criteria for accident attributes
(2) Controllability of accident (P2)
Accident controllability is an important basis for launching an emergency response. In the Specifications for Road Traffic Accident Handling [38], the main factors affecting the controllability of an accident include
1) how many vehicles are damaged in the accident;
2) whether leakage, explosion, or combustion occur for vehicles carrying dangerous goods;
3) whether the accident involves the overturning, falling, or burning of large or medium-sized buses;
4) whether a school bus is involved in the accident and leads to casualties of students or children.
It is more difficult to quantitatively evaluate the indicator P2. However, in China’s relevant laws and policy documents, there are special procedures for dealing with deaths related to 2), 3), and 4). Specifically, in cases 2), 3), or 4), the emergency-response classification is directly improved. Since neither 2), 3), nor 4) was involved in the accident in this study, the quantitative evaluation of P2 was conducted only on the basis of the number of vehicles (N) damaged in the accident. Tab. 3 shows the scores assigned to accident controllability.
(3) Affected scope (P3)
The affected scope can be evaluated by the affected radius (R) of the accident as the evaluation indicator. According to the change rate of the travel time exponent λ, an area with λ > 20% was selected as the affected scope of the accident [39]. Since the shape of the affected scope is usually irregular, the maximum radius of the affected scope was chosen as the affected radius of the accident. The classified radius of the affected scope (five levels have four boundary radii) can be calculated as
where Ri is the classified radius for each grade, S is the area of built-up urban area, and
According to the Evaluation Index System of Urban Road Traffic Management (2012) [35] the built-up urban area of Class A (megacity) is above 320 km2, and the built-up urban area of Class B (large city) is above 120 km2. Thus, the mean of the two areas, 220 km2, was adopted as the built-up urban area. From largest to smallest, 80%, 60%, 40%, and 20% of the radius of the built-up urban area were set up as the classified percentages of the five-level demarcation [36]. After the results calculated by Eq. (3) were rounded down to the nearest integer, the scores were assigned to classified radii, as shown in Tab. 3.
3.3.2 Vulnerability of Urban Road Networks (C2)
Berdica [40] was the first to define the road network vulnerability. He argued that the vulnerability of a road transport system is a sensitive coefficient that is vulnerable to the influence of events, which can lead to a great decline in road network service. The factors of road network vulnerability usually include the following: network topology, network density, reliability of network travel time, average speed of the road network, traffic-flow saturation, sensitivity of the accident’s occurrence and impact area, urban-road types, traffic conditions before the accident, residual capacity, and weather and visibility. According to the chosen basic principles of the representativeness and otherness of indicators, the adopted evaluation indices were as follows: accident location, urban-road types, the traffic conditions when the accident occurred, and the residual capacity where the accident occurred.
(1) Accident location (P4)
For some Chinese cities, when conducting urban traffic impact analysis (TIA) for construction projects, local authorities and researchers tend to divide the city into several types of areas. A first-class area is the core area of the city, which is densely populated with the most heavy and sensitive traffic. Other types of areas are arranged in descending order of location sensitivity and traffic density. Based on the classified areas, Tab. 4 shows the scores assigned to the accident location.
(2) Urban-road types (P5)
Based on their function, urban roads can usually be divided into freeways, major arterial roads, minor arterial roads, and local roads. Different types of urban roads have different traffic functions, and accidents have different effects on different types of urban roads. If an accident occurs on the road segment, the road type where the accident occurs is taken as the evaluation indicator; if the accident occurs at an intersection, the highest class of the intersecting road is taken as the evaluation indicator. Tab. 4 shows the scores assigned to each type of urban road.
Table 4: Quantitative criteria for urban road network vulnerability
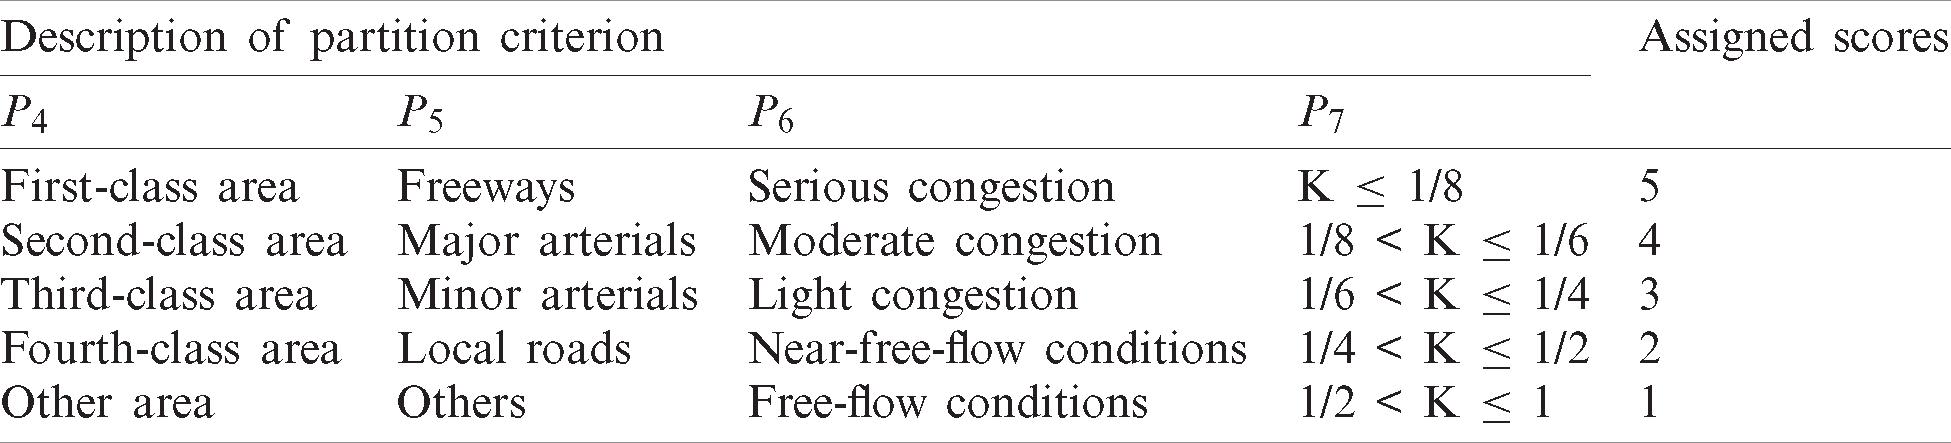
(3) Traffic conditions when the accident occurred (P6)
In the Urban Road Traffic Performance Index (DB11/T 785-2011) [41], urban traffic conditions fall into five types: free-flow conditions, near-free-flow conditions, light congestion, moderate congestion, and serious congestion. Tab. 4 shows the scores assigned to the different traffic conditions when an accident occurs. If the accident occurs in the road section segment, the worse traffic condition of the two opposite directions approaching the accident scene is taken as the evaluation index. If the accident occurs at the intersection, the worst traffic condition among all directions approaching the intersection is taken as the evaluation index.
(4) Residual capacity where the accident occurs (P7)
The ratio of the number of normally working lanes to the number of original lanes is adopted to express the index of the residual capacity where the accident occurs. It can be calculated as
where n is the number of normally working lanes, and N is the number of original lanes. Tab. 4 shows the specific scores.
3.3.3 Institutional Resilience (C3)
Institutional resilience refers to an emergency institution’s ability to adapt to the decline in system function due to incident disposal and to recover from a tolerably low operation level to the optimal operating status [42]. The better the institutional resiliencies are, the lower the emergency-response level becomes; the worse the institutional resiliencies are, the higher the emergency-response level becomes. Two main groups of factors affect institutional resilience: emergency attributes (e.g., the type, severity, and affected scope of the incident) and institutional characteristics (e.g., personnel composition, equipment rationing, and technical conditions). Since emergency attributes have been considered, as mentioned earlier, they are not repeated here to adhere to the principle of evaluation index independence. Based on the Evaluation Index System of Urban Road Traffic Management (2012) [35], the traffic command system application and the traffic management service mechanism were selected as the indices to measure the institutional resilience of the TADPSOs.
(1) Traffic command system application (P8)
The traffic command system application refers to establishing a traffic command system composed of an integrated information system, execution system, communication system, and command system platform in an evaluated city. This can collect, process, integrate, store, manage, and analyze traffic data. This index reflects the extent to which urban road traffic management is scientized and modernized, as well as the ability of traffic administrative departments to respond to and manage fatal traffic accidents. The evaluation is based on the Technical Specifications in the Construction of Public Security Traffic Command System (GA/T445-2010) [43], which mainly include the following:
1) having the function of regional or line coordination signal control;
2) using a traffic TV surveillance system to inspect road conditions regularly and spot traffic incidents and illegal behaviors;
3) establishing and using an integrated command platform based on police geographic information system (P-GIS), which has emergency command and dispatch, organization and coordination, decision support, and executive supervision capabilities;
4) setting up the positioning system for police vehicles and policemen and guaranteeing their effective functioning;
5) building a system for traffic flow and traffic event collection and exerting its function effectively;
6) having a traffic information issuance function;
7) having grassroots police forces establish a service command room with the functions of local command, dispatch, control, and guidance.
Based on each city’s traffic command system application, it is determined how many of the above requirements are met, and grades are assigned according to a five-point system. When more of the seven indicators are met, institutional resilience is better, and a lower corresponding score is assigned (Tab. 5).
Table 5: Quantitative criteria for the institutional resilience of the TADPSOs
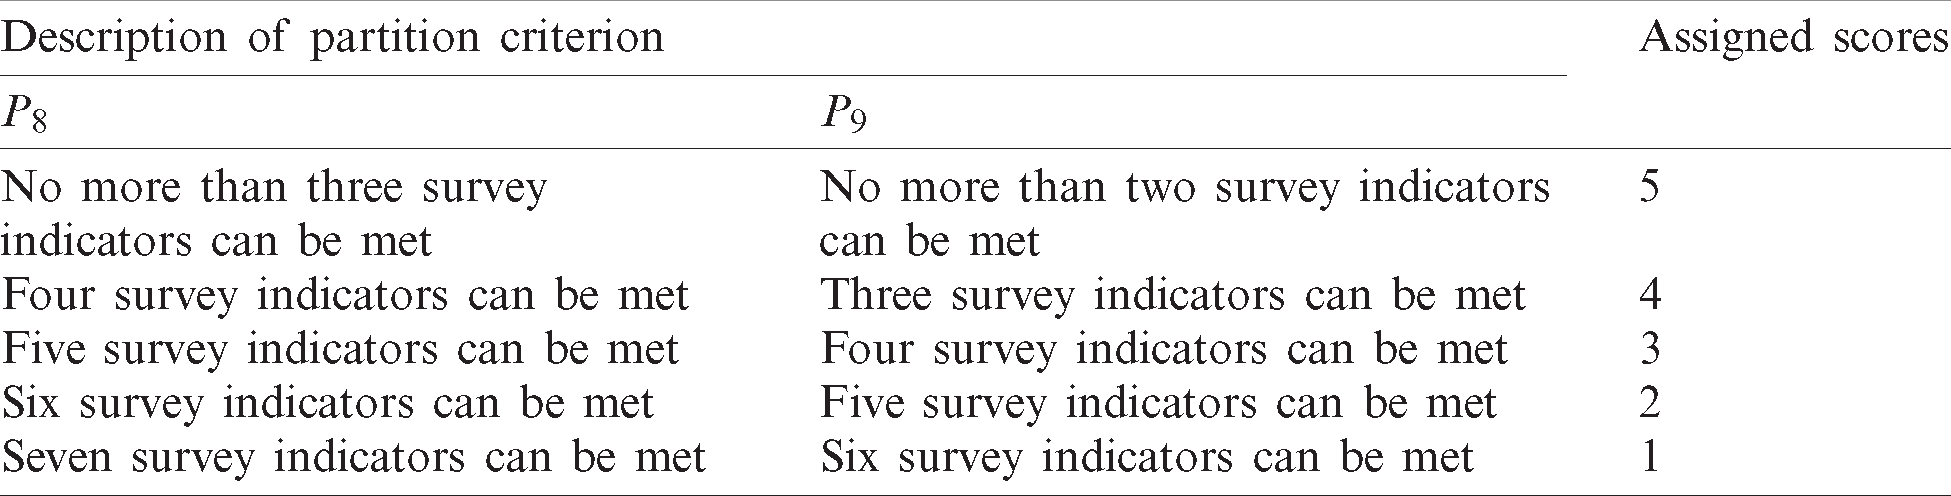
(2) Traffic management service mechanism (P9)
The traffic management service mechanism in the evaluated city, refers to the traffic administrative department of the public security organ that has a reasonable police force, clear assessment goals, a high level of answering and handling alarms, and the ability to react quickly. This is an important index that reflects the police’s level of effort and ability to respond. The evaluation contents are as follows:
1) establishing a police situation analysis system and deploying the police force dynamically according to the police situation;
2) implementing a scientific and reasonable appraisal mechanism for policemen on duty;
3) posting policemen near the intersections, road segments, entrances, and exits of important roads;
4) actively dredging traffic and investigating and dealing with illegal behaviors;
5) having an average time of 10 min from answering the alarm to police arriving at the scene during the day and less than 15 min at night;
6) implementing civility standards for on-the-road law-enforcement behavior for police on duty.
This is graded by a five-point system based on how many of the above requirements are met in each city. As before, when more indicators are met, the institution has better resilience, and the score is lower (Tab. 5).
As shown in Fig. 1, the hierarchical evaluation index system for emergency responses is a hierarchical structural model, which would normally use AHP [44] or FAHP [45] to determine weights. However, AHP and FAHP can both face the problem of not satisfying the consistency requirements of the judgment matrix in the face of numerous factors. The more factors there are, the larger the problem is. In view of these shortcomings, Guo proposed using the G1 method [46], which overcomes certain shortcomings of the AHP method, does not require a consistency check, and appears to be simpler and more practical. G1 is essentially a kind of order-relation analysis method; thus, this study used the G1 method to obtain the weights of each index. The steps for calculating the combined weight of each evaluation index are as follows:
(1) Establish a hierarchical system of the evaluation index
Forming a hierarchy is the most important step in hierarchical relationship analysis. The hierarchical evaluation index system for emergency responses to fatal traffic accidents is shown in Fig. 1.
(2) Determine the order relation
The upper layer element
The evaluation indices
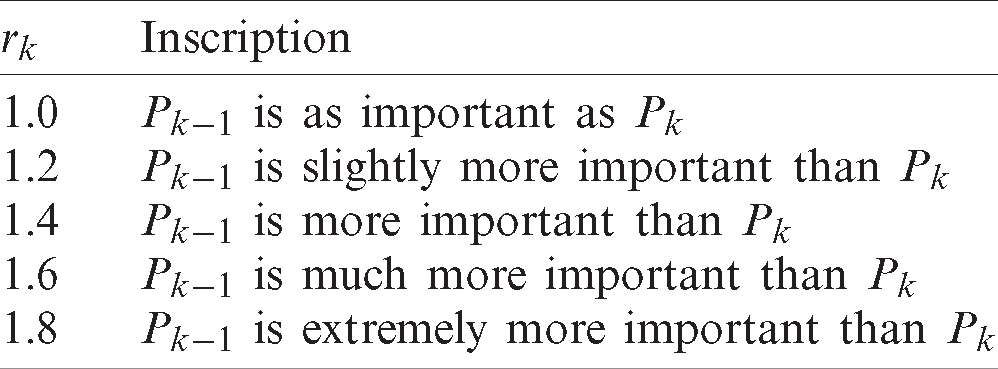
(3) Determine the relative importance of the adjacent indices
Supposing experts make rational judgments about the ratio of the importance
where
Table 6: Assigned values of
(4) Calculate the value of the weight
Based on the value of
The weights of the other indicators in the level can be obtained by the recursion equation
(5) Calculate the combined weights
Generally, if a system consists of three levels (as in Fig. 1), the highest level is O, the second level is
The weight vector of P to
The combined weight of
This method is also applicable for multilevel cases.
5 Emergency-Response Classification
Based on the indices and their corresponding combined weights, this study presents the classification function by the following equation:
where Y is the comprehensive evaluation score of the emergency-response classification,
Referring to the Master State Plan for Rapid Responses to Public Emergencies [21], this study divided emergency responses to fatal traffic accidents in Chinese urban areas into four classes: Class I, Class II, Class III, and Class IV. Each class and its corresponding comprehensive evaluation score are shown in Tab. 7.
Table 7: Comprehensive evaluation scores for the classification of emergency responses

6.1 Background Information and Assigned Scores for Each Evaluation Index
At 13:53 on June 20, 2015, a fatal traffic accident occurred at the intersection of Shiyang Road and Youyihe Road in Nanjing, China (Fig. 2). The accident caused two deaths and one injury, and three vehicles were damaged. The maximum radius of the impact was 2.4 km. This accident occurred in downtown Nanjing (Class II area), and Shiyang Road is a major arterial road in the city. Before the accident, traffic conditions in the nearby areas were near-free-flow conditions, but the accident caused significant congestion in all lanes of Shiyang Road and Youyihe Road, with slow access to only two of 15 entryways at the intersection. The accident was handled by the Nanjing administrative traffic department of the public security organ. All evaluation indices of the traffic command system application and the traffic management service mechanism were met during the handling process. Based on the background above and referring to the quantitative criteria of each evaluation index, column 2 of Tab. 8 lists the specific scores for each evaluation index.
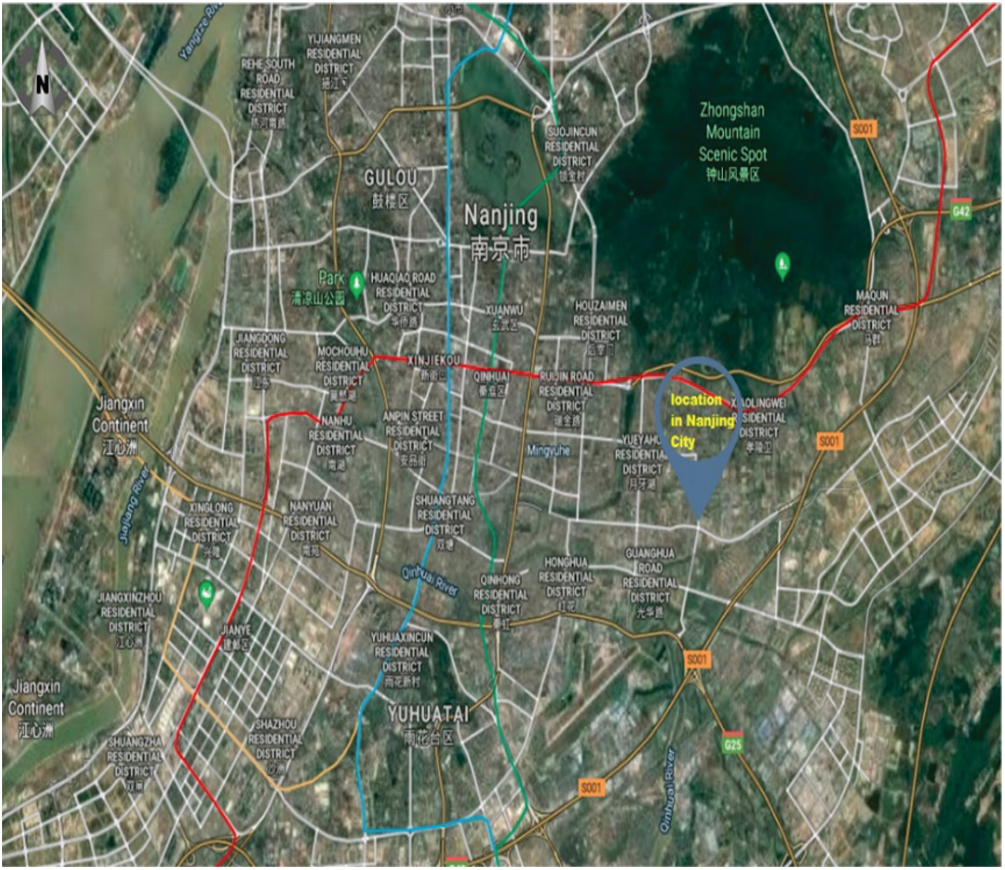
Figure 2: Location where the accident occurred
Table 8: Indices, assigned scores, combined weights, and comprehensive evaluation scores for the classification of emergency responses

6.2 Calculation of Combined Weights
According to the hierarchical structural model of the evaluation index system established in Fig. 1, experts provided the order relation of the criterion level (C) to the object level (O) as follows:
The following comparison is made:
Thus,
Therefore, the weight coefficients of the elements C1, C2 and C3 in the criterion level were 0.483, 0.302, and 0.215, respectively, so the weight vector of C to O was
Similarly,
for
for
for
With the same calculation method of
Using Eq. (12), the combined weight of each evaluation index was obtained, as shown in column 3 Tab. 8.
6.3 Confirmation of Emergency-Response Class
Based on the evaluation indicator scores for the accident (column 2, Tab. 8) and the corresponding combined weights (column 3, Tab. 8), the comprehensive evaluation score of the emergency response classification can be calculated by Eq. (13), as follows:
The results are shown in column 4 of Tab. 8. According to the classification of the emergency responses in Tab. 7, the emergency-response class of the accident was Class III.
This study established a multilevel hierarchical structural model comprising an object level (O), criterion level (C), and indicator level (P). A comprehensive evaluation score for emergency-response classification was calculated using the G1 method. The classification of emergency responses to fatal traffic accidents in Chinese urban areas was then determined according to the comprehensive evaluation score. Based on these analyses, the following conclusions can be drawn:
(1) The main contribution of this study is the selection and quantification of the evaluation indices for emergency-response classifications to fatal traffic accidents in Chinese urban areas. First, a preliminary evaluation index system was proposed based on relevant literature and investigations. Second, the Fuzzy Delphi Method was used to rank the importance of the evaluation indices, and the independence screening of the evaluation indices was presented on the basis of experts’ suggestions. Third, the multilevel hierarchical structural model was set up after the index system was perfected. Furthermore, each evaluation indicator was given an interpretation and a quantitative criterion.
(2) It is feasible to classify emergency responses using a multilevel hierarchical structural model. Furthermore, it is appropriate for the Fuzzy Delphi Method to be used to rank the importance of the evaluation indices, and the G1 method is adopted to calculate the combined weight of each index. Using the model and method, the evaluation indices are easy to obtain and quantify, and the combined weights are simple to calculate. Therefore, this model and methods can provide a fast and accurate way to determine the necessary responders, measures, and emergency-response resources, thus aiding the efficient management of fatal traffic accidents in Chinese urban areas.
(3) Though the aim was to classify emergency responses to fatal traffic accidents in Chinese urban areas, the methods of model establishment, index quantification, and weight calculation are applicable to different types of emergency responses. However, the evaluation indices must be selected in accordance with the particular emergency.
It should be noted that the main purpose of this paper is to help traffic administrative departments manage fatal traffic accidents in Chinese urban areas. In the evaluation-index selection, this study referred to previous literature and incorporated practical experience of traffic administrative departments. However, some evaluation indices that are only available in China and some difficult-to-obtain indices were excluded. Therefore, in future research, evaluation index systems and scoring methods should be further established and perfected. Furthermore, clustering and some artificial intelligence methods can also be adopted to study the classification of emergency responses.
Acknowledgement: We thank LetPub (www.letpub.com) for its linguistic assistance during the preparation of this manuscript.
Funding Statement: This work was supported by the Fifth 333 High-Level Talents Project of Jiangsu Province under Grant BRA2017443 and the Key Research Base of Jiangsu University Philosophy and Social Science under Grant 2018ZDJD-B007.
Conflicts of Interest: The authors declare that they have no conflicts of interest to report regarding the present study.
1. S. Q. Shan, L. Wang, L. Li and Y. Chen. (2012). “An emergency response decision support system framework for application in e-government,” Information Technology and Management, vol. 13, no. 4, pp. 411–427. [Google Scholar]
2. World Health Organization [WHO]. (2018). Global Status Report on Road Safety 2018. Geneva: World Health Organization, . [Online]. Available: https://www.who.int/violence_injury_prevention/road_safety_ status/2018/en. [Google Scholar]
3. National Bureau of Statistics of China. (2019). Statistical Communiqué of the People's Republic of China on the 2018 National Economic and Social Development. Beijing: National Bureau of Statistics of China, . [Online]. Available: http://www.stats.gov.cn/english/PressRelease/201902/t20190228_1651335.html. [Google Scholar]
4. I. R. H. Rockett, S. H. Jiang, Q. Yang, T. Z. Yang, X. Z. Yang et al. (2017). , “Prevalence and regional correlates of road traffic injury among Chinese urban residents: A 21-city population-based study,” Traffic Injury Prevention, vol. 18, no. 6, pp. 623–630. [Google Scholar]
5. The Ministry of Public Security of the People's Republic of China. (2017). The Procedural Regulations for Handling Road Traffic Accidents. No. 146 Decree of the Ministry of Public Security of the People’s Republic of China. Beijing: The Ministry of Public Security of the People's Republic of China, , [In Chinese]. [Google Scholar]
6. B. S. Manoj and A. H. Baker. (2007). “Communication challenges in emergency response,” Communications of the ACM, vol. 50, no. 3, pp. 51–53. [Google Scholar]
7. A. Chen, N. Chen and J. M. Li. (2012). “During-incident process assessment in emergency management: Concept and strategy,” Safety Science, vol. 50, no. 1, pp. 90–102. [Google Scholar]
8. Q. Chen, Q. M. Zhang and L. Zhai. (2018). “Emergency classification level automatic judgment and warning system based on emergency action level of nuclear power plant,” in Int. Conf. on Power System Technology, Guangzhou, China, pp. 4632–4636. [Google Scholar]
9. R. Ritzman. (2013). “Emergency management at nuclear plants: The US approach,” in Managing Nuclear Projects, Cambridge, United Kingdom: Woodhead Publishing, pp. 282–296. [Google Scholar]
10. Y. Z. Sha, C. Gao and W. J. Hu. (2009). “Empirical study on emergency material management based on requirements grades: The case of “5.12” earthquake in Longnan city, Gansu province, China,” in 1st IEEE Symp. on Web Society, Lanzhou, China, pp. 76–80. [Google Scholar]
11. K. Jung and H. W. Park. (2016). “Tracing interorganizational information networks during emergency response period: A webometric approach to the 2012 Gumi chemical spill in South Korea,” Government Information Quarterly, vol. 33, no. 1, pp. 133–141. [Google Scholar]
12. Q. Wu, K. F. Xie and Z. Y. Chen. (2012). “A catastrophe model on the evaluation and classification of mine disaster rescue measures,” Systems Engineering Procedia, vol. 4, pp. 484–489. [Google Scholar]
13. Y. Q. He and J. Li. (2012). “Classification model of traffic emergency response to urban emergency,” Sensors & Transducers, vol. 16, pp. 169–178. [Google Scholar]
14. Y. Q. He and S. P. Du. (2016). “Classification of urban emergency based on fuzzy analytic hierarchy process,” Procedia Engineering, vol. 137, pp. 630–638. [Google Scholar]
15. J. Gao, R. H. Xu and Z. B. Jiang. (2010). “Combinatorial evaluation for forewarning grade of emergency in urban mass transit,” in WASE Int. Conf. on Information Engineering, Beidaihe, China, pp. 443–447. [Google Scholar]
16. C. Q. Ren, X. J. Yuan, J. Wang, X. Zhang and J. Li. (2012). “Study on emergency response rank mode of flammable and explosive hazardous materials road transportation,” Procedia Engineering, vol. 45, pp. 830–835. [Google Scholar]
17. H. Zhang. (2012). “Study on grades of freeway meteorological disasters by risk matrix,” Applied Mechanics and Materials, vol. 178, pp. 2788–2792. [Google Scholar]
18. H. J. Zhu and Y. Tian. (2009). “Research on the classification and grading system of emergencies in supply chain emergency management,” in Int. Conf. on Management Science and Engineering, Moscow, Russian, pp. 513–517. [Google Scholar]
19. J. J. Burnett. (1998). “A strategic approach to managing crises,” Public Relations Review, vol. 24, no. 4, pp. 475–488. [Google Scholar]
20. B. K. Paul. (2011). Environmental Hazards and Disasters: Contexts, Perspectives and Management, Chichester: John Wiley & Sons. [Google Scholar]
21. The State Council of the People's Republic of China. (2006). The Master State Plan for Rapid Response to Public Emergencies. Beijing: The State Council of the People's Republic of China, , [In Chinese]. [Google Scholar]
22. S. H. Lee, M. T. Lee, C. Kim, C. Park, S. Park et al. (2008). , “On determination of early warning grade based on AHP analysis in warranty database,” in Int. Conf. on Intelligent Computing, Berlin, Springer, pp. 84–89. [Google Scholar]
23. S. S. Song, F. Dai, J. X. Liu and B. L. Wei. (2011). “A research of emergency classification based fuzzy AHP and cluster analysis,” in Int. Conf. on Future Computer Science and Education, Xi’an, China, pp. 646–649. [Google Scholar]
24. R. H. Xu, J. Gao and Z. B. Jiang. (2010). “Fuzzy evaluation for forewarning grade of emergency in urban mass transit,” in Int. Conf. on Intelligent Computation Technology and Automation, Changsha, China, pp. 371–374. [Google Scholar]
25. L. Y. Shang and Q. M. Tan. (2014). “Emergency classification based on support vector machine,” Journal of Industrial Engineering and Engineering Management, vol. 28, no. 1, pp. 119–123, , [In Chinese]. [Google Scholar]
26. Y. L. Wu, J. B. Wang, S. Kouichi and Z. X. Cheng. (2017). “A dynamic spatial clustering for emergency response based on hierarchical-partition model,” Procedia Computer Science, vol. 111, pp. 485–492. [Google Scholar]
27. W. Li, M. Zhou and H. Dong. (2020). “Classifications of stations in urban rail transit based on the two-step cluster,” Intelligent Automation & Soft Computing, vol. 26, no. 3, pp. 531–538. [Google Scholar]
28. X. D. Zhu, J. Cao and Y. Dai. (2011). “A decision tree model for meteorological disasters grade evaluation of flood,” in Fourth Int. Joint Conf. on Computational Sciences and Optimization, Yunnan, China, pp. 916–919. [Google Scholar]
29. X. H. Xu, Y. X. Huang and K. Chen. (2019). “Method for large group emergency decision making with complex preferences based on emergency similarity and interval consistency,” Natural Hazards, vol. 97, no. 1, pp. 45–64. [Google Scholar]
30. G. Yang, J. Zeng, M. Yang, Y. Wei and X. Wang. (2020). “Ott messages modeling and classification based on recurrent neural networks,” Computers, Materials & Continua, vol. 63, no. 2, pp. 769–785. [Google Scholar]
31. S. Altuntas and T. Dereli. (2012). “An evaluation index system for prediction of technology commercialization of investment projects,” Journal of Intelligent & Fuzzy Systems, vol. 23, no. 6, pp. 327–343. [Google Scholar]
32. P. T. Chang, L. C. Huang and H. J. Lin. (2000). “The Fuzzy Delphi method via fuzzy statistics and membership function fitting and an application to the human resources,” Fuzzy Sets and Systems, vol. 112, no. 3, pp. 511–520. [Google Scholar]
33. Z. L. Ma, C. F. Shao, S. Q. Ma and Z. Ye. (2011). “Constructing road safety performance indicators using Fuzzy Delphi method and Grey Delphi method,” Expert Systems with Applications, vol. 38, no. 3, pp. 1509–1514. [Google Scholar]
34. J. X. Ran. (2011). “The research of the rank of triangular fuzzy numbers,” Journal of Minzu University of China (Natural Sciences Edition), vol. 20, no. 4, pp. 37–42, , [In Chinese]. [Google Scholar]
35. The Ministry of Public Security of the People's Republic of China and Ministry of Housing and Urban-Rural Development of the People's Republic of China. (2012). Evaluation Index System of Urban Road Traffic Management. Beijing: The Ministry of Public Security of the People’s Republic of China, , [In Chinese]. [Google Scholar]
36. P. F. Gong. (2016). “Early warning classification of urban road traffic under emergencies,” International Journal of Simulation Systems, Science & Technology, vol. 17, pp. 1–6. [Google Scholar]
37. The Ministry of Public Security of the People's Republic of China. (2013). Road Traffic Accident Information Investigating (GA/T 1082-2013). Beijing: The Ministry of Public Security of the People's Republic of China, , [In Chinese]. [Google Scholar]
38. Traffic Management Bureau of the Public Security Ministry. (2018). Specifications for Road Traffic Accident Handling. Beijing: Traffic Management Bureau of the Public Security Ministry, , [In Chinese]. [Google Scholar]
39. P. F. Gong. (2017). “Traffic impact assessment indexes of emergencies on urban road traffic system,” Highway, vol. 62, no. 3, pp. 175–178, , [In Chinese]. [Google Scholar]
40. K. Berdica. (2002). “An introduction to road vulnerability: What has been done, is done and should be done,” Transport Policy, vol. 9, no. 2, pp. 117–127. [Google Scholar]
41. Beijing Bureau of Quality and Technical Supervision. (2011). Urban Road Traffic Performance Index (DB11/T 785-2011). Beijing: Beijing Bureau of Quality and Technical Supervision, , [In Chinese]. [Google Scholar]
42. H. H. Ni and A. Chen. (2009). “An assessment model of institutional resilience in urban emergency management,” in Int. Conf. on Management and Service Science, Wuhan, China. [Google Scholar]
43. The Ministry of Public Security of the People’s Republic of China. (2010). Technical Specifications for the Construction of Public Security Traffic Command System (GA/T445-2010). Beijing: The Ministry of Public Security of the People’s Republic of China, , [In Chinese]. [Google Scholar]
44. T. L. Saaty. (1990). “How to make a decision: The analytic hierarchy process,” European Journal of Operational Research, vol. 48, no. 1, pp. 9–26. [Google Scholar]
45. Y. B. Ju, A. H. Wang and X. Y. Liu. (2012). “Evaluating emergency response capacity by fuzzy AHP and 2-tuple fuzzy linguistic approach,” Expert Systems with Applications, vol. 39, no. 8, pp. 6972–6981. [Google Scholar]
46. L. Jing and W. Yao. (2013). “A safety assessment of china’s crude oil import based on G1 method,” Procedia-Social and Behavioral Sciences, vol. 96, pp. 1738–1744. [Google Scholar]
 | This work is licensed under a Creative Commons Attribution 4.0 International License, which permits unrestricted use, distribution, and reproduction in any medium, provided the original work is properly cited. |