DOI:10.32604/cmc.2021.016230
| Computers, Materials & Continua DOI:10.32604/cmc.2021.016230 | |
| Article |
Automatic Surveillance of Pandemics Using Big Data and Text Mining
1Department of Information Technology, College of Computers and Information Technology, Taif University, P.O. Box 11099, Taif, 21944, Saudi Arabia
2Institute of Computing, Kohat University of Science and Technology, Kohat, 26000, Pakistan
*Corresponding Author: Abdullah Alharbi. Email: amharbi@tu.edu.sa
Received: 27 December 2020; Accepted: 28 January 2021
Abstract: COVID-19 disease is spreading exponentially due to the rapid transmission of the virus between humans. Different countries have tried different solutions to control the spread of the disease, including lockdowns of countries or cities, quarantines, isolation, sanitization, and masks. Patients with symptoms of COVID-19 are tested using medical testing kits; these tests must be conducted by healthcare professionals. However, the testing process is expensive and time-consuming. There is no surveillance system that can be used as surveillance framework to identify regions of infected individuals and determine the rate of spread so that precautions can be taken. This paper introduces a novel technique based on deep learning (DL) that can be used as a surveillance system to identify infected individuals by analyzing tweets related to COVID-19. The system is used only for surveillance purposes to identify regions where the spread of COVID-19 is high; clinical tests should then be used to test and identify infected individuals. The system proposed here uses recurrent neural networks (RNN) and word-embedding techniques to analyze tweets and determine whether a tweet provides information about COVID-19 or refers to individuals who have been infected with the virus. The results demonstrate that RNN can conduct this analysis more accurately than other machine learning (ML) algorithms.
Keywords: Disease surveillance; social media analysis; recurrent neural networks; text mining
Humankind is going through an unprecedented time due to the spread of the novel virus SARS-CoV-2, which causes COVID-19. As of this writing, while the scientific community has developed a vaccine to protect humans from this deadly virus, it is only just beginning to be distributed and administered. So far, the only solution is to control the spread of the virus; to do this, patients with COVID-19 must be isolated. Some countries allow patients to self-quarantine; other governments force people to stay home. Some have also set up quarantine centers to separate infected or possibly infected individuals from the general public. The World Health Organization (WHO)1 and the U.S. Center for Disease Control (CDC)2 have issued guidelines to slow the spread of the virus. These guidelines include social distancing, sanitization, wearing masks and gloves, and isolating those who are infected with COVID-19. The virus is believed to have first emerged in the Wuhan province of China at the end of December 2019. Patients infected with COVID-19 were first identified in January 2020. Even as many people in Wuhan fell ill with similar symptoms, healthcare professionals did not realize they were witnessing the start of an outbreak. Doctors initially treated these patients as they would anyone with a fever; it was not until the end of January 2020 that they realized that the illness was caused by the spread of a highly contagious virus. The entire province was then locked down to stop the spread, but the virus had already spread beyond the borders of the lockdown.
So far, the only method for identifying individuals infected with COVID-19 is to test them. However, the testing kits are expensive resources, and the test must be conducted by a medical professional. Therefore, is not possible to test everyone. COVID-19 cases can also be identified by the symptoms of the illness, which include fever, cough, breathing difficulties, and a loss of smell and/or taste. However, physical checks must be performed to identify cases based on symptoms. Therefore, there is a need for a surveillance system that can automatically analyze social media posts to identify individuals with symptoms of COVID-19. Once possible cases have been identified, individuals with symptoms can be tested for COVID-19, and infected individuals can be isolated. The system can function as a complementary tool to analyze the spread of the virus and identify regions where it is spreading at an alarming rate. This information can then be used to determine appropriate precautionary measures. Such an approach might limit the need for total lockdowns of countries and cities and restrictions on all types of travel, neither of which is healthy for humans or good for the economy.
The novel surveillance system proposed in this paper can analyze the content of social media posts to identify possible cases of COVID-19. It will analyze the content of social media posts to identify posts referencing common symptoms of COVID-19, including fever, coughing, pain, headache, difficulty breathing, etc. Machine learning (ML) techniques will then be used to determine whether a post indicates a possible COVID-19 infection or only references the key terms. For instance, a tweet saying, “My daughter gave a lecture on COVID-19” provides information but does not indicate a possible case. However, a tweet saying “My neighbor’s daughter has had a fever for the last two days and is coughing constantly. I hope she is not infected with COVID-19” could indicate a possible infection. The proposed deep learning (DL) algorithms will analyze the content of posts to determine whether the post indicates that someone needs to be physically tested for COVID-19. We have also designed a surveillance system that can help measure the rate at which COVID-19 is spreading in a particular region. This system can help healthcare professionals automatically monitor people for possible symptoms of COVID-19 and decide on actions to control the spread particularly in regions where test kits and access to COVID-19 tests are limited.
The objectives of this study are (i) to determine how the system can distinguish posts mentioning information related to COVID-19 from those that could indicate possible cases; (ii) to train traditional machine learning algorithms to identify people infected with COVID-19; (iii) to train a recurrent neural network (RNN) using long short-term memory (LSTM) and compare its performance to that of traditional ML techniques; and (iv) to identify clusters of people with symptoms of COVID-19 and determine whether these clusters are growing at disturbing rates so that healthcare organizations can be informed to take actions if needed.
This paper is structured as follows. Section 2 describes the latest research in the field. This is followed by a detailed discussion of the surveillance framework and machine learning algorithms used to analyze social media text posts in Section 3. Section 4 describes and analyzes the experiments performed to test the system. Section 5 concludes the paper and offers suggestions for future research.
A call [1] for global AI researchers to develop novel techniques for text mining and data mining that could be used to help trace the spread of COVID-19 was issued by the White House, with collaboration from several research centers and technology companies. To support research requiring real-time data about COVID-19, the Allen Institute of AI developed a COVID-19 Open Research Dataset [2] that is open source and updated weekly. ML researchers can apply ML algorithms to this open-source dataset to better understand the patterns of the spread of the virus. They can also propose ways to improve the speed and accuracy of diagnoses, recommend therapeutic techniques, and identify individuals who are more susceptible to severe illness based on genetic and physiological characteristics. Different ML algorithms have been used to taxonomically classify the COVID-19 genome [3], to conduct Clustered Regularly Interspaced Short Palindromic Repeats (CRISPR-based) identification of COVID-19 [4], to predict survival rates for patients with severe COVID-19 [5], and to identify drugs that can be used to treat COVID-19 [6]. It is important to identify cases of COVID-19 at an early stage to treat patients effectively and control the spread of the virus. A reverse-transcription polymerase chain reaction (RT-PCR) test is used to diagnosis COVID-19 patients [7]. Chest computed tomography (CT) images are also considered a reliable way to identify cases of COVID-19, particularly in regions experiencing an epidemic. However, this technique requires the expertise of a radiologist and is time-consuming. Expertise and time are the most valuable resources in the current pandemic, especially in areas with uncontrolled spread of COVID-19. Therefore, an automatic analysis technique is desirable. In [8], a convolutional neural network (CNN) was used to identify cases of COVID-19. The experimental analysis of that technique demonstrated that CNN can efficiently classify CT images and identify cases of COVID-19.
Another study [9] made predictions about COVID-19 vaccine candidates using the Vasign reverse vaccinology tool and Vaxign-ML. That study found that the N protein is contained in highly pathogenic strains of coronaviruses (SARS/MERS/COVID-19) but not in those that cause mild symptoms. They also found that the S protein and five different non-structural proteins are adhesive and play key roles in the ability of SARS-CoV-2 to spread and invade a host. Predicting vaccine candidates can identify new strategies for the development of effective, safe vaccines. Major outbreaks like the COVID-19 pandemic require speedy identification of possible cases at an early stage. The genomic sequence of the virus must also be determined to control, treat, and contain the virus. One study [3] used a ML technique to classify SARS-CoV-2 with a high degree of accuracy and scalability. Digital signal processing and ML techniques, augmented by the decision tree technique, were used to analyze the viral genome. The results were validated using Spearman’s rank correlation coefficient. The genome causing COVID-19 has now been sequenced with 100% accuracy. In another study [10], COVID-19 cases were automatically identified using a dataset of X-ray images of lungs. The dataset included images of the lungs of patients with pneumonia, of the lungs of patients who tested positive for COVID-19, and of healthy lungs. CNN and transfer learning techniques were used to classify the images. In that study, the use of DL to analyze the X-ray images achieved the best accuracy, sensitivity, and specificity.
The COVID-19 outbreak began in the Wuhan province of China in the middle of January 2020. To control the spread of the virus, China implemented interventions such as quarantines, travel bans, and careful monitoring of all suspected cases. However, the impact of these policies on the epidemic is not known. One study [11] analyzed the impact of these measures on the spread of the virus using migration data and other data relevant to the spread of the virus and the pandemic curve. They then used AI techniques trained on SARS data to predict the course of the pandemic. Another study [12] used SIR and ML tools to analyze the COVID-19 pandemic in real scenarios. Another [13] used DL techniques to analyze CT images of the lungs of patients infected with COVID-19. In that study, 325 images from confirmed COVID-19 cases were analyzed, along with images of the lungs of patients with a history of pneumonia; a total of 740 images were examined. A transfer learning technique was used on ImageNet using Inception CNN. The model developed in that study could identify COVID-19 cases with 89.5%, 0.88 specificity, and 0.87 sensitivity. That study serves as proof of concept of the use of AI to identify cases of COVID-19 based on features of radiology scans. In another study [14], CT images were analyzed using AI to distinguish cases of COVID-19 from cases of pneumonia. The model developed in that study is called the COVID-19 Neural Network, or COVNet. It uses DL techniques to identify features in CT images that can be used to diagnose cases of COVID-19. The model also analyzed CT images to distinguish images of cases of pneumonia from those of healthy lungs. The images in that study were collected from six different hospitals from August 2016 to February 2020. The model’s performance was evaluated based on area under curve (AUC), sensitivity, and specificity. Yet another study [15] used AI techniques to help protect healthcare professionals from contracting COVID-19.
Another approach [16] used AI technologies and a mobile application to detect cases of COVID-19 by analyzing the sound of the patient’s cough. The main objective of that study was to minimize the rate of misclassifications. The application was able to differentiate the coughs of COVID-19 patients from regular coughs with 90% accuracy. The app is intended to complement clinical tests and thereby conserve resources. Meanwhile, another study [17] used different AI applications to diagnose COVID-19, examining different dimensions of the COVID-19 pandemic using ML techniques. They studied SARS-CoV-2 at the molecular level, using different clinical trials and different social perspectives. They also investigated the execution of various AI projects aimed at controlling the COVID-19 pandemic. In another study [18], ML algorithms were used to better understand COVID-19 pandemic, particularly its early dynamics. That study examined increases in the number of infections within a given period and sought to identify certain patterns in the pandemic, such as the rate at which mild symptoms become critical, the influence of asymptotic infections, the force of infection. It also sought to establish a mechanism for generating daily predictions of the number of new cases. The authors used U.S. data; in the United States, the first case was confirmed on January 20, 2020. Their mechanism is efficient and robust and can predict the course of the pandemic; it can also be generalized to other pandemics. In fact, they claim that the mechanism is so generic that it can be used to predict the spread of any virus in any population.
All of these studies used AI techniques to make predictions or classify features related to COVID-19. These AI techniques have demonstrated reasonably accurate performance. In the present paper, tweets (this research could be expanded to include other data and social media such as Facebook, phone messages, emails, etc.) were analyzed for content using AI. The goal was to identify tweets containing information that might indicate the existence of COVID-19 cases. These cases were then mapped to identify clusters. Clusters that were growing at alarming rates were then identified; an “alarming rate” might mean a cluster that doubled in size within one day. Quickly growing clusters need to be further analyzed; healthcare professionals must test the possible cases and implement the necessary precautionary measures.
This section describes the framework used to analyze the content of tweets to identify possible cases of COVID-19. The dataset used in the present study is described, and the DL algorithms used to analyze the content of tweets is explained.
The present paper proposes a method for identifying possible cases of COVID-19 based on the content of tweets. Twitter streaming application programming interface (API)3 was used to collect tweets related to COVID-19. Using this API, tweets posted from January 2020 to May 2020 and including the keywords (with hashtags) “fever,” “headache,” “cough,” “body ache,” “pain,” “quarantine,” “isolation,” “sanitization,” and “social distancing” were collected. Twitter’s streaming API4 was used to collect tweets containing these keywords. This open-source API allowed us to access tweets in real time using JavaScript object notation (JSON). A total of 245,098 tweets in English were collected from around the world. The tweets were then manually labelled to indicate which contained information that could indicate possible COVID-19 infections. These annotated data were then analyzed by the ML and DL algorithms. In order to eliminate bias, three researchers from different fields annotated the tweets independently. Each tweet was annotated with 1 or 0; a tweet indicating a possible COVID-19 infection was labelled 1, and a tweet that did not indicate a possible infection was labelled 0. If more than one researcher labels data, it is important to evaluate the level of agreement between different annotators. A technique proposed by McHugh [19], the Kappa test, was used here to evaluate inter-annotator agreement. A high Kappa number indicates high agreement across annotators and thus high reliability. The Kappa number for our annotations was 0.895, indicating strong agreement among the annotators.
On Twitter, tweets are restricted to 140 characters; tweets are therefore informal and noisy in nature. Many tweets contain abbreviation or hashtags and express sarcasm or humor. This kind of content is easily understood by humans, but for ML algorithms it poses a challenging task.
Only tweets in English were included in this study. First, stop word removal, stemming, and tokenization were performed to clean the data. Next, short tweets (tweets containing fewer than four words) were removed from the dataset, as short tweets usually do not contain enough information to extract the idea behind the tweet [20].
Word embedding techniques are used to represent vocabulary in a document. These techniques are used to capture the context of words in document, including syntactic and semantic similarities, relationships with other words, and so on. The vector representation of given words is illustrated using word embedding. Word2Vec [21] is a popular neural network consisting of two layers; it is used to process vectorized representations of words. The text is input to Word2Vec and produce a set of vectors containing features representative of the words in that corpus. Word2Vec places similar words into the same vector space. Given sufficient text and enough examples of words in context, Word2Vec can make accurate guesses about the meaning of a word based on previous occurrences of that word. This knowledge can be used for various purposes, such as to establish the association of one word with another word, to cluster and classify documents by topic, to analyze content, to search for key words, and to make recommendations.
For example, let’s consider a dictionary containing 10,000 English words. If these words are embedded using one-hot encoding, the entire dictionary would be represented in 10,000 different dimensions; no word would have a relationship with any other words. Therefore, this system would not identify the meaning or context of the words. A sample representation of the words Computer, Doctor, King, Man, Nurse, Queen, Table, and Women is shown in the top part of Fig. 1. The words are shown in a single dimension. Although words like King, Man, and Doctor are related, a linear representation does not show the relationships among these words. However, if we use word embedding, as in Word2Vec, around 300 dimensions can be used to represent the relationships of the 10,000 words in the dictionary. For example, the words King and Man are related by gender. In the example Doctor and Nurse indicates gender baseness of the model, as both doctor and nurse can be male or female. The relationships among a group of sample words are shown in Fig. 1.
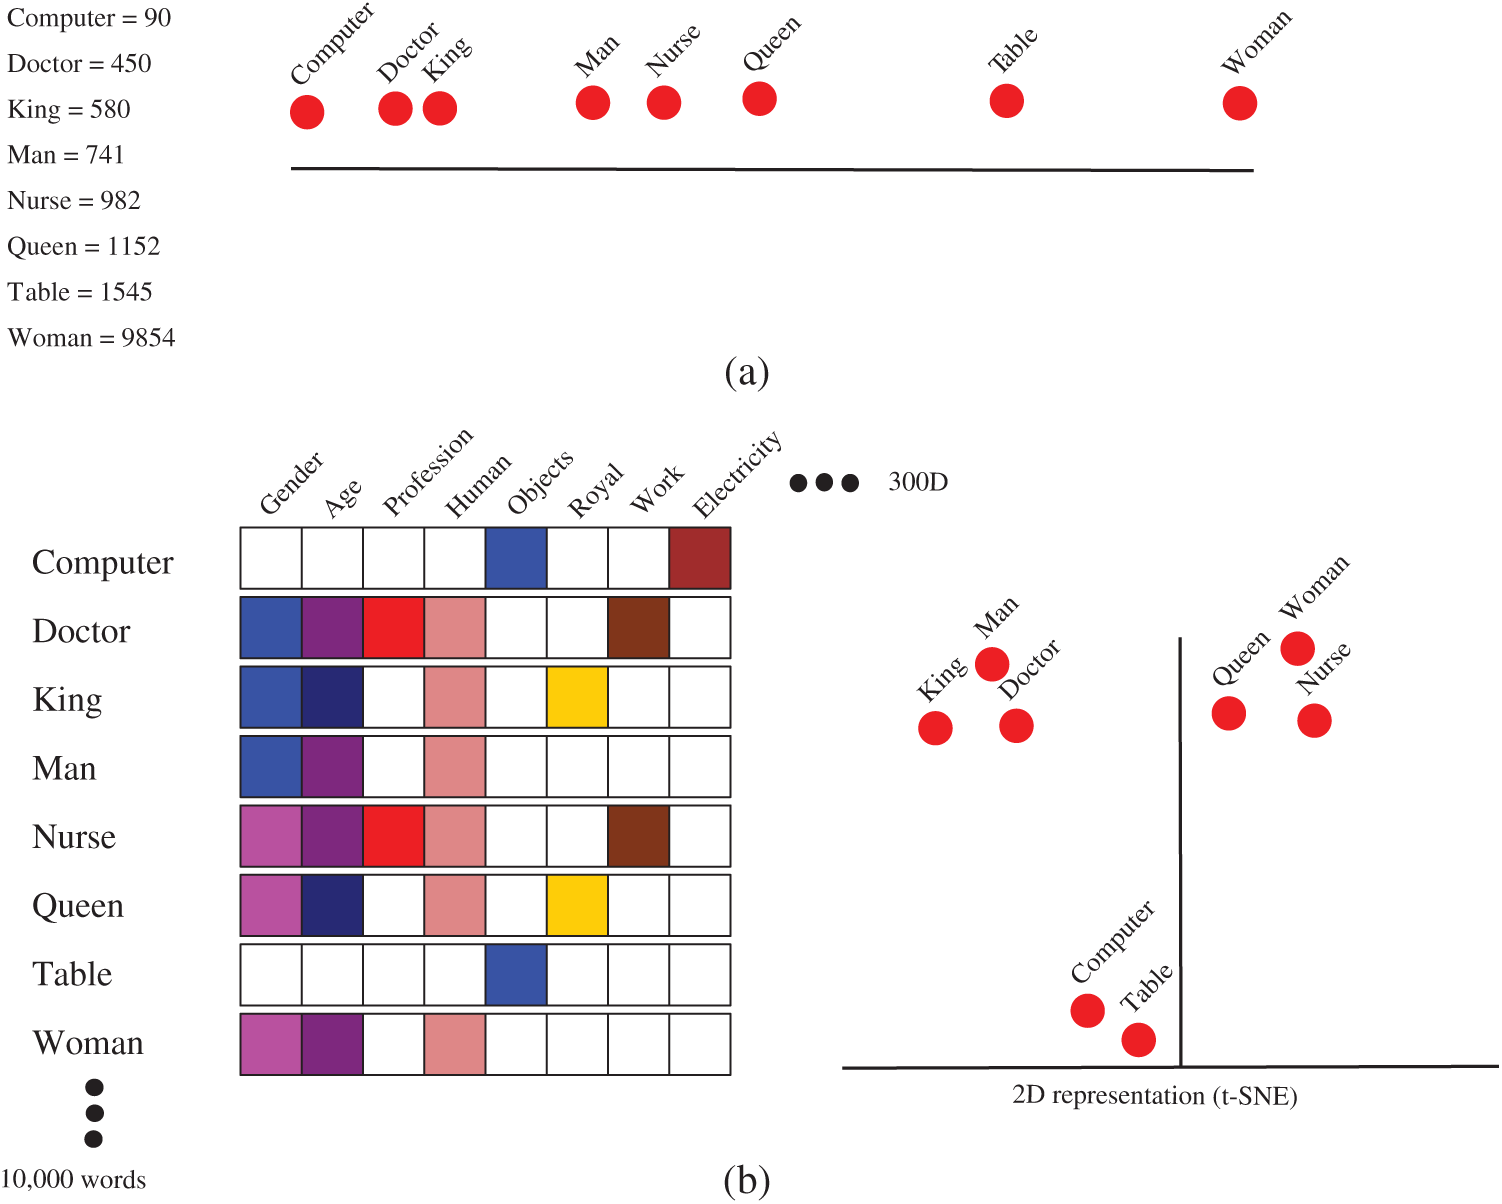
Figure 1: An example of word embedding (Word2Vec)
In a neural network, the input has a fixed size. As a result, the accuracy is low when the input involves sequences that do not have a predetermined size (such as sentences). Another issue with neural networks is that they do not account for the relationships among features, which are important in sentences since the words in a sentence are related to each other. A recurrent neural network (RNN) solves these issues. In an RNN, the input does not need to be a fixed size, and relationships among features of a sequence can be accounted for. An RNN can also remember things it has learned. For example, given a word in a sentence, an RNN remembers which words appear before the given word. A sample architecture of an RNN processing tweets and classifying them as positive or negative is shown in Fig. 2.
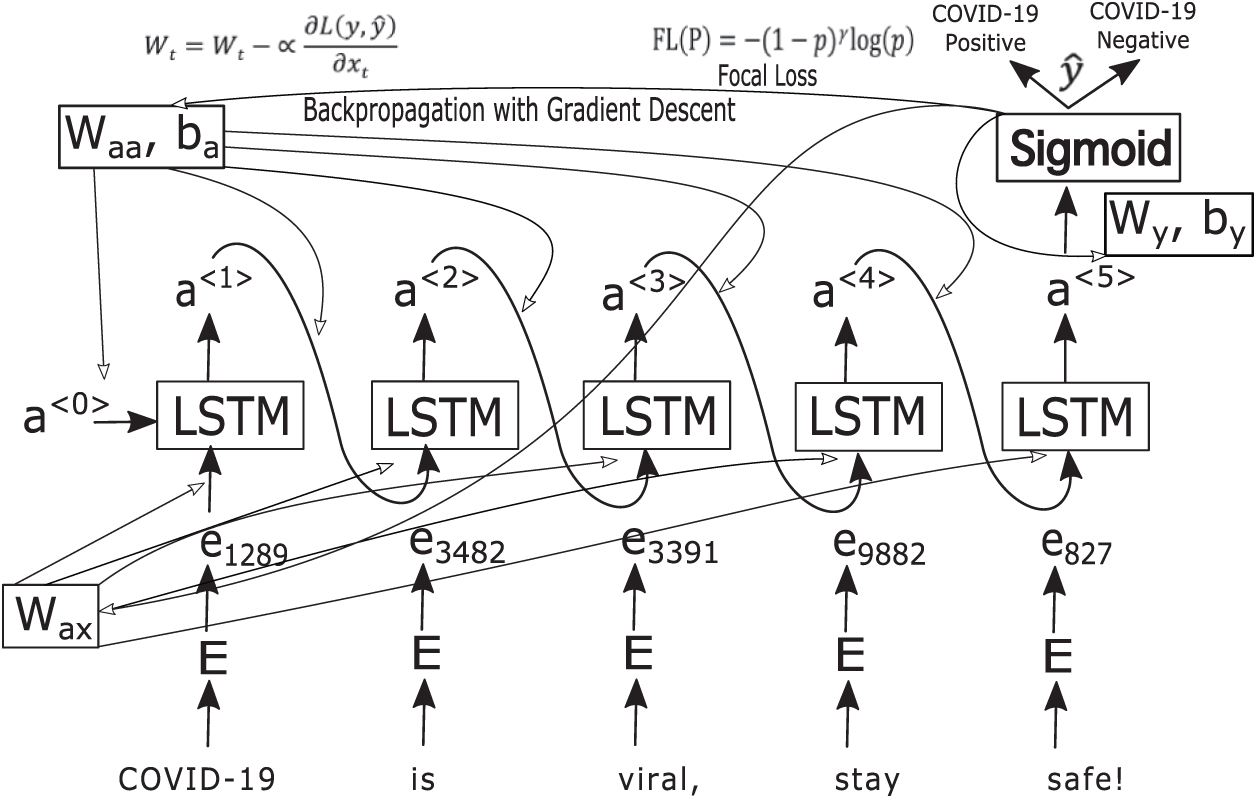
Figure 2: An RNN with an LSTM module classifying tweets
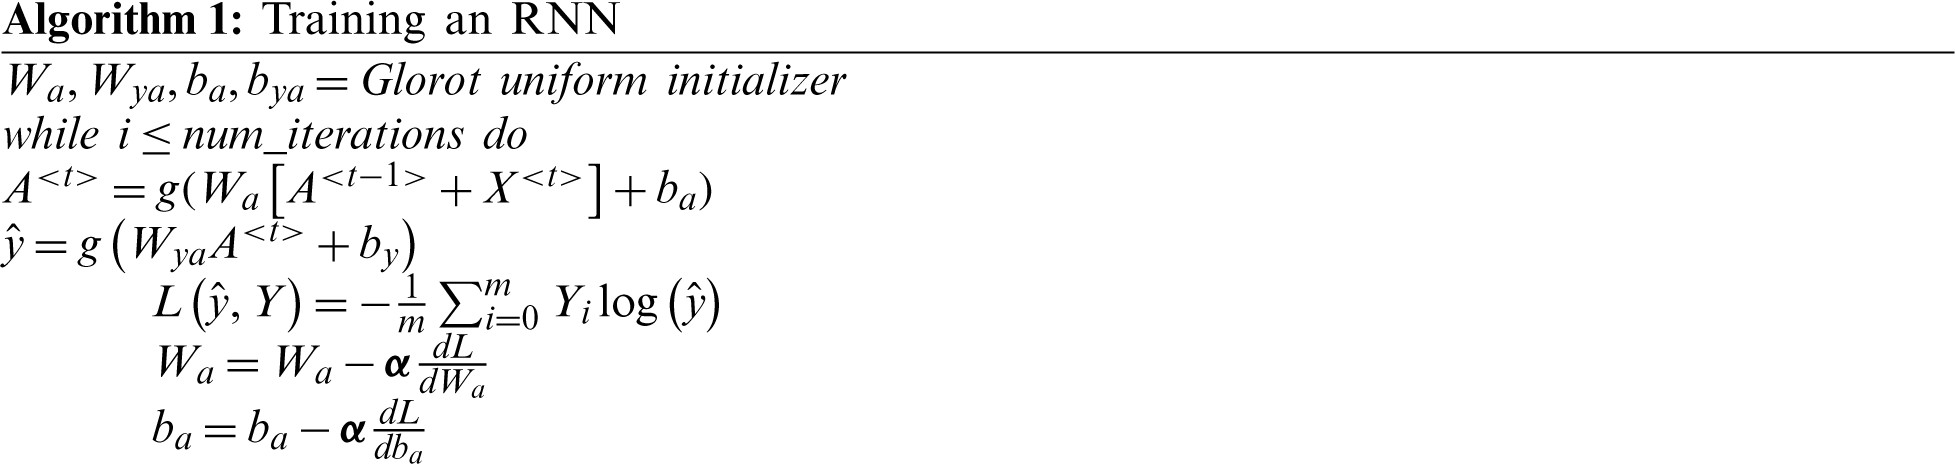
A sample training process for an RNN is provided in Algorithm 1. First, the input sequence is taken and a value from Wa, ba is taken, then the sigmoid activation function is utilized. Loss is computed at the output layer. A common type of loss is binary cross-entropy loss (CEL); the objective of the optimization algorithm is to minimize the cross-entropy loss. A simple optimization algorithm, such as gradient descent algorithm, is used. After a few iterations, the optimization algorithm has minimized loss and optimized the values of W and b.

RNN is an efficient architecture for connecting previous information with current information, such as predicting the next word based on the previous word. Consider the sentence: “I am suffering from COVID-19.” This clearly indicates that someone is infected with COVID-19; no further context is needed. But consider the tweet: “Last week I went to the hospital, where I stayed with other patients for two weeks; now I am feeling better and hopefully COVID-19 negative.” This tweet does not indicate a positive COVID-19 case because the patient stayed in the hospital for two weeks. The gap between the current task and the previous information can be very large. As this gap increases, an RNN is unable to capture the correct information; that is, it may fail to capture long-term dependencies [22]. This issue is solved using long short-term memory (LSTM).
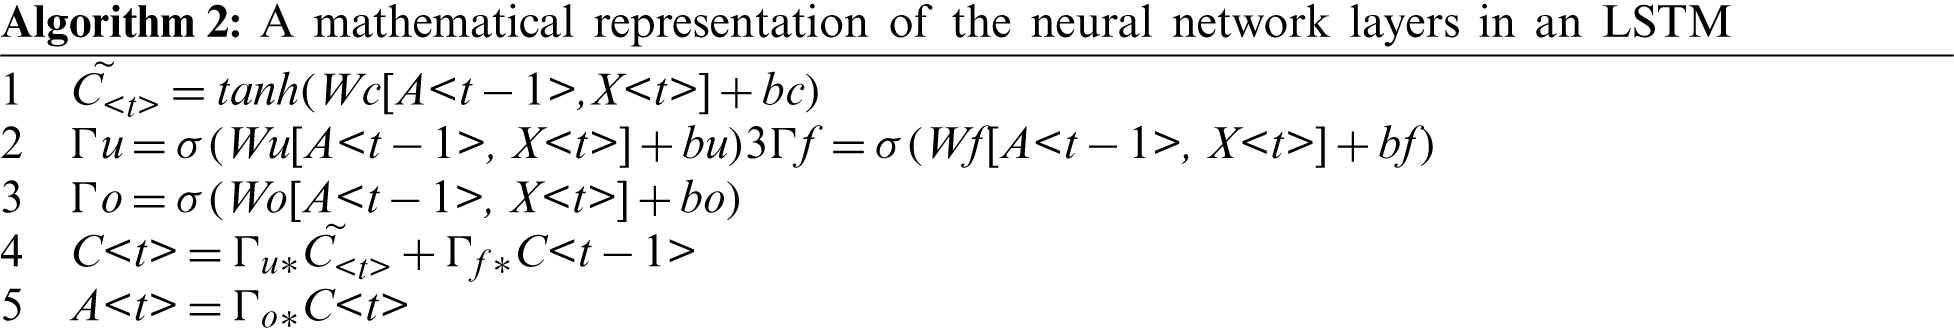
An LSTM is a specific type of RNN that is used to capture long-term dependencies. An LSTM includes four neural network layers that operate in a special fashion. The operations of these layers are shown in Algorithm 2; the architecture of an LSTM is illustrated in Fig. 3. The first sigmoid function is the forget gate, which determines which information should be forgotten from the previous cell state C< t −1 >. The second sigmoid function, along with the tanh activation, is known as the update gate. It determines which information should be saved to the cell state and which should be forgotten. The last sigmoid is called the output gate; it determines which information is provided to the next hidden state.
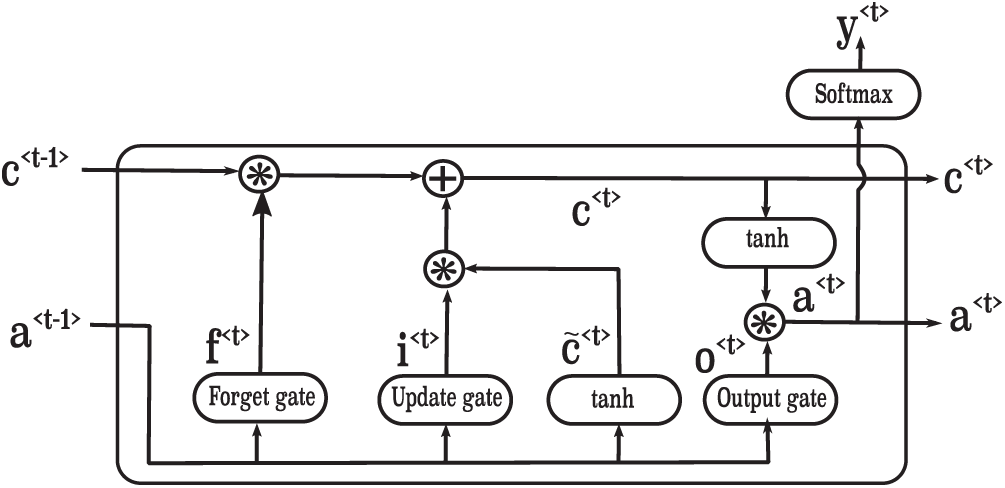
Figure 3: A sample architecture of an LSTM
In binary classification problems, binary CEL is usually used. The objective of the gradient descent optimization algorithm is to minimize this loss. The CEL is shown in Algorithm 1. To demonstrate the system, the CEL for binary class classification used in the COVID-19 corpus is shown in Eq. (1), where
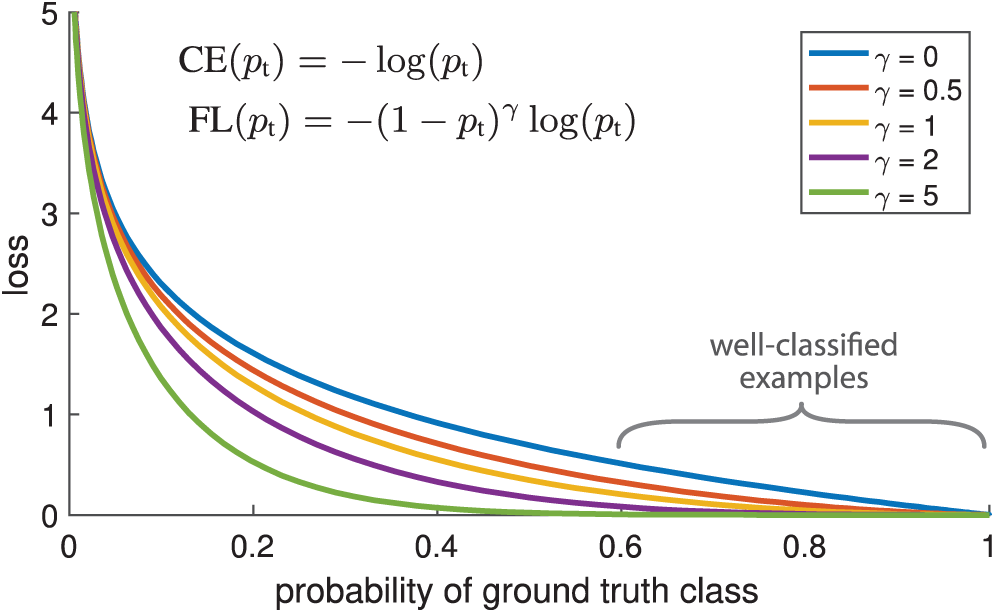
Figure 4: Cross-entropy loss vs. focal loss
Previous studies have demonstrated that a large class imbalance during training overwhelms the CEL [23]. Most loss consists of large numbers of easily classified negative classes; therefore, during the back propagation, this imbalance dominates the gradient computation. Where focal loss (FL) is an issue [23], a modulating factor
Clustering is used to divide data points into different groups based on characteristics. Clustering divides data points into different groups such that data points in one group are similar to each other but different from those in other groups. The objective is to separate groups with similar features to create clusters. To form clusters, we took the longitude and latitude values of tweets indicating a possible COVID-19 infection. The closer such tweets are in location and the more such tweets occur in one geographical area, the higher the chance that spread is high in that region. Clustering is a common technique for statistical analysis; it lies in the field of unsupervised learning. We used the k-means [24] algorithm to cluster positive COVID-19 cases and to analyze the rate at which these clusters were growing. The k-means algorithm was used because it is simple to implement, it scales to large datasets, it guarantees convergence, it can warm-start the positions of centroids, it can easily adapt to new examples, and it can generalize to clusters of different shapes and sizes.
This section describes the surveillance framework. The system works by collecting tweets containing words related to possible symptoms of COVID-19, such as cough, fever, headache, body aches, and breathing difficulties. These tweets were pre-processed to remove unnecessary details and stored in our database. Then the word embedding technique Word2Vec was applied to convert the text to numbers. These numbers were processed by the RNN for training; the RNN identified tweets that indicated possible COVID-19 cases and those that did not. The tweets were then grouped into clusters, and the clusters were analyzed to identify regions where the spread was increasing at an alarming rate. This framework can then help the government decide whether to implement precautionary measures to control the spread of the virus, such as strict lockdowns. The entire framework works as a surveillance system that analyzes tweets in real time to clarify the pattern of spread. If the framework indicates that the virus is spreading very quickly—that is, if a cluster is growing faster than a specified threshold—notifications can be sent to the authorities. For example, healthcare professionals could engage in mass testing in the region, government organizations could implement lockdowns, or residents could be provided food at home to eliminate the need to interact with others. The surveillance framework is illustrated in Fig. 5.
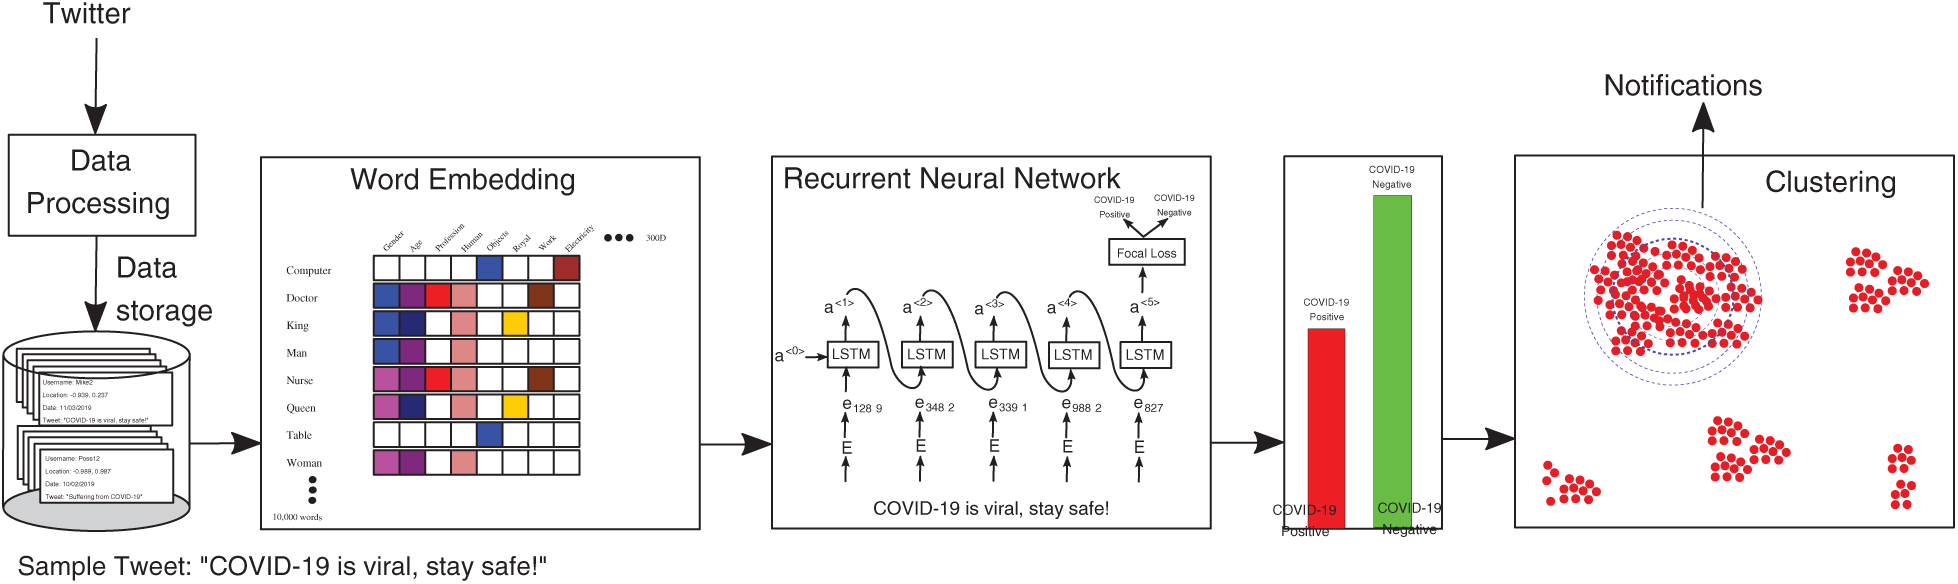
Figure 5: A surveillance framework that uses tweets to identify clusters of COVID-19 cases
In this paper, an RNN with LSTM is used to process sequence data. In this section, the performance of the RNN is compared to that of other ML algorithms. The performance of the RNN was compared to that of logistic regression, a naïve Bayes classifier, a support vector machine (SVM), a decision tree, an artificial neural network (ANN), and a deep neural network (DNN). A DNN is different from the other ML algorithms as it includes many layers to efficiently process data. However, even a DNN cannot process sequence data efficiently [25], mainly because the input size is fixed. When the data are sentences, such as tweets, the input size cannot be fixed. Furthermore, different neurons in ANNs and DNNs do not share data with each other. Data sharing is important in sequence data as the different words in a sentence are related.
Different ML models trained on the dataset were executed and their performance was evaluated; we found that the RNN achieved the highest accuracy when processing tweet data. The train and test accuracies achieved by different ML models are shown in Fig. 6a. As the figure shows, traditional ML techniques such as logistic regression, naïve Bayes, and SVM achieved a maximum of 86% accuracy; ANN and DNN achieved higher accuracy. However, the sequence is best captured by RNN with LSTM, which achieved 98% accuracy. The recall, precision, and F1-scores of different models are shown in Fig. 6b; again, RNN achieved the best results of the tested techniques.
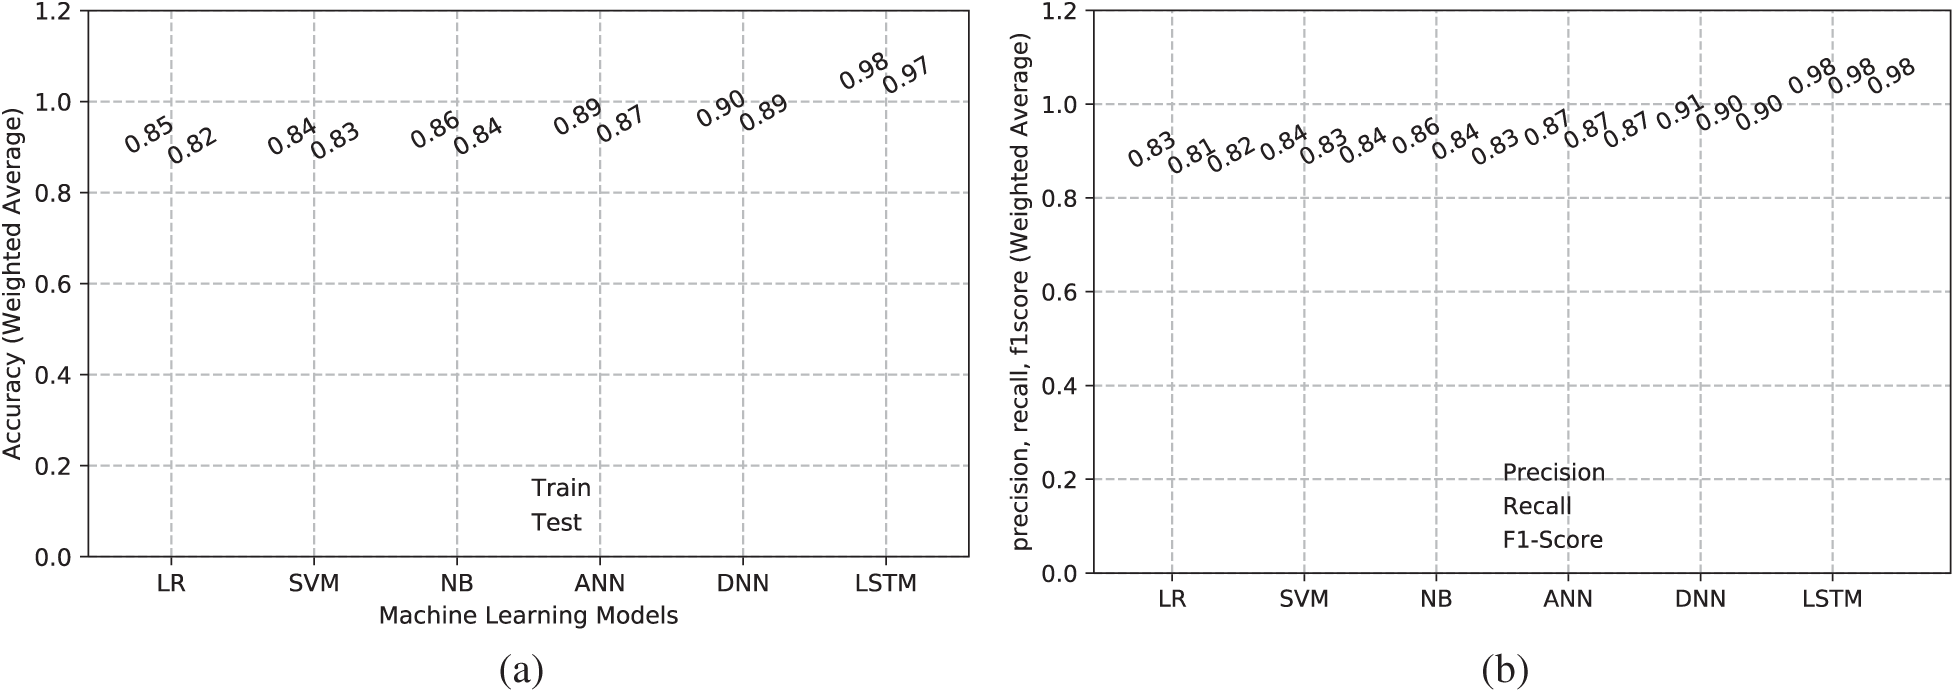
Figure 6: (a) Train and test accuracy and (b) Precision, recall, and F1-scores of different ML models
The confusion matrices computed by different ML algorithms are shown in Fig. 7. LSTM achieved fewer false positives and false negatives and high rates of true positives and true negatives. This demonstrates that LSTM could more effectively analyze the complex structures in our dataset than other ML algorithms.
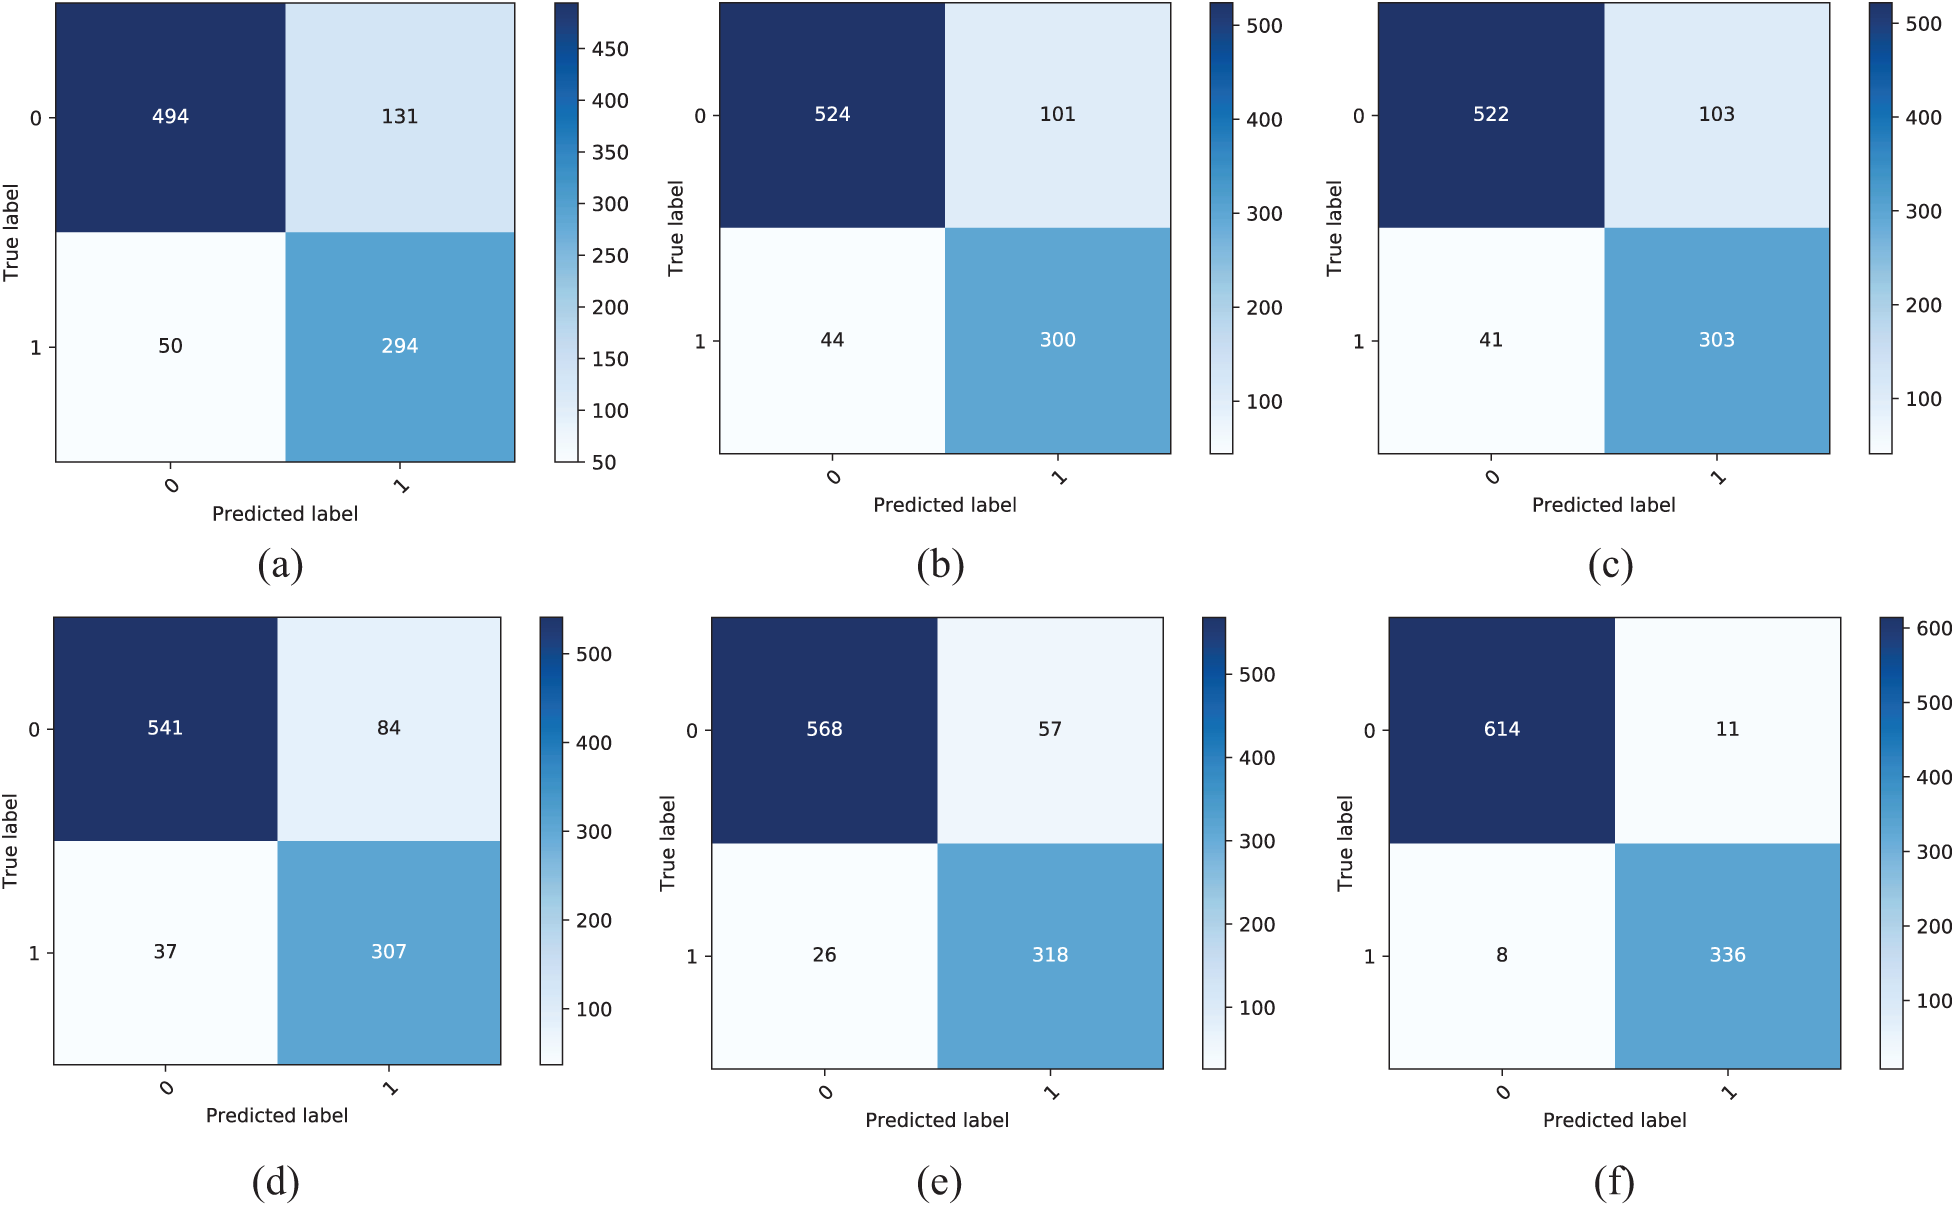
Figure 7: Confusion matrices computed by different ML algorithms. (a) Logistic regression confusion matrix (b) Naïve Bayes confusion matrix (c) SVM confusion matrix (d) ANN confusion matrix (e) DNN confusion matrix (f) LSTM confusion matrix
Another technique that we used to evaluate the performance of different ML algorithms is the receiver operating characteristic (ROC). A higher curve to the left indicates higher accuracy. The ROC obtained by the different ML algorithms is shown in Fig. 8. Traditional ML algorithms achieved accuracy of up to 88%. The highest accuracy was achieved by LSTM, demonstrating that LSTM can process tweet data efficiently and identify tweets that could indicate possible COVID-19 cases.
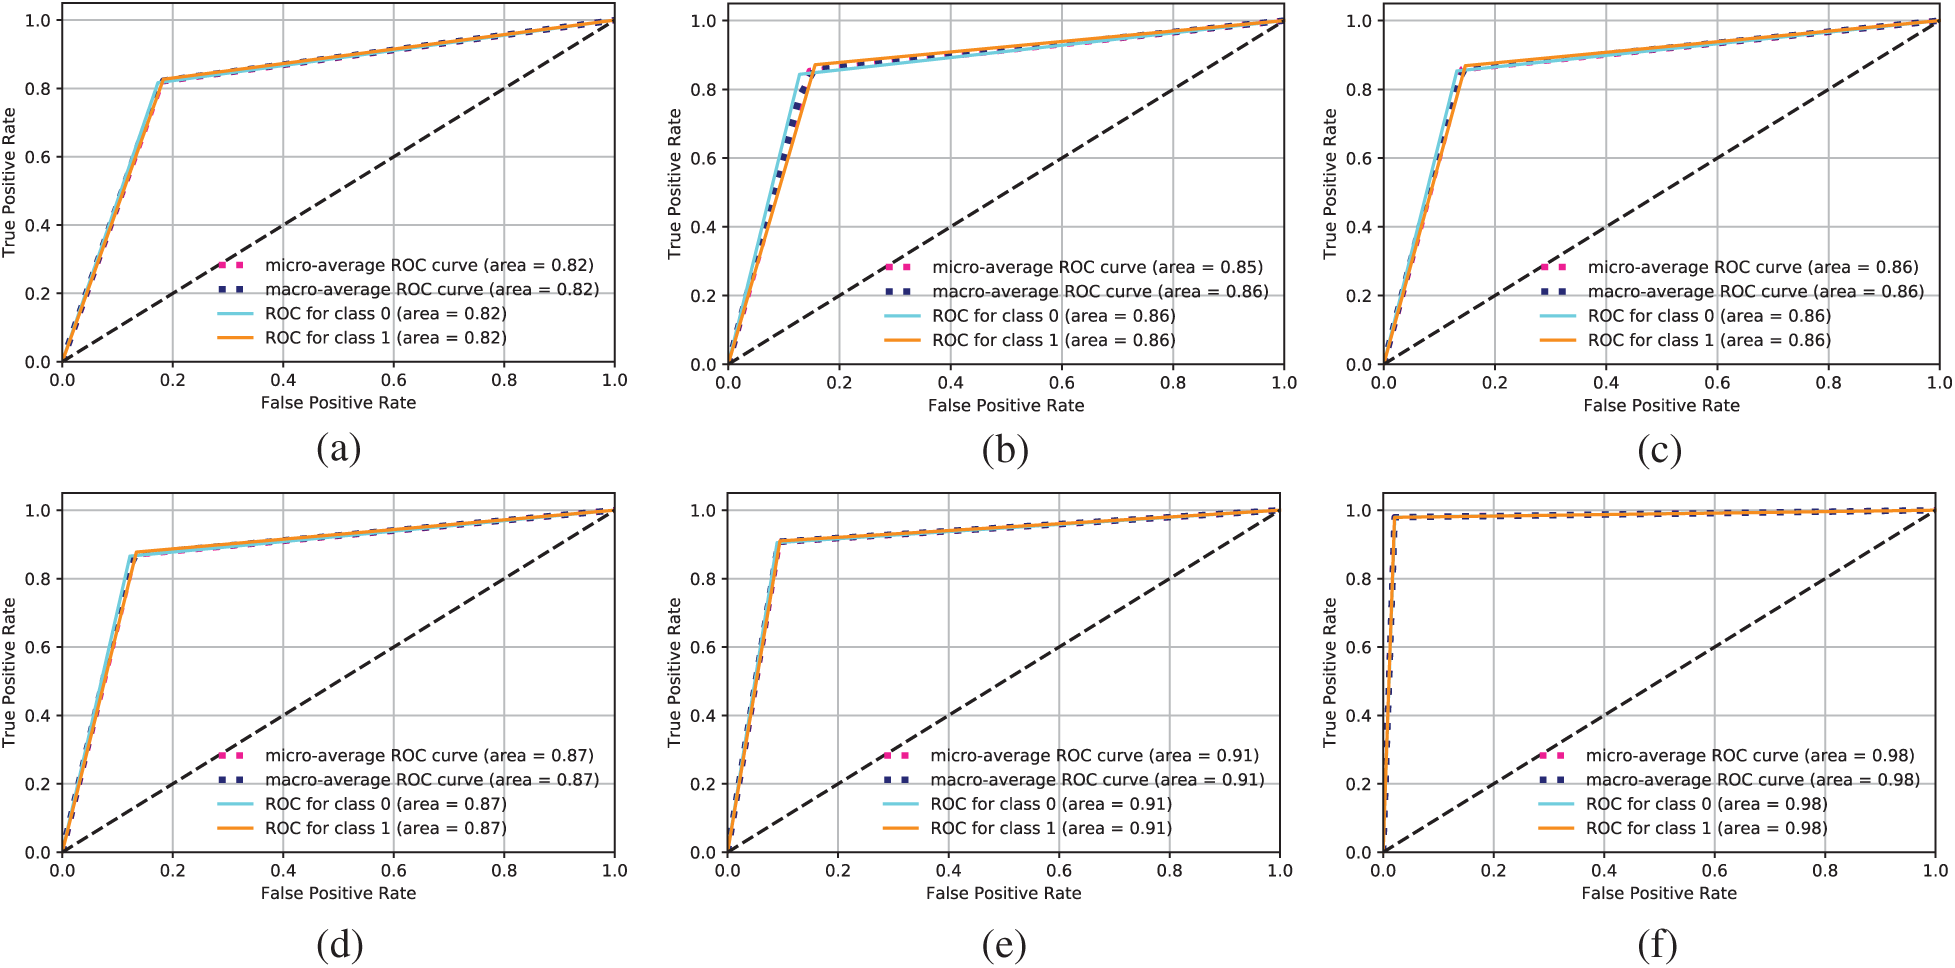
Figure 8: ROC achieved by different ML algorithms. (a) Logistic regression ROC (b) Naïve Bayes ROC (c) SVM ROC (d) ANN ROC (e) DNN ROC (f) LSTM ROC
We used the ML and DL frameworks to classify the tweets as positive or negative. Tweets that did not contain information indicating a possible COVID-19 case were classed as negative; these were discarded from the surveillance framework. Tweets labelled as positive contained information indicating a possible case of COVID-19. We used the k-means algorithm to create clusters of positive cases in one country (Pakistan), shown in Fig. 9. Here, the yellow and purple regions need further analysis as our data indicate high rates of spread in those regions. Since the surveillance system is used to continuously monitor the whole region, it can show when clusters increase in size and thereby help healthcare professionals implement measures to control the spread of the virus.
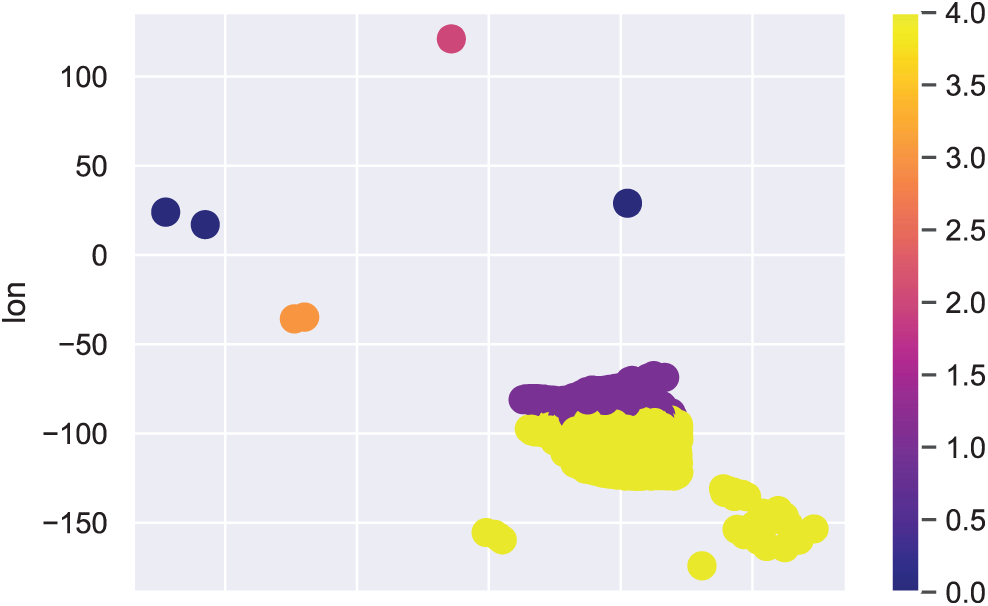
Figure 9: Clusters of positive cases in Pakistan
We also plotted the tweets in our database by country; the numbers of positive and negative tweets for several countries are shown in Fig. 10. The figure shows that only a small number of tweets contained information indicating possible COVID-19 cases, while many tweets in the database only contained information about COVID-19.
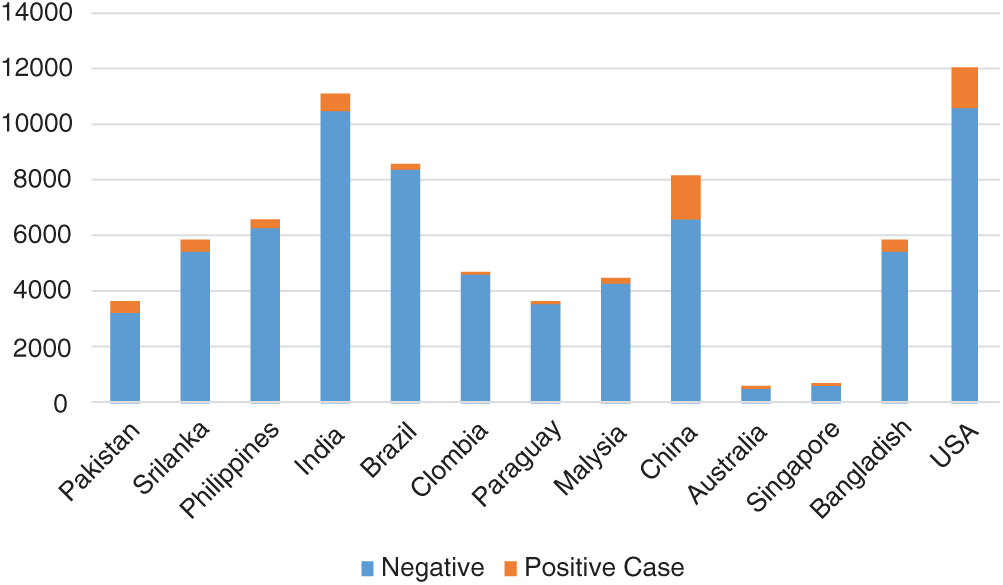
Figure 10: Distribution of positive and negative cases in several countries
The only way to identify individuals infected with COVID-19 is to test them. However, testing is an expensive resource that requires human effort. It is not possible to test all individuals to identify all cases of COVID-19. Therefore, there is a need for a surveillance system that can identify people who may have symptoms of COVID-19; clinical tests can then be used to confirm cases. The present paper proposes a surveillance system based on analyses of social media posts. The system can be used to identify regions where individuals with symptoms of COVID-19 and regions where the virus is spreading at an alarming rate. This system can help healthcare professionals take appropriate action to keep the situation under control and save precious lives. The surveillance system could also be extended to analyze other types of social medial or messages to identify COVID-19 cases. Our results show that a recurrent neural network is the most accurate type of machine learning technique for this surveillance system. Future research could extend this analysis to countries around the world and identify regions where the rate of spread is very high.
Acknowledgement: The authors acknowledge Taif university support for this research through Taif university Researchers Supporting Project number (TURSP-2020/231), Taif University, Taif, Saudi Arabia.
Notes
1 https://www.who.int/emergencies/diseases/novel-coronavirus-2019/advice-for-public.
2 https://www.cdc.gov/coronavirus/2019-ncov/prevent-getting-sick/prevention.html.
3 https://www.developer.twitter.com/
Funding Statement: Authors received financial support from Taif university through Researchers Supporting Project number (TURSP-2020/231), Taif University, Taif, Saudi Arabia.
Conflicts of Interest: The authors declare that they have no conflicts of interest to report regarding the present study.
1. A. Alimadadi, S. Aryal, I. Manandhar, P. B. Munroe, B. Joe et al. (2020). , “Artificial intelligence and machine learning to fight covid-19,” Physiological Genomics, vol. 52, no. 4, pp. 200–202. [Google Scholar]
2. L. L. Wang, K. Lo, Y. Chandrasekhar, R. Reas, J. Yang et al. (2020). , “CORD-19: The COVID-19 open research dataset. arXiv. [Google Scholar]
3. G. S. Randhawa, M. P. M. Soltysiak, H. El Roz, C. P. E. de Souza, K. A. Hill et al. (2020). , “Machine learning using intrinsic genomic signatures for rapid classification of novel pathogens: COVID-19 case study,” PLoS One, vol. 15, no. 4, pp. 1–24. [Google Scholar]
4. H. C. Metsky, C. A. Freije, T. S. F. Kosoko-Thoroddsen, P. C. Sabeti and C. Myhrvold. (2018). “CRISPR-based surveillance for COVID-19 using genomically-comprehensive machine learning design,” bioRxiv, pp. 1–11. [Google Scholar]
5. L. Yan, H.-T. Zhang, Y. Xiao, M. Wang, C. Sun et al. (2020). , “Prediction of criticality in patients with severe Covid-19 infection using three clinical features: A machine learning-based prognostic model with clinical data in Wuhan. medRxiv. [Google Scholar]
6. Y. Ge, T. Tian, S. Huang, F. Wan, J. Li et al. (2020). , “A data-driven drug repositioning framework discovered a potential therapeutic agent targeting COVID-19. medRxive, pp. 1–62. [Google Scholar]
7. L. J. Carter, L. V. Garner, J. W. Smoot, Y. Li, Q. Zhou et al. (2020). , “Assay techniques and test development for COVID-19 diagnosis,” ACS Central Science, vol. 6, no. 5, pp. 591–605. [Google Scholar]
8. D. Singh, V. Kumar, Vaishali and M. Kaur. (2020). “Classification of COVID-19 patients from chest CT images using multi-objective differential evolution-based convolutional neural networks,” European Journal of Clinical Microbiology & Infectious Diseases, vol. 39, no. 7, pp. 1379–1389. [Google Scholar]
9. E. Ong, M. U. Wong, A. Huffman and Y. He. (2020). “COVID-19 coronavirus vaccine design using reverse vaccinology and machine learning,” Frontiers in Immunology, vol. 11, no. 1, pp. 1581. [Google Scholar]
10. I. D. Apostolopoulos and T. A. Mpesiana. (2020). “Covid-19: Automatic detection from x-ray images utilizing transfer learning with convolutional neural networks,” Physical and Engineering Sciences in Medicine, vol. 43, no. 2, pp. 635–640. [Google Scholar]
11. Z. Yang, Z. Zeng, K. Wang, S. S. Wong and W. Liang. (2020). “Modified SEIR and AI prediction of the epidemics trend of COVID-19 in China under public health interventions,” Journal of Thoracic Disease, vol. 12, no. 3, pp. 165–174. [Google Scholar]
12. B. M. Ndiaye, L. Tendeng and D. Seck. (2020). “Analysis of the COVID-19 pandemic by SIR model and machine learning technics for forecasting. arXiv. [Google Scholar]
13. S. Wang, B. Kang, J. Ma, X. Zeng, M. Xiao et al. (2020). , “A deep learning algorithm using CT images to screen for corona virus disease (COVID-19). medRxiv. [Google Scholar]
14. L. Li, L. Qin, Z. Xu, Y. Yin, X. Wang et al. (2020). , “Using artificial intelligence to detect COVID-19 and community-acquired pneumonia based on pulmonary CT: Evaluation of the diagnostic accuracy,” Radiology, vol. 296, no. 2, pp. 65–71. [Google Scholar]
15. B. McCall. (2020). “COVID-19 and artificial intelligence: Protecting health-care workers and curbing the spread,” Lancet Digital Health, vol. 2, no. 4, pp. 166–167. [Google Scholar]
16. A. Imran, I. Posokhova, H. N. Qureshi, U. Masood, S. Riaz et al. (2020). , “AI4COVID-19: AI enabled preliminary diagnosis for COVID-19 from cough samples via an app,” Informatics in Medicine Unlocked, vol. 20, no. 1, pp. 100378. [Google Scholar]
17. J. Bullock, A. Luccioni, K. Hoffman Pham, C. Sin Nga Lam and M. Luengo-Oroz. (2020). “Mapping the landscape of artificial intelligence applications against COVID-19,” Journal of Artificial Intelligence Research, vol. 69, no. 1, pp. 807–845. [Google Scholar]
18. M. Magdon-Ismail. (2020). “Machine learning the phenomenology of COVID-19 from early infection dynamics. medRxiv, pp. 1–16. [Google Scholar]
19. M. L. McHugh. (2012). “Interrater reliability: The kappa statistic,” Biochemia medica, vol. 22, no. 3, pp. 276–282. [Google Scholar]
20. B. Han and T. Baldwin. (2011). “Lexical normalisation of short text messages: Makn sens a #Twitter,” in ACL-HLT, 2011-Proc. of the 49th Annuual Meeting of the Association Computational Linguistics Human Language Technologies, Association for Computational Liguistics, Portland, Oregon, USA, pp. 368–378. [Google Scholar]
21. T. Mikolov, I. Sutskever, K. Chen, G. Corrado and J. Dean. (2013). “Distributed representations of words and phrases and their compositionality,” in Proc. of the 26th Int. Conf. on Neural Information Processing Systems, NY, USA, vol. 2, pp. 3111–3119. [Google Scholar]
22. Y. Bengio, P. Simard and P. Frasconi. (1994). “Learning long-term dependencies with gradient descent is difficult,” IEEE Transactions on Neural Networks, vol. 5, no. 2, pp. 157–166. [Google Scholar]
23. T. Lin, P. Goyal, R. Girshick, K. He and P. Dollár. (2017). “Focal loss for dense object detection,” in IEEE Int. Conf. on Computer Vision, Venice, Italy, pp. 2999–3007. [Google Scholar]
24. X. Jin and J. Han. (2010). “K-Means clustering,” In Encyclopedia of Machine Learning, C. Sammut, G. I. Webb (eds.Boston, MA: Springer US, pp. 563–564. [Google Scholar]
25. N. Farsad and A. Goldsmith. (2018). “Neural network detection of data sequences in communication systems,” Transaction in Signal Processing, vol. 66, no. 21, pp. 5663–5678. [Google Scholar]
 | This work is licensed under a Creative Commons Attribution 4.0 International License, which permits unrestricted use, distribution, and reproduction in any medium, provided the original work is properly cited. |