DOI:10.32604/cmc.2021.016143
| Computers, Materials & Continua DOI:10.32604/cmc.2021.016143 | |
| Article |
Rasch Model Assessment for Bloom Digital Taxonomy Applications
Faculty of Education, Universiti Kebangsaan Malaysia, Bangi, 43600, Malaysia
*Corresponding Author: Mohd Effendi Ewan Mohd Matore. Email: effendi@ukm.edu.my
Received: 25 December 2020; Accepted: 12 February 2021
Abstract: Assessment using Bloom’s taxonomy levels has evolved in a variety of contexts and uses. In the era of the COVID-19 pandemic, which necessitates use of online assessment, the need for teachers to use digital-based taxonomy skills or Bloom’s Digital Taxonomy (BDT) has increased even more. However, the existing studies on validity and reliability of BDT items are limited. To overcome this limitation, this study aims to test whether BDT has good psychometric characteristics as a teacher’s self-assessment tool using the Rasch model analysis and to investigate the pattern of BDT usage in teaching and learning. By using a quantitative online survey design, this study involves six levels of BDT, namely, Remembering, Understanding, Applying, Analyzing, Evaluating, and Creating. The questionnaire was developed and validated by two experts prior to administration. A stratified random sampling technique was conducted on 774 secondary teachers from five geographical zones in Malaysia, and the Rasch model was analyzed using WINSTEPS 3.71 software. The performances of items improved by Rasch psychometric assessment including the application of BDT among teachers. The hierarchy level was also assessed through graphical analysis, including the Wright map and bubble chart, to demonstrate the powerful performance of the Rasch model analysis in investigating item quality and reliability. Overall, these empirically validated items using the Rasch model could advance the academic knowledge of BDT for future assessment and promote the Rasch calibration in an educational setting.
Keywords: Bloom’s digital taxonomy; assessment; dichotomous score; Rasch
The term “taxonomy” originates from the Greek words “taxis” and “nomos,” which refer to “order” and “method,” respectively. This term may be referred to as an arrangement or a law in a specific order that is borrowed from biology, which allows certain classifications of the order. In the development of effective methods to perform mental operations, the notion of ordering is essential to classify these operations and skills and to determine the formation sequences in order to grow and solve certain problems [1]. Bloom’s taxonomy was introduced in 1965 by Benjamin Bloom [2] based on his idea of pedagogical taxonomy that refers to the development of a clear pedagogical goal system that focuses on cognitively, affectivity and psychomotor development. There are six cognitive activity levels surrounding the cognitive domain of Benjamin Bloom’s taxonomy, which range from the easiest to the hardest levels, including Knowledge, Comprehension, Application, Analysis, Synthesis, and Evaluation. The taxonomy was prudent to verbalize the objectives of education based on each cognitive activity level. In 2001, Revised Bloom’s Taxonomy (RBT) was introduced by Lorin Anderson and David Krathwohl by revising and developing Benjamin Bloom’s concepts into four dimensions: factual, conceptual, procedural, and metacognitive [2]. The number of cognitive domains remains six with changes from noun to the verb form; namely, the domain names have been changed to: Remembering, Understanding, Applying, Analyzing, Evaluating, and Creating [2]. Bloom’s Taxonomy has been recommended to be incorporated in both teaching and learning processes, as well as assessment practices [3].
In 2008, the era of Bloom’s taxonomy named the Bloom’s Digital Taxonomy (BDT) was introduced by Andrew Churches [4]. The BDT consists of six key terms that involve six levels based on difficulty, from the easiest level to the hardest, starting from Remembering and followed by Understanding, Applying, Analyzing, Evaluating, and Creating. Digital taxonomy proposes learning objectives to be in a technology-enhanced teaching context and necessary instructions on how to practice a certain skill to realize its full potential. Each level of taxonomy is supported by an extensive list of thinking skills adapted to a technology-enhanced teaching and learning environment. These activities can make the learning process fun and interesting [5]. The BDT has its own advantages in Bloom’s development. The main advantage of the BDT is that educators can get some ideas on how to use digital tools for learning and teaching. Reference [6] emphasized that educators need to be competent in terms of knowledge, skills, and attitudes in learning. One of the main competencies relates to pedagogic competencies. In this work, the BDT is one of the pedagogic components that need to be acquired. However, there is a question of whether teachers use all of BDT activities in their teaching and learning. These findings are crucial for providing information to related parties about current shortcomings in teaching that can be improved to enhance both teaching skills and teachers’ confidence in applying digital-based activities in class.
In recent years, there has been an increasing amount of literature on BDT, which has been published. Some studies have been interested in examining the BDT application to the teaching process. The related studies have shown that the role of teachers in BDT is of great significance when it is used in the classroom. In fact, previous studies have tended to criticize the original Bloom’s taxonomy because of its changes toward the digital.
In [7], the knowledge and application of digital verbs and tools by both teachers and students were investigated in order to understand the environment of virtual and conventional learning conceptually. This study has explained that students attending online (distance) learning are better in the application of digital tools, and they can understand them well in addition to their involvement in higher-order thinking tasks, such as publishing and podcasting. Meanwhile, in [1], Benjamin Bloom’s psychological and pedagogical model was developed and modified for the systems of adult learning. Based on the analysis, the techniques stemmed from Bloom’s taxonomy, which was modified for adult training, enabled the development of students’ skills and abilities in analyzing problems thoroughly and comprehensively as well as producing effective and creative solutions.
In [8], the authors described the teaching experience involving a course that introduced educational technologies to teachers in Macau, which was designed based on connectivism, which represented learning theory in the digital era that highlighted the interaction and engagement with digital media and sharing of digital artifacts. The learning outcomes constructively coincided with the activities and assessments of learning and teaching relative to the students’ learning needs and disparity in competencies and technological skills, contributing to the discussion regarding how the teachers could learn to teach using digital technologies. In a study conducted in Bulgaria [9], the authors discussed the changes in modern pupils’ characteristics, regarding them as a “digital generation,” particularly in the area of computer sciences. The results [8,9] showed that introduced changes directly affected the learning-objective taxonomy from classic to revised and ultimately to digital. The dynamics of the learning-objective taxonomy were further explored to clarify the concepts of e-learning, blended learning, electronic learning object, and m-learning based on the digital generation’s characteristics. This is vital in order to evolve the learning-objective taxonomy, elucidate the interactivity levels achieved upon the development of e-learning objects to be implemented in the blended learning. It can provide digital instruments as well as authoring tools required by students in the creation of electronic learning objects involving the high cognitive levels of Bloom’s digital taxonomy, i.e., evaluation and creation. Generally, the mentioned studies have outlined the teachers’ critical role in the implementation of BDT in the teaching process.
In [10], the authors examined the application of Bloom’s taxonomy to describe a psychotherapeutic game relative to cognitive processing and knowledge level. The RBT was introduced and applied to five psychotherapeutic games: Personal Investigator, Treasure Hunt, Ricky and the Spider, Moodbot, and SuperBetter. Based on the results, the revised Bloom’s Taxonomy was not suitable for comparing the game content. Also, RBT should not be applied to objectively classify psychotherapeutic game content since the results yielded a very low intercoder reliability value.
The adaptation of the revised taxonomy to a new generation of students and a general summary of how Bloom’s Original Taxonomy could evolve to Bloom’s Revised Taxonomy and initiate Bloom’s Digital Taxonomy were presented in [11]. As concluded by the authors, the current restrictions on technology usage in the classroom limited establishment of an association between the classroom and in real life. In [12], it was highlighted that the latest ICT technologies could enhance teaching and learning. The SAMR model and Bloom’s taxonomy of educational objectives were implemented at the secondary grammar school for General English and the higher institution for the English for Specific Purposes subject. The two abovementioned studies analyzed the adaptation of Bloom’s Original Taxonomy to Bloom’s Digital Taxonomy. In [13], thirty compilations posted on websites were analyzed and evaluated on the extent to which these verbs were in alignment with Bloom’s taxonomy categories. As explained by the author, Bloom’s taxonomy value was heuristic for writing student learning outcomes, and these learning outcomes should be considered by other faculties to describe the expertise level of students who had obtained an associate’s, bachelor’s, or graduate degree. Reference [14] analyzed the original and revised taxonomies and presented the major criticisms on Bloom’s original taxonomy, as well as several criticisms on the revised taxonomy.
Recent taxonomies of objectives and learning-objective strategies can be categorized in terms of the content types (e.g., facts, principles, procedures, concepts, and processes) and performance level (e.g., using and remembering). In [15], a pilot study on the BDT application in an online art project aimed at identifying challenges and affordances in helping amateur artists build their art portfolio through social media sites and other Internet resources was conducted. Due to the high demand of communication technology and computers in art education, the learning possibilities in the online environment have been required to be extended.
In [16], it has been explained that Bloom’s taxonomy can be used by information professionals who train or instruct others how to write learning objectives that describe skills and abilities that learners should master and demonstrate. Since Bloom’s taxonomy distinguishes levels of cognitive skill, the Bloom’s practice requires learning objectives with a high cognitive skill level and leads to in-depth learning as well as the knowledge and skill transfer to various contexts and tasks. In [17], the responses given by a total of 1,245 science students and 47 science teachers from 14 Catholic high schools in Sydney, Australia, were analyzed. The students and teachers analyzed types of activities using laptops as self-reported, and the BDT was used to differentiate the activities from lower to a higher order. Although the use of pen and paper gradually shifted to using laptops, the students’ modal practice entailed the lower-order paradigm of note-taking, as well as working from textbooks electronically using Word processing and electronic textbooks in addition to online searching. In addition, it was observed that students had benefited from higher-order activities, such as blogging and video editing, while teachers were not inclined to engage in these activities.
In Malaysia, only a few studies have discussed Bloom’s taxonomy from the digital-based aspect. Previous studies have reported that Bloom’s taxonomy has the potential to be applied to different fields, including vocational taxonomic proposals [18], discussion on Bloom improvement in Islamic perspectives [19], promoting creative and critical thinking through English syllabus with augmented taxonomy [20], and understanding more about children’s skills in the process of designing digital storytelling games using a tablet [21]. The mentioned studies have highlighted the need for Bloom’s taxonomy and BDT to be used in a wider context. However, to the best of the author’s knowledge, there have been very limited studies on assessing the psychometric characteristics of BDT measurement items. Quality items can lead to a better measurement of BDT in the local context based on BDT levels. In [18,19], Bloom’s Taxonomy was discussed and criticized from the Malaysian context, laying a foundation for further studies on BDT.
In [18], the weaknesses of Bloom’s taxonomy in classifying vocational domains were discussed, and a new taxonomy was suggested. Using Delphi techniques, six major domains of vocational taxonomy have identified and verified, namely, knowledge, gross motor skills, fine motor skills, visualization, problem-solving, and inventive skills. Meanwhile, in [19], Western criticism and Islamic views on Bloom’s taxonomy were discussed, and it was found that there had been criticisms and improvements from the past studies focusing on Bloom’s taxonomy to a new taxonomy regarding four topics, namely, hierarchical arrangements, structural classification, uses, and needs. The new taxonomy refers to the 21st century learning, especially to the field of Islamic measurement context in Malaysia. In contrast, in [20], the relevance of Bloom’s taxonomy that included digital elements was discussed from the aspect of augmented reality. A literature review was conducted to examine the extent to which Bloom’s Taxonomy of Educational Objectives could be relevant for teaching creative and critical thinking among Malaysian students, identifying the missing aspects in Bloom’s taxonomy in the indigenous context as well as highlighting the importance of promoting creative and critical thinking among Malaysian students while reporting the issues surrounding English Literature to be taught as a subject. Finally, the English syllabus, in addition to augmented taxonomy, was suggested based on the outcomes of holistic learning comprising three sets of ability-rationale thinking, purposeful thinking, and context effective relation. However, in this work, one of the objectives is to overcome the critiques by assessing the quality of items for the BDT using the screening list of the existing items without modification, particularly using the new modern measurement theory.
As presented in this section, there have been many studies discussing BDT application to the teaching activities, and some of these studies considered the BDT usage in Malaysia. However, in order to measure the BDT, a very high quality of the measurement items is required. The related literature has emphasized the lack of psychometric assessment of items to measure BDT. This limitation can be overcome using modern assessment theory, such as the Rasch model, to ensure the reliability and validity of the measurement. Hence, the BDT practice application in the classrooms by teachers should be further studied. These findings could provide a useful reference in identifying the teachers’ ability to use each level of BDT maximally. In view of all mentioned, one may suggest an approach to examine the psychometric characteristics of BDT measurement items in more detail besides creating a new bloom. Hence, BDT discussion with efforts to provide empirical evidence for new psychometrics items or constructs will help researchers strengthen their future studies more meaningfully.
2.1 Conceptualization and Operationalization
Conceptualization and operationalization used in this study entail BDT based on the definition presented by [4] as shown in Tabs. 2 to 7. The BDT is based on the six key terms, involving six levels based on difficulty, starting from the easiest level that is Remembering, followed by Understanding, Applying, Analyzing, Evaluating, and finally Creating. The BDT definitions are presented in Tab. 1. However, there is a limitation of the use of digital verbs in academia. First, digital tools are grouped based on their appropriate level, which is sometimes difficult to conduct because as they may be used for multiple purposes. In this context, this study examines the extent to which teachers use BDT key terms in the teaching and learning process.
Table 1: Bloom’s digital taxonomy definitions
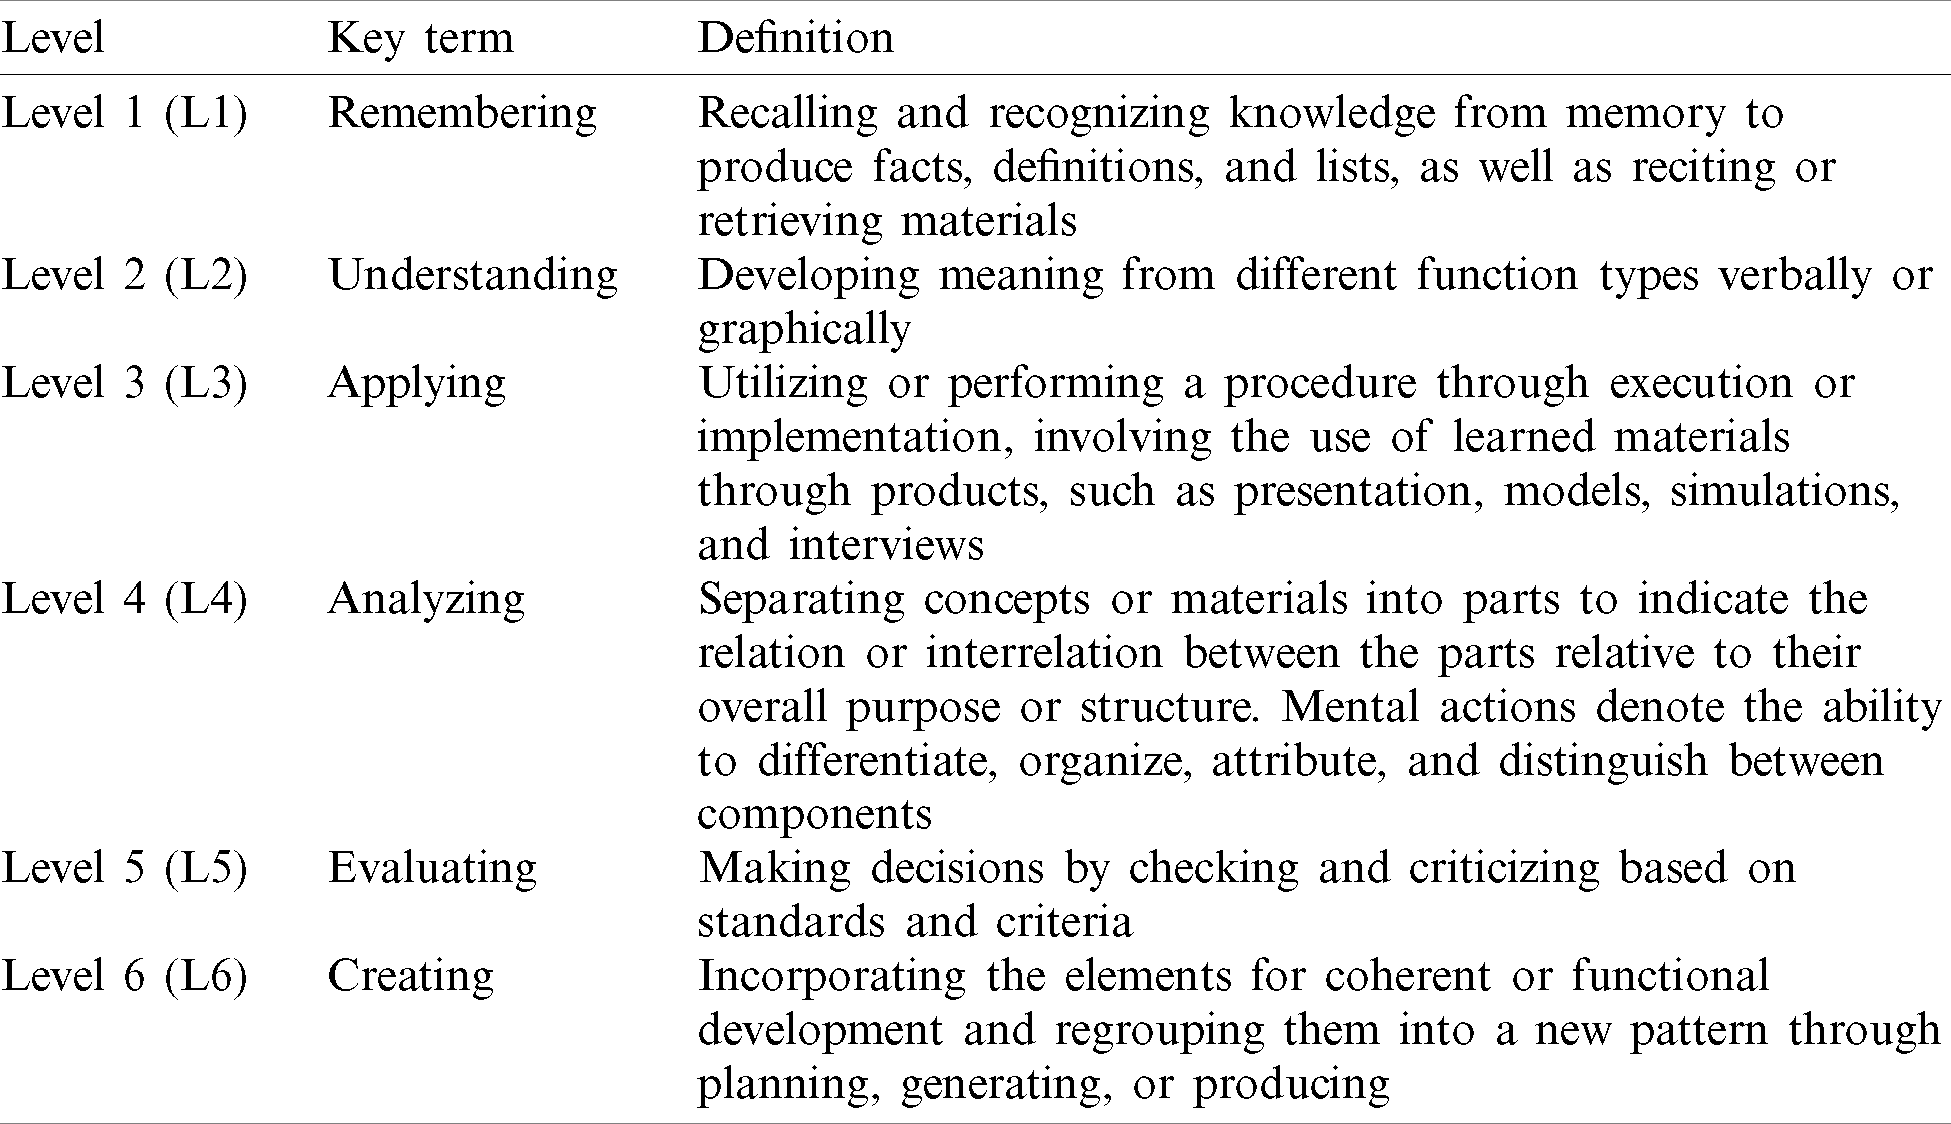
Table 2: Indicators for remembering based on Bloom’s digital taxonomy
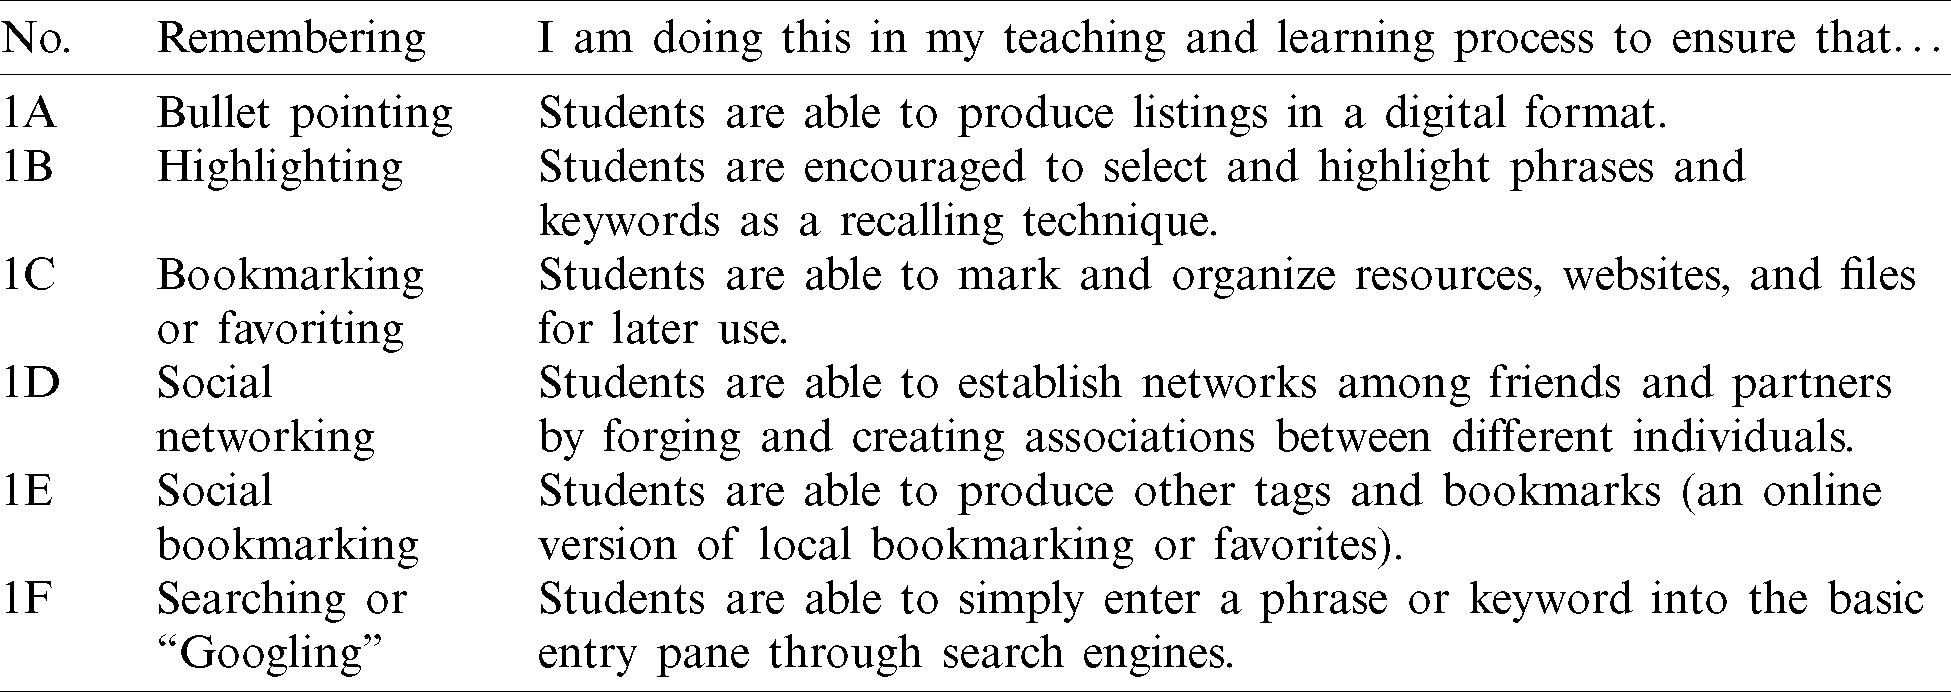
Table 3: Indicators for understanding based on Bloom’s digital taxonomy
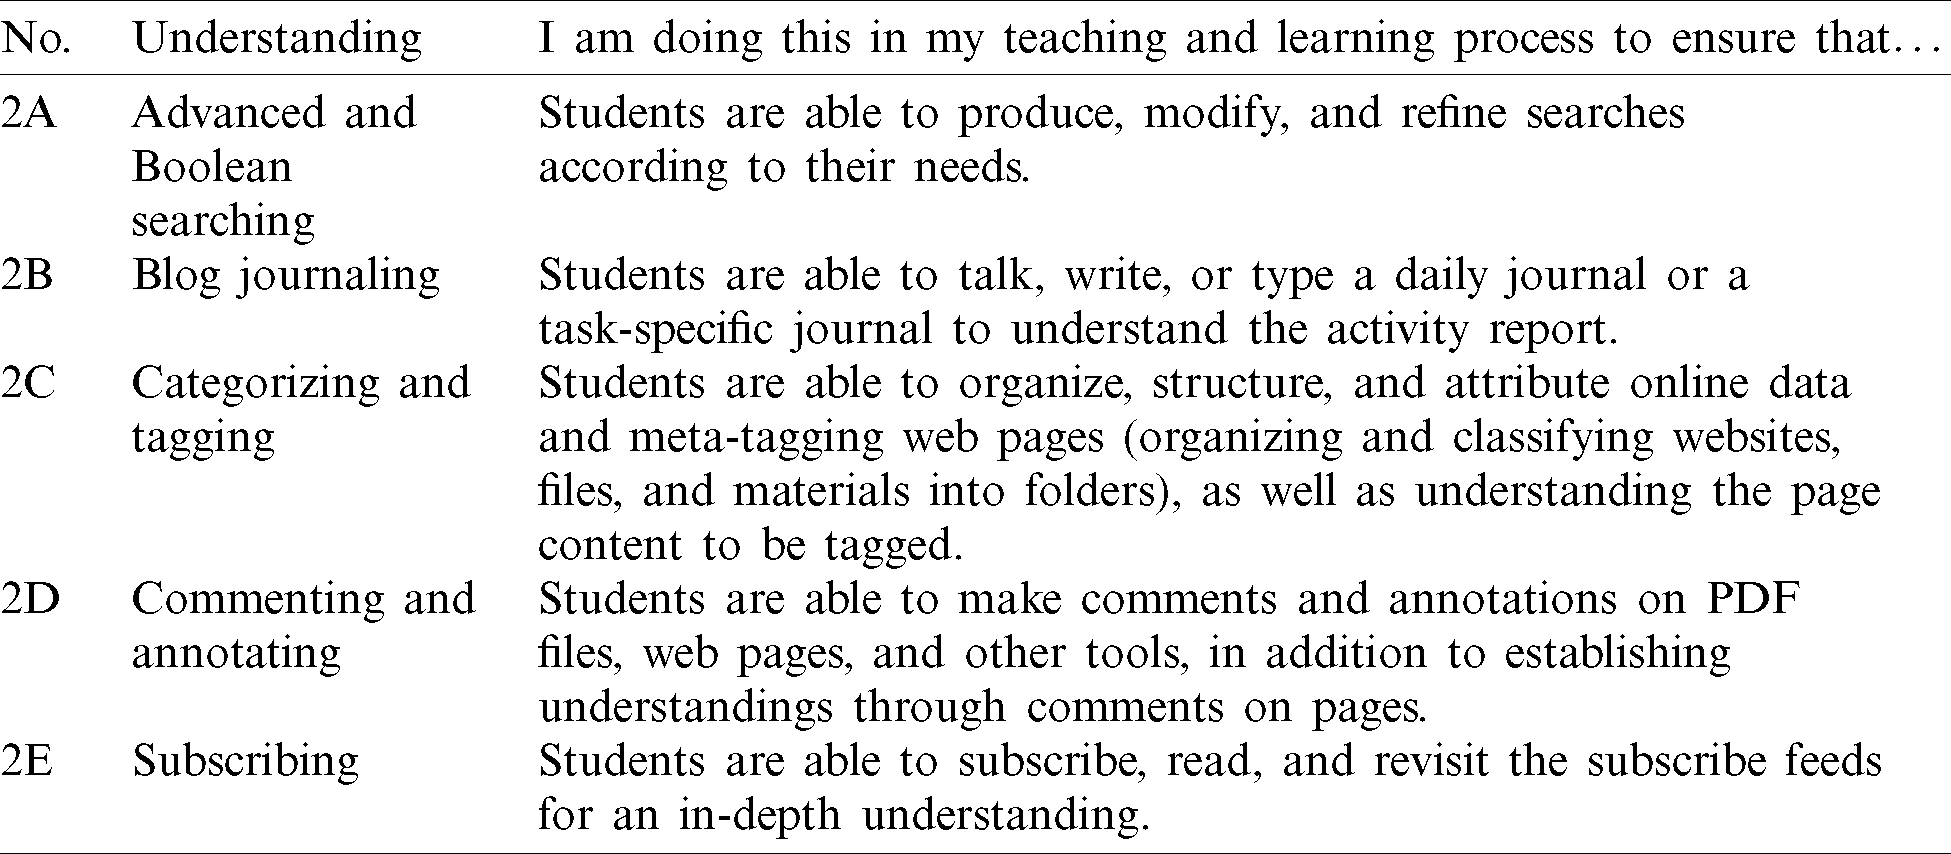
Table 4: Indicators for applying based on Bloom’s digital taxonomy
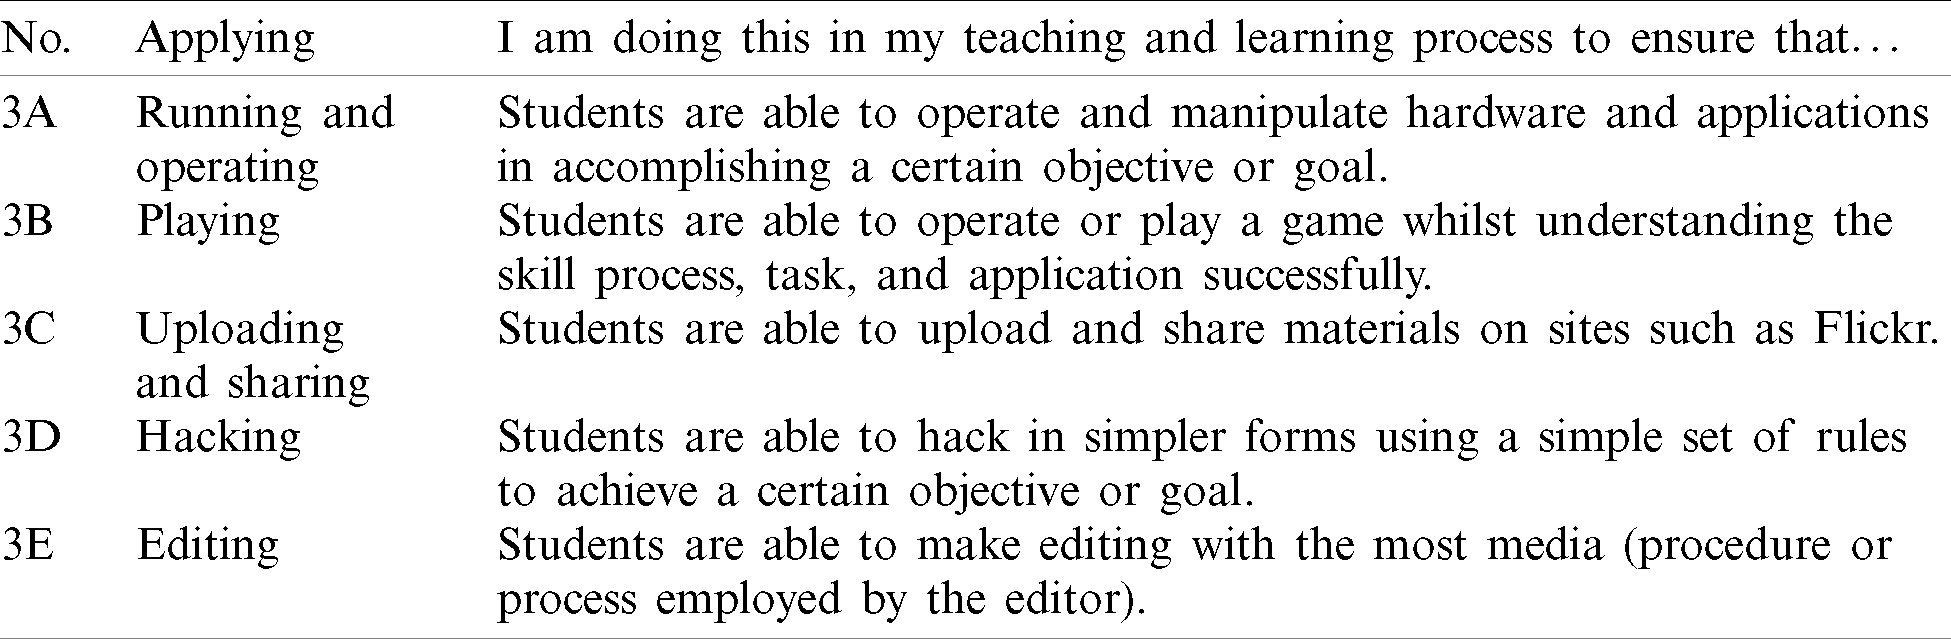
Table 5: Indicators for analyzing based on Bloom’s digital taxonomy
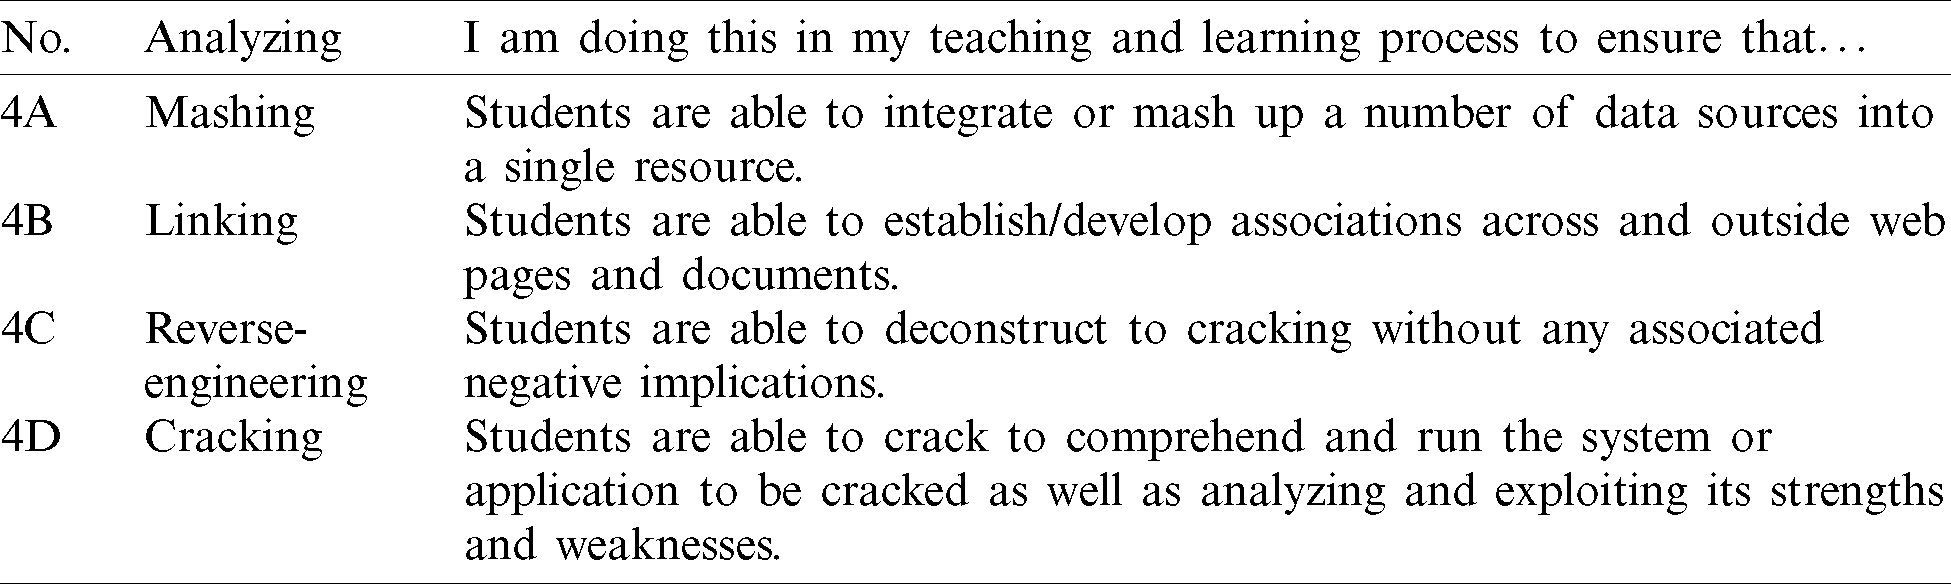
Table 6: Indicators for evaluating based on Bloom’s digital taxonomy
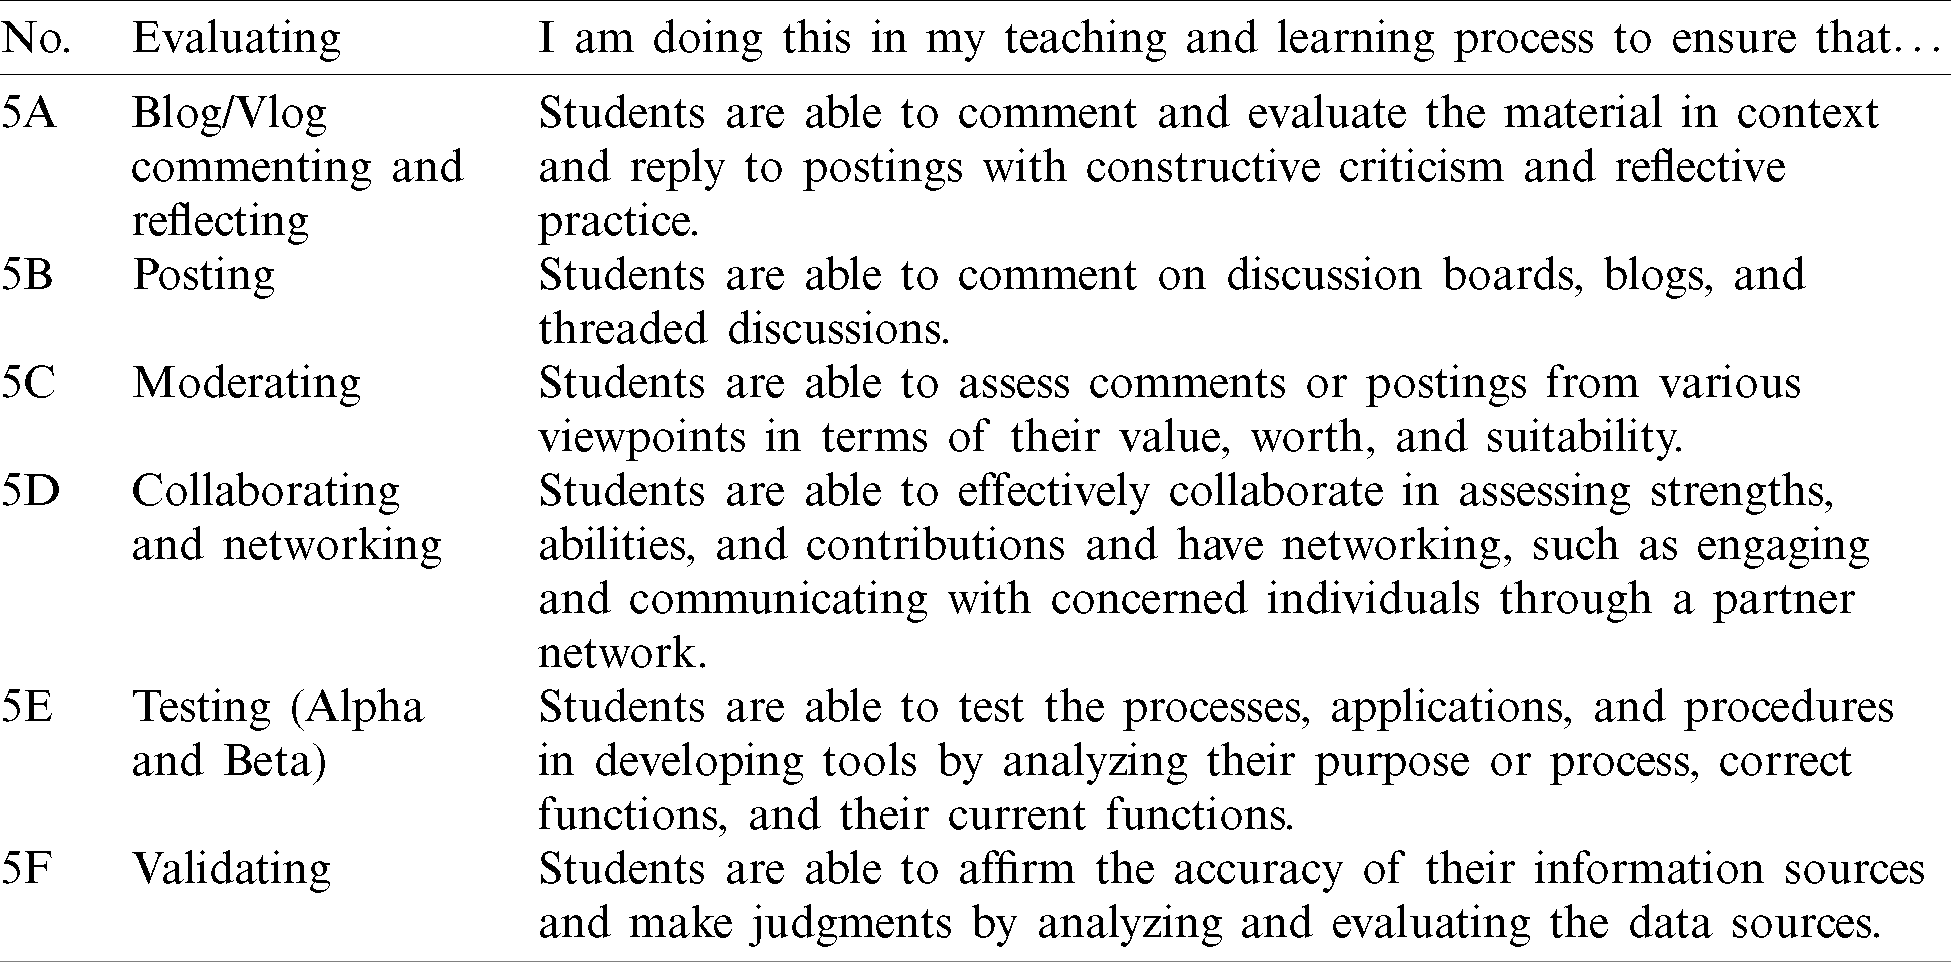
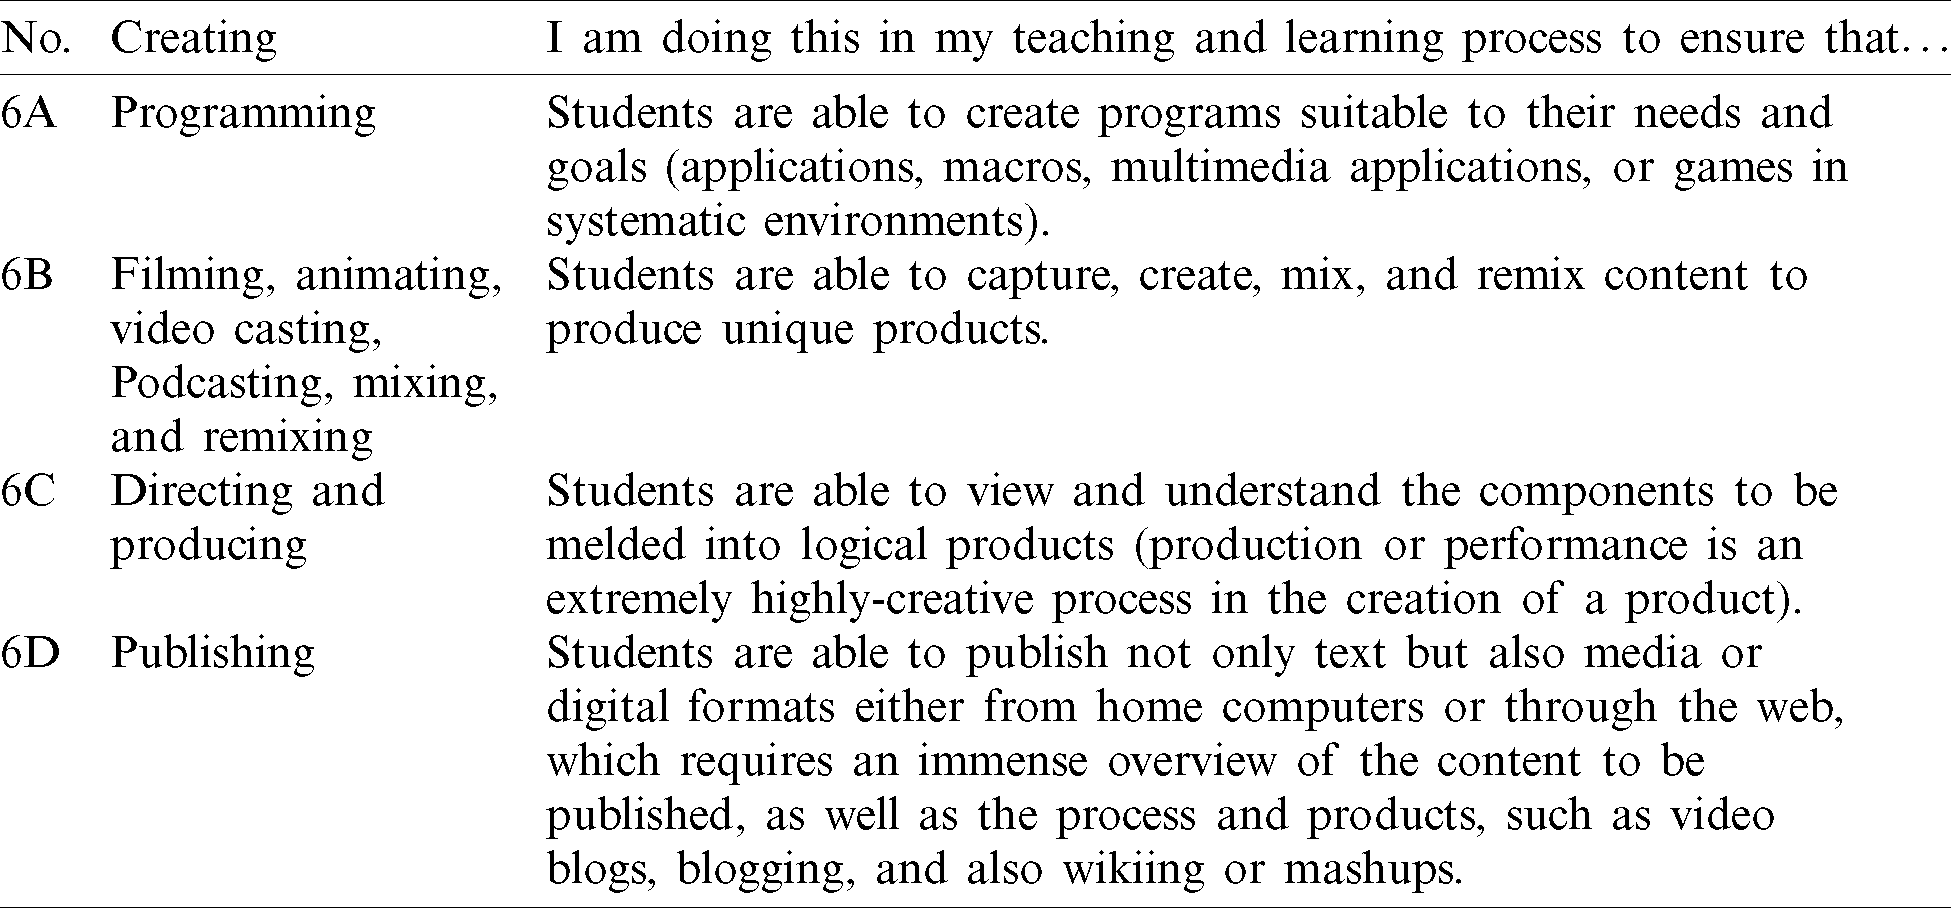
Table 7: Indicators for creating based on Bloom’s digital taxonomy
2.2 Research Motivation and Aims
In recent times, COVID-19 has been a major public health problem worldwide, including Malaysia, and it has been recording a large number of new cases exceeding a thousand cases daily. The break out of COVID-19 has affected many life aspects, including education. The recent increase in the number of COVID-positive cases has highlighted the need for transforming the teaching and education process from face-to-face methods to online education. The primary concern of this transformation is how to conduct lectures online since this is compulsory for all institutions in order to avoid the risk of further spreading of the COVID-19 virus. The need for online teaching and learning is high since all schools and learning institutions have been closed. However, there are many problems related to online education, such as problems of unstable Internet access, low student focus, incomplete equipment, and many others. Online learning also makes it difficult for some teachers to assess and test students’ achievements and knowledge. Namely, for cognitive assessment, teachers need to be adept at applying BDT since the learning process is conducted online. Thus, teachers should master and use BDT well in their teaching process. To measure the extent to which the BDT aspects are used among teachers, the evaluation of psychometric characteristics on the measurement items is necessary, and it is very important to ensure that the measurements are accurate, especially those involving the use of modern measurement theories.
Hence, this study aims to test whether BDT measurement items have good psychometric characteristics based on the teacher’s self-assessment using the Rasch model analysis, which represents modern measurement theory. The modification of assessment by Rasch model will be able to ensure that BDT items difficulty are match with the individual abilities. This study also examines the pattern of the BDT application in teaching from the teachers’ perspective.
3.1 Research Design and Sampling
This study adopts a quantitative approach using an online survey research design. The quantitative approach is used because it is suitable for a large number of respondents [22]; this study includes a total of 774 respondents. This approach also helps obtaining more credible findings because it is efficient [22]. Besides, an online survey is very suitable for this study due to the limitations imposed by the COVID-19 pandemic, which has caused difficulty in obtaining research findings in a face-to-face manner. Hence, an online instrument via Google Forms was used. Further, as stated in [23], online surveys have a few advantages such as fast delivery, easy to administer, and inexpensive. Besides, respondents can also answer at their convenience, similar to the mail questionnaire. A stratified sampling technique was conducted on 774 teachers involving five geographical zones in Malaysia, such as North, West, East, South, and Borneo (stratum). Convenient sampling was also used due to the nature of samples that separated the target population into different strata groups. The advantages of such sampling are that it ensures representativeness of samples and estimates the target population with less error and higher precision [22]. Initially, the 200 instruments were given per zone with total of 1000 instruments. However, only 774 were successfully obtained, achieving a return rate of 77.4%. This return rate exceeded the targeted return rate for online collection, which is 60% [24].
The measurement originally included 30 measurement items that involved 6 levels of BDT, including 6 items for Remembering (A1 to AF), 5 items for Understanding (2A to 2E), 5 items for Applying (3A to 3E), 4 items for Analyzing (4A to 4D), 6 items for Evaluating (5A to 5F), and 4 items for Creating (6A to 6D). These items were adapted according to the BDT definitions [4]. All of these items were undergone facial validity assessment and content validity by three experts who conducted the Content Validity Ratio (CVR) analysis, as suggested in [25]. The experts were professionals and practitioners, as suggested by [26]. The experts fully agreed to verity item testing and screening, which involved the structure of sentences and words only.
3.3 Data Analysis and Procedure
The data of this study entailed a dichotomous scale that was used to elicit a Yes or No answer [23]. The respondents were required to choose either Agree or Disagree for each item, which indicated the level of agreement, as recommended by [27] as a measurement options. The research included 30 items that were used to identify whether teachers had performed all the key terms for the six BDT levels in their teaching and learning processes. The data were processed using the Rasch model analysis to provide information on: (a) item fit and unidimensionality, (b) Wright map and a bubble chart, (c) mean measure for each BDT level, and (d) reliability and separation index. The WINSTEPS 3.71 was used to perform the Rasch analysis.
The Rasch model assumes that each item comprises only a difficulty parameter and that all items have the same discriminatory index. This ensured that low-capable students could not obtain the correct answer to the items that they did not know by guessing [28]. In short, the probability of success depends on a difference between an individual’s ability and the difficulty level of an item. The Rasch model [29] adopts an algorithm that expresses the expectation of the probability of an item as i and the individual’s ability as n in the form of a mathematical equation as follows:
In Eq. (1),
The results considered several key parameters: (a) item fit and unidimensionality, (b) Wright map and a bubble chart, (c) mean measure by each level of BDT, and (d) reliability and separation index. The obtained results not only showed the quality characteristics of the psychometric items but also indicated the pattern of BDT usage in teaching and supervision from the teachers’ perspective. As explained in Section 2.3, there were 30 items assigned with 6 levels of BDT.
As shown in Tab. 8, 27 out of 30 measurement items fulfilled the fit characteristics in the Rasch model. In Tab. 8, Infit refers to inlier-pattern-sensitive fit statistic and the Outfit refers to outlier-sensitive fit statistic [30].
Table 8: Fit statistics of measurement items
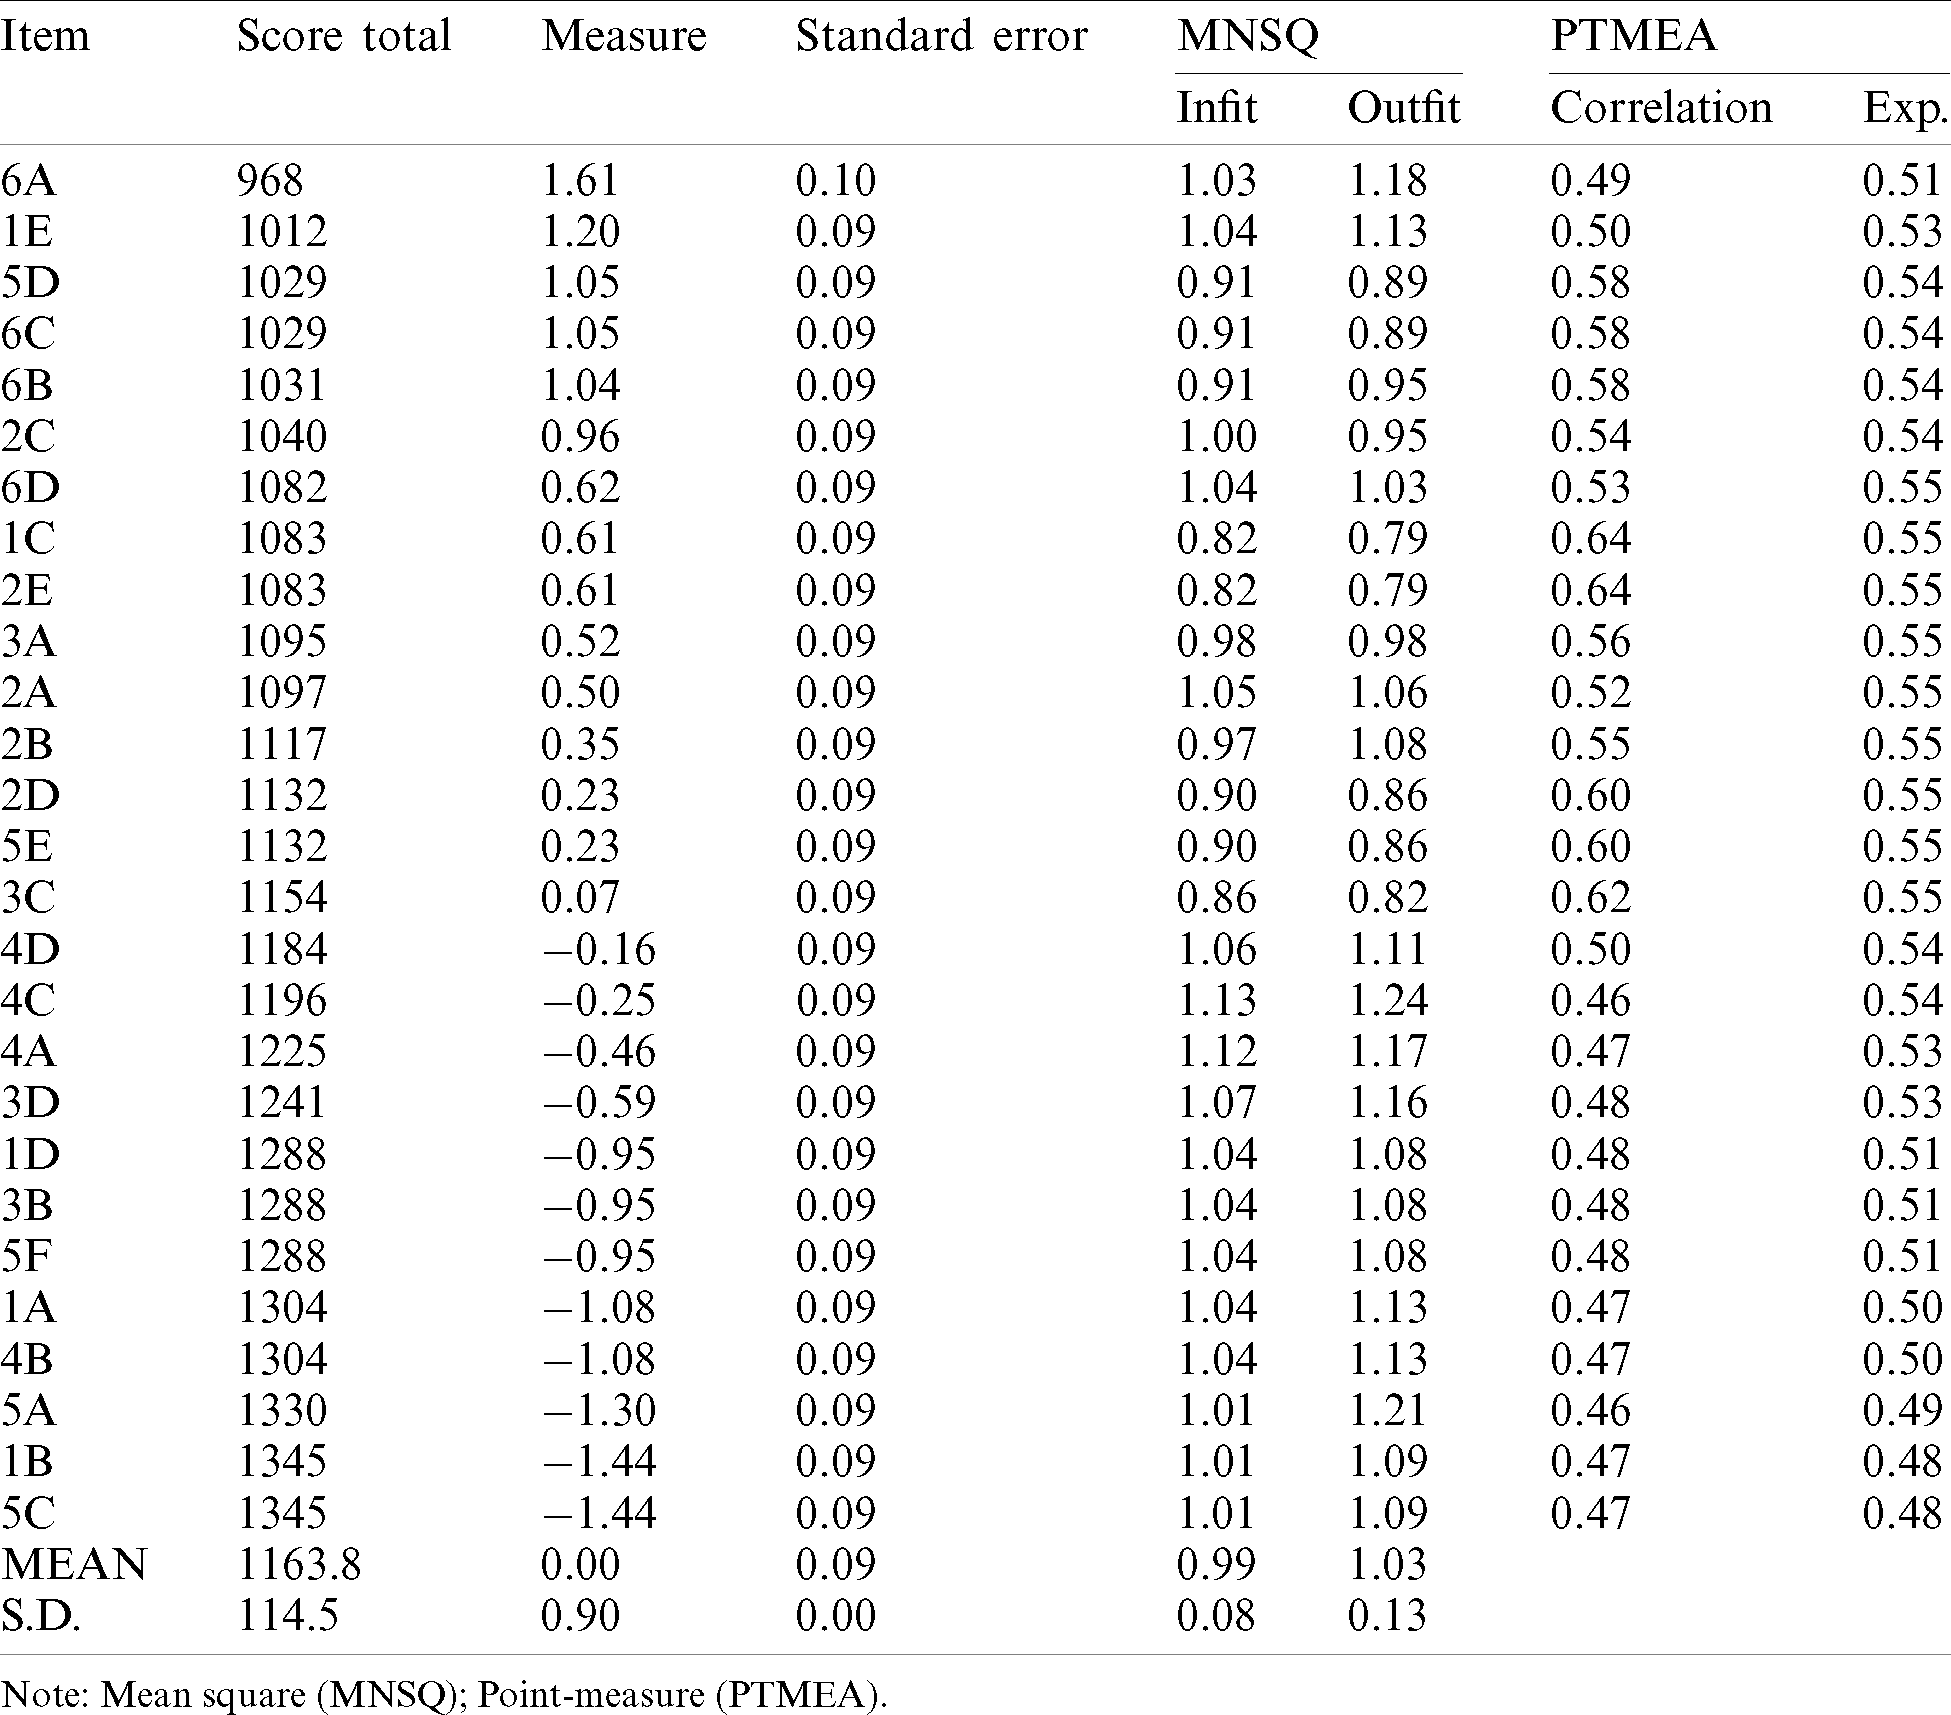
The highest measure value was that of item 6A (1.61 logits) and the lowest values corresponded to 5C and IB (−1.44 logits). Overall, activity 6A denoted “programming,” and 5C denoted “moderating.” The standard value of errors was in a range of 0.09–0.10 and complied with the recommended value [31]. Meanwhile, the maximum value of
Based on the MNSQ fit settings, the used range was from 0.77 to 1.30 [31]. The values that exceeded 1.30 were considered as misfitting, and those less than 0.70 were regarded as overfitting [29]. A total of three measurement items were dropped due to the non-fulfillment of the fit range value, which were: IF (
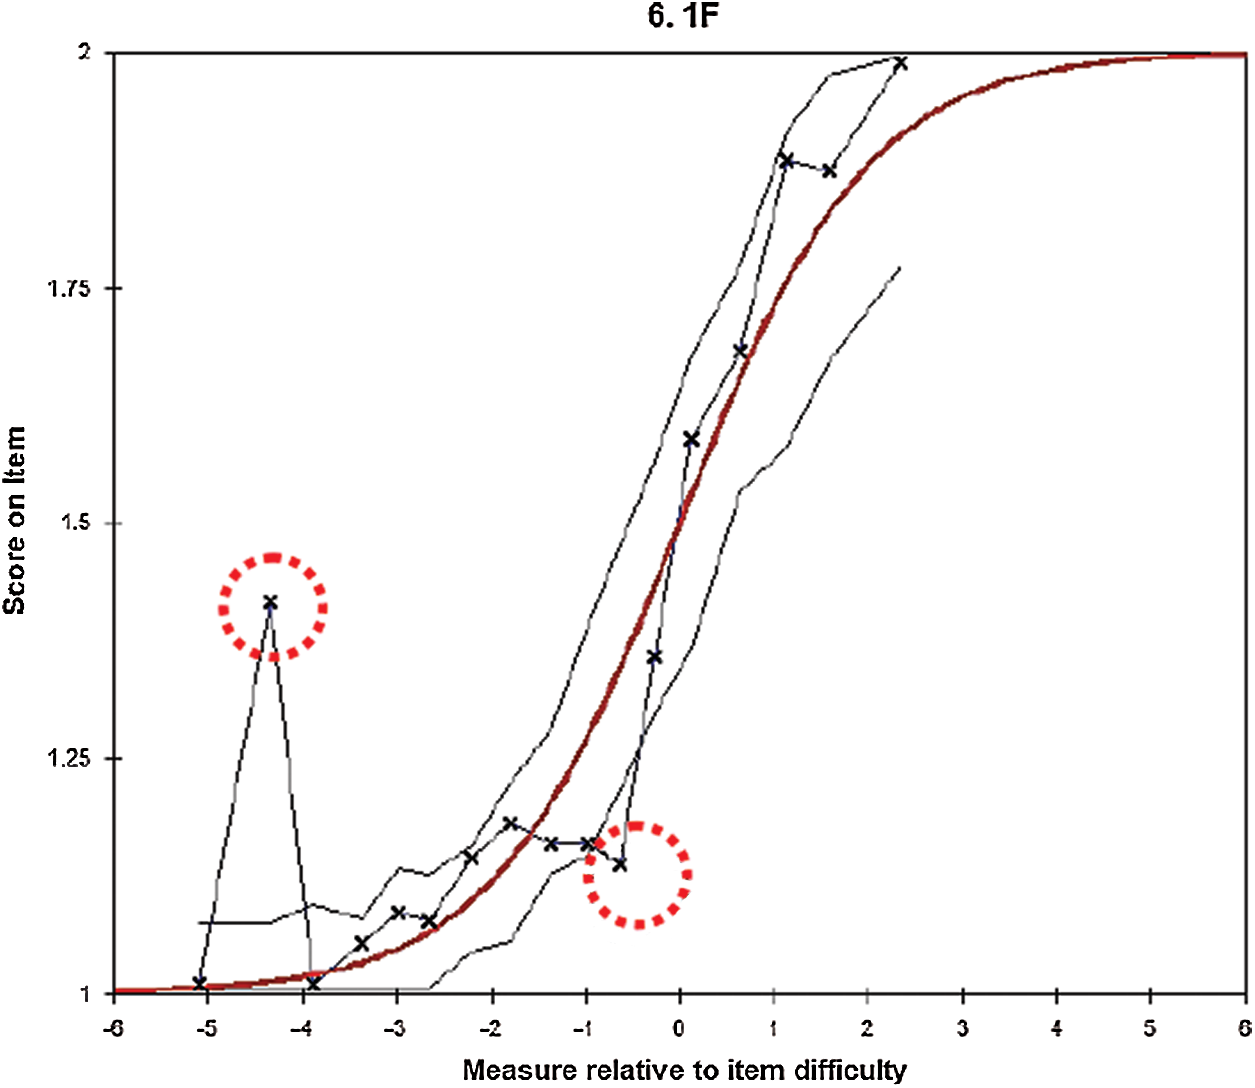
Figure 1: Expected score ICC of 1F
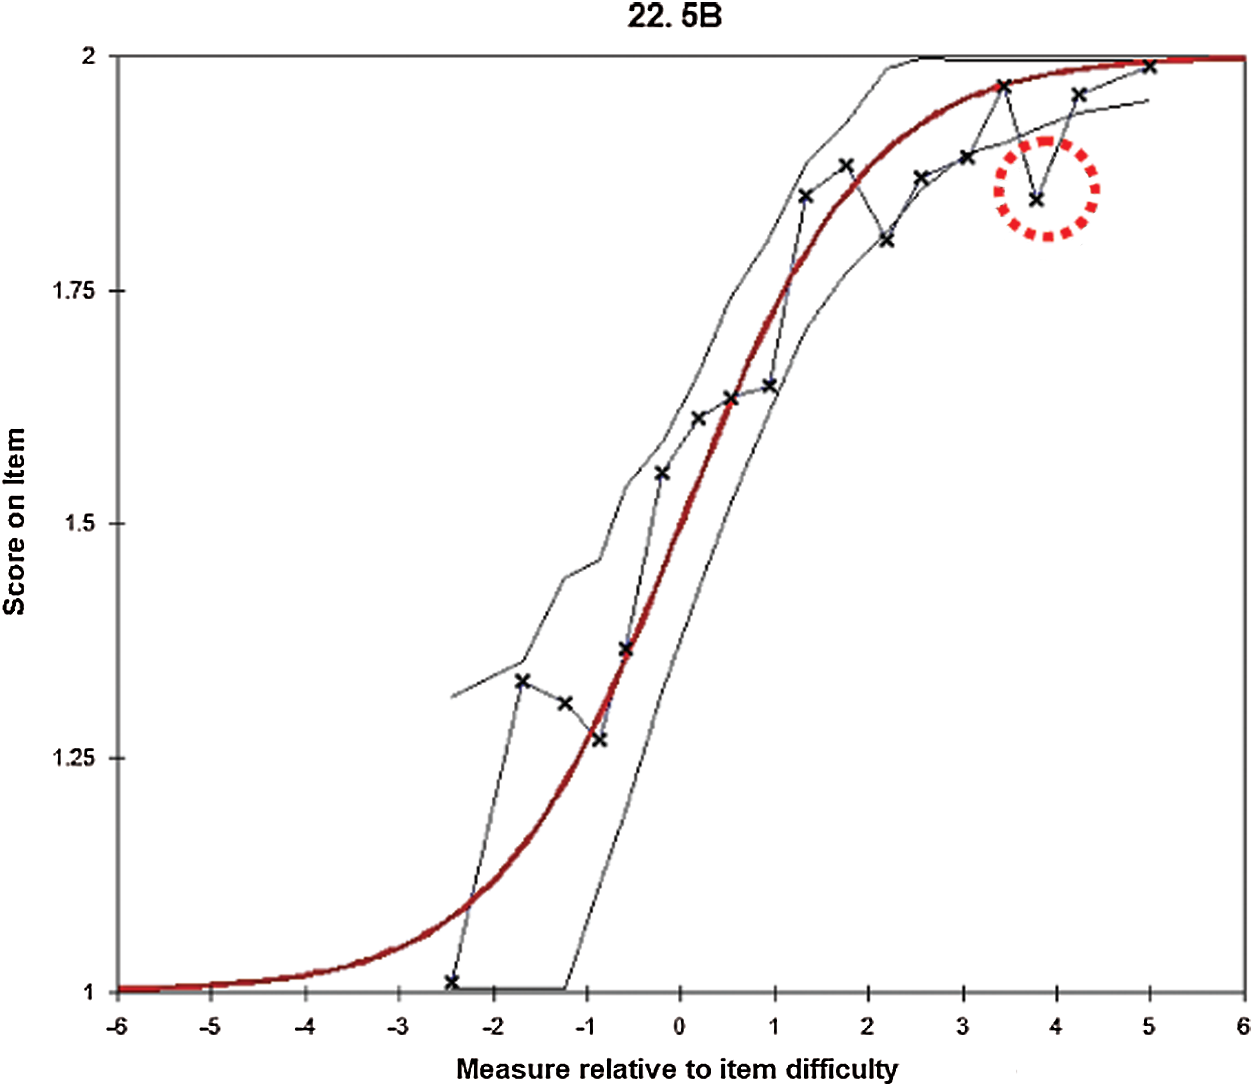
Figure 2: Expected score ICC of 5B
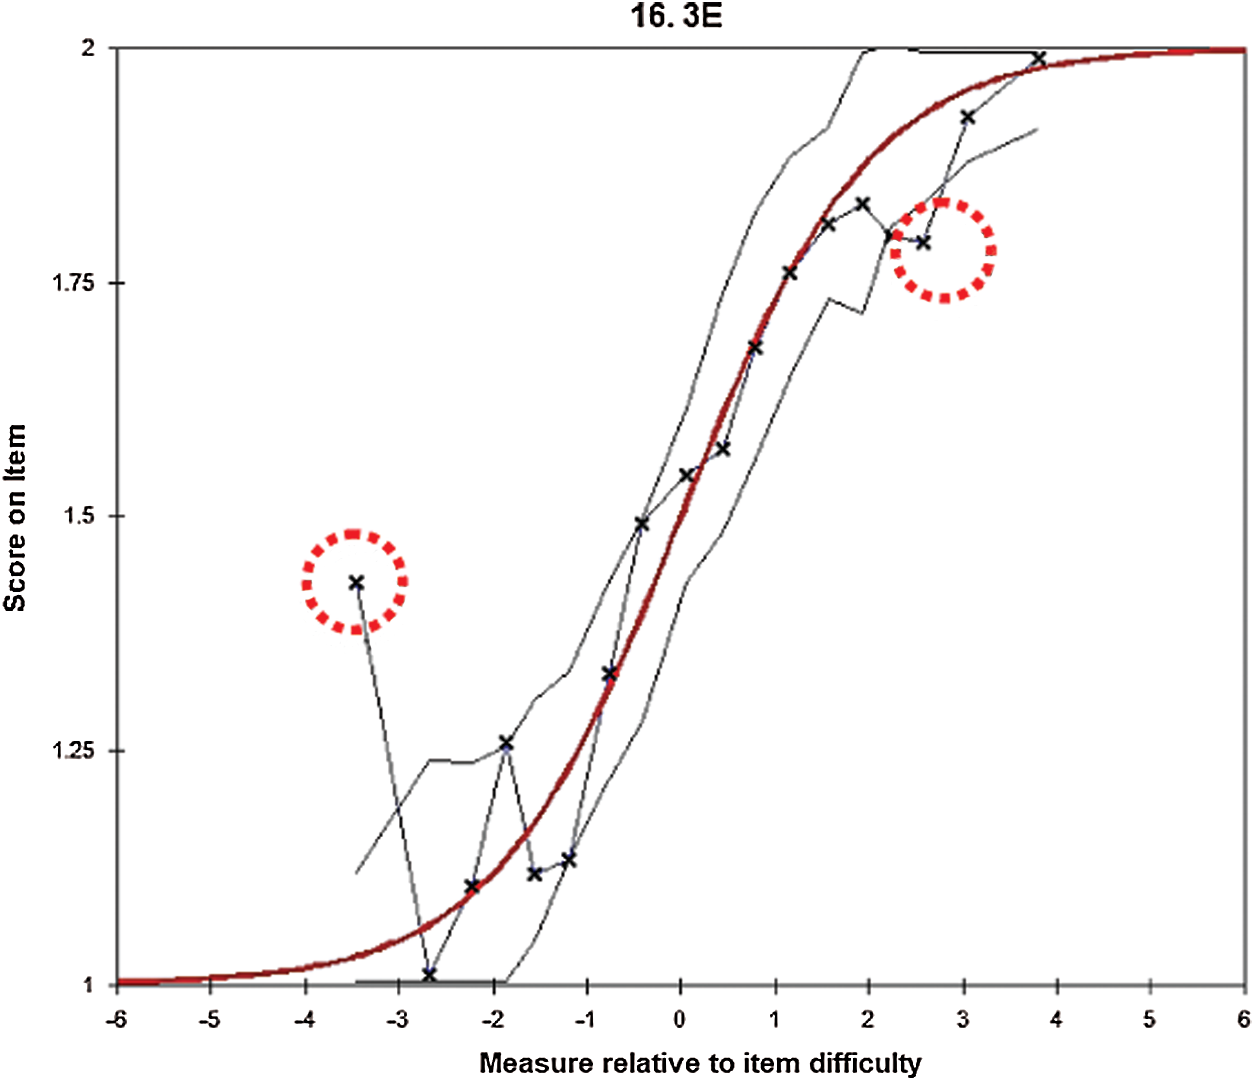
Figure 3: Expected score ICC of 3E
The unidimensionality of items indicated that items did not have equality characteristics in the matter to be measured. Dimensionality can be defined as determining an instrument in one direction and one dimension or the force given to one dimension or attribute at once [29] to ensure the instrument’s content and construct validity [32]. The raw variance value explained by measures was recorded at 36.3% for overall and each level, which was above the specified value of 20% [33]. The eigenvalue of the entire BDT was 3.5These values complied with the specified value of less than five [34]. Meanwhile, the overall noise value was recorded at 12.9. These noise values for each L1 to L6 were below 15% [35]. The noise for each construct indicated an underachieved value such as L1 (23.3%), L2 (21.8%), L3 (28.6%), L4 (26.4%), L5 (25.4%), and L6 (29.7%).
4.3 Wright Map and Bubble Chart
Wright Map or item-person map in this analysis denotes a figure that represents items by the item number and the performance of each person to effectively observe the ability of the measured scale items to match the respondents. The distribution of the measurement items according to BDT levels from the aspect of their usage by teachers is presented in Fig. 4.
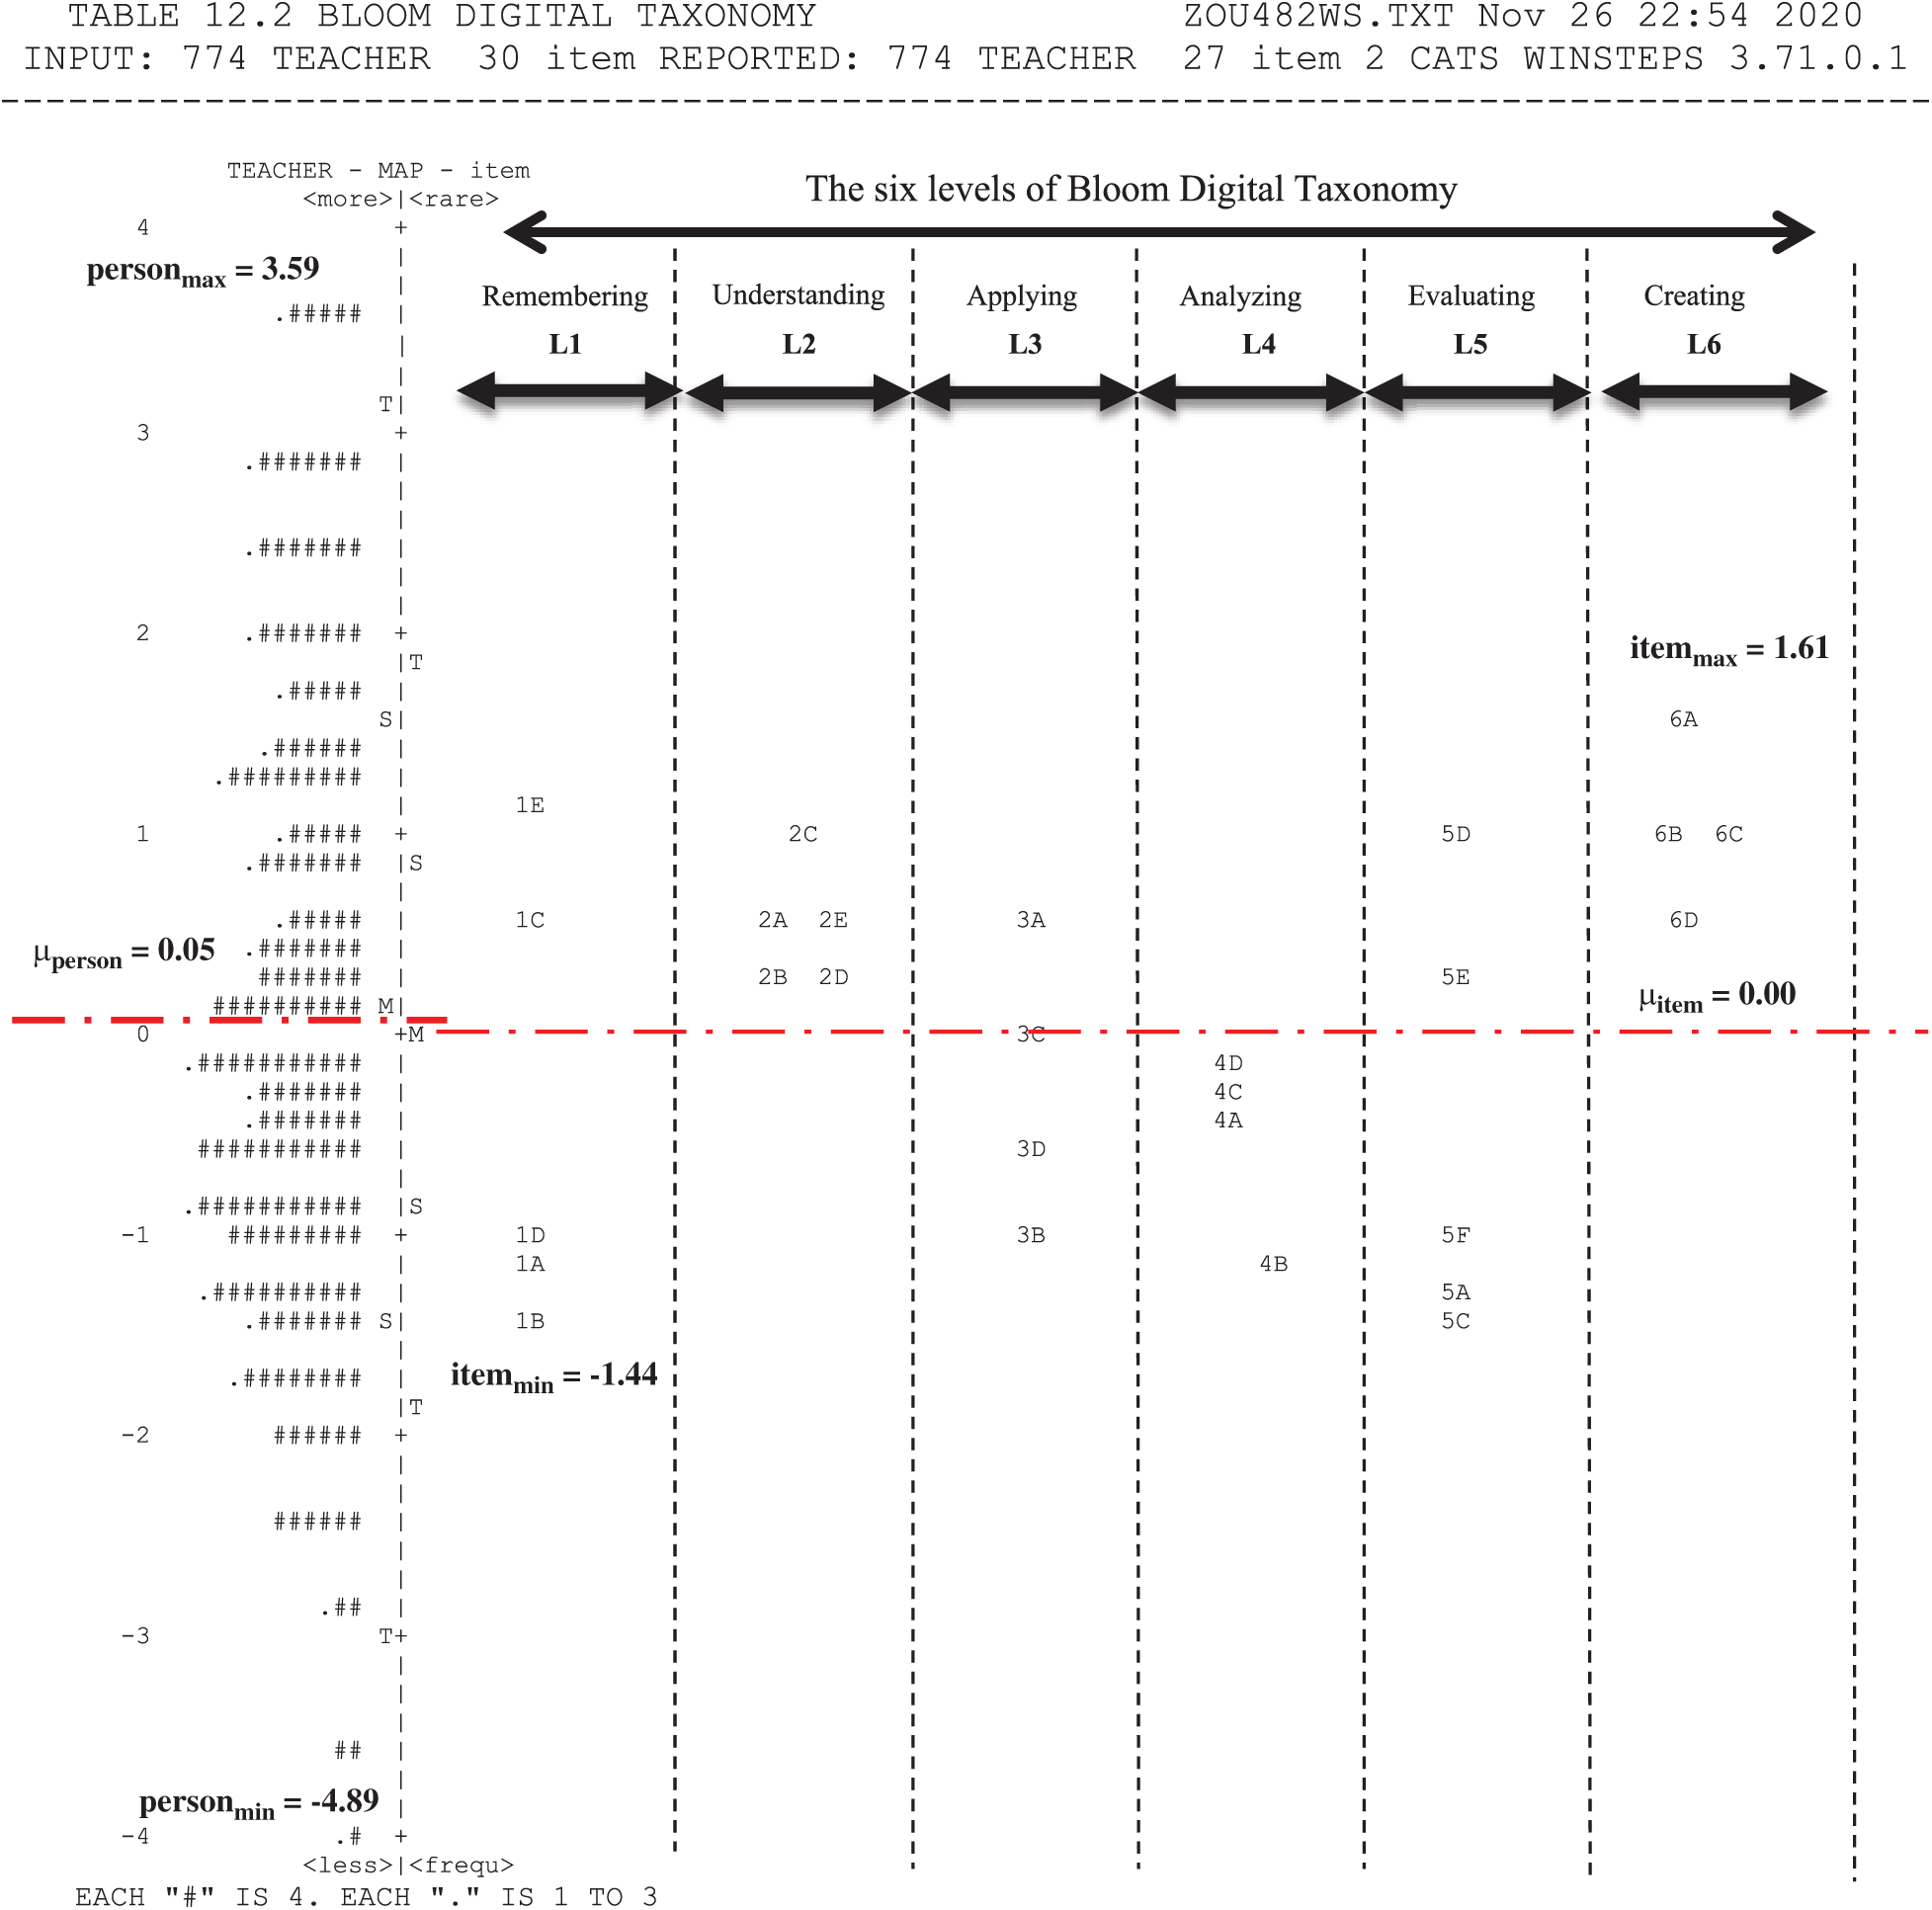
Figure 4: Wright item-person map
A total of 55.5% of the total items were above the average difficulty value, while 45% of the total items were below the average difficulty value. This distribution proved that the respondents found it difficult to perform item 6A (Programming), by which the students were able to create programs suitable to their needs and goals (applications, macros, multimedia applications, or games in systematic environments). Meanwhile, the most easily performed activities by the teachers were item IB (Highlighting), by which the students were encouraged to select and highlight phrases and keywords as a recalling technique, and item 5C (Moderating), by which the students were able to assess comments or postings from various viewpoints in terms of their value, worth, and suitability. The results indicated that
The bubble chart that graphically illustrates the measurement value and item compatibility [36] is presented in Fig. 5. The bubble shape between the overfit and underfit was classified as accepted, which was within the t-value range of
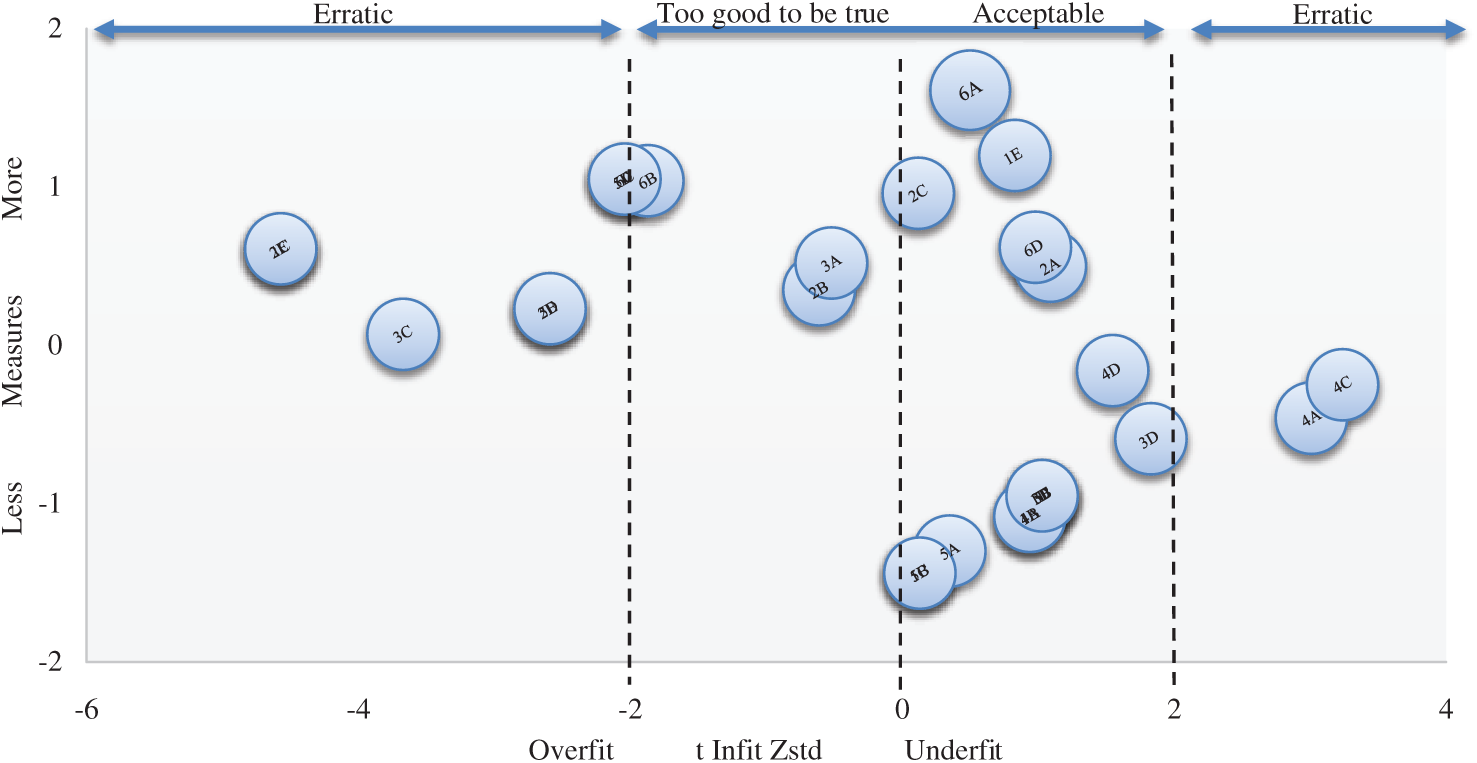
Figure 5: Bubble chart of item fitness
The L1 analysis (Remembering) showed that item IE was the hardest item with 1.20 logits. This result showed that Social Bookmarking was the least applied activity by teachers in the teaching and learning process at the L1 level. Meanwhile, activity 1B (Highlighting) included the most performed items by teachers with −1.44 logits. The L2 analysis (Understanding) showed that item 2C was the hardest item with 0.96 logits. This result indicated that Categorizing and Tagging was the least applied activity by teachers in the teaching and learning process. In contrast, activity 2D (Commenting and Annotating) included the most performed items by teachers with 0.23 logits. The L3 analysis (Applying) showed that item 3A was the hardest item with 0.52 logits, indicating that Running and Operating was the least applied activity by teachers in the teaching and learning process. Meanwhile, activity 3B (Playing) included the most performed items by teachers with −0.95 logits. The L4 analysis (Analyzing) showed that item 4D was the hardest item with −0.16 logits; thus, Cracking was the least applied activity by teachers in the teaching and learning process at the L1 level. However, activity 4B (Linking) included the most performed items by teachers with −1.08 logits. The L5 analysis (Evaluating) showed that item 5D was the hardest item with 1.05 logits; Collaborating and Networking was the least applied activity by teachers in the teaching and learning process. Meanwhile, activity 5C (Moderating) included the most performed items by teachers with −1.44 logits. The L6 analysis (Creating) showed that item 6A was the hardest item with 1.61 logits, and Programming was the least applied activity by teachers in the teaching and learning process. Last, activity 6D (Publishing) included the most performed items by teachers with −1.44 logits 0.62 logits.
4.4 Mean Measure of Each BDT Level
Based on the mean logit value results, the hardest level of BDT to be conducted by teachers in their teaching and learning was Level 6, which was Creating (+1.08), followed by Level 2 (+0.53), Level 3 (−0.24), Level 1 (−0.33), and Level 5 (−0.48), while the easiest level was Level 4, i.e., Analyzing. Based on the level of BDT, Level 6 (Creating) is the highest level of BDT. This level represents the hardest level from the aspect of activity implementation. Thus, the results presented in this study are logical because the logit value of 1.08 has indicated level L6 as the most difficult activity for teachers to implement. However, interestingly, the results showed that the easiest level to be implemented by the teachers was not L1 (remembering) as it was expected but L4 (analyzing). According to [4], L4 can be defined as separating concepts or materials into parts to determine the relation or interrelation between the parts relative to their overall purpose or structure. Level L4 also includes mental actions, which comprise the ability to differentiate, organize, attribute, and distinguish between components.
This result could be caused by the elements of Higher Order Thinking Skill (HOTS) instilled by teachers to the students. The Malaysian Education Development Plan 2013–2025 explains that national examinations and school-based assessments (PBS) have been revamped to gradually increase the percentage of questions that define high-level thinking skills. By 2016, high-level thinking questions included at least 40% of the questions in Ujian Penilaian Sekolah Rendah (UPSR), and at least 50% of the questions in Sijil Pelajaran Malaysia (SPM). More group-based projects and assignments were also done to improve students’ high-level thinking skills and their ability to work individually and in groups. They were given more community-based projects and cross-school activities to foster interaction between individuals from all backgrounds. In addition, Wave 1 (2013–2015) played an important role in changing the education system by supporting teachers focusing on key skills and redesigning exam questions to put a higher focus on high-level thinking skills questions [37]. The high-level thinking should be starting at Analyzing level; therefore, the findings indirectly had proven that the implementation of the BDT activities by teachers were at a higher level.
4.5 Reliability and Separation Index
The rating scale instrument quality criteria used in this study are based on the setting in [31]. Person reliability entails the consistency of person ordering to be accepted under conditions that the equivalent set of items that measures the same construct is given to this respondents [38]. The overall person measurement reliability value was 0.87. For all levels of persons ability, which could be considered as good. While the item measurement reliability was 0.99, which could be regarded as excellent; the person separation index was 2.60, which could be considered as satisfactory. Item separation denotes the ability of all participants to answer all the items’ difficulty levels. This means that the respondents can be distinguished by the constructs being tested [38]. The item separation index was 9.74, which could be considered as excellent. This means that the quality of BDT measurement items in this instrument is excellent, but the consistency of answers from teachers is only fair. The grouping of persons and items can be obtained using the following formula:
The overall separation value of persons was
The current study aims to improve the measurement for BDT items through teachers’ self-assessment in teaching and learning, and the Rasch measurement model is proposed for the assessment of psychometric properties. The results show that a total of 27 measurement items can be used as an alternative for BDT measurement using the Rasch model. The results show that the Rasch model can more clearly demonstrate various item properties compared to the classical test theory. Moreover, this study indirectly shows to which extent teachers tend to apply each level of BDT in their teaching and learning practice and examines which BDT activities are the hardest and easiest to apply. However, certain limitations need to be considered in future works. First, the results presented in this study are applicable only to the Malaysian population, so the study should be expanded regarding both contexts and countries. Namely, it would be interesting to explore and compare more characteristics of item response for various levels of respondents’ ability through systematic comparisons. Second, this investigation has been limited to the teachers’ perspective, so future research is highly encouraged to introduce scale analysis to develop specific questionnaires from the perspective of students’ understanding of the BDT levels. In fact, this measurement construct can be tested for its validity using multivariate analysis, such as factor analysis or principal component analysis, to provide empirical evidence for future reference. Third, this study is limited to general definitions in each level, starting from L1 to L6, so further investigations can be performed to each specific activity for every level of BDT. The information can be useful for customizing digital teaching activities that suit both teacher and students’ abilities relative to the implementation of teaching and learning in class.
Acknowledgement: The author would like to express the utmost gratitude to the anonymous reviewers for their insightful comments and suggestions, which helped to improve the content, quality, and presentation of this research paper. The author would also like to honor and give high appreciation to the Faculty of Education, University Kebangsaan Malaysia (UKM).
Funding Statement: This study was funded by the Ministry of Higher Education (MOHE), Malaysia under the Fundamental Research Grant Scheme (FRGS) (FRGS/1/2018/SSI09/ UKM/02/1), and the Faculty of Education, University Kebangsaan Malaysia (UKM), Geran Galakan Penyelidik Muda (GGPM-2017-088).
Conflicts of Interest: The author declares that he has no conflicts of interest to report regarding the present study.
1. N. Grebin, S. Grabovska, R. Karkovska and A. Vovk. (2020). “Applying Benjamin Bloom’s taxonomy ideas in adult learning,” Journal of Education Culture and Society, vol. 11, no. 1, pp. 61–72. [Google Scholar]
2. D. R. Krathwohl. (2002). “A revision of Bloom’s Taxonomy: An overview,” Theory into Practice, vol. 41, no. 4, pp. 212–218. [Google Scholar]
3. M. T. Chandio, S. M. Pandhiani and S. Iqbal. (2016). “Bloom’s taxonomy: Improving assessment and teaching-learning process,” Journal of Education and Development, vol. 3, no. 2, pp. 203–211. [Google Scholar]
4. A. Churches. (2008). “Bloom’s digital taxonomy,” pp. 1–44, . [Online]. Available: http://burtonslifelearning.pbworks.com/f/BloomDigitalTaxonomy2001.pdf. [Google Scholar]
5. A. Gani. (2020). “Improving the ability of implementing fun-based learning through structured clinical supervision on Mathematics teachers at SMA Negeri 1 Barru Indonesia,” Journal of Applied Science, Engineering, Technology, and Education, vol. 3, no. 2, pp. 195–202. [Google Scholar]
6. J. J. Pongkendek, D. N. Marpaung, D. S. Ahmar and S. Rahmatia. (2020). “The professional competence analysis of chemistry teacher of senior high school in Merauke,” Journal of Applied Science, Engineering, Technology, and Education, vol. 3, no. 1, pp. 46–52. [Google Scholar]
7. H. Amin and M. S. Mirza. (2020). “Comparative study of knowledge and use of Bloom’s digital taxonomy by teachers and students in virtual and conventional universities,” Asian Association of Open Universities Journal, vol. 15, no. 2, pp. 223–238. [Google Scholar]
8. N. Thota and J. G. M. Negreiros. (2019). “Introducing educational technologies to teachers: Experience report introducing educational technologies to teachers: Experience report,” Journal of University Teaching & Learning Practice, vol. 12, no. 1, pp. 1–13. [Google Scholar]
9. E. Goranova. (2019). “Creation of electronic learning objects for the high cognitive levels of Bloom’s digital taxonomy,” Knowledge International Journal, vol. 31, no. 2, pp. 585–590. [Google Scholar]
10. P. Haring, H. Warmelink, M. Valente and C. Roth. (2018). “Using the revised Bloom taxonomy to analyze psychotherapeutic games,” International Journal of Computer Games Technology, vol. 1, no. 1, pp. 1–9. [Google Scholar]
11. B. C. Wedlock and R. Growe. (2017). “The technology driven student: How to apply Bloom’s revised taxonomy to the digital generations,” Journal of Education & Social Policy, vol. 4, no. 1, pp. 25–34. [Google Scholar]
12. J. Netolicka and I. Simonova. (2017). “SAMR model and bloom’s digital taxonomy applied in blended learning/teaching of general english and ESP,” in Int. Symp. on Educational Technology 2017, ISET 2017, Proc. IEEE Computer Society Conf. Publishing Services, Hong Kong, China, pp. 277–281. [Google Scholar]
13. C. J. Stanny. (2016). “Reevaluating bloom’s taxonomy: What measurable verbs can and cannot say about student learning,” Education Sciences, vol. 6, no. 4, pp. 1–12. [Google Scholar]
14. S. M. A. Soozandehfar and M. R. Adeli. (2016). “A critical appraisal of Bloom’s taxonomy,” American Research Journal of English and Literature, vol. 2, no. 1, pp. 1–9. [Google Scholar]
15. S. Lee. (2016). “Pilot study: Bloom’s digital taxonomy application for an online art project,” Literacy Information and Computer Education Journal, vol. 7, no. 2, pp. 2268–2274. [Google Scholar]
16. N. E. Adams. (2015). “Bloom’s taxonomy of cognitive learning objectives,” Journal of the Medical Library Association, vol. 103, no. 3, pp. 152–153. [Google Scholar]
17. S. J. Crook and M. D. Sharma. (2013). “Bloom-ing heck! the activities of Australian science teachers and students two years into a 1:1 laptop program across 14 high schools,” International Journal of Innovation in Science and Mathematics Education, vol. 21, no. 1, pp. 54–69. [Google Scholar]
18. N. L. Long and R. Mustapha. (2019). “Bloom’s taxonomy analysis in vocational assessment: The development of a new Taxonomy using the Delphi Technique,” Journal of Quality Measurement and Analysis, vol. 15, no. 1, pp. 65–75. [Google Scholar]
19. N. W. Masrom, M. Hashim, N. Hashim and F. P. Behak. (2018). “Bloom’s taxonomy position from an Islamic perspective,” Journal of Quran Sunnah Education and Special Needs, vol. 2, no. 1, pp. 18–26. [Google Scholar]
20. S. A. Rahman and N. F. A. Manaf. (2017). “A critical analysis of Bloom’s Taxonomy in teaching creative and critical thinking skills in Malaysia through english literature,” English Language Teaching, vol. 10, no. 9, pp. 245–256. [Google Scholar]
21. M. Hayati and M. Yatim. (2015). “Exploring 21st century children’s skills in the process of digital storytelling game design,” EDUCATUM Journal of Science, Mathematics and Technology, vol. 2, no. 1, pp. 82–96. [Google Scholar]
22. J. F. Hair, M. W. Celsi and D. E. Harrison. (2020). Essentials of Marketing Research, 5th ed. New York, USA: McGraw-Hill Education. [Google Scholar]
23. U. Sekaran and R. Bougie. (2016). Research Methods for Business: A Skill Building Approach, 7th ed. New Delhi, India: John Wiley & Sons. [Google Scholar]
24. J. E. Fincham. (2008). “Response rates and responsiveness for surveys, standards, and the journal,” American Journal of Pharmaceutical Education, vol. 72, no. 2, pp. 2–4. [Google Scholar]
25. C. H. Lawshe. (1975). “A quantitative approach to content validity,” Personnel Psychology, vol. 28, no. 4, pp. 563–575. [Google Scholar]
26. D. M. Rubio, M. Berg-Weger, S. S.Tebb, E. S. Lee and S. Rauch. (2003). “Objectifying content validity: Conducting a content validity study in social work research,” Social Work Research, vol. 27, no. 2, pp. 94–105. [Google Scholar]
27. A. DeCastellarnau. (2018). “A classification of response scale characteristics that affect data quality: A literature review,” Quality and Quantity, vol. 52, no. 4, pp. 1523–1559. [Google Scholar]
28. A. A. Aziz. (2011). Rasch Model Fundamentals: Scale Construct and Measurement Structure, Kuala Lumpur, Malaysia: Integrated Advance Planning Sdn Bhd. [Google Scholar]
29. T. G. Bond and C. M. Fox. (2015). Applying the Rasch Model: Fundamental Measurement in the Human Sciences, Third Avenue, NY, USA: Routledge. [Google Scholar]
30. J. M. Linacre. (2002). “What do infit and outfit, mean-square and standardized mean,” Rasch Measurement Transactions, vol. 16, no. 2, pp. 878. [Google Scholar]
31. J. W. P. Fisher. (2007). “Rating scale instrument quality criteria,” Rasch Measurement Transactions, vol. 21, no. 1, pp. 1095. [Google Scholar]
32. M. Wu and R. Adams. (2007). Applying the Rasch Model to Psycho-Social Measurement: A Practical Approach, Melbourne, Australia: Educational Measurement Solutions. [Google Scholar]
33. D. Reckase. (1979). “Unifactor latent trait models applied to multifactor tests: results and implications,” Journal of Educational Statistics, vol. 4, no. 3, pp. 207–230. [Google Scholar]
34. J. M. Linacre. (2005). A User’s Guide to WINSTEPS: Rasch Model Computer Programs, Illinois, USA: MESA Press. [Google Scholar]
35. A. A. Aziz, M. S. Masodi and A. Zaharim. (2017). Rasch Measurement Model Basis: Scale Development and Measurement Structure, 3rd ed. Bangi, Malaysia: UKM Press. [Google Scholar]
36. J. M. Linacre. (2012). A User’s Guide to WINSTEPS: Rasch Model Computer Programs, Illinois, USA: MESA Press. [Google Scholar]
37. Malaysia Ministry of Education. (2013). “Malaysia Education Development Plan 2013–2025 (Preschool to Post-Secondary Education),” Putrajaya, Malaysia: Ministry of Education, . [Online]. Available: https://www.moe.gov.my/muat-turun/penerbitan-dan-jurnal/1818-pelan-pembangunan-pendidikan-2013-2025/file. [Google Scholar]
38. B. D. Wright and G. N. Masters. (1982). Rating Scale Analysis Rasch Measurement, Illinois, USA: MESA Press. [Google Scholar]
 | This work is licensed under a Creative Commons Attribution 4.0 International License, which permits unrestricted use, distribution, and reproduction in any medium, provided the original work is properly cited. |