DOI:10.32604/cmc.2021.016114
| Computers, Materials & Continua DOI:10.32604/cmc.2021.016114 | |
| Article |
Imperative Dynamic Routing Between Capsules Network for Malaria Classification
1Department of Information Technology, VNRVJIET, Hyderabad, 500090, India
2Department of Computer Science and Engineering, JNTUH College of Engineering, Hyderabad, India
3Department of Computer Science and Engineering, TKR College of Engineering & Technology, Hyderabad, India
4Department of Computer Science and Engineering, SRM University, Amaravati, A.P., 522502, India
5School of Computer Science and Engineering, Taylor’s University, Subang Jaya, 47500, Malaysia
6Department of Computer Science and Engineering, VNRVJIET, Hyderabad, 500090, India
*Corresponding Author: G. Madhu. Email: madhu_g@vnrvjiet.in
Received: 10 December 2020; Accepted: 13 January 2021
Abstract: Malaria is a severe epidemic disease caused by Plasmodium falciparum. The parasite causes critical illness if persisted for longer durations and delay in precise treatment can lead to further complications. The automatic diagnostic model provides aid for medical practitioners to avail a fast and efficient diagnosis. Most of the existing work either utilizes a fully connected convolution neural network with successive pooling layers which causes loss of information in pixels. Further, convolutions can capture spatial invariances but, cannot capture rotational invariances. Hence to overcome these limitations, this research, develops an Imperative Dynamic routing mechanism with fully trained capsule networks for malaria classification. This model identifies the presence of malaria parasites by classifying thin blood smears containing samples of parasitized and healthy erythrocytes. The proposed model is compared and evaluated with novel machine vision models evolved over a decade such as VGG, ResNet, DenseNet, MobileNet. The problems in previous research are cautiously addressed and overhauled using the proposed capsule network by attaining the highest Area under the curve (AUC) and Specificity of 99.03% and 99.43% respectively for 20% test samples. To understand the underlying behavior of the proposed network various tests are conducted for variant shuffle patterns. The model is analyzed and assessed in distinct environments to depict its resilience and versatility. To provide greater generalization, the proposed network has been tested on thick blood smear images which surpassed with greater performance.
Keywords: Dynamic routing; deep neural networks; thin blood smears; computer vision; parasite classification
Malaria is a serious universal health burden that is caused by protozoa of the genus Plasmodium that is spread through the bite of a female Anopheles mosquito [1]. Five parasite species cause malaria in humans: P. falciparum, P. vivax, P. ovale, P. Knowlesi, and P. malaria [2]. Among these species, two of the species P. falciparum and P. vivax pose a huge threat to human lives. In 2019, the World Health Organization (WHO) survey report estimated 228 million cases of malaria [3]. Major malaria cases belong to African regions (93%), followed by the South–East Asia regions (3.4%) and Eastern Mediterranean regions (2.1%) [3]. In general, there are several procedures to examine malaria disease through microscopic thick or thin blood smears that are popular and commonly used methods [4–6]. Thus, these techniques are extremely time-consuming and require a clinical expert that has limited reliability [7,8]. To deal with such issues, an automatic diagnosis will ensure an accurate diagnosis process for detection and early diagnosis of malaria to prevent deaths. In this era, high computational techniques have made huge contributions to achieve higher and accurate detection through various medical diagnoses such as computerized tomography, Magnetic resonance imaging, Microscopy, and Ultrasound analysis [4,9–11]. Most of the medical image analysis requires a computer-assisted diagnostic procedure by utilizing methods that help in learning the model. Most of the models developed with handcrafted features are used for image classification and decision making which can impart lower generalization [12]. Recently, major research work was done on deep learning architectures. These notable networks played an important role in various kinds of image classification, detection, and recognition [13,14]. CNN’s play a significant role in the deep learning community, not only extract features but also compute predictive targets and provide actionable predictive models to help doctors competently [15]. However, traditional CNNs do not preserve the contextual proportional relationships of objects within an overarching image. Applying these shortcomings to microscopic images can lead to misclassification of the diagnostic model. There is a need for a better and accurate diagnostic model to enhance the performance of malaria detection and classification.
This research develops an automatic diagnostic model for parasite detection and classification of malaria:
• To extract the blood cell image features by using fully connected convolution neural networks (without pooling layers).
• To capture the spatial relations between the cell features using Capsule nets which may have high potential to identify infected regions.
• To compute dynamic routing (modified) for the conversion of low-level to higher-level capsules that is useful for predicting instantiation parameters and classifying them with L2-Norm.
In the literature, various research studies reveal the application of machine learning as well as deep learning methods towards malaria detection from microscopic blood images. This study discusses the recent applications of deep learning that prompt the key aspects to impact malaria diagnosis. Liang et al. [16] proposed a 16-layer convolutional neural network (CNN) to classify the parasite cells in thin blood smears on microscopic slides. However, the average accuracy of this method is 97.37% by performing ten-fold cross-validation. On the other hand, the transfer learning approach achieves an accuracy of 91.99% only. Quinn et al. [17] demonstrated a deep CNN model for malaria diagnosis, tuberculosis (TB) in sputum, and intestinal parasite eggs in stool samples. Nevertheless, in every class, the model attained a high accuracy by 50–50 train-test split. This approach contributes to many advances in microscopy for point to care diagnostics and useful for laboratory staff in rural areas. Shen et al. [18] presented deep autoencoders for malaria diagnosis from erythrocyte images, by utilizing stacked autoencoders that are trained with two distinct Golomb–Rice encoders that study the important features from erythrocyte images and achieved top results for lossless coding methods. Dong et al. [19] presented machine learning algorithms and CNN’s methods for classifying the malaria parasites from blood cells. In this method, different novel architectures were implemented out of which LeNet, AlexNet, and GoogLeNet achieved an accuracy of more than 95%. Whereas, machine learning algorithms such as SVM and Naive Bayes Classifier could not perform better much than deep architectures [20–22]. However, most of these approaches required minimal human intervention under-diagnosis decision making. Hung et al. [23] applied a faster R-CNN for object detection on malaria blood cell images, these cell objects are labeled and classified with two different stages. In a one-stage classification, the model consists of faster R-CNN and baseline (machine learning method). The model attains a poor accuracy of 50% and in two-stage detection and classification, the model consists of faster R-CNN and AlexNet which detects objects and classifies RBC or not. The model depicts an accuracy of 98% (discarding background). The model tends to lose its generalizing ability when tested on new samples. Sivaramakrishnan et al. [24] proposed a CNN model for malaria detection and cell classification. The approach understands the probabilities of various layers and visualizes the activation maps of each layer to understand the model learning strategy and finally attains the accuracy of 98.61% with lesser complexity and lower computation speed. Sivaramakrishnan et al. [25] proposed a customized CNN model and discussed the performance of pre-trained CNNs and deep learning methods as feature extractors to classifying parasitized and healthy blood cells from microscopic images. This method uses features from shallow layers to perform more significant results than deep features and applied a level-set based algorithm to detect and segment RBCs. The model achieved an accuracy of 98.6% (cell level). In modeling, the experiments have shown random noise from the training set which leads to overfitting of the model. Pan et al. [26] showed that LeNet-5 is capable of detecting malaria and it learns features automatically by stacked autoencoders from a given input. LeNet-5 architecture has two convolutional layers, two subsampling layers, and fully connected layers. Finally, the model got an accuracy of over 90% of four different datasets (two are augmented). Gopakumar et al. [27] presented the CNN model for the analysis of blood smears being a parasite or not. For the detection, customized CNNs are used and a two-level segmentation method is used for blood cell counting and categorization of cells. The detection accuracy in terms of sensitivity and specificity is 97.06% and 98,50% respectively. Vijayalakshmi et al. [28] proposed a transfer learning approach to distinguish between infected and healthy cell images by using VGG16 and Support Vector Machine (SVM) models which obtained a classification accuracy of 93.13%. Yang et al. [29] performed five-fold cross-validation on the customized CNN model with two processing steps. First, intensity-based iterative global minimum screening (IGMS) schema, which is implemented to recognize the parasite, and then customized CNN are used for classification of the presence of a parasite. The method attained an accuracy of (
By Observing the aforementioned challenges, this research develops an automatic diagnostic model for parasite classification of malaria using capsule networks by surpassing the drawbacks of existing research stated as follows:
a) Discarding Low pixel resolution images.
b) Decreasing loss of information with the use of fully connected convolutions (discarding pooling layers) and imparting spatial relationship with imperative routing mechanism.
c) Imparting greater generalizations to the model by evaluating variant test samples with altering shuffle patterns.
The dataset consists of two distinct classes of thin blood smear images of erythrocytes in which one class is infected with malaria and the other is healthy. These samples are collected from the National Institutes of Health (NIH) repository where this data was publicly available for research [25]. There are 27,558 images collectively for both the classes without any class imbalance in data. These samples are distributed with a variant pixel resolution from image to image. So, the samples are iso-topically reshaped into a resolution of
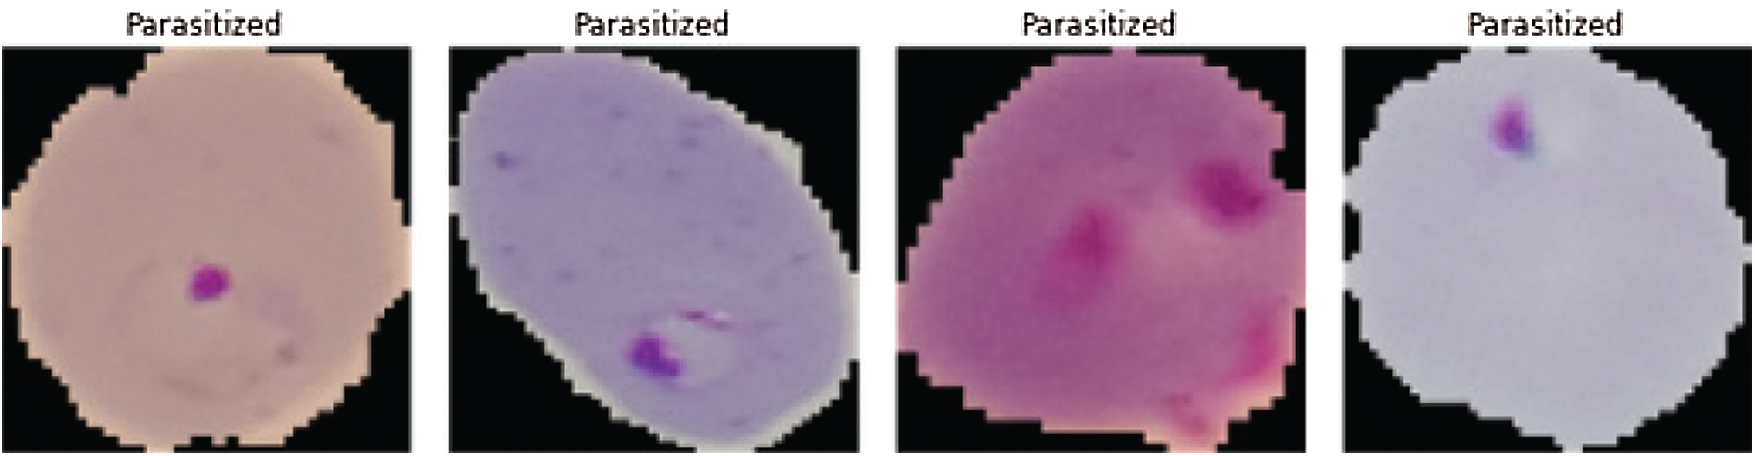
Figure 1: Malaria infected images (see Reference [25])
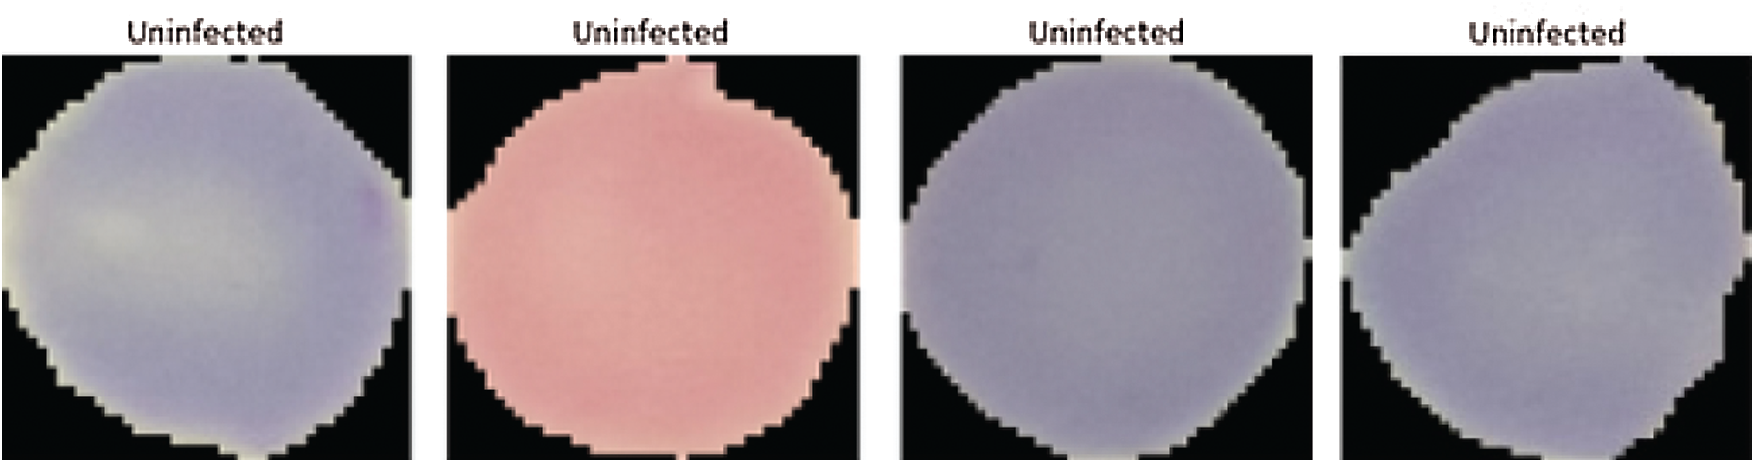
Figure 2: Non-infected images (healthy images) (see Reference [25])
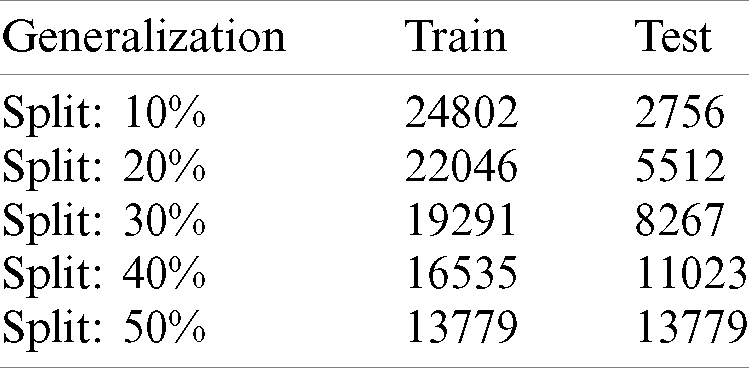
Tab. 1 shows the distribution of malaria data samples which is evaluated in the proposed model for training and testing and samples ranging from 10%–50%.
Table 1: Distribution of complete data samples into train & test with different splits
This section discusses the proposed imperative routing approach of capsule network, whose motivation is to maximize the performance of networks for malaria classification. The custom capsule network has three blocks: 1. Convolution block, 2. Capsule network block, and 3. Loss function block showed in Fig. 3. In Fig. 3, Initially, the input is fed into a series of fully connected convolution blocks to extract a set of features (local & global) regarding the parasitized and uninfected portions. These captured features are learned by understanding their spatial orientations regarding extracted features by using the imperative routing mechanism between primary and secondary capsule layers. Then after a certain set of iterations, these feeds are classified to Infected and healthy class by applying L2-Norm.
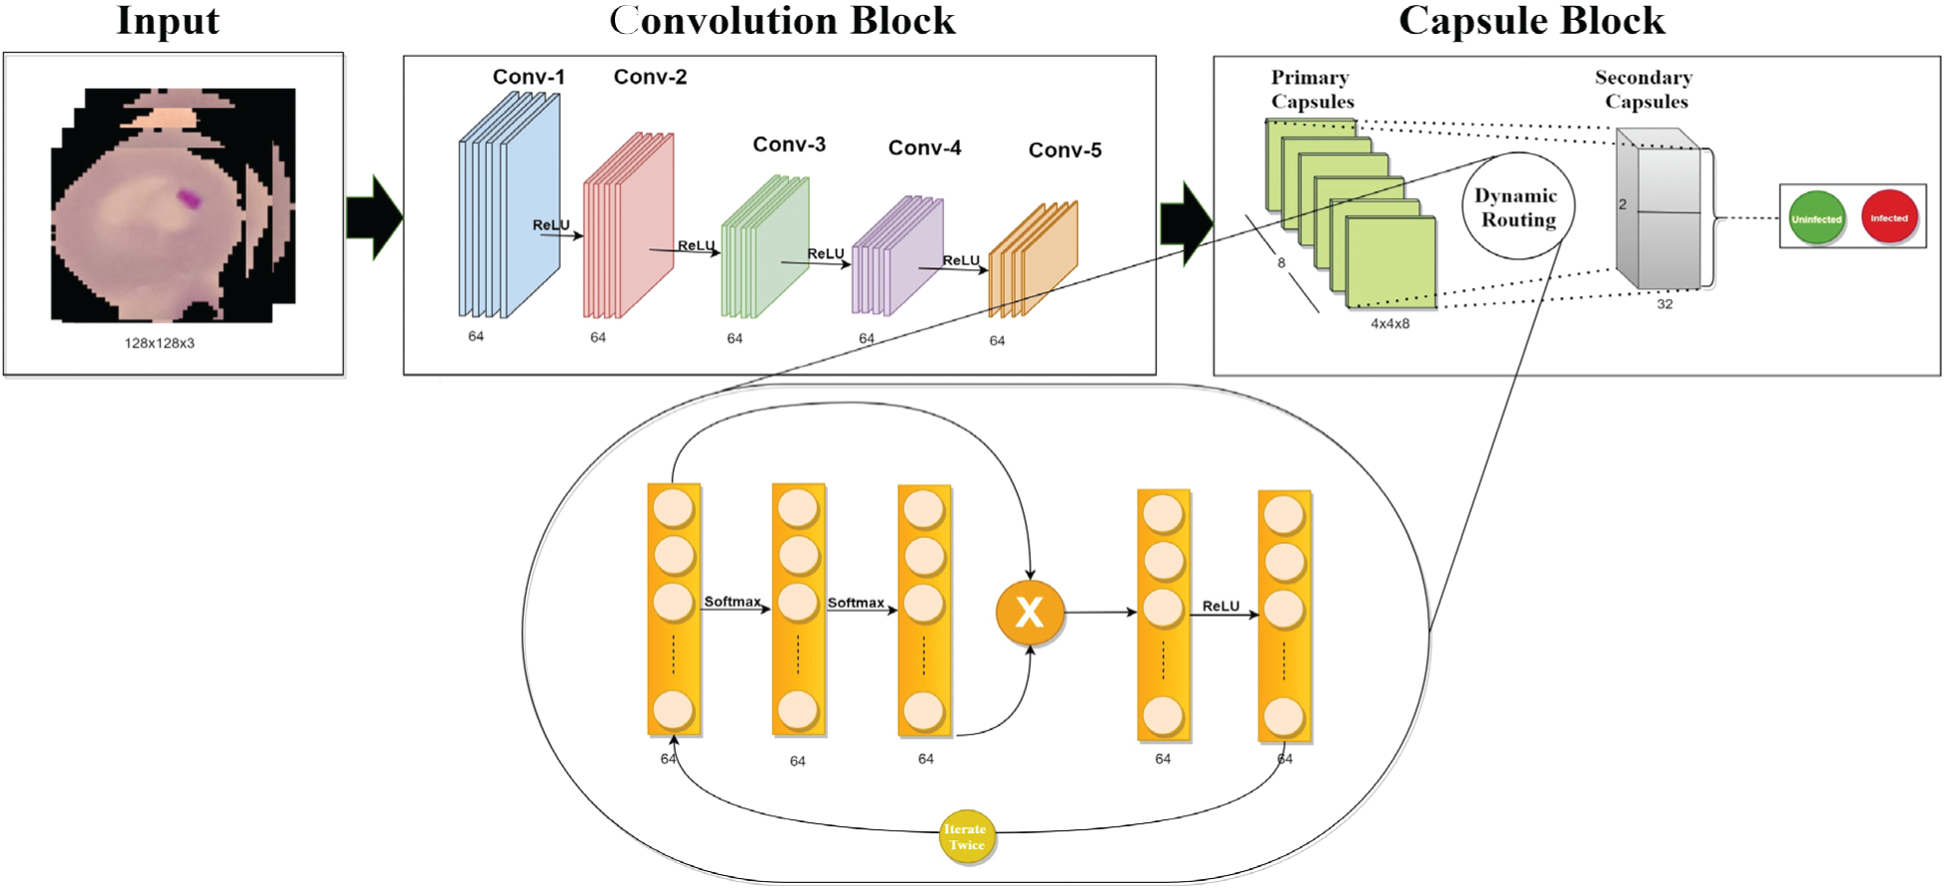
Figure 3: The proposed fully trained capsule network
Most of the modern convolutional neural architectures utilize a pattern of building alternative convolutional networks and pooling layers to extract features and attach some fully connected layers for classification. It is observed that max-pooling layers deprive the information regarding entities residing in an object inside the image. Further, the replacement for pooling layers by convolutional layers with increasing stride can resist information loss and improves learning operation during spatial-dimension reduction [32]. So, a series of convolutional layers attached with batch normalization layers (Batchnorm) is proposed to extract the invariant features from the images (malaria).
To understand the learning ability of individual layers, activation maps of each layer is visualized. Parameters regarding network architecture are described in Tab. 2. For example (124, 124, 3) signify the feature size, ReLU denotes the activation function, 1 represents the stride, and (5, 5) specifies the kernel size of the network. The Batch normalization (Batchnorm) is used to increase the stability of the capsule network.
Table 2: Proposed parameters of capsule network architecture
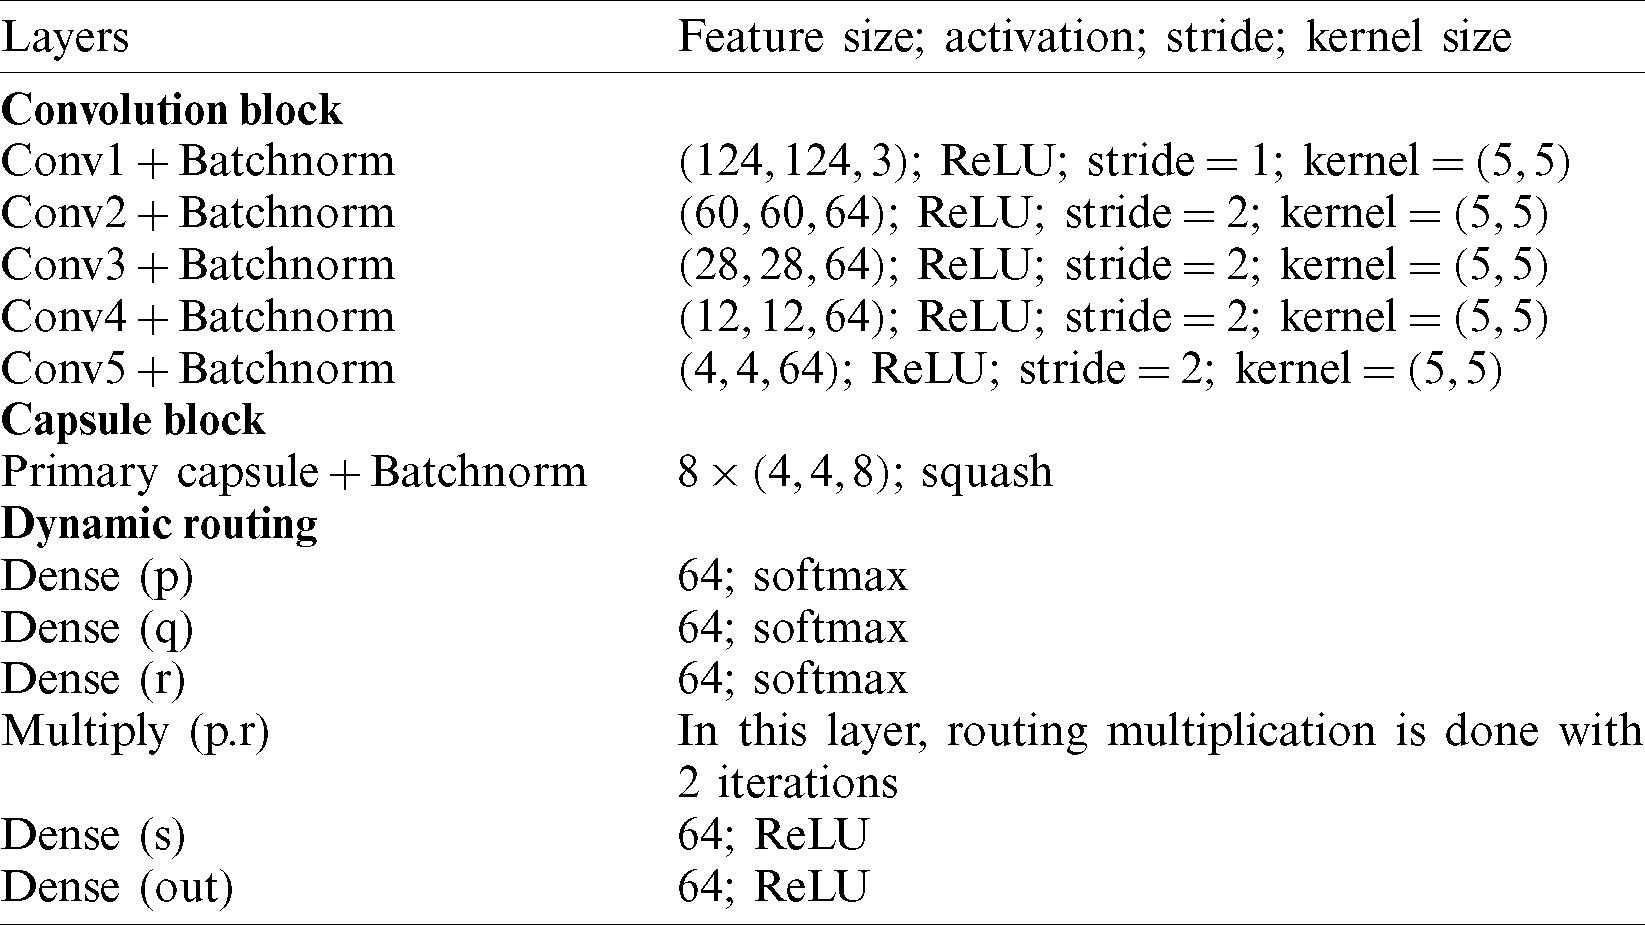
The input image (infected or healthy) is first sent into a series of convolutional layers. In this, an input of shape
The Capsule networks [33] are recently developed neural networks with state-of-the-art performance in the classification of the MNIST dataset by vanquishing the pitfalls of max-pooling layers and convolutional networks. The traditional capsule networks work efficiently by following a design paradigm. Initially, the input is fed into a sequence of convolutional layers, and then the extracted features from them are divided into partitions named as the primary capsules. These primary capsules hold the information regarding entities extracted from convolutional layers. Now, the next layer is named secondary capsules in which every partition in the primary capsules tries to predict the output in the next layer. This process of predicting the successive layer’s information is regarded as dynamic routing. Further, the predicted information of the individual capsule is evaluated with the original information. If the predictions regarding information in capsules are not agreed, then the weight is reduced, and if the agreed weight is increased to a sustainable amount. This process is known as routing by agreement. Now, the complete routing is repeated for a certain number of iterations. The reason for performing these iterations is to understand the orientation of the entities residing in the partitioned capsule which also helps in understanding invariances of the image with spatial orientation. In our research, these capsule networks have been imparted by careful fine-tuning under certain conditions such as:
1. Select appropriate iterations.
2. Analyzing the behavior of non-linear activations during dynamic routing.
3. Modifying the routing procedure for optimal classification.
Now, a detailed mathematical approach to capsule networks is obtained by understanding the insights behind its optimal performance. As it is observed that the routing mechanism is implied between primary and secondary capsules layers. The output of the latent feature map from the convolution block is of the shape
The nonlinearity squash ensures that short vectors i.e., vectors with fewer dimensions shrink close to zero and long vectors shrink close to unit length. The sj is the total input processed into capsules network with the jth dimension. Where sj is a weighted sum of all the predicted vectors with an assisted coupling coefficient (
The number of iterations during routing (n) is a hyper-parameter and iterating for a certain number of epochs is chosen during the training procedure.
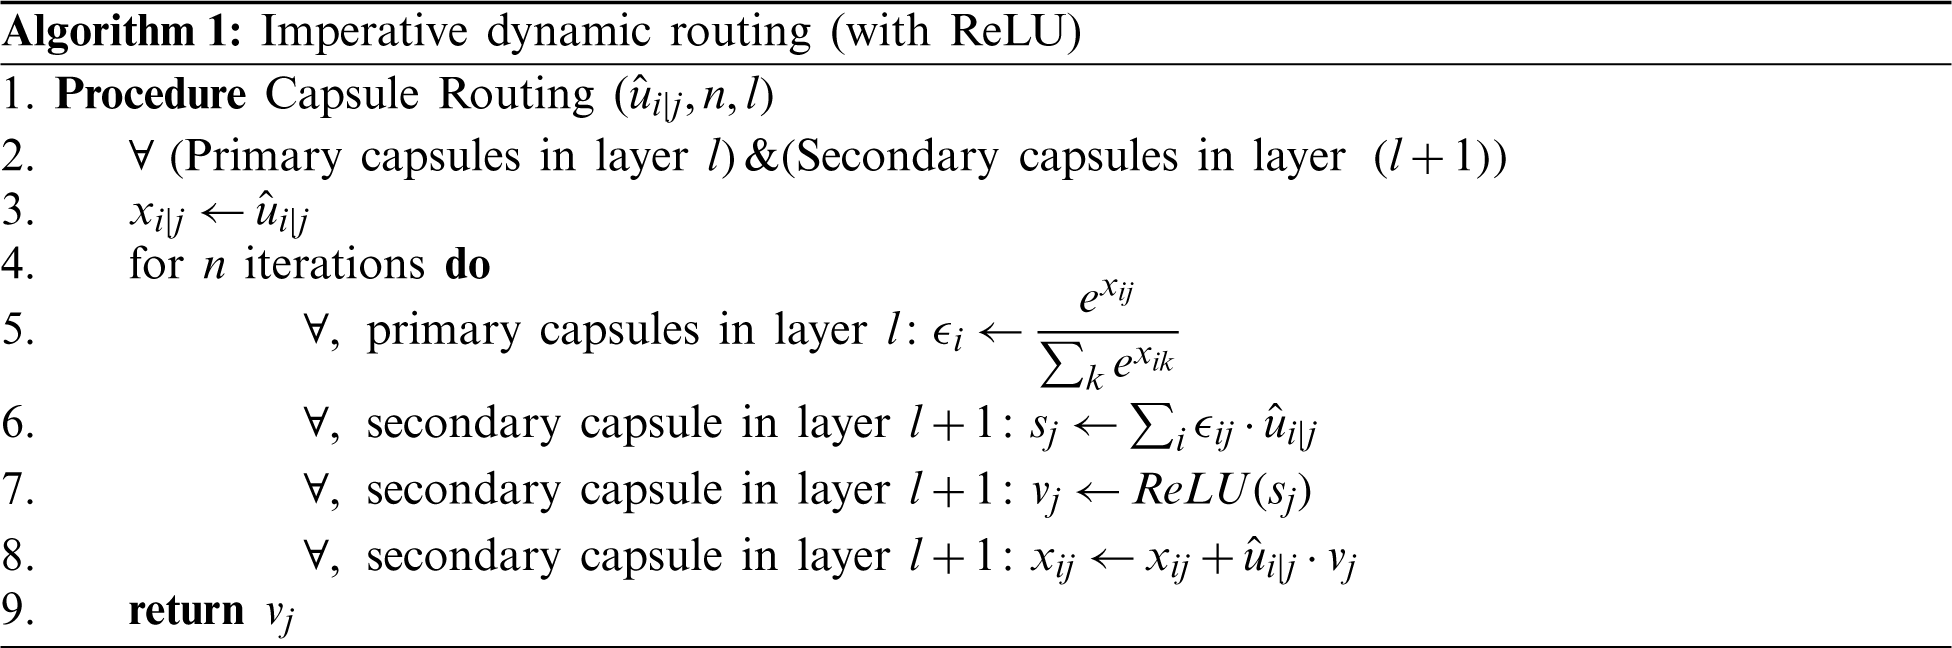
Training is assessed by evaluating convergence and then the model is iterated for 2 iterations. The convergence appeared and hence, n is chosen to be 2. Momentarily increasing these numbers had no improvement in the learning process. The complete learning curves regarding the iterations for 50 epochs are visualized in Fig. 4. So, in the next step, this routing information is classified by applying L2-Norm to the routed feature units. During the routing procedure, at Step 3 in the algorithm, ReLU activation is imparted to enhance the understanding of invariances in captured features. In the traditional capsule network, squash is used as non-linearity. But it is observed that utilizing ReLU non-linearity gradually leads to convergence and provides better generalization. To understand the behavior of nonlinearities, the designed capsule model is trained for certain epochs by interchanging non-linearities such as ReLU, Leaky ReLU, and squash. Their behavior is visually shown by plotting error rates and loss of decay in Fig. 5. To understand the inner representations and learning ability of the dense layers during routing (Tab. 2), the final layer activations obtained with ReLU nonlinearity are visualized using t-SNE. The t-SNE retains not only the local structural patterns but also some global structural patterns which help in understanding higher dimensional representations. Hence for a set of samples i.e., 8000 and 16000 samples t-SNE are visually depicted in Fig. 6. Where 8000 and 16000 samples consumed execution time of 87 and 378 s respectively.
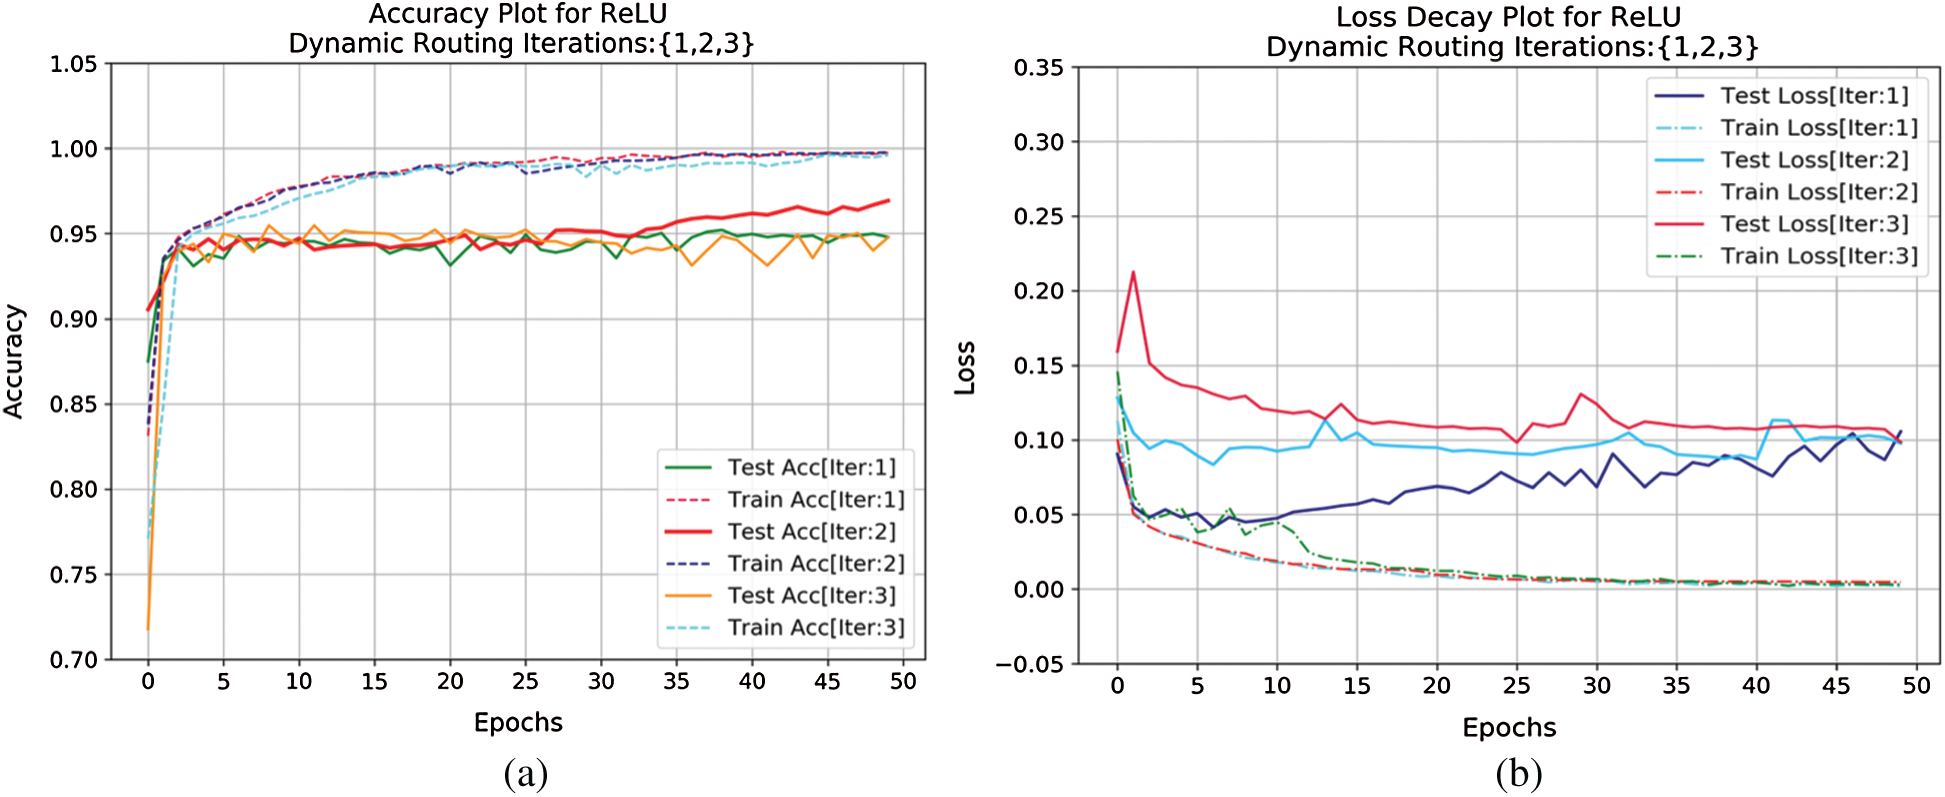
Figure 4: (a) Accuracy curve and (b) loss decay curve for capsule network router over 3 different iterations both during training and testing criterion for certain epochs (50)
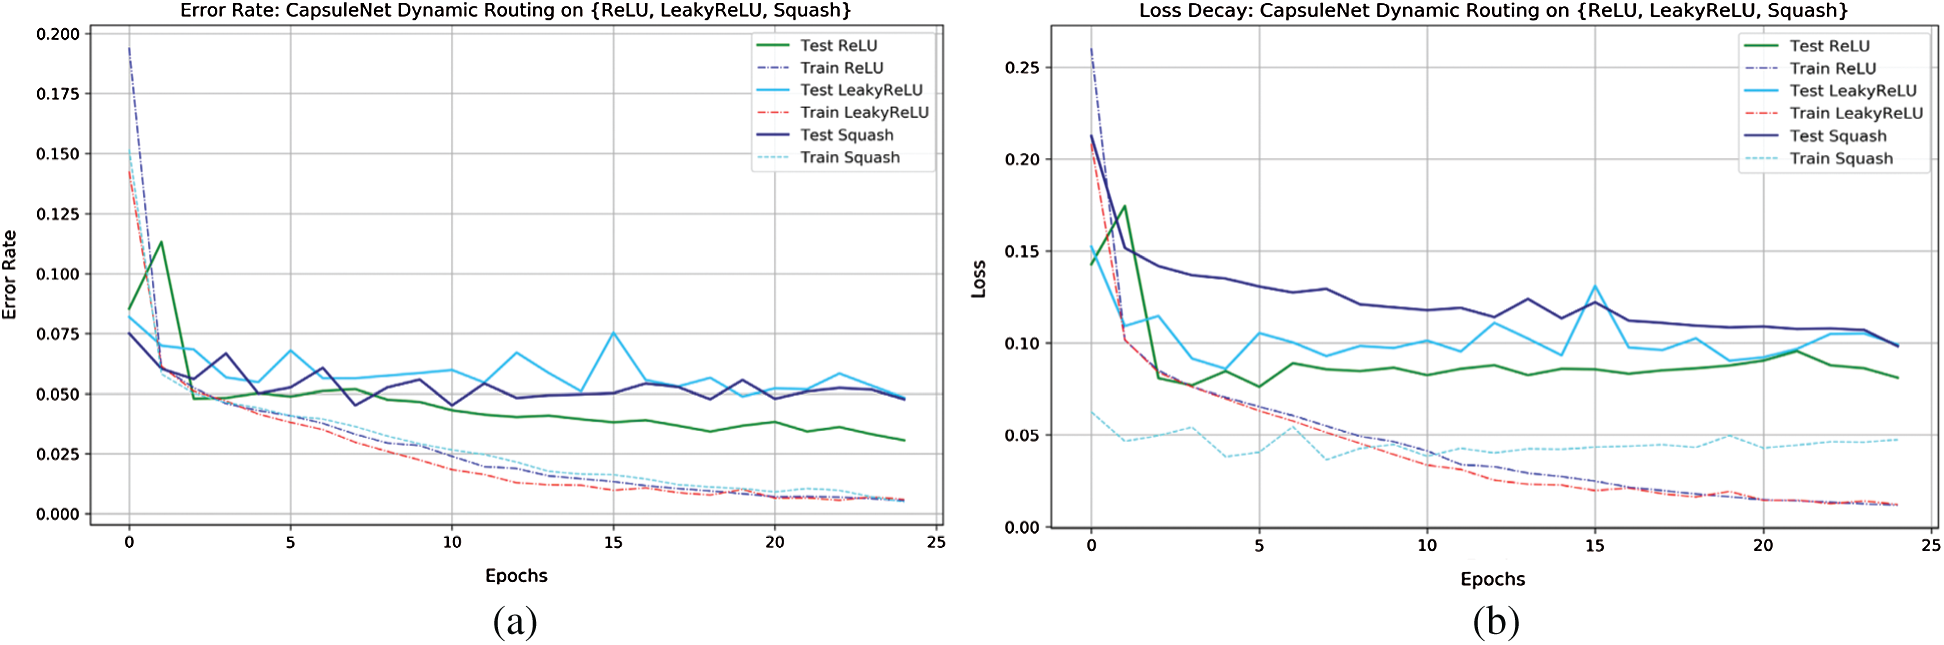
Figure 5: Error-rate and loss-decay curves of capsule network with dynamic routing on {ReLU, LeakyReLU, Squash}
From Fig. 5, observed by interchanging final layer non-linearities and loss decay and error rate decay for ReLU are gradually low while compared to other nonlinearities during testing criteria. These visualizations clearly depict the classification performance of the capsule network in classifying infected class to that of healthy.
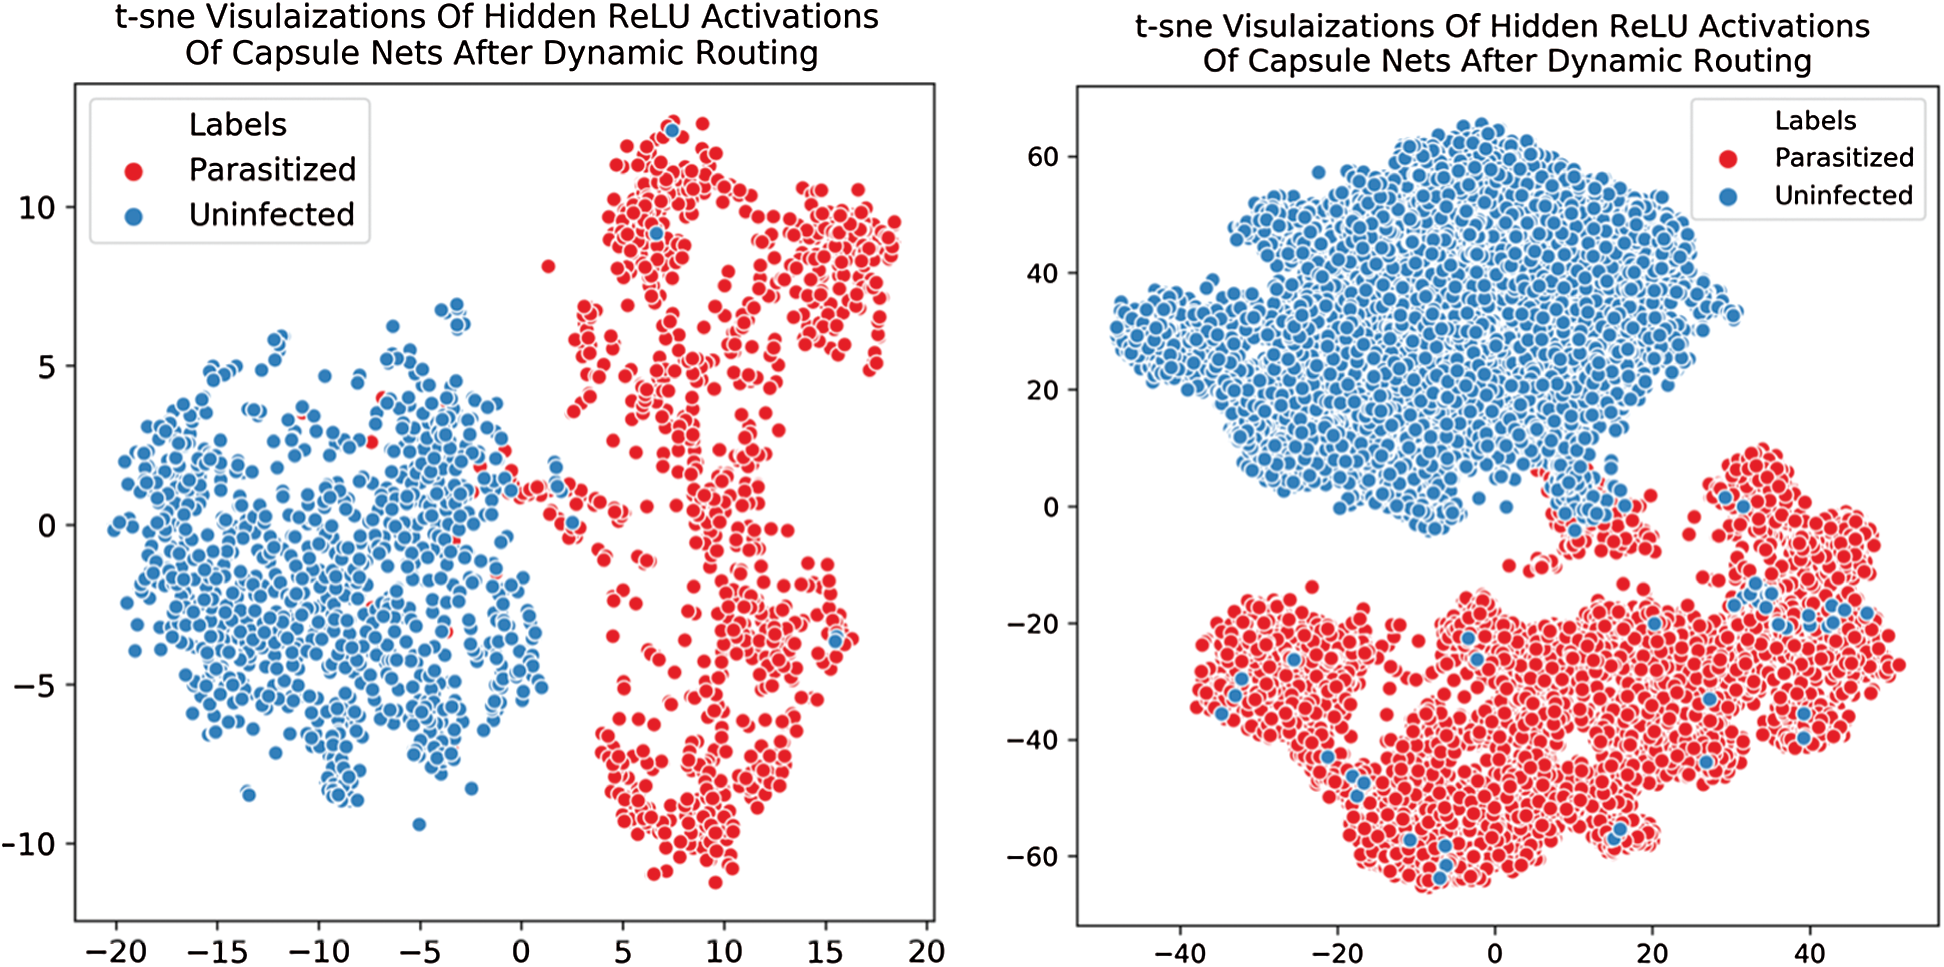
Figure 6: Illustrated t-SNE visualization depicts the class-wise distribution of extracted features from the proposed capsule network. (a) t-SNE plot for 8000 samples (b) t-SNE plot for 16000 samples
The objective function discussed in Eq. (5) derives the performance of the capsule model. As in the traditional capsule network, the margin loss function had weighted parameters
To evaluate the resilience of the model, a set of metrics are used in bio-medical pattern analysis. In this section complete evaluation of the model is done under various constraints. Initially, the proposed Capsule Network is compared to existing state-of-the-art classification architectures which outperformed in ILSVRC for the past decade. Those pre-trained weights are utilized to extract features. This extracted feed is forwarded to a series of fully connected layers with 64-32-2 neurons at each layer. The final layer is activated with SoftMax and other layers used ReLU non-linearity. As mentioned in the Tab. 1 the proposed model is evaluated for testing samples ranging from 10%–50%. The experimentations were carried out for multiple splits and of which the performance of the capsule network attained high for 20%. A set of standard classification metrics are evaluated for the model such as, accuracy score, AUC-ROC, sensitivity, and specificity are evaluated for individual split are illustrated in the Tab. 3. But, for simplicity 20% split is considered for comparison and is mentioned in Tab. 4.
Table 3: Capsule network performance on variant generalizations tests ranging from 10%–50%
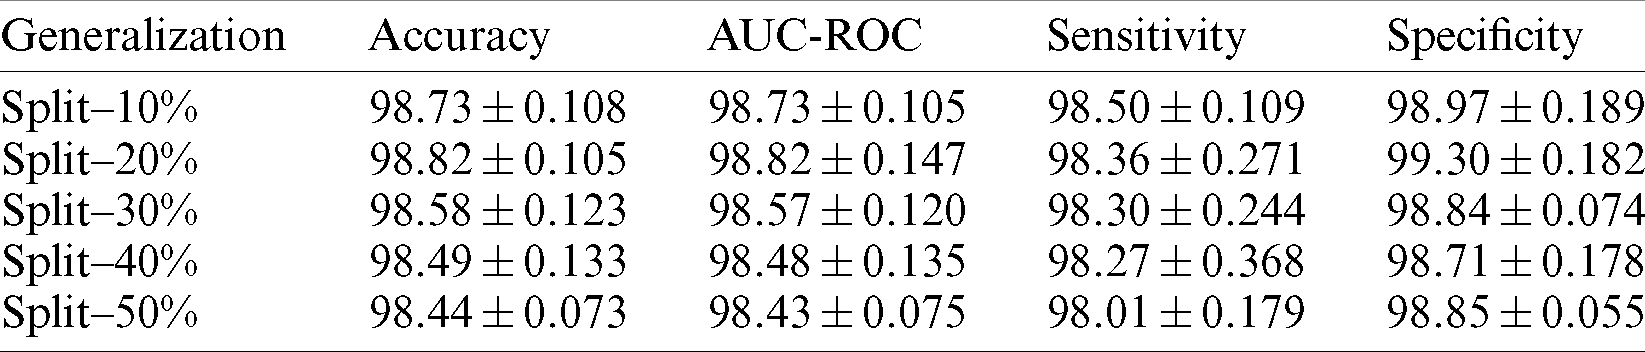
Table 4: Illustrates the capsule network’s (variants) performance compared with existing pre-trained state-of-the-art feature extraction architectures
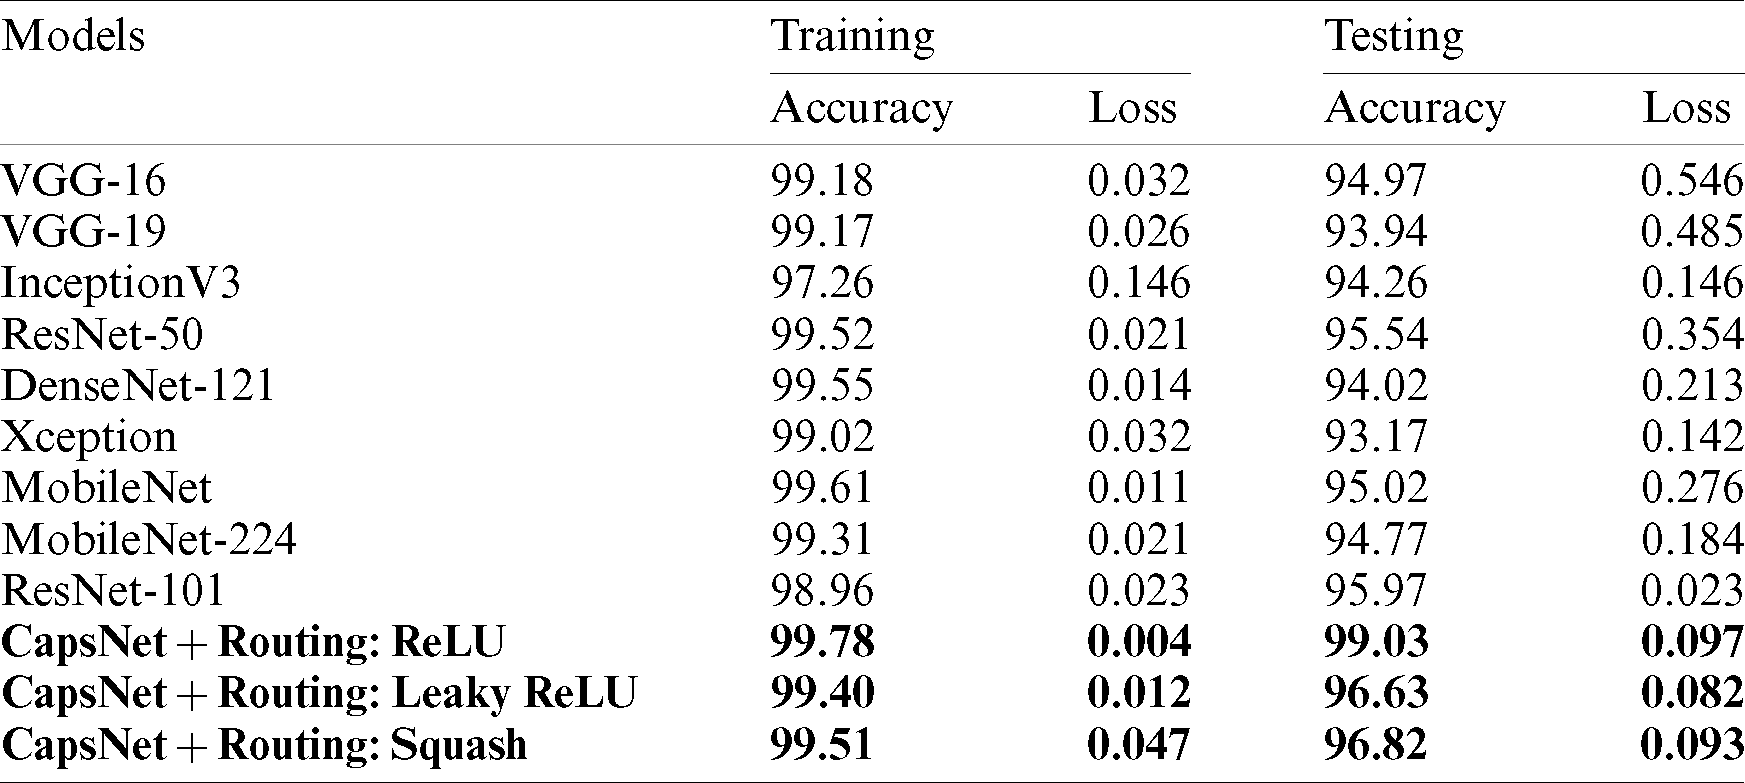
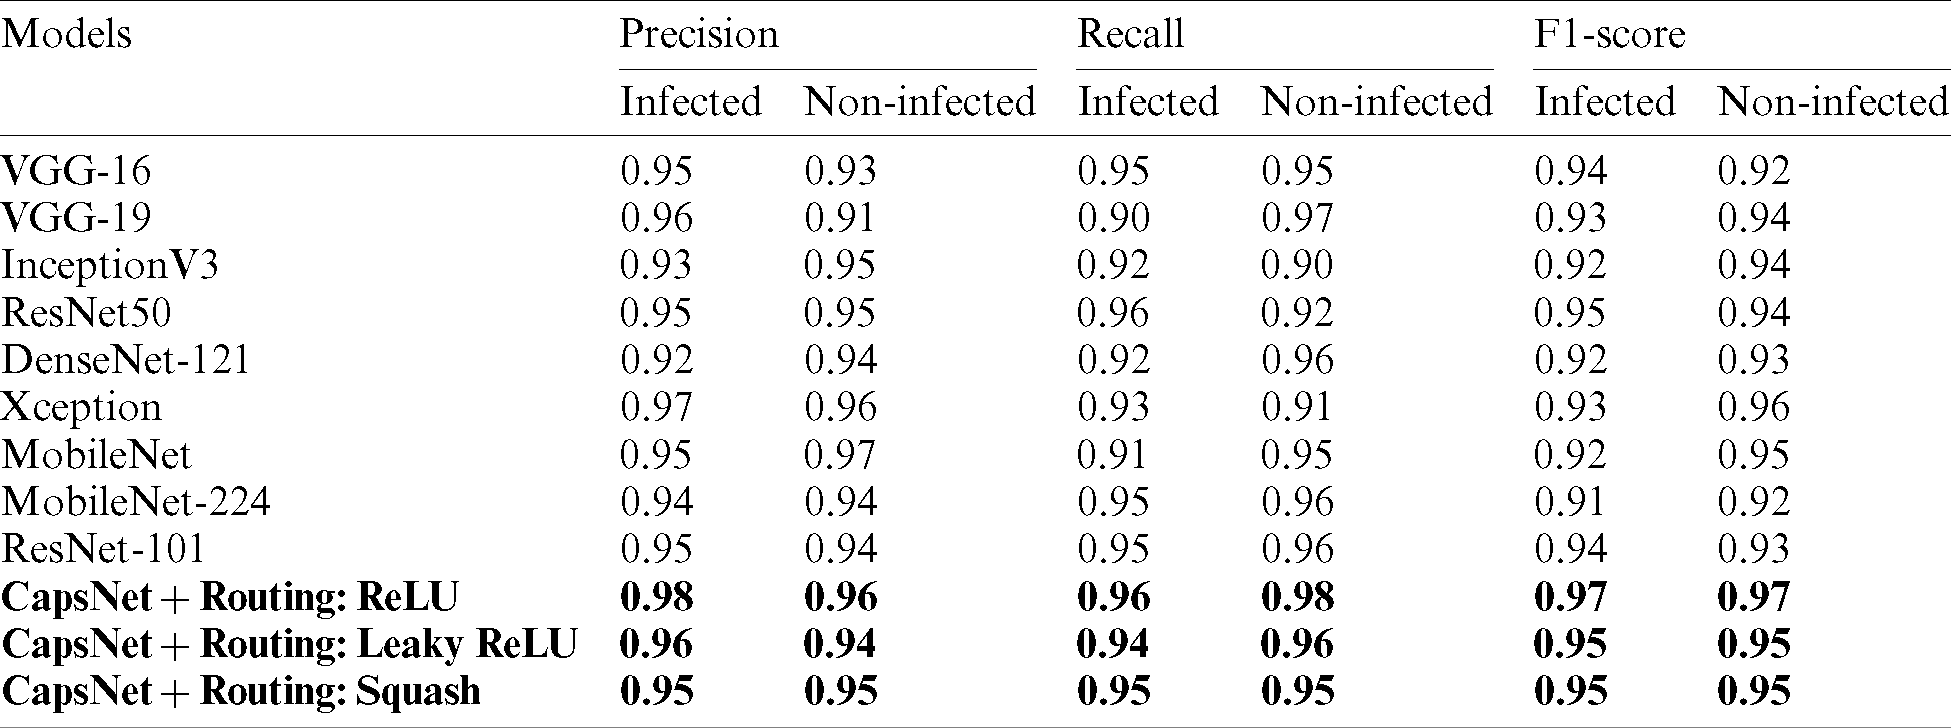
A comparative study has been shown in Tab. 5 to compare the proposed method vs. other existing methods with respect to sensitivity, specificity, and f1-score. Tab. 6 describes the performance of the proposed capsule network with variant non-linearities. Their performance is compared to that of state-of-the-art pre-trained models over a generalization split of 80%–20% for training and testing samples. It is observed that most of the models tend to perform poorly. Their poor performance on this dataset is observed. Their weights tend to perform well on standard classification datasets but they aren’t able to classify them due to poor-feature extraction due to overwhelming depth. Now the problem of overwhelming depth is observed and visualization regarding the conceptions provided are clearly depicted without any ambiguity. In this research work to evaluate the performance of the model AUC, Sensitivity, specificity, and accuracy score are chosen as standard metrics with their individual importance in biomedical pattern analysis. AUC determines the quality of Neural Architecture (classification) and its discriminative ability is standard with statistical consistency. While choosing sensitivity and specificity, they might not estimate the probability of occurrence of disease in an individual patient by qualifying the diagnostic ability but, determines the diagnostic correctness.
Table 5: Comparison of proposed capsule network’s performance compared with existing pre-trained state-of-the-art methods on malaria classification
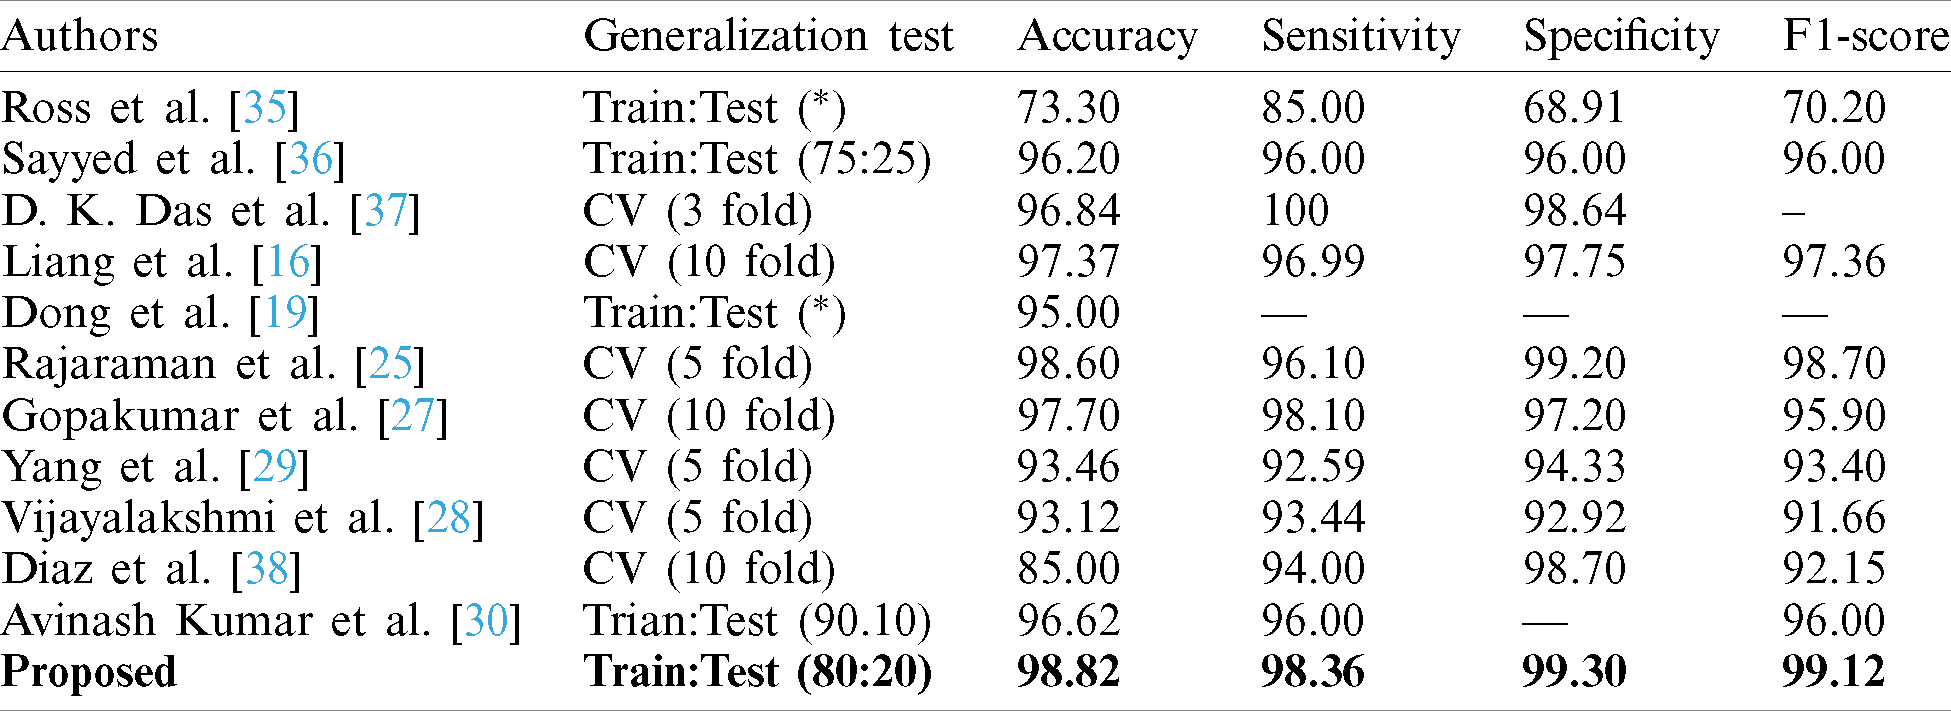
Table 6: Performance metrics of the model with 20% test samples
Finally, accuracy score is a standard metric known for its generic utility invariant domains. So, these metrics are utilized to determine the robustness of the proposed model. For appropriate generalization, the model is driven to evaluate its performance by diving testing samples with certain partitions varying from 10%–50%.
At each split (partition) samples are randomly shuffled five times not to misguide the predictions. So, at each test case, these 5 times shuffled samples are aggregated and tabulated in Tab. 3. In each shuffle of a test phase, the model with greater performance is depicted in the form of confusion matrices as shown in Fig. 7. It is observed that previous literature, for a certain period used handcrafted techniques which tends to extract feature which is highly pre-processed and was not able to perform well on large samples. After the evolution of convolution networks, the process of automated learning has improved but they were not able to overhaul the problem detecting entities with a flickering spatial orientation that increases misclassification errors. By observing these challenges, a capsule network, with appropriate training is developed to overhaul the problem individually. Additionally, the problem of generalization is proposed also observed and shown experimentally that the proposed network is verbally robust to unseen samples. The testing performance was extreme at 20% test samples under one of the shuffle constraints. At which the model acquired an AUC of 99.03% and highest specifically of 99.43%. To understand the behavior of individual networks at various test shuffle an Accuracy vs. test plot is visualized in Fig. 8. It gives insights into the model by determining the accuracy of the model at various shuffles for individual tests. As there are no class-imbalance scenario accuracy scores obtained will add significance to the model. It is observed that most of the deep vision models tend to perform poorly under three different constraints. These constraints are as follows:
Low Pixel Resolutions: The revival of deep convolutions led to extract features automatically either by complete training of data or by transfer of features. In this process, the input is fed into the model is crucial and if the resolution of input is degraded the features are poorly extracted i.e., they might not contain the specified detail and hence input can be misinterpreted. The models [16,18,25,27,29,35] did not use proper pixel resolutions which might cause misclassification. To suppress this, a pixel resolution of
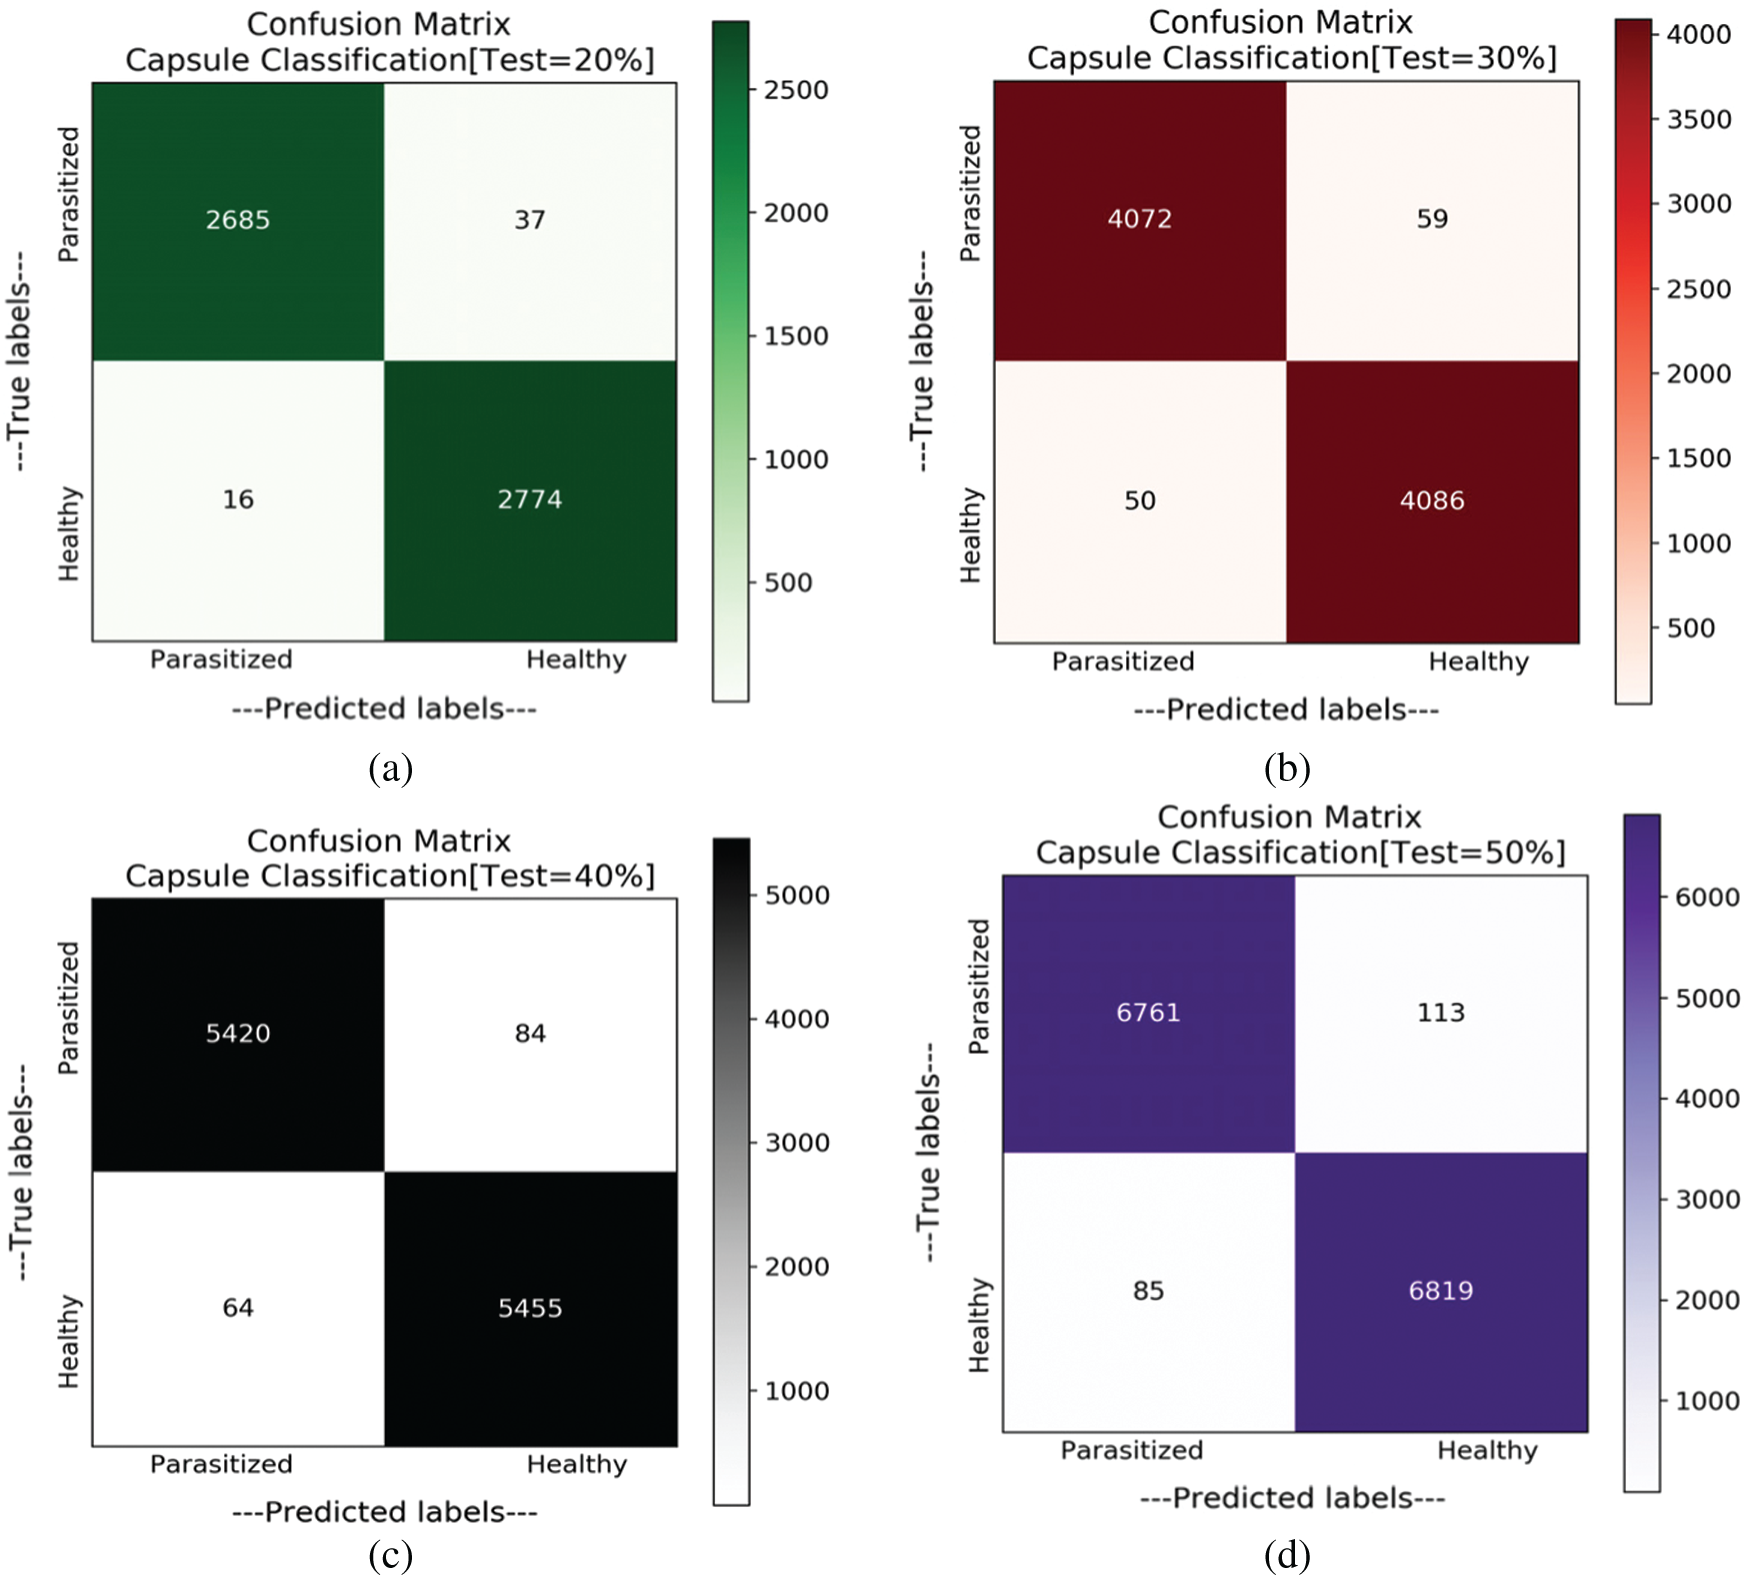
Figure 7: Confusion matrices obtained for variant splits. (a) Confusion matrix with test samples of 20%. (b) Confusion matrix with test samples of 30%. (c) Confusion matrix with test samples of 40%. (d) Confusion matrix with test samples of 50%
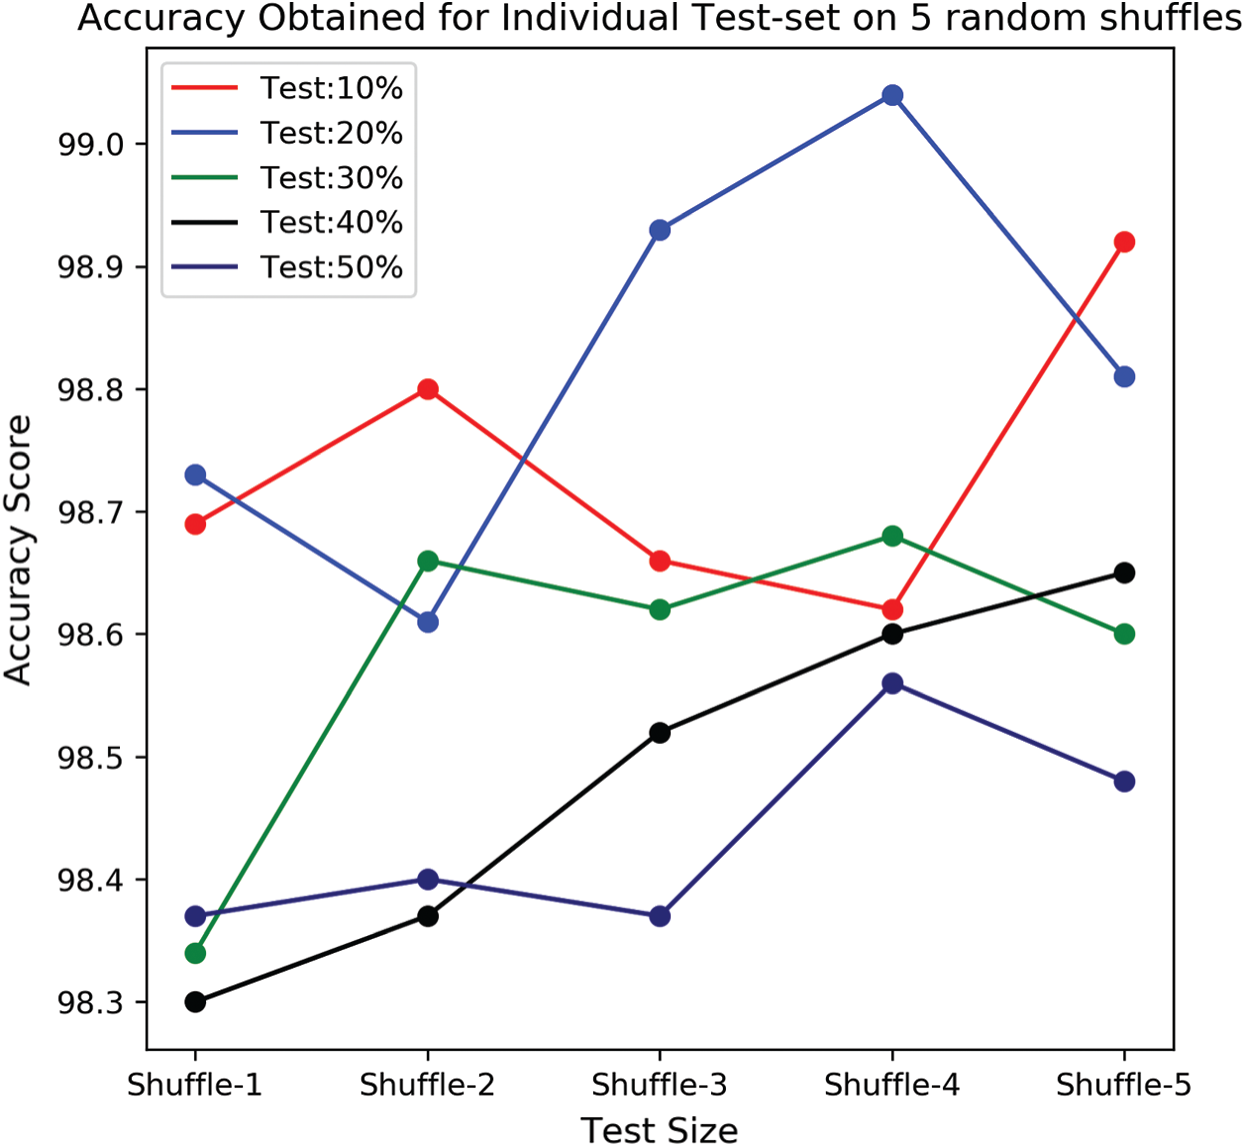
Figure 8: Accuracy score obtained by the model under various splits with randomized shuffle variants for an individual split
Reducing Loss of Information: Most of the information is lost due to pooling layers (max-pooling, average-pooling, etc.). These layers cause information loss either by holding the highest pixel value from a group or by averaging a group of pixels. This can mislead information regarding entity and in biomedical imaging, their impact can be adverse. So, an alternative for downscaling a series of convolutions with stride 2 is preferred. This preference not only reduces information loss but also provides uninterrupted end-to-end training. Further, capsule networks with imperative routing are utilized for understanding spatial orientations of parasitized class. Sayyed et al. [36] utilized capsule networks but processed with a low pixel resolution and added pooling layers for downscaling the dimensions. The other models [16,27,29,30] either trained with pooling layers or utilized pre-trained networks where pooling layers are broadly used.
Appropriate Generalization: Most of the models utilized various generalization strategies varying from train test to 10-fold cross-validation. As of known 10-fold cross-validation is chosen as the gold standard for greater generalization outcomes. But due to its high computational complexity, it is not widely used in deep learning. Either to test the resilience of the model a train-test for variant splits is utilized. But, to understand learning patterns keenly, for an individual test split 5 randomly shuffles are used to understand the model learning patterns. As to test for further generalization, the trained models are tested on thick blood smears and this obliged to design a versatile and robust model.
In this research, a hand-crafted deep capsule network along with a modified routing algorithm has proposed. It attains a state-of-the-art classification of malaria being parasitized or not from blood cell images. The capsule networks deliver high efficacy in performing the classification task of classifying malaria parasites towards malaria diagnosis with the appropriate tuning of parameters. This study generates various metrics to assess the performance of proposed works and it is observed that tuning the loss parameters would affect the model’s performance. This proposed network has a significant improvement when compared to other deep learning techniques and tests the blood cell images for classification of malaria by achieving an accuracy score of 99.04% on 20% split and at the worst-case scenario (50% test) attained a test accuracy of
Acknowledgement: The authors acknowledge JNTUH/TEQIP-III, for providing financial support to carry out this works (Ref: No. JNTUH/TEQIP-III/CRS/2019/CSE/13).
Funding Statement: This research was supported by the Jawaharlal Nehru Technological University Hyderabad, India under Grant Procs No. JNTUH/TEQIP-III/CRS/2019/CSE/13. The authors gratefully acknowledge the financial support provided by the J.N.T. University Hyderabad, India.
Conflicts of Interest: The authors declare that they have no conflicts of interest to report regarding the present study.
1. S. Rajaraman, S. S. Jaeger and K. A. Sameer. (2019). “Performance evaluation of deep neural ensembles toward malaria parasite detection in thin-blood smear images,” PeerJ, vol. 17, pp. e6977. [Google Scholar]
2. World Health Organization, Fact sheet about Malaria. [Online]. Available: https://www.who.int/news-room/fact-sheets/detail/malaria (Accessed 15 August 2020). [Google Scholar]
3. World Health Organization, World malaria report 2019. [Online]. Available: https://www.who.int/publications/i/item/9789241565721 (Accessed 15 August 2020). [Google Scholar]
4. S. S. Devi, A. Roy, J. Singha, S. A. Sheikh and R. H. Laskar. (2018). “Malaria infected erythrocyte classification based on a hybrid classifier using microscopic images of thin blood smear,” Multimedia Tools and Applications, vol. 77, no. 1, pp. 631–660. [Google Scholar]
5. R. Sujatha, J. M. Chatterjee, N. Z. Jhanjhi and S. N. Brohi. (2020). “Performance of deep learning vs. machine learning in plant leaf disease detection,” in Microprocessors and Microsystems. Amsterdam, Netherlands: Elsevier, pp. 103615. [Google Scholar]
6. S. H. Kok, A. Azween and N. Z. Jhanjhi. (2020). “Evaluation metric for crypto-ransomware detection using machine learning,” Journal of Information Security and Applications, Elsevier, vol. 55, no. 2, pp. 102646. [Google Scholar]
7. M. J. Cuomo, L. B. Noel and D. B. White. (2012). “Diagnosing medical parasites: A public health officers guide to assisting laboratory and medical officers,” USAF Air Education and Training Command Randolph AFB TX, . http://www.phsource.us/PH/PARA/. [Google Scholar]
8. S. Dhiman, I. Baruah and L. Singh. (2010). “Military malaria in northeast region of India,” Defence Science Journal, vol. 60, no. 2, pp. 213–218. [Google Scholar]
9. Sung-Jong Eun, H. Kim, J. Park and T. Whangbo. (2015). “Effective object segmentation based on physical theory in an MR image,” Multimedia Tools and Applications, vol. 74, no. 16, pp. 6273–6286. [Google Scholar]
10. D. Fan, W. Lu and C. Maoyong. (2016). “Extraction of target region in lung immunohistochemical image based on artificial neural network,” Multimedia Tools and Applications, vol. 75, no. 19, pp. 12227–12244. [Google Scholar]
11. O. Sertel, B. Dogdas, C. S. Chiu and M. N. Gurcan. (2011). “Microscopic image analysis for quantitative characterization of muscle fiber type composition,” Computerized Medical Imaging and Graphics, Elsevier, vol. 35, no. 7, 8, pp. 616–628. [Google Scholar]
12. M. Poostchi, K. Silamut, R. J. Maude, S. Jaeger and G. Thoma. (2018). “Image analysis and machine learning for detecting malaria,” Translational Research, vol. 194, no. 6_Suppl, pp. 36–55. [Google Scholar]
13. A. Krizhevsky, S. Ilya Sutskever and E. H. Geoffrey. (2017). “ImageNet classification with deep convolutional neural networks,” Communications of the ACM, vol. 60, no. 6, pp. 84–90. [Google Scholar]
14. J. Redmon, S. Divvala, R. Girshick and A. Farhadi. (2016). “You only look once: Unified, real-time object detection,” in Proc. of the IEEE Conf. on Computer Vision and Pattern Recognition, Las Vegas, NV, USA, pp. 779–788. [Google Scholar]
15. M. I. Razzak, SaeedaNaz and A. Zaib. (2018). “Deep learning for medical image processing: Overview, challenges, and the future,” in Classification in BioApps. Cham: Springer, pp. 323–350. [Google Scholar]
16. Z. Liang, A. Powell, I. Ersoy, M. Poostchi, K. Silamut, K. Palaniappan, P. Guo et al. (2016). , “CNN-based image analysis for malaria diagnosis,” in 2016 IEEE Int. Conf. on Bioinformatics and Biomedicine, Shenzhen, China, IEEE, pp. 493–496. [Google Scholar]
17. J. A. Quinn, R. Nakasi, P. K. B. Mugagga, P. Byanyima, W. Lubega and A. Andama. (2016). “Deep convolutional neural networks for microscopy-based point of care diagnostics,” in Machine Learning for Healthcare Conf., Los Angeles, CA, USA, PMLR, pp. 271–281. [Google Scholar]
18. H. Shen, W. D. Pan, Y. Dong and M. Alim. (2016). “Lossless compression of curated erythrocyte images using deep autoencoders for malaria infection diagnosis,” in 2016 Picture Coding Symp., Nuremberg, Germany, IEEE, pp. 1–5. [Google Scholar]
19. Y. Dong, Z. Jiang, H. Shen, W. D. Pan, L. A. Williams et al. (2017). , “Evaluations of deep convolutional neural networks for automatic identification of malaria-infected cells,” in 2017 IEEE EMBS Int. Conf. on Biomedical & Health Informatics, Orlando, Florida, USA, IEEE, pp. 101–104. [Google Scholar]
20. X. Zhang, W. Lu, F. Li, X. Peng and R. Zhang. (2019). “Deep feature fusion model for sentence semantic matching,” Computers, Materials & Continua, vol. 61, no. 2, pp. 601–616. [Google Scholar]
21. F. Li, C. Ou, Y. Gui and L. Xiang. (2019). “Instant edit propagation on images based on bilateral grid,” Computers, Materials & Continua, vol. 61, no. 2, pp. 643–656. [Google Scholar]
22. K. S. Sahoo, B. K. Tripathy, K. Naik, S. Ramasubbareddy, B. Balusamy et al. (2020). , “An evolutionary svm model for ddos attack detection in software defined networks,” IEEE Access, vol. 8, pp. 132502–132513. [Google Scholar]
23. J. Hung and C. Anne. (2017). “Applying faster R-CNN for object detection on malaria images,” in Proc. of the IEEE Conf. on Computer Vision and Pattern Recognition Workshops, Honolulu, HI, USA, pp. 56–61. [Google Scholar]
24. R. Sivaramakrishnan, S. Antani and S. Jaeger. (2017). “Visualizing deep learning activations for improved malaria cell classification,” Proc. of the First Workshop Medical Informatics and Healthcare held with the 23rd SIGKDD Conf. Knowledge Discovery and Data Mining, Halifax, Nova Scotia, Canada, PMLR, vol. 69, pp. 40–47. [Google Scholar]
25. R. Sivaramakrishnan, S. K. Antani, M. Poostchi, K. Silamut, Md A. Hossain et al. (2018). , “Pre-trained convolutional neural networks as feature extractors toward improved malaria parasite detection in thin blood smear images,” PeerJ, vol. 6, pp. e4568. [Google Scholar]
26. W. D. Pan, Y. Dong and D. Wu. (2018). “Classification of malaria-infected cells using deep convolutional neural networks,” Machine Learning: Advanced Techniques and Emerging Applications, vol. 159, . https://doi.org/10.5772/intechopen.72426. [Google Scholar]
27. G. P. Gopakumar, M. Swetha, S. S. Murali, S. S. Gorthi, S. Sai et al. (2018). , “Convolutional neural network-based malaria diagnosis from focus stack of blood smear images acquired using custom-built slide scanner,” Journal of Biophotonics, vol. 11, no. 3, pp. e201700003. [Google Scholar]
28. A. Vijayalakshmi and B. Rajesh Kanna. (2020). “Deep learning approach to detect malaria from microscopic images,” Multimedia Tools and Applications, vol. 79, no. 21, pp. 1–21. [Google Scholar]
29. F. Yang, M. Poostchi, H. Yu, Z. Zhou, K. Silamut et al. (2019). , “Deep learning for Smartphone-based malaria parasite detection in thick blood smears,” IEEE Journal of Biomedical and Health Informatics, vol. 24, no. 5, pp. 1427–1438. [Google Scholar]
30. A. Kumar, S. Sarkar and C. Pradhan. (2020). “Malaria disease detection using CNN technique with SGD, RMSprop and ADAM optimizers, ” in Deep Learning Techniques for Biomedical and Health Informatics. Cham: Springer, pp. 211–230. [Google Scholar]
31. M. Maity, A. Jaiswal, K. Gantait, J. Chatterjee and A. Mukherjee. (2020). “Quantification of malaria parasitaemia using trainable semantic segmentation and capsnet,” Pattern Recognition Letters, vol. 138, no. 15, pp. 88–94. [Google Scholar]
32. J. T. Springenberg, A. Dosovitskiy, T. Brox and M. Riedmiller. (2015). “Striving for simplicity: The all convolutional net,” in 3rd Int. Conf. on Learning Representations, ICLR 2015, May 7–9, San Diego, CA, USA. [Google Scholar]
33. S. Sabour, F. Nicholas and E. H. Geoffrey. (2017). “Dynamic routing between capsules,” Advances in Neural Information Processing Systems, vol. 30, pp. 3856–3866. [Google Scholar]
34. K. Janocha and W. M. Czarnecki. (2017). “On loss functions for deep neural networks in classification,” Computing Research Repository, February. [Google Scholar]
35. N. E. Ross, C. J. Pritchard, J. Charles, D. M. Rubin and A. G. Duse. (2006). “Automated image processing method for the diagnosis and classification of malaria on thin blood smears,” Medical and Biological Engineering and Computing, vol. 44, no. 5, pp. 427–436. [Google Scholar]
36. A. Q. M. S. Sayyed, D. Saha, A. R. Hossain and C. Sahnaz. (2019). “Effectiveness of convolutional and capsule network in malaria parasite detection,” in 2019 IEEE Int. Conf. on Signal Processing, Information, Communication & Systems, Dhaka, Bangladesh, IEEE, pp. 68–73. [Google Scholar]
37. D. K. Das, A. K. Maiti and C. Chakraborty. (2015). “Automated system for characterization and classification of malaria-infected stages using light microscopic images of thin blood smears,” Journal of Microscopy, vol. 257, no. 3, pp. 238–252. [Google Scholar]
38. G. Díaz, F. A. González and E. Romero. (2009). “A semi-automatic method for quantification and classification of erythrocytes infected with malaria parasites in microscopic images,” Journal of Biomedical Informatics, vol. 42, no. 2, pp. 296–307. [Google Scholar]
 | This work is licensed under a Creative Commons Attribution 4.0 International License, which permits unrestricted use, distribution, and reproduction in any medium, provided the original work is properly cited. |