DOI:10.32604/cmc.2021.016037
| Computers, Materials & Continua DOI:10.32604/cmc.2021.016037 | |
| Article |
COVID-19 Infected Lung Computed Tomography Segmentation and Supervised Classification Approach
1Department of Computer Science, Concordia College Bahawalpur, Bahawalpur, 63100, Pakistan
2Department of Computer Science & IT, Glim Institute of Modern Studies, Bahawalpur, 63100, Pakistan
3Institute of Numerical Sciences, Kohat University of Science & Technology, Kohat, 26000, Pakistan
4Institute of Computing, Kohat University of Science and Technology, Kohat, 26000, Pakistan
5Program in Applied Statistics, Department of Mathematics and Computer Science, Faculty of Science and Technology, Rajamangala University of Technology Thanyaburi, Thanyaburi, 12110, Thailand
6Departments of Mathematics, Faculty of Science, Center of Excellence in Theoretical and Computational Science (TaCS-CoE) & KMUTT Fixed Point Research Laboratory, Room SCL 802 Fixed Point Laboratory, Science Laboratory Building, King Mongkut’s University of Technology Thonburi (KMUTT), Bangkok, 10140, Thailand
7Department of Medical Research, China Medical University Hospital, Taichung, 40402, Taiwan
8College of Engineering, Al Ain University, Al Ain, 64141, United Arab Emirates
9Department of Mathematics, Tafila Technical University, Tafila, 66110, Jordan
10Department of Statistics, The Islamia University of Bahawalpur, Bahawalpur, 63100, Pakistan
11Department of Mathematics, Université de Caen, LMNO, Caen, 14032, France
*Corresponding Author: Poom Kumam. Email: poom.kum@kmutt.ac.th
Received: 19 December 2020; Accepted: 19 January 2021
Abstract: The purpose of this research is the segmentation of lungs computed tomography (CT) scan for the diagnosis of COVID-19 by using machine learning methods. Our dataset contains data from patients who are prone to the epidemic. It contains three types of lungs CT images (Normal, Pneumonia, and COVID-19) collected from two different sources; the first one is the Radiology Department of Nishtar Hospital Multan and Civil Hospital Bahawalpur, Pakistan, and the second one is a publicly free available medical imaging database known as Radiopaedia. For the preprocessing, a novel fuzzy c-mean automated region-growing segmentation approach is deployed to take an automated region of interest (ROIs) and acquire 52 hybrid statistical features for each ROIs. Also, 12 optimized statistical features are selected via the chi-square feature reduction technique. For the classification, five machine learning classifiers named as deep learning J4, multilayer perceptron, support vector machine, random forest, and naive Bayes are deployed to optimize the hybrid statistical features dataset. It is observed that the deep learning J4 has promising results (sensitivity and specificity: 0.987; accuracy: 98.67%) among all the deployed classifiers. As a complementary study, a statistical work is devoted to the use of a new statistical model to fit the main datasets of COVID-19 collected in Pakistan.
Keywords: COVID-19; machine learning; fuzzy c-mean; deep learning J4
An epidemic alarmed the world when pneumonia began to move from one human to another. The severe respiratory syndrome is caused by the coronavirus, which is new biology in the family of already-known viruses (single-stranded RNA viruses (+ssRNA)) mostly found in animals [1]. It is a curable disease, but it can also be life-threatening with a 3% death rate and a 7.5% reproductive rate. Acute illness can cause death due to massive lung damage and difficulty breathing. This virus spreading started from China’s Hubei province capital (Wuhan), which is recognized from two categories: the “middle east respiratory syndrome” (MERS) and the “severe acute respiratory syndrome” (SARS) [2]. On the 11th of February 2020, the world health organization (WHO) specified that the virus is new, and was a Coronavirus disease 2019 (COVID-19). COVID-19 has become the greatest challenge for the survival of mankind due to its exponential growth and non-availability of vaccines or any confirmed medication [3]. Over 89,318,701 confirmed cases and 1,920,711 deaths have been reported until January 09, 2021, from across the globe. Globally, the mortality of the disease estimated by WHO is 3.4% but varies from region to region depending upon several factors such as climate, travel history, sociability, etc. [4]. The data are based on confirmed reported cases. They are certainly underestimated because several reports indicated the low percentage of reporting in their respective territories due to several reasons. One of the much-anticipated reasons highlighted in the reports is the smaller number of diagnostics. The diagnosis of the disease earlier made by clinical symptoms (fever, cough flu, etc.), travel, and epidemiological history. If a person is diagnosed positive, this can be confirmed by Computed Tomography (CT) images or a positive pathogen test (as there is no symptoms of the disease and the possibility of an infected person without so-called symptoms) [5]. Although pathogen testing based on real-time RT-PCR is considered a scientific tool for disease diagnosis, the quality, stability and reproducibility of the method are still in question. The questionable quality of the kits and delay in test results are forcing scientists to look for other new tools to diagnose disease which produces rapid results that are at least as effective as the PCR test. Several alternative diagnostic tools based on artificial intelligence and machine learning have been proposed [6]. Early diagnosis of this disease and transfer of the patient to quarantine (specialized hospital) on time has proved beneficial for different countries. The process of diagnosing this disease is relatively fast, but the upfront cost diagnostic tests can be a disaster for the patient and for the state, especially in countries where there is no positive health system due to poverty [7].
In this study, we use Deep Learning J4 (DLJ4) classifier based on Deep Learning (DL). The DL is largely responsible for the current growth in the use of artificial intelligence (AI). Let us mention that DL is a combination of machine learning techniques and AI plays an important role in the medical field image classification tasks since its creation. The DL technique is pretty useful in mining, analyzing, and recognizing patterns especially from medical data, and resulting in beneficial clinical decision making [8]. Technically, the DL is a first-class of algorithms that’s is scalable and, due to the availability of high-tech computers, its performance keeps improving as you feed them more data. More precisely, the DL classifiers operate from multiple layers of artificial neural network (ANN) classifiers, each layer moves one simple representation of the data to the next layer. Also, most machine learning (ML) classifiers perform well on small datasets (with a hundred columns for instance). A digital image (un-structured) dataset has become a large number of feature vector spaces (FVS), so much so that the process becomes unusable [9]. A digital image size of (800
In this research, we propose a novel segmentation framework, called fuzzy c-mean automated region-growing segmentation (FARGS), for the diagnosis of COVID-19 using CT-Scan. Our methodology is based on the following elements:
• Firstly, we collect abnormal lung CT images divided into three classes (Normal, Pneumonia, and COVID-19) and transform them into an 8-bit grayscale image format.
• Secondly, at the preprocessing stage, gray level lungs CT-scan are divided into four equal parts. For this action a group of neighboring pixels are used for extracting a recognizable region of interest. Histogram stretch filter is employed to enhance the contrast. Note that, for a better visibility the gray level images are transformed in natural binary image format. At the postprocessing stage, we employ a novel segmentation approach called FARGS.
• After the segmentation process, statistical features are extracted from an abnormal region of CT images.
• Chi-square feature reduction technique is deployed for the optimize statistical features dataset.
• Finally, five machine learning classifiers are deployed on an optimized statistical feature dataset.
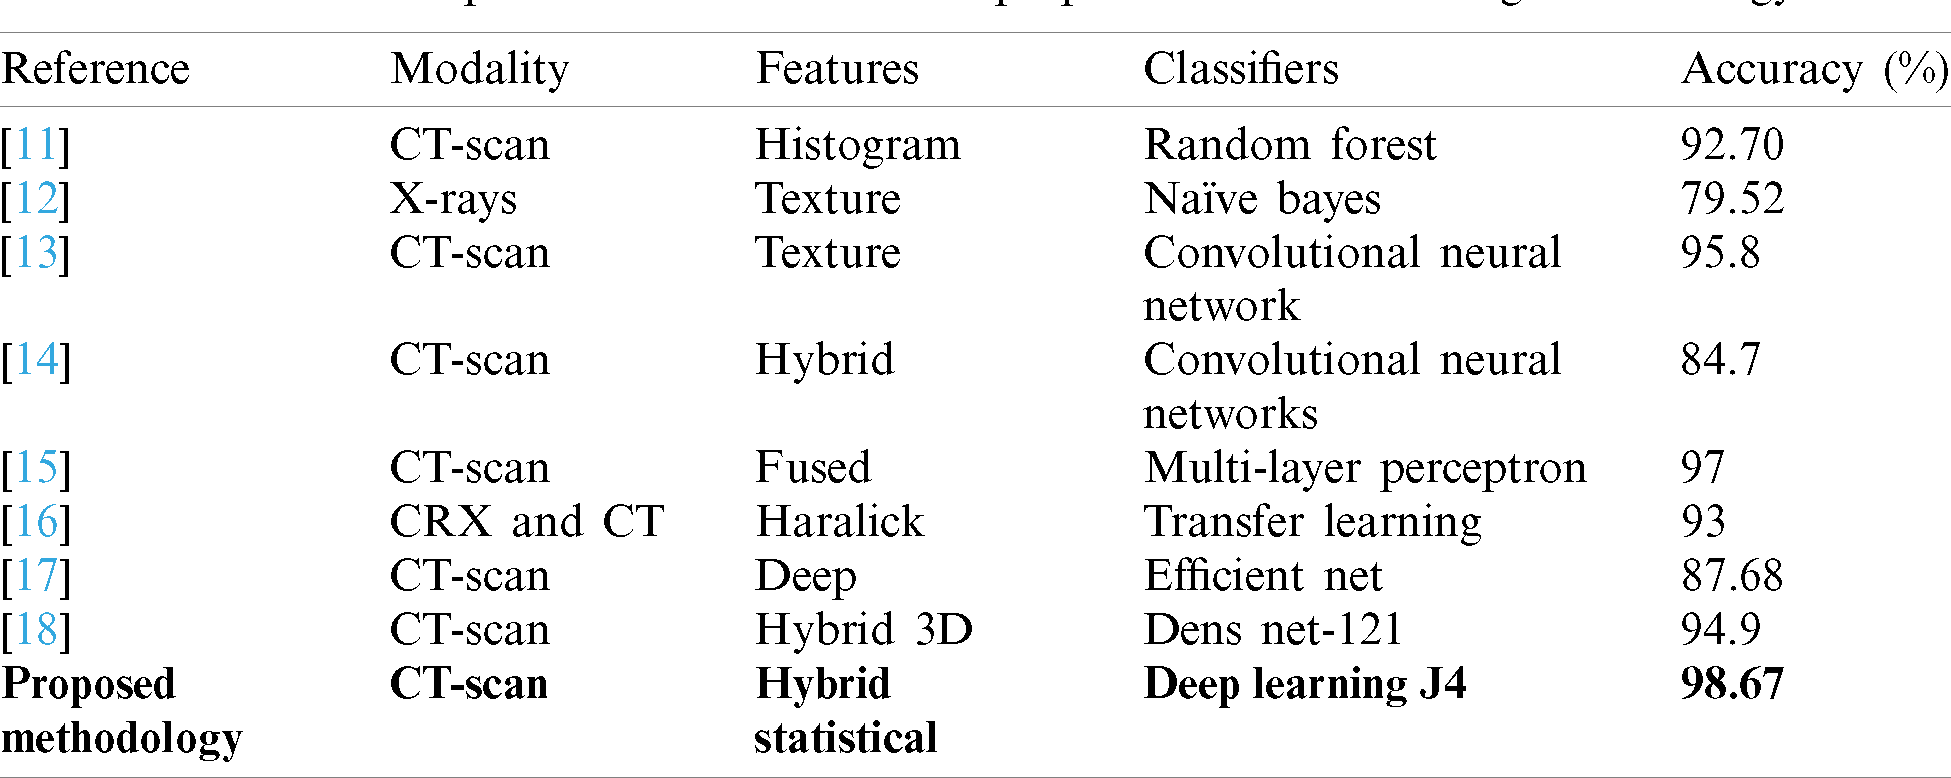
Much research is underway these days of diagnosis of COVID-19. Many researchers have tried to find out the best solution for the diagnosis of COVID-19 using version medical image modalities. The most popular methodologies are summarized in Tab. 1, as well as the one proposed in this study for preliminary comparison.
Table 1: A comparison table between the proposed with the existing methodology
This study considers a dataset that contains lung disorders divided into three classes (Normal, Pneumonia, and COVID-19) which are determined by using CT images as shown in Fig. 1 below.
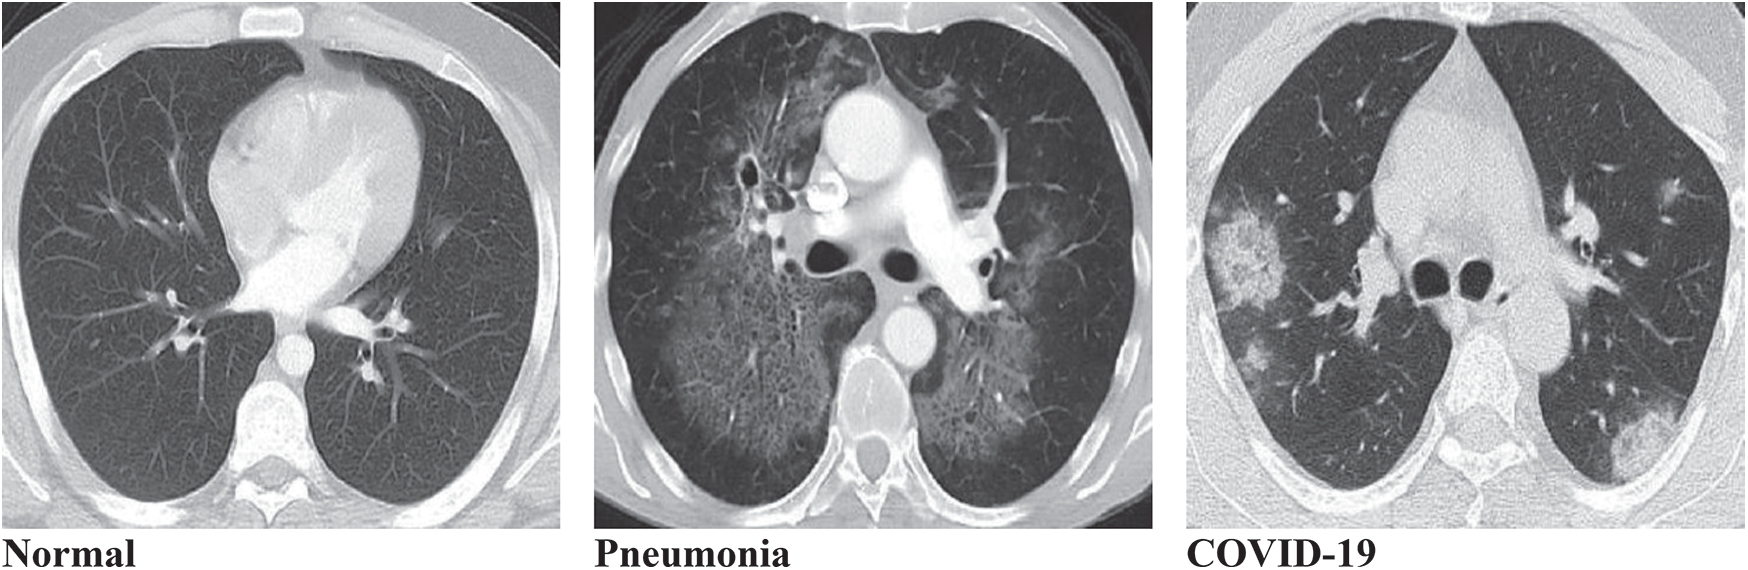
Figure 1: Typical three types of lungs CT image datasets. (a) Normal, (b) Pneumonia, (c) COVID-19
The patients prone to the epidemic were selected on the basis of the dataset. The CT images dataset is collected from two different sources, the first one is the Radiology Department of Nishtar Hospital Multan and Civil Hospital Bahawalpur, Pakistan, and the second one is a publicly free available medical imaging database known as Radiopaedia (https://radiopaedia.org/). For each class, 400 patients were selected to examine their lung disorder using CT images of size (620
In this section, we briefly discuss the proposed methodology. During the first step, all the image dataset is examined in a computer vision software library called OpenCV [19]. The second step is image preprocessing. Firstly, digital CT images are transformed into a grayscale 8-bit format. Secondly, we divide the image into four equal segments and extract the exact part of the lung for observation. Thirdly, histogram stretch is employed to normalize the non-uniformities. During the CT image data acquisition, speckle noise is detected due to the environmental conditions of the imaging sensor. To resolve this problem, grayscale images are transformed into a natural binary which improves contrast. The third step is segmentation, which will help to nominate the exact position and enhance the surface of the lesion. Mostly this process is time-consuming because it is based on the expert radiologist. To resolve this problem, a novel fuzzy c-mean automated region-growing segmentation (FARGS) is used on a preprocessed lung disorder CT image dataset. The fourth step is the hybrid statistical feature extraction. In this step, “texture” and “gray-level run-length matrix” (GLRLM) features are extracted from the CT image dataset. The fifth step is a hybrid statistical feature reduction. In it, we select twelve optimized hybrid statistical features from the total extracted features dataset using the chi-square feature reduction technique. The last step is classification, where five ML classifiers named as “Deep Learning J4” (DLJ4), “Random Forest” (RF), “Support Vector Machine” (SVM), “Multilayer Perceptron” (MLP), and “Naive Bayes” (NB) have been deployed on optimized hybrid statistical features dataset. They use 10-folds validation approach for the diagnosis of COVID-19 as shown in Fig. 2 below.
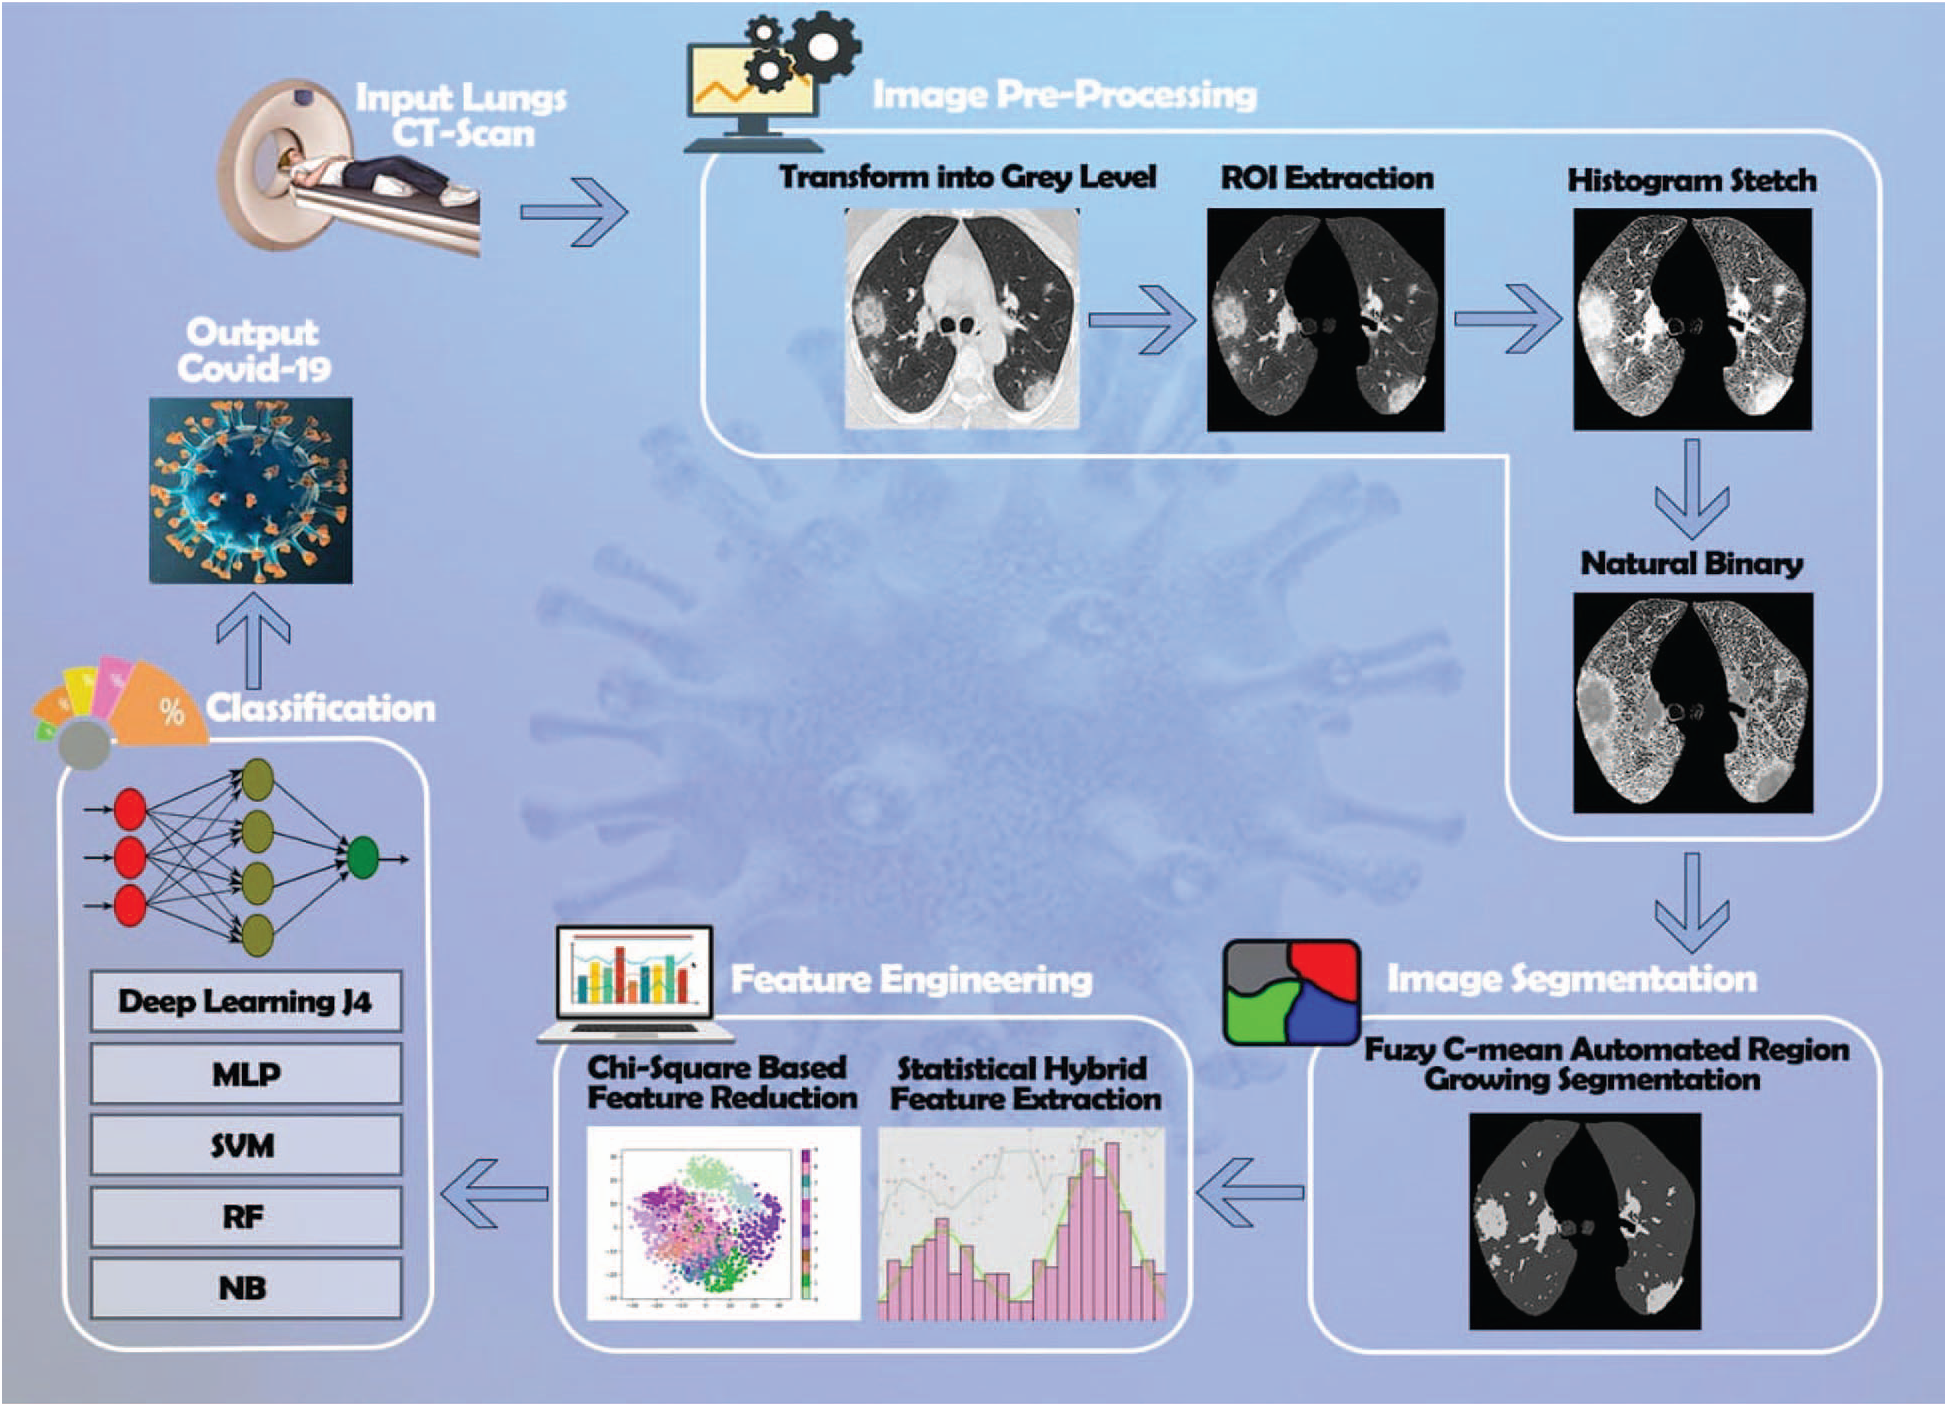
Figure 2: Lung CT-scan segmentation for the diagnosis of COVID-19
Now, let discuss the Lung CT-scan segmentation for the diagnosis of the COVID-19 proposed algorithm, with all the practical steps.
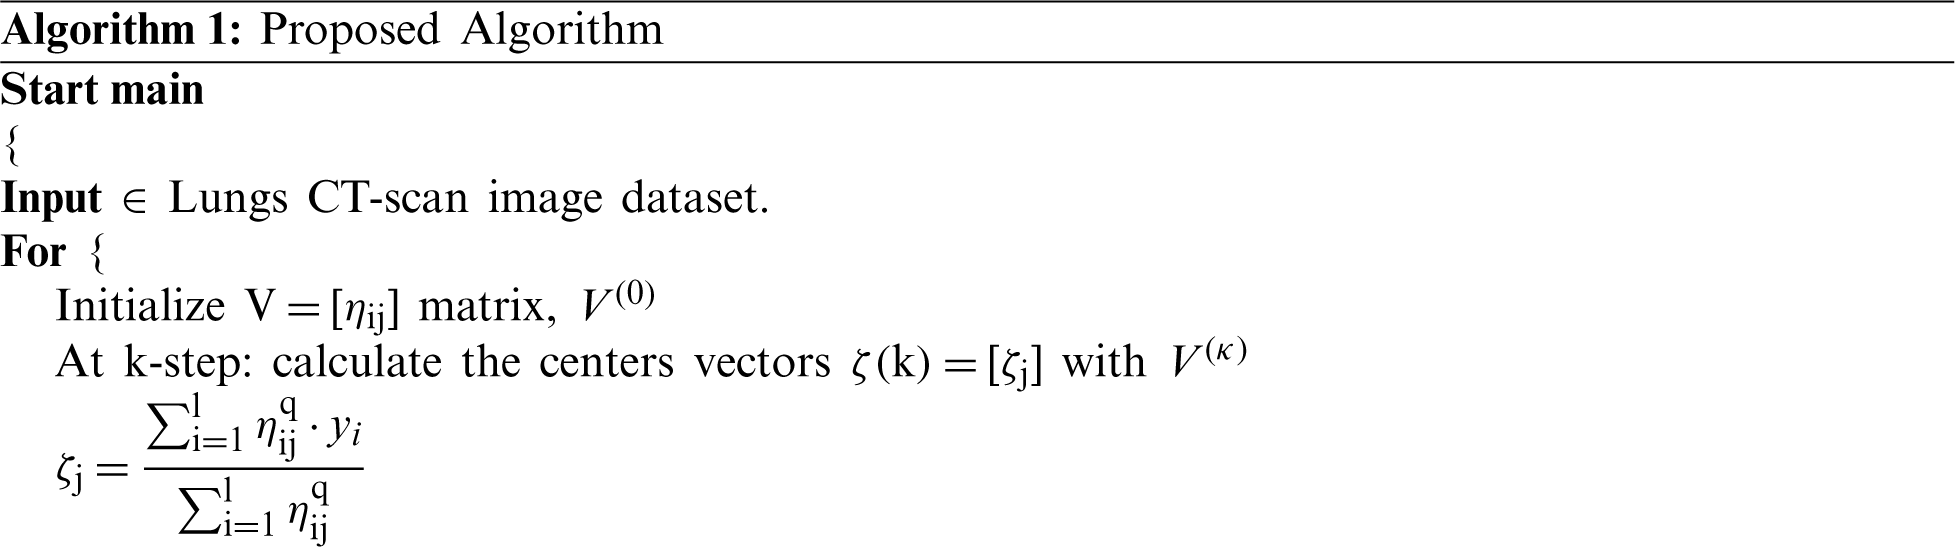
2.2 Fuzzy c-mean Automated Region-growing Segmentation (FARGS)
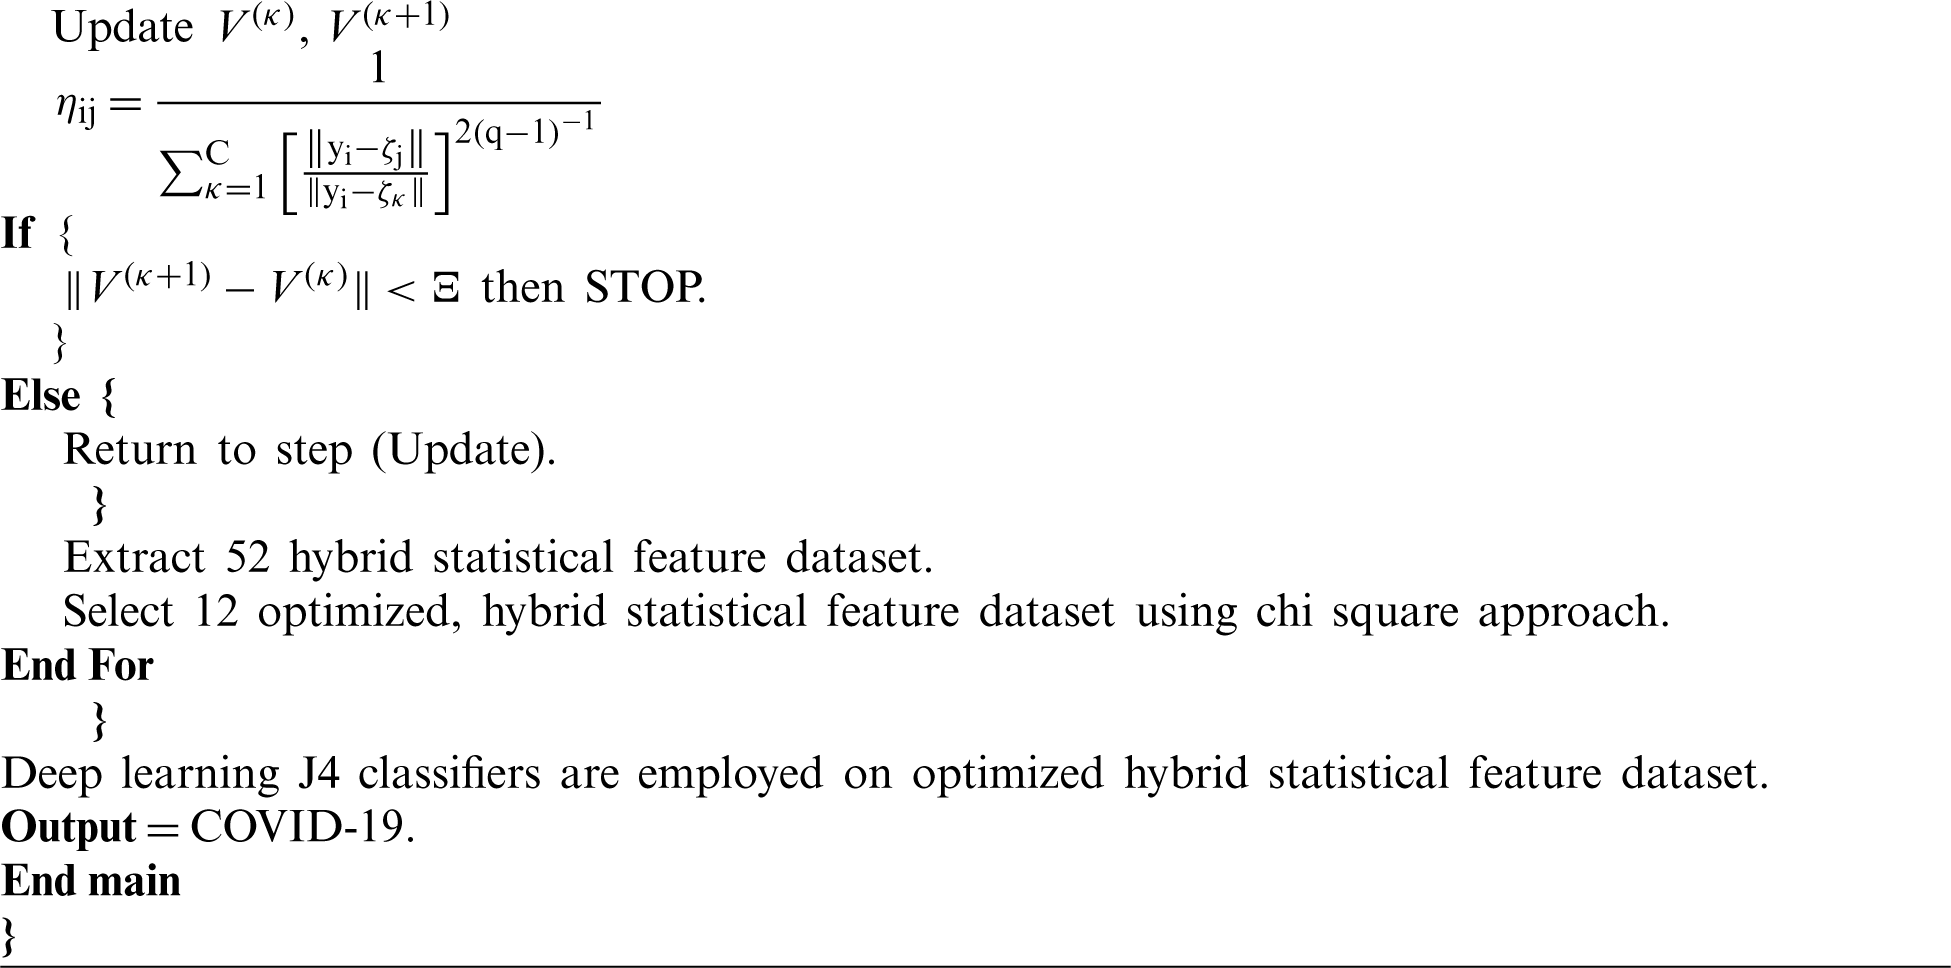
There are several approaches to image segmentation, mainly based on expert opinion that is a time-consuming process [20], while fuzzy c-mean automated region growing segmentation free from human-based expertise. At the preprocessing stage, gray level lungs CT-scan is divided into four equal parts, a group of neighboring pixels is utilized for extraction of a recognizable region of interest. Histogram Stretch filter is employed to enhance the contrast (better visibility gray level image is transformed in natural binary image format). Lastly, we use a fuzzy c-mean segmentation approach [21], which is mainly used for pattern classification. This segmentation approach divides data into two segments. It is based on the following objective function (OF):
where
Repetition stop if the following condition:
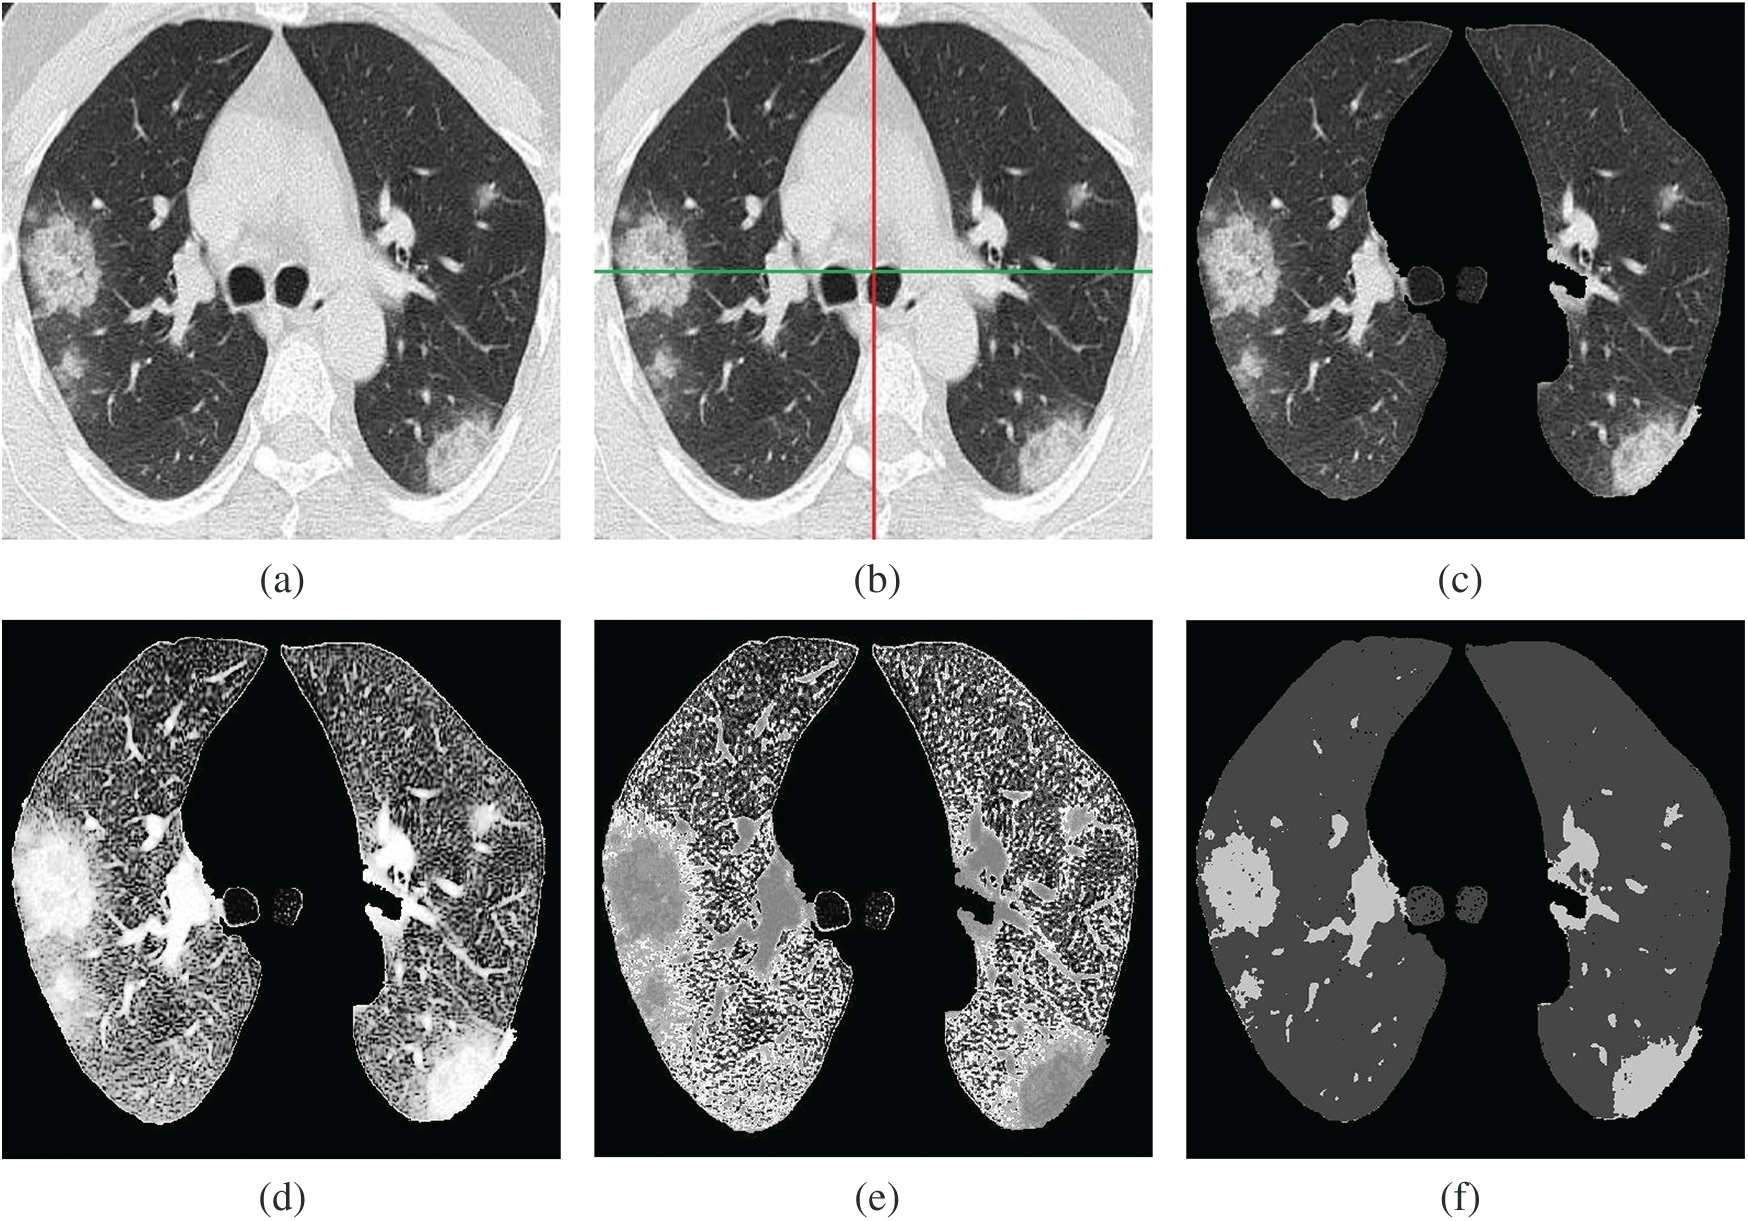
Figure 3: Fuzzy c-mean automated region-growing segmentation (FARGS) framework for COVID-19. (a) Lungs image (gray level), (b) Lungs image (segmented), (c) Lungs image (ROI extraction), (d) Lungs image (histogram stretch), (e) Lungs image (gray to natural binary), (f) Lungs image (fuzzy c-mean segmentation)
The OpenCV computer vision software library, is used for the hybrid statistical feature extraction process that holds texture and GLRLM features. These features are grouped as 5 textures and 8 GLRLM features including 4 dimensions (0, 45, 90, and 135 degrees), and a total of 52 (
The texture features are based on the GL co-occurrence matrix [22], which is calculated via 4 dimensions (0, 45, 90, 135) degrees and distance between seeds [23]. In this study, we use 5 average features known as energy (
where c and k are the spatial coordinates and
Also, the formula of the entropy is the following:
The IDE can be defined as
Finally, the inertia is obtained as
2.3.2 Gray Level Run-Length Matrix (GLRLM)
We now consider the gray-level run-length matrix (GLRM) [24], which can be defined as a section of gray also known as a range or length of run that is a linear multitude of continuous pixels with the same gray level in a particular direction. Let
Run length non-uniformity is defined in Eq. (10):
Run length non-uniformity normalized is defined in Eq. (11):
Run percentage is shown in Eq. (12):
Low gray level run emphasis can be described as
High gray level run emphasis is described in Eq. (14):
Grey level variance is given by
Finally, run length variance is presented in Eq. (16)
For feature reduction, the selected features have been replaced by a lower dimension. Instead of a low-dimensional feature, it retains the original data structure as much as possible [25]. The low-dimensional feature space also reduces the time and cost of execution, and the results obtained are almost comparable to the original feature space. Feature selection (FS) [26] is the process by which a large number of features are extracted. Its main objective is to select the most important features. Usually a large size data is needed to manage a large number of features, which is not an easy task. It is important to minimize the vector space dimension of this feature, which can effectively differentiate and classify different classes. These techniques have been implemented to achieve highly discriminant features. Finally, most of the discriminant features are used to achieve cost-effective classification accuracy. A common way to select a feature that is used in a statistical dataset is the chi-square feature reduction [27]. The mathematical foundation of the chi-square feature reduction is given by
where N is the observed frequency, E is the expected frequency, if the document contains the terms i and zero, then the value of
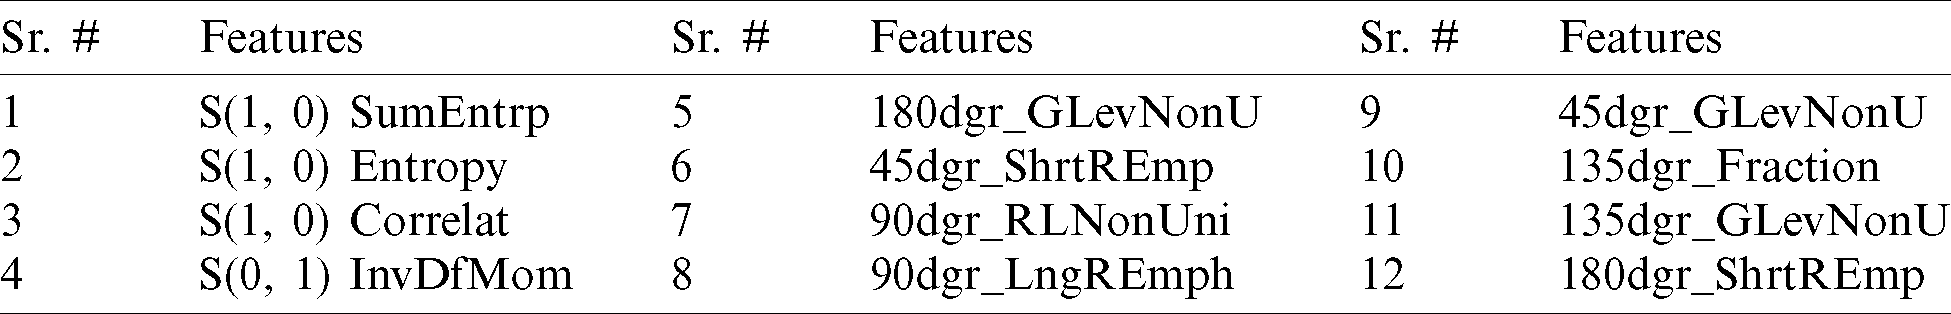
Table 2: The optimized hybrid statistical features
In this research, five ML classifiers, namely DLJ4, MLP, SVM, RF, and NB, are deployed on an optimize hybrid statistical features dataset utilizing 10-folds validation for the diagnosis of COVID-19. We observe that the DLJ4 classifier performs well compared to other implemented classifiers. We explain this performance due to the complexity of the data which is an aspect often treated well by DLJ4 in general. The mathematical foundation of DLJ4 classifier [28] is described below. The production of input weight and bias are summed using the summation function (
Here, c is the number of inputs, Jn is the input variable J,
The output of neuron j can be obtained as
The overall classification accuracy of lung disorders optimizes hybrid statistical features with deployed ML classifiers with other performance evaluating factors such as the “Kappa statistic” which is a metric in which the observed accuracy is compared with the prediction accuracy, “True positive” (TP), which is a result where the model accurately predicts a positive class, “False positive” (FP) which is a result where the model wrongly predicts a positive class, “Precision” which is associated with reproduction and repetition and is described as a degree that is measured repeatedly under unchanged conditions given in Eq. (21).
The “Recall” is the relevant examples that are parts of the total amount actually recovered, given by
The “F-measure” is premeditated based on the precision and recall, given in Eq. (23).
The “Receiver-operating characteristic” (ROC) is a graphical plot equal to the TP-rate and FP-rate of the rating due to different filtration thresholds. “Mean absolute error” (MAE) is a quantity used to measure the proximity of the predictions to the final result. “Root mean squared error” (RMSE) measures the pattern of deviations between the predicted values and the observed values. Lastly, the time complexity (T) is shown in Tab. 3.
Table 3: ML based diagnosis of COVID-19 accuracy table on optimize hybrid feature dataset
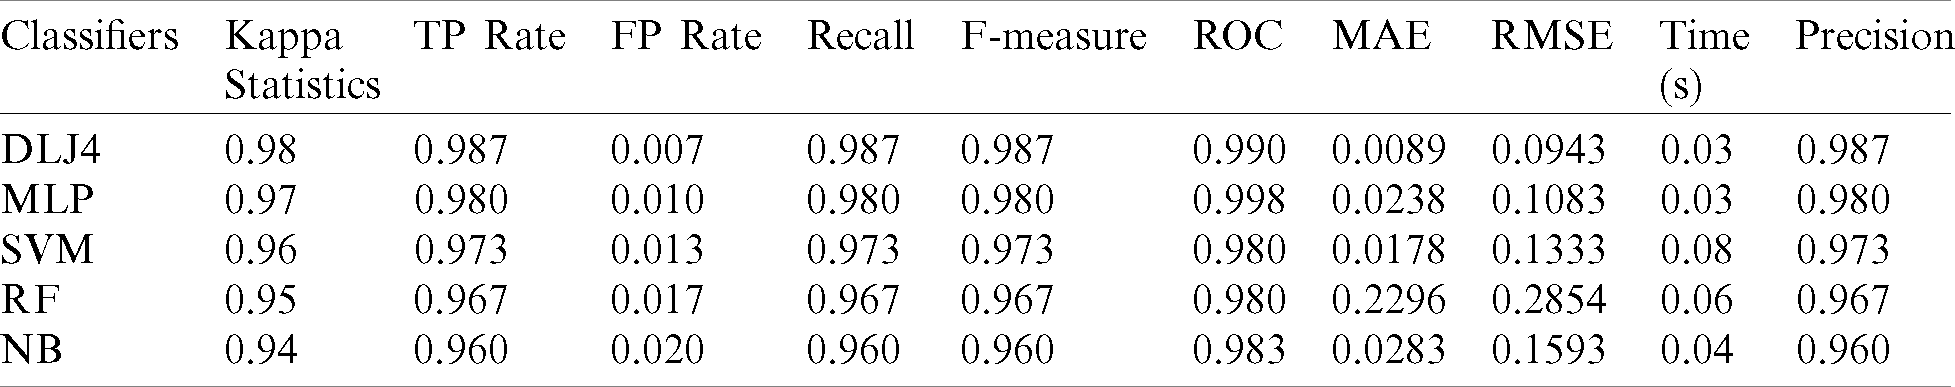
The ML-based diagnosis of COVID-19 accuracy of the considered classifiers, that is, DLJ4, MLP, SVM, RF, and NB, shows very high accuracy of 98.67%, 98.00%, 97.33%, 96.67%, and 96%, respectively, as indicated in Fig. 4 below.
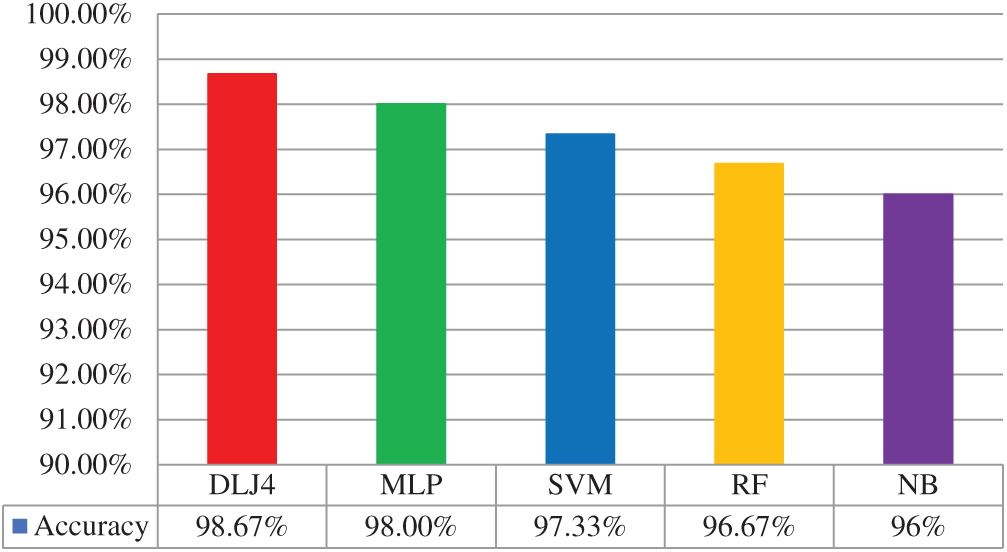
Figure 4: ML based diagnosis of COVID-19 accuracy graph
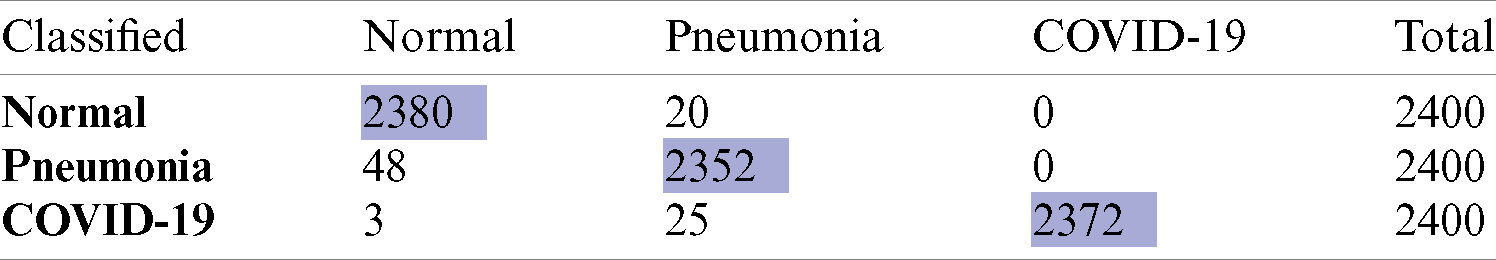
Correspondingly, the confusion matrix (CM) of the optimized statistical feature is shown in Tab. 4. The diagonal of the CM corresponds to the classification precision in the suitable classes, while other instances show them in other classes. This includes information, which is the actual and predictive data for the DLJ4 classifier. Hence, the DLJ4 classifier shown better overall accuracy than the implemented classifiers.
Table 4: Confusion matrix of ML based diagnosis of COVID-19 using DLJ4 classifier
The ML-based diagnosis of COVID-19 accuracy results, that is normal, pneumonia, and COVID-19 have 99.17%, 98%, and 98.83%, respectively, as shown in Fig. 5 below.
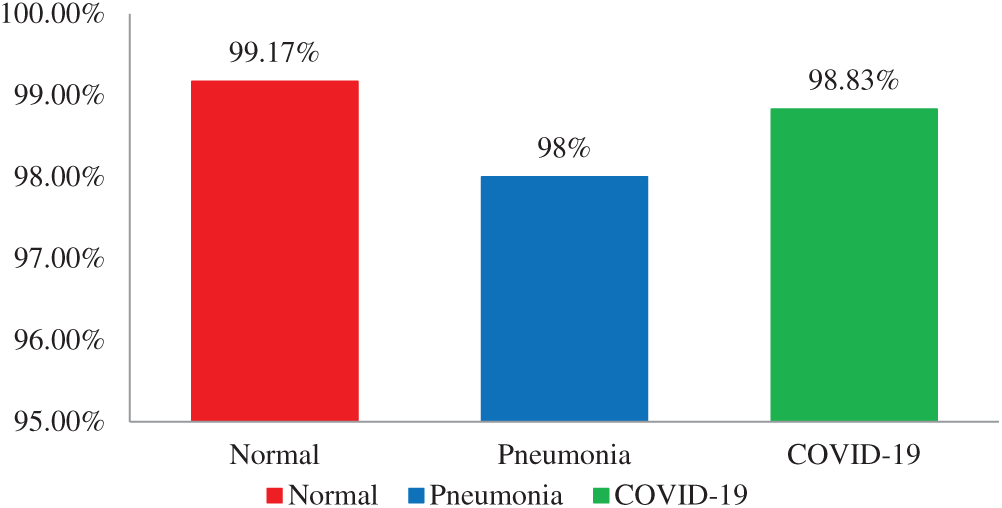
Figure 5: Accuracy graph of ML based diagnosis of COVID-19 using the DLJ4 classifier
4 Exponentiated transformed sine G Family
We now propose a complementary study providing a distributional approach to fit modern data sets such as those derived from the COVID-19. Recently, several generalized families (G) of continuous distributions have been proposed. They are based on the following principle: make more flexible a parent distribution by transforming the corresponding cumulative distribution function (CDF), involving one or more new parameters. Here, we define a new G family by the following CDF and probability density function (PDF), respectively:
4.1 Exponentiated Transformed Sine Exponential Distribution (ETSEx)
As parent functions, we take the CDF and PDF of the exponential distribution
where
4.2 Application of ETSEx Distribution on COVID-19 Datasets
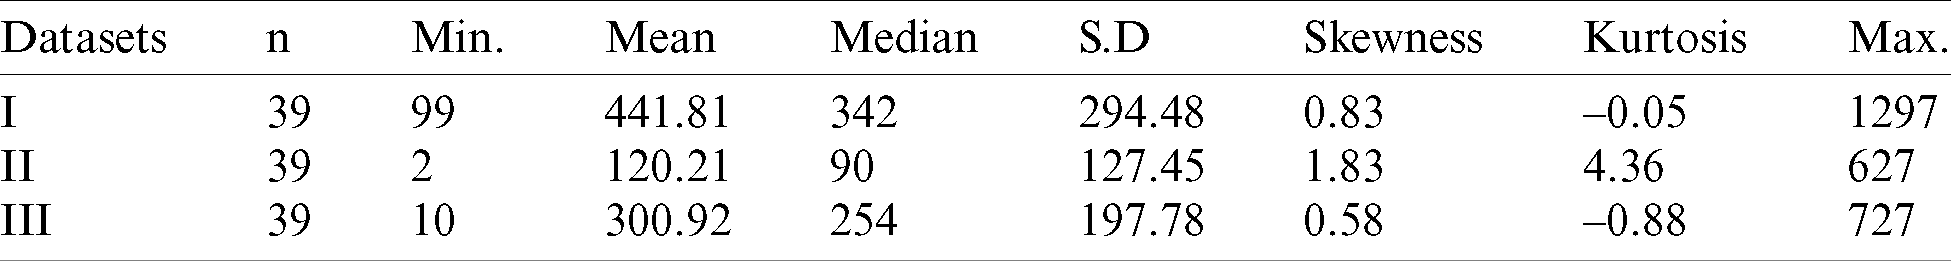
We now apply the ETSEx model to fit data COVID-19 confirm cases (I), recover (II), and non-recover (III) cases in Pakistan from 24 March 2020 to 01 May 2020. This period corresponds to the so-called “first wave.” We thus assume that the considered variable is continuous which is acceptable since a wide range of values are observed, and provide a new statistical model that can be useful for the following points: (i) Doing prediction for a pandemic with similar features and under similar conditions (comparable populations, comparable ecosystems…), (ii) Proposing an efficient model for fitting data of COVID-19 in other countries, (iii) Comparing the evolution of the COVID-19 disease in Pakistan with those in other countries. The dataset is obtained from the COVID-19: health advisory platform by the ministry of national health services regulations & coordination public database (http://covid.gov.pk/stats/pakistan). We compare the adjustment of the ETSEx model with the one of the standard exponentials (Ex) model [29]. As first analysis, descriptive statistics are given in Tab. 5 below.
Table 5: Descriptive statistics for COVID-19 datasets
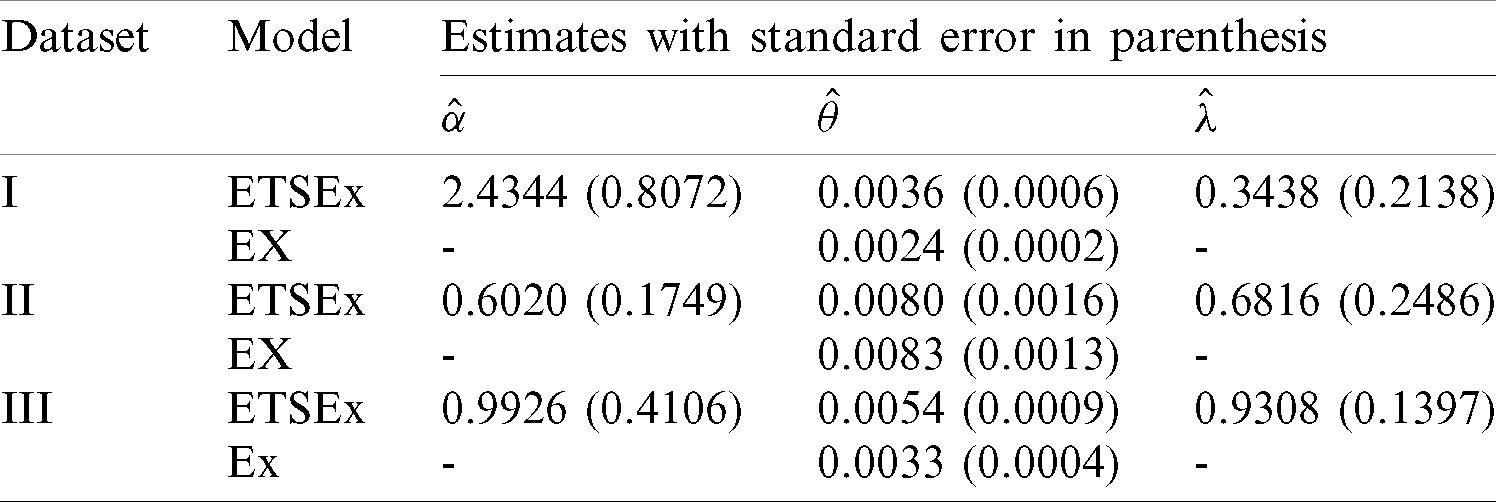
The model parameters are estimated via the maximum likelihood method (with the so-called BFGS algorithm) and the R software [30] is used for all the computations. The MLEs and the corresponding standard errors (SEs) for all the model parameters are given in Tab. 6 below.
Table 6: The MLEs for the COVID-19 dataset
Let us now compare the considered model. In this regard, we decide which is the best model by determining the values of the following statistical measures: minus complete log-likelihood function (
Table 7: Some statistics for the models fitted to COVID-19 dataset
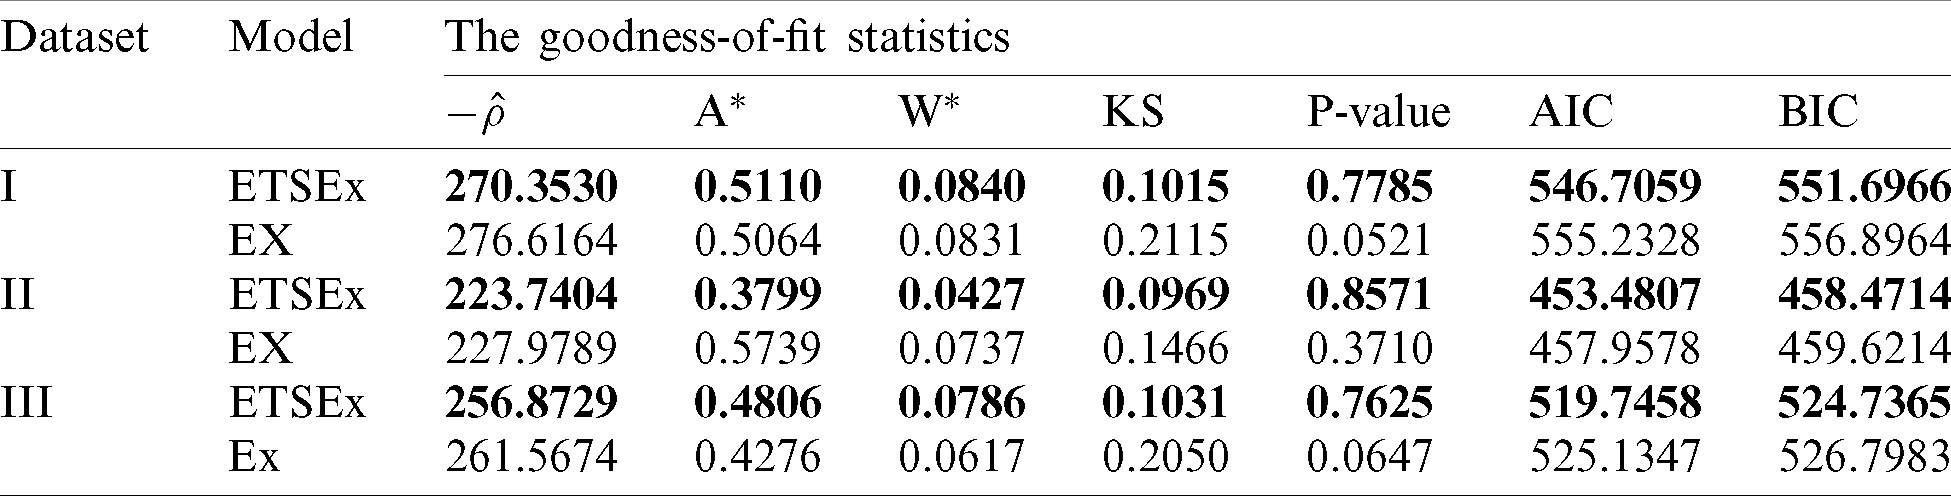
The results of Tab. 6 are clear: Having the smallest values of
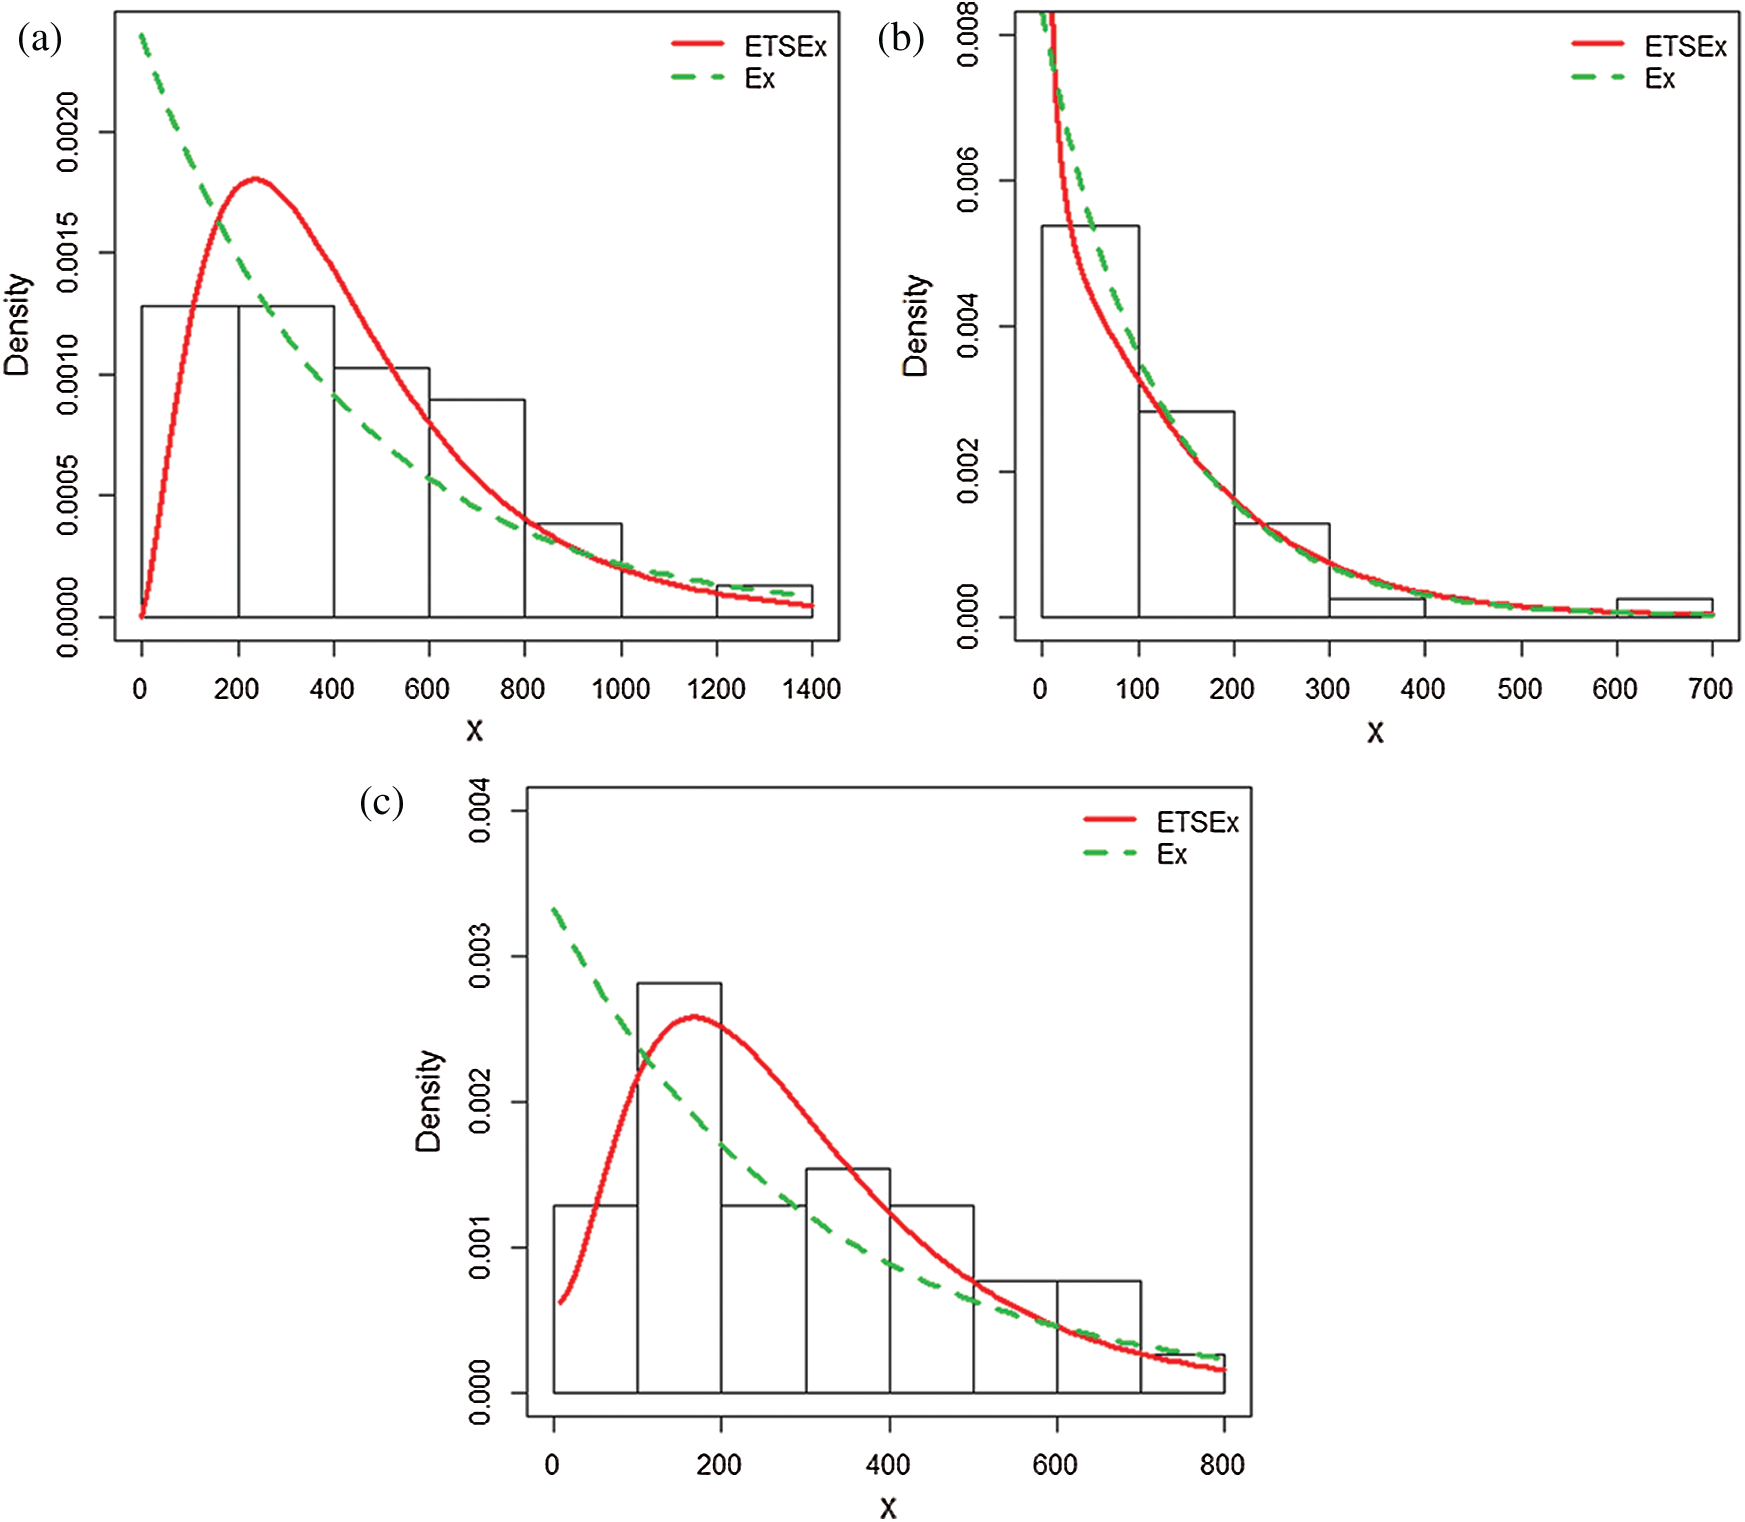
Figure 6: Estimated pdfs plots of the ETSEx and Ex distributions for (a) dataset I, (b) dataset II, (c) dataset III
The results of the fit are in favor of the ETSEx model. This motivates its use for similar analyzes in other countries, modestly hoping that pandemic specialists can take advantage of this model.
The main aim of this research is the automated segmentation of lung CT images for the diagnosis of COVID-19 using machine learning methods. For this purpose, we collect a CT image dataset of lung disorders and divide it into three classes (Normal, Pneumonia, and COVID-19). The CT images dataset is collected from two different sources. The first source is the Radiology Department of Nishtar Hospital Multan and Civil Hospital Bahawalpur, Pakistan. The second source is a publicly free available medical imaging database known as Radiopaedia. At a preprocessing stage, CT images are transformed into a grayscale 8-bit format, dividing the image into four equal segments and extracting the exact part of the lung for observation. For automated segmentation, a novel fuzzy c-mean automated region-growing segmentation (FARGS) is employed. After that, hybrid statistical features are extracted from the segmented region. The chi-square feature reduction technique is employed to optimize the dataset. Lastly, the considered ML classifiers, that is, DLJ4, MLP, SVM, RF, and NB, present a significantly very high accuracy of 98.67%, 98.00%, 97.33%, 96.67%, and 96%, respectively. It has been observed that DLJ4 shows very promising accuracy as compared to the other employed classifiers. The article ends with some contributions in statistical modeling on data of importance on the COVID-19, which can be of independent interest. This novel research aims to help the radiologist to the automated segmentation of lung CT images and early diagnosis of COVID-19.
Acknowledgement: The authors thank anonymous referees for careful reading of the manuscript and constructive comments, that significantly improved this paper. Aqib Ali and Samreen Naeem thank their supervisor, Dr. Salman Qadri, Assistant Professor, Department of Information Technology, The Islamia University of Bahawalpur, Pakistan for his support.
Funding Statement: The authors acknowledge the financial support provided by the Center of Excellence in Theoretical and Computational Science (TaCS-CoE), KMUTT. Moreover, this research project is supported by Thailand Science Research and Innovation (TSRI) Basic Research Fund: Fiscal year 2021, received by Dr. Poom Kumam, under project number 64A306000005, and sponsors URL: https://www.tsri.or.th/.
Conflicts of Interest: The authors declare that they have no conflicts of interest to report regarding the publication of this study.
1. N. Verma, D. Patel and A. Pandya. (2020). “Emerging diagnostic tools for detection of COVID-19 and perspective,” Biomedical Microdevices, vol. 22, no. 4, pp. 1–18. [Google Scholar]
2. M. Hosseiny, S. Kooraki, A. Gholamrezanezhad, S. Reddy and L. Myers. (2020). “Radiology perspective of coronavirus disease 2019 (COVID-19Lessons from severe acute respiratory syndrome and middle east respiratory syndrome,” American Journal of Roentgenology, vol. 214, no. 5, pp. 1078–1082. [Google Scholar]
3. P. P. Sarzi-Puttini, V. Giorgi, S. Sirotti, D. Marotto, S. Ardizzone et al. (2020). , “COVID-19, cytokines and immunosuppression: What can we learn from severe acute respiratory syndrome,” Clinical and Experimental Rheumatology, vol. 38, no. 2, pp. 337–342. [Google Scholar]
4. V. Surveillances. (2020). “The epidemiological characteristics of an outbreak of 2019 novel coronavirus diseases (COVID-19) China,” 2020 China CDC Weekly, vol. 2, no. 8, pp. 113–122. [Google Scholar]
5. C. R. Carpenter, P. A. Mudd, C. P. West, E. Wilber and S. T. Wilber. (2020). “Diagnosing COVID-19 in the emergency department: A scoping review of clinical examinations, laboratory tests, imaging accuracy, and biases,” Academic Emergency Medicine, vol. 27, no. 8, pp. 653–670. [Google Scholar]
6. J. Pang, M. X. Wang, I. Y. H. Ang, S. H. X. Tan, R. F. Lewis et al. (2020). , “Potential rapid diagnostics, vaccine and therapeutics for 2019 novel coronavirus (2019-nCoVA systematic review,” Journal of Clinical Medicine, vol. 9, no. 3, pp. 623–637. [Google Scholar]
7. N. Younes, D. W. Al-Sadeq, H. Al-Jighefee, S. Younes, O. Al-Jamal et al. (2020). , “Challenges in laboratory diagnosis of the novel coronavirus SARS-CoV-2,” Viruses, vol. 12, no. 6, pp. 582–594. [Google Scholar]
8. I. Tobore, J. Li, L. Yuhang, Y. A. Handarish, A. Kandwal et al. (2019). , “Deep learning intervention for health care challenges: Some biomedical domain considerations,” JMIR mHealth and uHealth, vol. 7, no. 8, pp. 11966–11971. [Google Scholar]
9. T. N. Ben and T. Hoefler. (2019). “Demystifying parallel and distributed deep learning: An in-depth concurrency analysis,” ACM Computing Surveys, vol. 52, no. 4, pp. 1–43. [Google Scholar]
10. X. Chen, J. Li, Y. Zhang, Y. Lu and S. Liu. (2020). “Automatic feature extraction in x-ray image based on deep learning approach for determination of bone age,” Future Generation Computer Systems, vol. 110, no. 1, pp. 795–801. [Google Scholar]
11. W. Cai, T. Liu, X. Xue, G. Luo, X. Wang et al. (2020). , “CT quantification and machine-learning models for assessment of disease severity and prognosis of COVID-19 patients,” Academic radiology, vol. 27, no. 12, pp. 1665–1678. [Google Scholar]
12. L. Hussain, T. Nguyen, H. Li, A. A. Abbasi, K. J. Lone et al. (2020). , “Machine-learning classification of texture features of portable chest X-ray accurately classifies COVID-19 lung infection,” BioMedical Engineering Online, vol. 19, no. 1, pp. 1–18. [Google Scholar]
13. H. Yasar and M. Ceylan. (2020). “A novel comparative study for detection of COVID-19 on CT lung images using texture analysis, machine learning, and deep learning methods,” Multimedia Tools and Applications, vol. 79, no. 39, pp. 1–25. [Google Scholar]
14. T. D. Pham. (2020). “A comprehensive study on classification of COVID-19 on computed tomography with pretrained convolutional neural networks,” Scientific Reports, vol. 10, no. 1, pp. 1–8. [Google Scholar]
15. A. Amyar, R. Modzelewski, H. Li and S. Ruan. (2020). “Multi-task deep learning-based CT imaging analysis for COVID-19 pneumonia: Classification and segmentation,” Computers in Biology and Medicine, vol. 126, no. 6, pp. 104037–104052. [Google Scholar]
16. V. Perumal, V. Narayanan and S. J. S. Rajasekar. (2020). “Detection of COVID-19 using CXR and CT images using transfer learning and haralick features,” Applied Intelligence, vol. 50, no. 8, pp. 1–18. [Google Scholar]
17. P. Silva, E. Luz, G. Silva, G. Moreira, R. Silva et al. (2020). , “COVID-19 detection in CT images with deep learning: A voting-based scheme and cross-datasets analysis,” Informatics in Medicine Unlocked, vol. 20, no. 3, pp. 100427–100450. [Google Scholar]
18. S. A. Harmon, T. H. Sanford, S. Xu, E. B. Turkbey, H. Roth et al. (2020). , “Artificial intelligence for the detection of COVID-19 pneumonia on chest CT using multinational datasets,” Nature communications, vol. 11, no. 1, pp. 1–7. [Google Scholar]
19. G. Bradski and A. Kaehler. (2008). “Learning OpenCV: Computer vision with the OpenCV library, O’Reilly Media, Inc.,” . [Online]. Available: https://www.oreilly.com/library/view/learning-opencv/9780596516130/. [Google Scholar]
20. S. Naeem, A. Ali, S. Qadri, W. K. Mashwani, N. Tairan et al. (2020). , “Machine-learning based hybrid-feature analysis for liver cancer classification using fused (MR and CT) images,” Applied Sciences, vol. 10, no. 9, pp. 3134–3160. [Google Scholar]
21. A. Ali, S. Qadri, W. K. Mashwani, W. Kumam, P. Kumam et al. (2020). , “Machine learning based automated segmentation and hybrid feature analysis for diabetic retinopathy classification using fundus image,” Entropy, vol. 22, no. 5, pp. 567–592. [Google Scholar]
22. R. M. Haralick, K. Shanmugam and I. H. Dinstein. (1973). “Textural features for image classification,” IEEE Transactions on Systems, Man, and Cybernetics, vol. 6, no. 1, pp. 610–621. [Google Scholar]
23. A. Ali, J. A. Nasir, M. M. Ahmed, S. Naeem, S. Anam et al. (2020). , “Machine learning based statistical analysis of emotion recognition using facial expression,” RADS Journal of Biological Research & Applied Sciences, vol. 11, no. 1, pp. 39–46. [Google Scholar]
24. M. M. Galloway. (1975). “Texture analysis using gray level run lengths,” Computer Graphics Image Process, vol. 4, no. 1, pp. 172–179. [Google Scholar]
25. R. A. Bantan, A. Ali, S. Naeem, F. Jamal, M. Elgarhy et al. (2020). , “Discrimination of sunflower seeds using multispectral and texture dataset in combination with region selection and supervised classification methods,” Chaos: An Interdisciplinary Journal of Nonlinear Science, vol. 30, no. 11, pp. 113142–113161. [Google Scholar]
26. B. Mwangi, T. S. Tian and J. C. Soares. (2014). “A review of feature reduction techniques in neuroimaging,” Neuroinformatics, vol. 12, no. 2, pp. 229–244. [Google Scholar]
27. S. D. Bolboacă, L. Jäntschi, A. F. Sestraş, R. E. Sestraş and D. C. Pamfil. (2011). “Pearson fisher chi-square statistic revisited,” Information-an International Interdisciplinary Journal, vol. 2, no. 3, pp. 528–545. [Google Scholar]
28. S. Lang, F. B. Marquez, C. Beckham, M. Hall and E. Frank. (2019). “WekaDeeplearning4j: A deep learning package for weka based on DeepLearning4j,” Knowledge-Based Systems, vol. 178, no. 6, pp. 48–50. [Google Scholar]
29. J. Eghwerido, S. Zelibe and E. E. Eyefia. (2020). “Gompertz-alpha power iverted exponential distribution: Properties and applications,” Thailand Statistician, vol. 18, no. 3, pp. 319–332. [Google Scholar]
30. J. Chambers. (2008). “Software for data analysis: Programming with R, Springer Science and Business Media,” . [Online]. Available: https://www.springer.com/gp/book/9780387759357. [Google Scholar]
 | This work is licensed under a Creative Commons Attribution 4.0 International License, which permits unrestricted use, distribution, and reproduction in any medium, provided the original work is properly cited. |