DOI:10.32604/cmc.2021.015989
| Computers, Materials & Continua DOI:10.32604/cmc.2021.015989 | |
| Article |
Detecting Driver Distraction Using Deep-Learning Approach
1College of Computer and Information Sciences, Al-Imam Muhammad Ibn Saud Islamic University, Riyadh, 11564, Saudi Arabia
2College of Computer and Information Science, King Saud University, Riyadh, 11442, Saudi Arabia
*Corresponding Author: Mohammed Zakariah. Email: mzakariah@ksu.edu.sa
Received: 17 December 2020; Accepted: 02 February 2021
Abstract: Currently, distracted driving is among the most important causes of traffic accidents. Consequently, intelligent vehicle driving systems have become increasingly important. Recently, interest in driver-assistance systems that detect driver actions and help them drive safely has increased. In these studies, although some distinct data types, such as the physical conditions of the driver, audio and visual features, and vehicle information, are used, the primary data source is images of the driver that include the face, arms, and hands taken with a camera inside the car. In this study, an architecture based on a convolution neural network (CNN) is proposed to classify and detect driver distraction. An efficient CNN with high accuracy is implemented, and to implement intense convolutional networks for large-scale image recognition, a new architecture was proposed based on the available Visual Geometry Group (VGG-16) architecture. The proposed architecture was evaluated using the StateFarm dataset for driver-distraction detection. This dataset is publicly available on Kaggle and is frequently used for this type of research. The proposed architecture achieved 96.95% accuracy.
Keywords: Deep learning; driver-distraction detection; convolution neural networks; VGG-16
According to the World Health Organization (WHO) [1], every year approximately 1.35 million people die due to traffic accidents. On average, globally, approximately 3,700 people die every day due to road accidents. A heartbreaking statistic in this report is that injuries caused by road accidents lead to the death of young people between 5 and 29 years of age [1]. As per the WHO report, the total number of mortalities increases each year, and the most common cause is vehicle driver distraction. In Saudi Arabia, a report by the Department of Statistics of King Abdul-Aziz City for Science and Technology (KACST) indicated that, in 2003, approximately 4,293 people were killed and more than 30,439 were injured due to traffic accidents [2]. The use of mobile phones is becoming common, and young people in particular talk on their mobile phones while driving. Using a mobile phone while driving increases the possibility of accidents leading to death. The KACST report indicates that mobile-phone usage during driving would increase the risk of being in an accident by a factor of 4. In addition, texting while driving is approximately 23 times riskier than talking on a mobile phone. Driver reaction time is significantly reduced when talking on a mobile phone while driving; the KACST report states that reaction time is reduced by approximately 50%, and further indicates that, for years, distracted driving has been considered one of the main causes of car accidents [3].
Apart from loss of life, other issues, such as property damage, are associated with traffic accidents, and such damage is attributed to distracted drivers. According to American National Highway Traffic Safety Administration, approximately 20% of traffic accidents in the United States are due to driver distraction, and 90% of accidents are caused by human error [4]. Driver error is considered the major reason for the increasing number of accidents [5]. For example, in 2015, approximately 3,477 people died and nearly 391,000 people were injured in traffic accidents because of distracted drivers [6]. Drivers are distracted for various reasons, including talking on a mobile phone, changing the radio station, eating, drinking, and talking to fellow passengers. Therefore, to reduce the number of accidents, these actions should be monitored and checked [7,8]. A considerable number of studies have been conducted to investigate these problems. For example, mobile-phone usage has been detected using acoustic or cell-phone sensing techniques to locate the phone. Another technique involves monitoring and tracking a driver’s gaze movement [9,10]. Driver distraction is detected by capturing images using a camera placed in front of the driver or inside the car. The captured images are transmitted for classification to detect driver actions. As noted above, drivers are distracted in many ways. The common distractions are eating and drinking while driving [11], communicating with fellow passengers [12–14], using in-vehicle electronic devices [15,16], observing roadside digital billboards/advertisings/logo signs [17], and using a mobile phone to call or text. An effective way to address distracted driving is by developing a system that can monitor the distractions. These techniques adapt the in-vehicle information-system functionalities according to the driver’s state. In these systems, correctly identifying the driver’s state is very important.
In this study, the focus is on identifying the driver’s state. In the future, this technology could be applied in smart cities to detect driver distraction automatically and then send a warning message to the driver to prevent accidents. This technique can allow law-enforcement authorities to identify a distracted driver and monitor them using radar and cameras. Once detected, these drivers can be penalized. Moreover, recently developed semi-autonomous commercial cars require drivers to pay attention to road and traffic conditions [18]. Autonomous steering-control [19] systems require drivers to be ready to take control of the wheel [18]. Thus, distracted-driver detection is an important system component in these cars. Distraction detection can also be used to enable advanced driver-assistance system features [20], such as collision-avoidance systems that plan evasive maneuvers [21]. To reduce vehicle accidents and improve transportation safety, a system that can classify distracted driving is highly desirable and has attracted much research interest. In this study, a deep-learning technique is applied, which is part of the machine-learning methods based on artificial intelligence. Deep learning is applied in many fields, e.g., computer vision, speech recognition, natural language processing, and audio recognition. In this work, experimental work was conducted on driver images to detect if the drivers are distracted while driving. As discussed above, the consequences of distracted driving can be grave. Driver distraction is classified into nine different classes based on driver actions while driving. In this study, the StateFarm dataset is used, and the convolution-neural-network (CNN) technique is applied to learn the machine and further classify the real image.
The rest of this article is organized as follows. In Section 2, work related to driver-distraction detection is reviewed, and, in Section 3, the dataset used in this study is described. In Section 4, the overall methodology of distraction detection is explained. The experimental setup is described in Section 5 and experimental results presented in Section 6. Finally, conclusions are presented in Section 7 and future scope detailed in Section 8.
The authors of [22] developed a support vector machine-based (SVM-based) model to detect the use of a mobile phone while driving. The dataset used in this work consists of frontal images of the driver’s face. The pictures used to develop the model showed both hands and face with a pre-made assumption and were focused on two driver actions, i.e., a driver with a phone and one without a phone. A SVM classifier was applied to detect the driver actions and frontal images of the drivers were used. In a similar study [23], SVM classification was used to detect the use of a mobile phone while driving. The dataset used in this study was collected using transportation imaging cameras placed on highways and traffic lights. The authors of another study [24] did some extraordinary work by sitting on a chair and mimicking a certain type of distraction (e.g., talking on a mobile phone). In this work, the AdaBoost classifier was applied along with hidden Markov models to classify Kinect RGB-D data. However, this study had two limitations, i.e., the effect of lighting and the distance between the Kinect device and the driver. In real-time applications, the effect of light is very important, and this should be taken into consideration for efficient results. The authors of [25] suggest using a hidden conditional random-fields model to detect mobile-phone usage. The database was created using a camera mounted above the dashboard and the hidden conditional random-fields model used to detect cell-phone usage. The model considers the face, mouth, and hand features of images obtained from a camera mounted above the dashboard. In another study related to phone usage [26], a faster Region Based Convolutional Neural Networks (R-CNN) model was designed. In that study, both the use of a phone by the driver and hands on the wheel were detected. Here, the main contribution was the segmentation of hand and face images. The dataset used to train the faster R-CNN was the same as that used in [27], in which a novel methodology called multi-scale faster R-CNN was proposed. With this methodology, higher accuracy with low processing time was obtained. In [27], the authors created a dataset for hand detection in an automotive environment and achieved an average precision of 70.09% using the aggregate channel features object detector. Another study [28] discusses the detection of cell-phone usage by a driver. In that work, the authors applied a histogram of gradients (HOGs) and AdaBoost classifiers. Initially, the supervised descent method is applied to locate the landmarks on the face, followed by extraction of bounding boxes from the left-hand side of the face to the right-hand side. A classifier was applied to train these two regions to detect the face, followed by left- and right-hand detection. Finally, after applying segmentation and training, 93.9% accuracy at 7.5 frames per second was obtained. Motivated by the same, several researchers worked on cell-phone usage detection while driving. In [29], the authors designed a more inclusive distracted-driving dataset with a side view of the driver considering four activities: Safe driving, operating the shift lever, eating, and talking on a cell phone. The authors achieved 90.5% accuracy using the contourlet transform and random forest. The authors also proposed a system using a pyramid of histogram of gradients (PHOG) and multilayer perceptron that yields an accuracy of 94.75% [30] and Faster R-CNN [31]. Also investigated in [32] was action detection using three actions, i.e., hands on the wheel, interaction with the gears, and interaction with the radio; an attempt was then made to classify these actions. Separate cameras were fixed to capture face and hand actions. A SVM classier was applied to determine the driver’s actions; 90% and 94% accuracy were achieved for hand actions and face and hand-related information, respectively. In another study [33], the Southeast University dataset was used. In this study, the authors focused on hands on the wheel, usage of a phone, eating, and operating the shift lever. The dataset consists of labels for each image for these four driver actions. The authors applied various classifiers and obtained 99% accuracy for the CNN classifier [33]. Another study [34] focused on the following seven actions: Checking the left-hand mirror, checking the right-hand mirror, checking the rear mirror, handling in-hand radio devices, using the phone (receiving calls and texting), and normal driving. In a pre-processing step, the author cropped the driver’s body from the image, removed the background information, and applied the Gaussian mixture model; after pre-processing the data, CNN classification was applied to classify these actions. Using AlexNet [35], 91% accuracy was achieved for predicting driver distraction. In other studies, [36,37], segmentation was performed to extract the drivers’ actions by applying Speeded Up Robust Features (SURF) [36] key points. After pre-processing, HOG features were extracted and K-NN classification applied. A recognition rate of approximately 70% was achieved. In [37], a similar methodology was applied. However, in that study, two different CNN models were applied to classify the actions. In the first model, triplet loss was applied to increase the overall accuracy of the classification model. By doing this, the authors achieved a 98% accuracy rate. They used 10 actions and the StateFarm dataset [38], which comprises labeled images, for distraction detection. Here, the detected actions included safe driving, texting using the right hand, talking on the phone using the right hand, texting using the left hand, talking on the phone using the left hand, changing the radio station, drinking, talking to the passenger sitting behind the driver, checking hair and makeup, and talking to the passenger sitting beside the driver. In [39,40], the American University in Cairo (AUC) dataset was used to detect distraction. This dataset is similar to the StateFarm dataset. In [39], training was done using five different types of CNNs. After applying the CNN, the experimental results were weighted by implementing a genetic algorithm to further classify the actions. In another work conducted by the authors of [40], a modified CNN was applied, followed by numerous regularization techniques. These techniques helped reduce the overfitting problem. The accuracy achieved by that work was 96% for driver distraction. A deep-learning technique was applied in [41] using the AUC and StateFarm datasets in which the video version of the dataset was worked on. The authors proposed a deep neural network approach called multi-stream long short-term memory (LSTM) (M-LSTM). The features used in this work were from [42], with contextual information, which was retrieved from another pertaining CNN; 52.22% and 91.25% accuracy were achieved on the AUC and the StateFarm distracted-driver datasets, respectively. In [43], a deep-convolution-network technique was applied for the recognition of large-scale images. Similar work for the recognition of face was implemented in [44] in three dimensions by applying feature-extraction techniques and classification methodologies. Another recognition technique [45] has been applied for palmprints by applying a robust two-dimensional Cochlear transformation technique.
The StateFarm distraction-detection dataset was used in the present study. It was published on Kaggle [38] for a competition. This dataset is the most commonly used dataset for the detection of driver distraction and has been applied in many studies. The StateFarm dataset includes nine classes, and each image is classified among these classes. The categories include the following driver actions: Driving safely, texting with the right hand, talking on the phone with the right hand, texting with the left hand, talking on the phone with the left hand, operating the radio, reaching behind, dressing the hair and makeup activities, and talking to passengers, as shown in Fig. 1 and discussed in [46]. There are approximately 2,200 RGB images for each class and each image’s resolution is
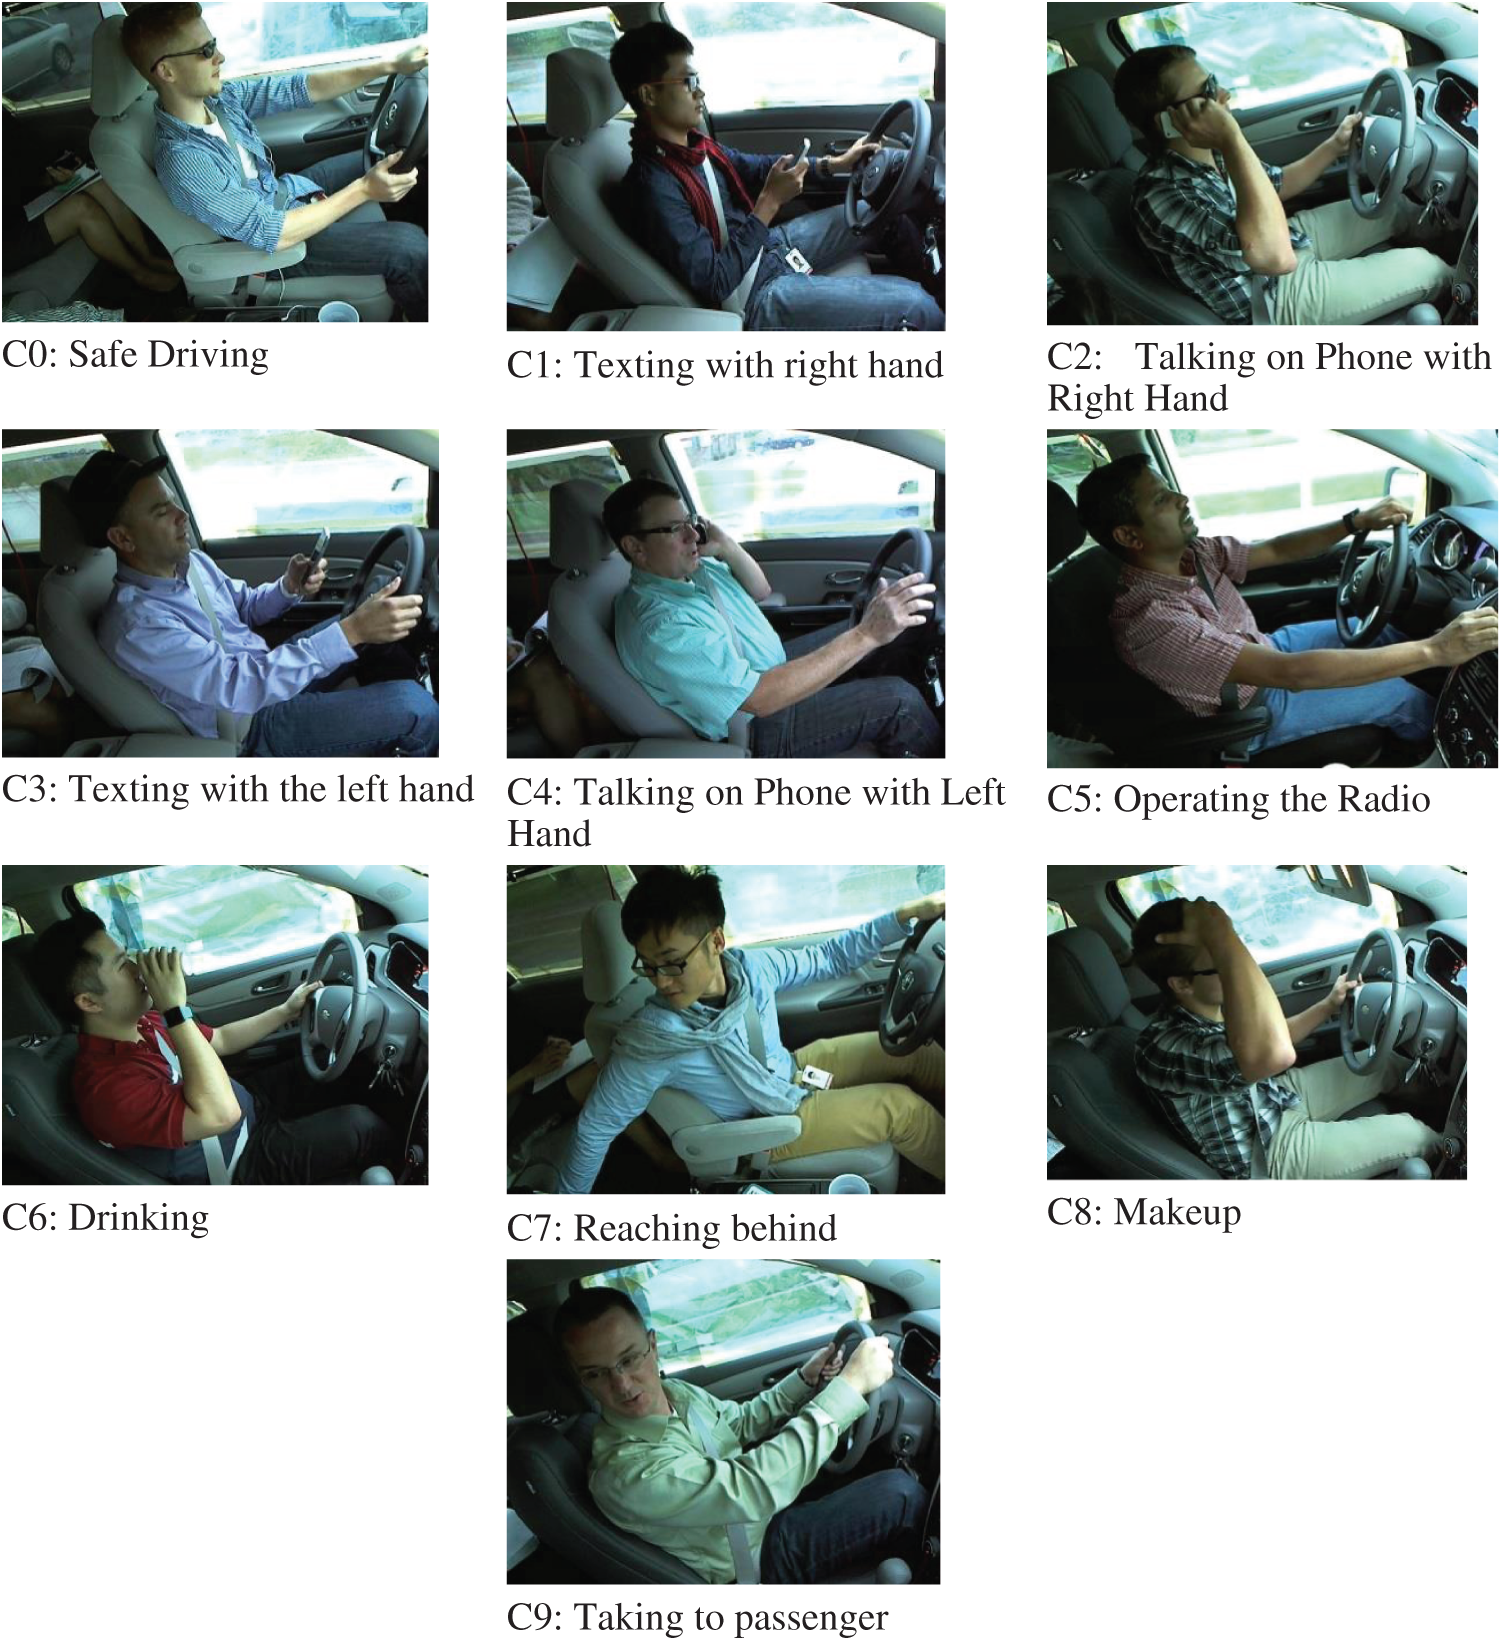
Figure 1: Sample images representing different actions in the StateFarm dataset
Table 1: Dataset details with the number of images per class
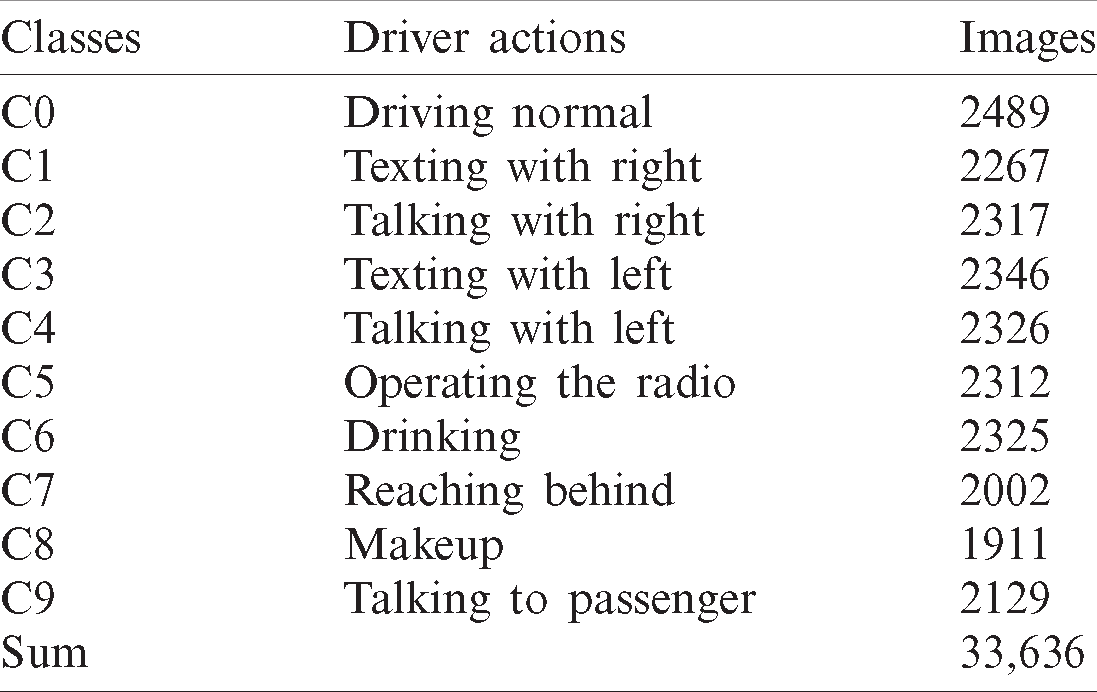
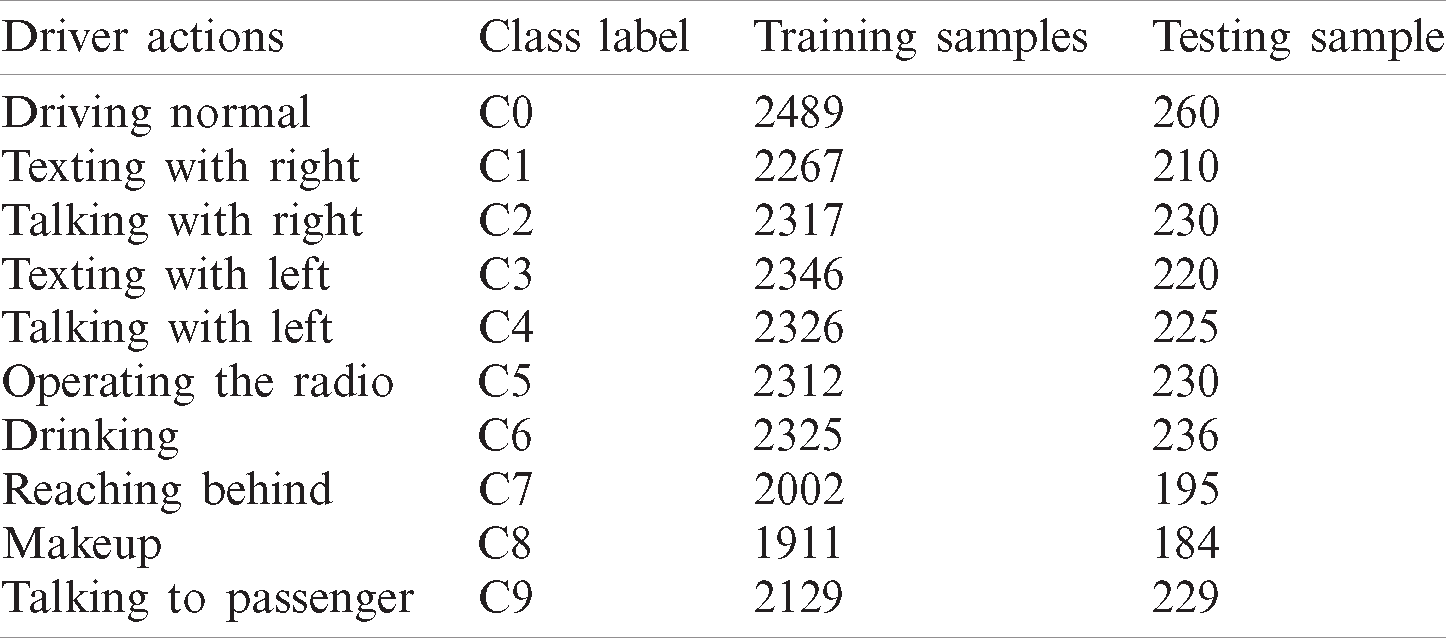
Table 2: Distribution of images into training and testing samples
A deep CNN is a type of artificial neural network. Deep CNNs are motivated by the animal visual cortex. Currently, for several recent years, CNNs have demonstrated tremendous achievements in various applications, e.g., image classification, object and action detection, and natural language processing.
A CNN includes filters/layers, activation functions, pooling layers, and a fully connected layer, as shown in Fig. 2. A complete CNN is a collection of these layers in the proper form and sequence.
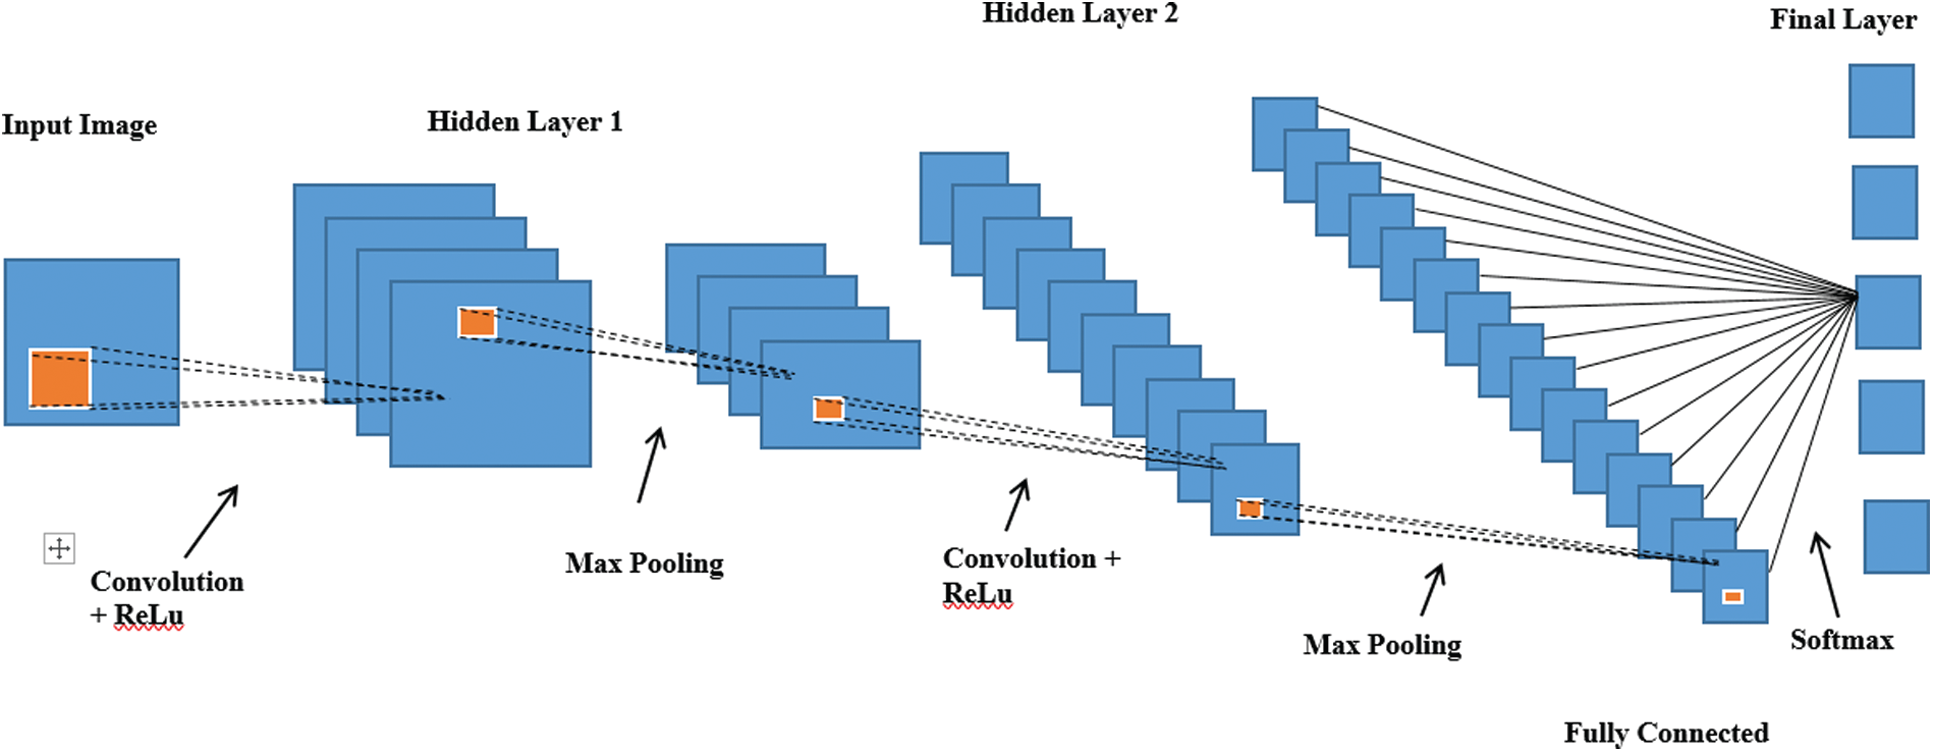
Figure 2: Basic CNN architecture
Currently, a standard CNN is modified and enhanced by introducing large amounts of labeled data and increasing computational power. Some modifications to CNNs have been performed with the following architectures, e.g., AlexNet, ZFNet, VGGNet, GoogleNet, and ResNet, which were developed for computer-vision tasks. In the work described in this study, the Visual Geometry Group (VGG-16) architecture was considered, which was modified to detect distracted drivers as shown in Fig. 3.
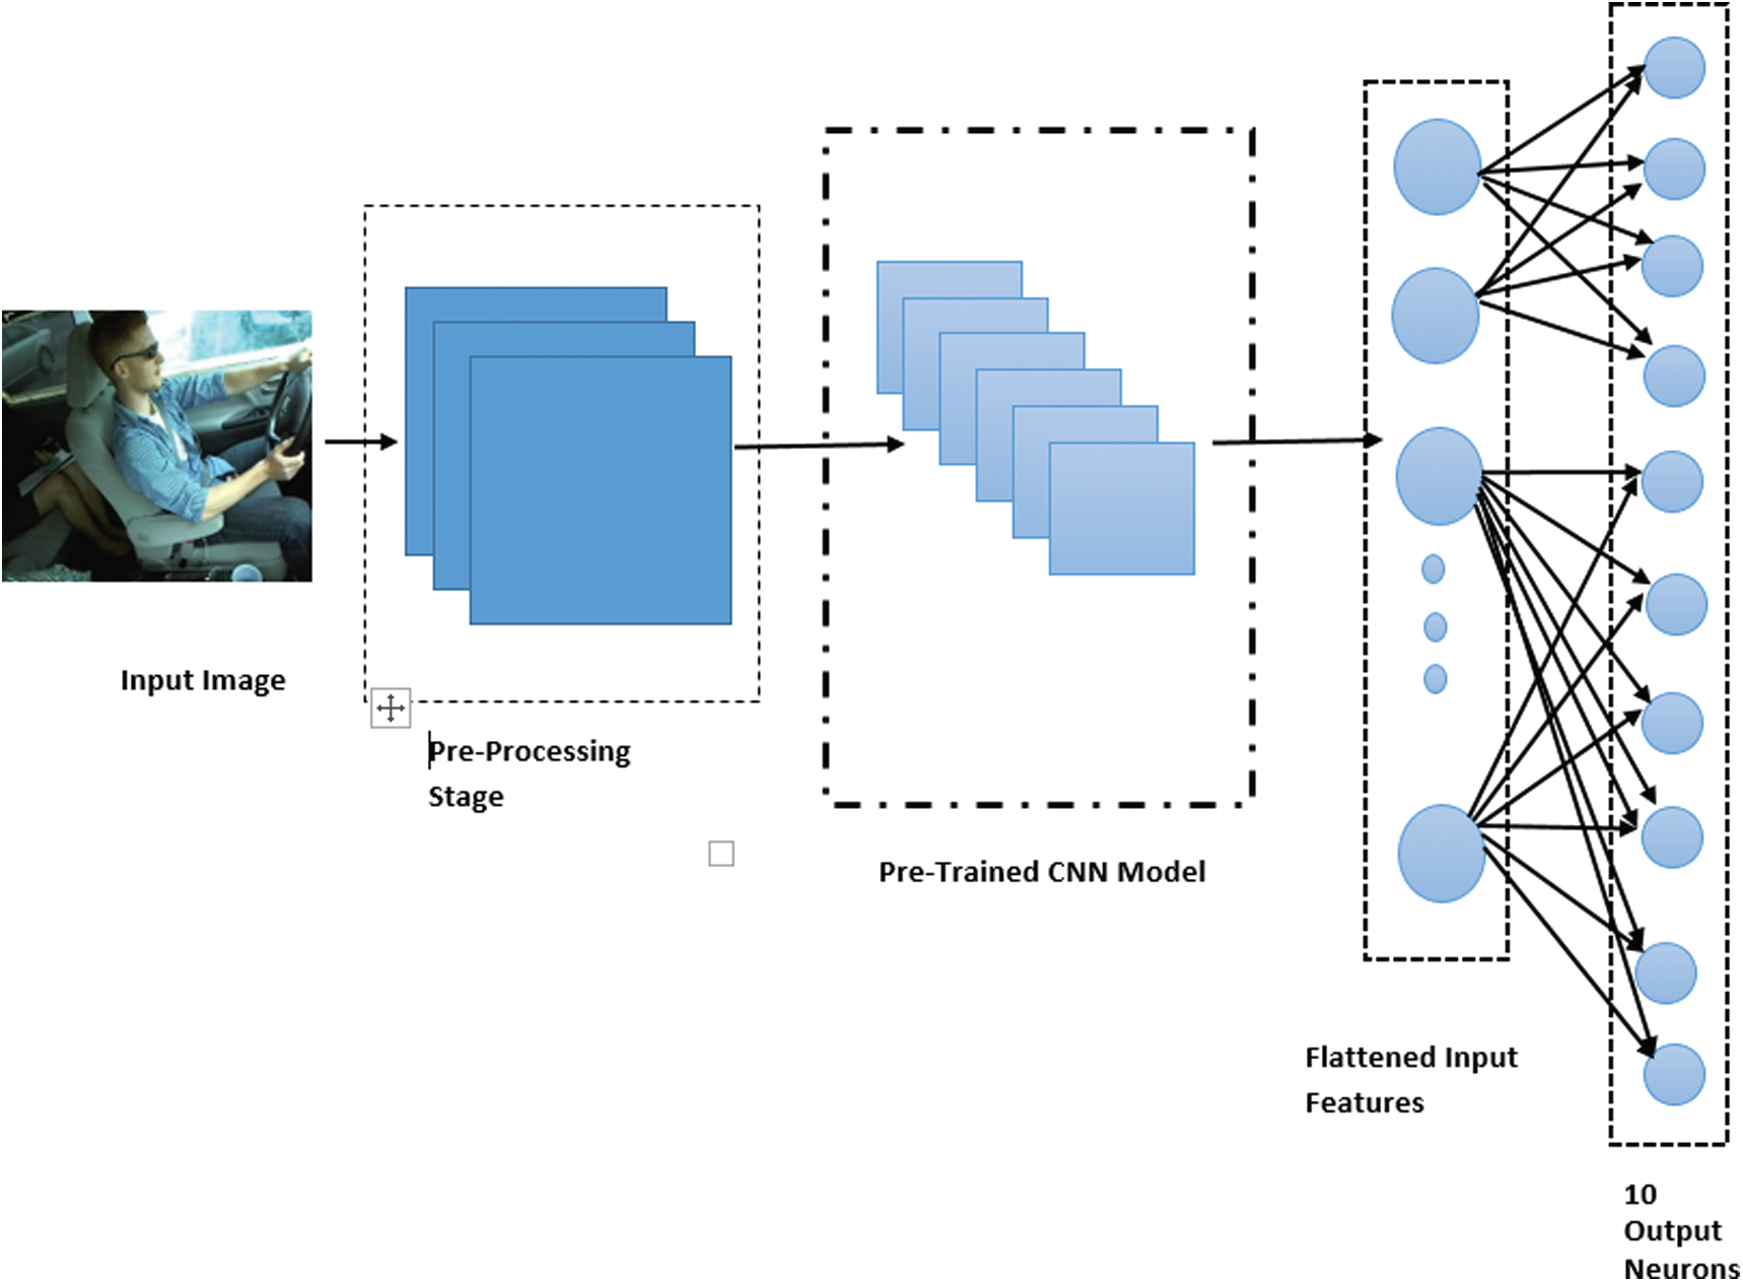
Figure 3: CNN architecture for distracted driver detection
Original and Modified VGG16 Architecture: According to the literature, VGGNet is the most powerful CNN architecture, in which the main idea is to develop a network that should be deep and simple. The VGG architecture is shown in Fig. 4. VGG is an efficient tool for image-classification and localization tasks. The standard VGG architecture comprises
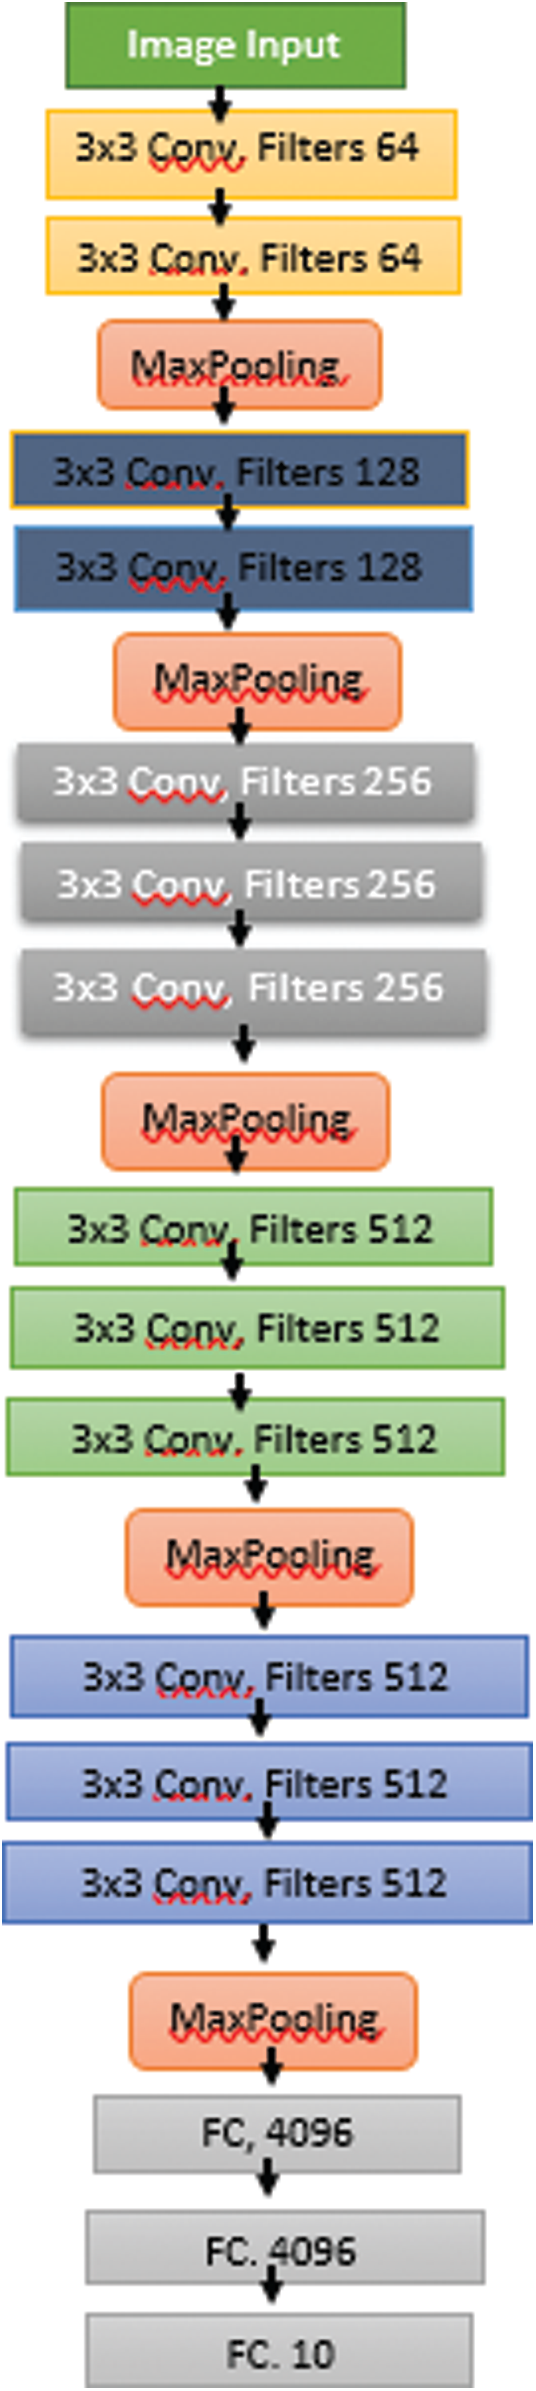
Figure 4: Original VGG architecture
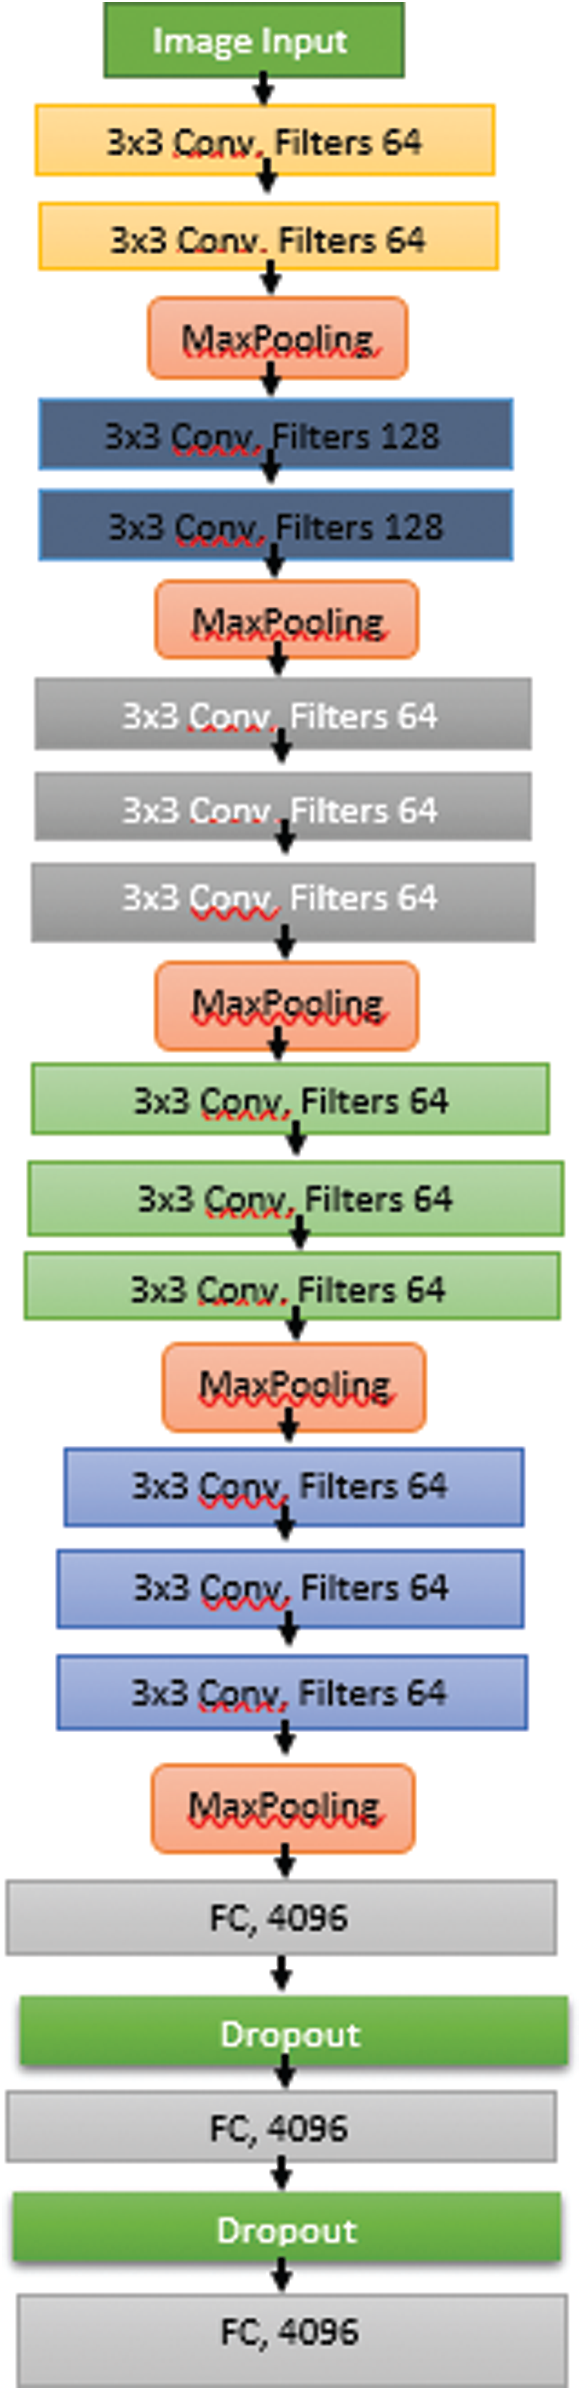
Figure 5: Modified VGG architecture
The ReLU function is currently the most used activation function in the World because it is used in almost all the CNNs or deep learning, as shown in Eq. (1).
As can be seen, the ReLU function is half-rectified (from the bottom). f(z) is zero when z is less than zero and equal to z when z is above or equal to zero.
The dense layer’s output is then passed through a dropout layer, and a dense layer with several neurons equals the number of class labels and softmax activation function, as shown in Eq. (2). The softmax activation function is used to compute the probability of each class label, and can be calculated as
To evaluate the experimental results, two standard performance metrics were used, i.e., Accuracy and Sensitivity. These evaluation metrics are computed by using the following equations in which TP is the number of true positives samples in the testing set, which were correctly detected, and TN is the number of true negatives, which truly gives the number of negative samples in the testing set. FP is the number of false positives, which give the number of false positives in the testing set that are actually incorrectly detected. FN is the number of false negatives, which gives the number of false negative samples in the testing set that are incorrectly detected. The equations are as follows:
Accuracy is used to calculate the portion of samples that are detected correctly during the testing phase with all the datasets. Precision is used to calculate the percentage of samples that are correctly detected during the testing phase with the total number of FP and TP samples. The sensitivity is calculated by dividing the number of TP samples at testing with the overall sum of TP and FN samples as shown in Eqs. (3)–(5).
A CNN was designed to detect distracted-driver behaviors. In this network, the weights were initialized using the ImageNet model, followed by the application of the transfer learning concept. Moreover, depending on the dataset, the weights at each network layer of the network were adjusted, and various hyperparameters were fine-tuned through a trial-and-error process. Here, stochastic gradient descent [42] was used for training with a learning rate of approximately 0.0001. The batch size was 64 and the number of epochs was 100. Training the neural network was performed by optimizing the objective functions. Here, the objective function was the cross-entropy loss function. The purpose of applying this function is to optimize loss to make the model able to handle large datasets and select samples at random, which are then used to estimate the gradients at each layer and iteration. Here, the proposed model was evaluated using a standard stochastic gradient descent algorithm and the Adam optimizer. As mentioned previously, the learning rate was set to 0.0001. The learning rates were applied to manage the weights and update them according to the expected errors. Note that the learning rate should be evaluated carefully. If it is shallow, then the learning process will be slow, and, as the learning rate increases, weights would become very large, which could lead to divergence. With these issues in mind, the model was optimized using prevalent learning rates of 0.1–0.0001. In addition, overfitting is handled using dropout and regularization techniques. Typically, the difference is training accuracy, and validation is called overfitting, which must be addressed. Overfitting should be as low as possible for an ideal model to predict test datasets accurately. Dropout is achieved by dropping a few network nodes during the training process. After dropout, the batch size was tuned. The batch size defines the number of instances to be propagated prior to updating the model’s parameters. In addition, the pixel values should be adjusted before training and testing the model. The pixel values of the input images should be normalized between 0 and 1. Here, the normalization process was performed, dividing the pixel values over the maximum intensity value of 255.
Initially, the original VGG-16 architecture was applied to distracted-driver detection, and good results were obtained in the training phase; however, during testing, the results were not so good and resulted in overfitting. To overcome these issues, dropout was applied to improve the model’s performance. In addition, weight regularization and batch normalization were used, significantly enhancing the results and accuracy rate. It was found that this model could handle an average of 39 images per second. Tab. 3 presents the results of the system in the form of a confusion matrix and Tab. 4 shows the class-wise accuracies for each of the 10 classes in the dataset. Another issue with the core VGG-16 architecture is the number of parameters. As the number of parameters was huge, memory problems were inevitable. To overcome this issue, the model was modified to reduce the parameters by 75%, which reduced memory costs and improved accuracy.
Table 3: Confusion matrix of the proposed model on StateFarm Dataset
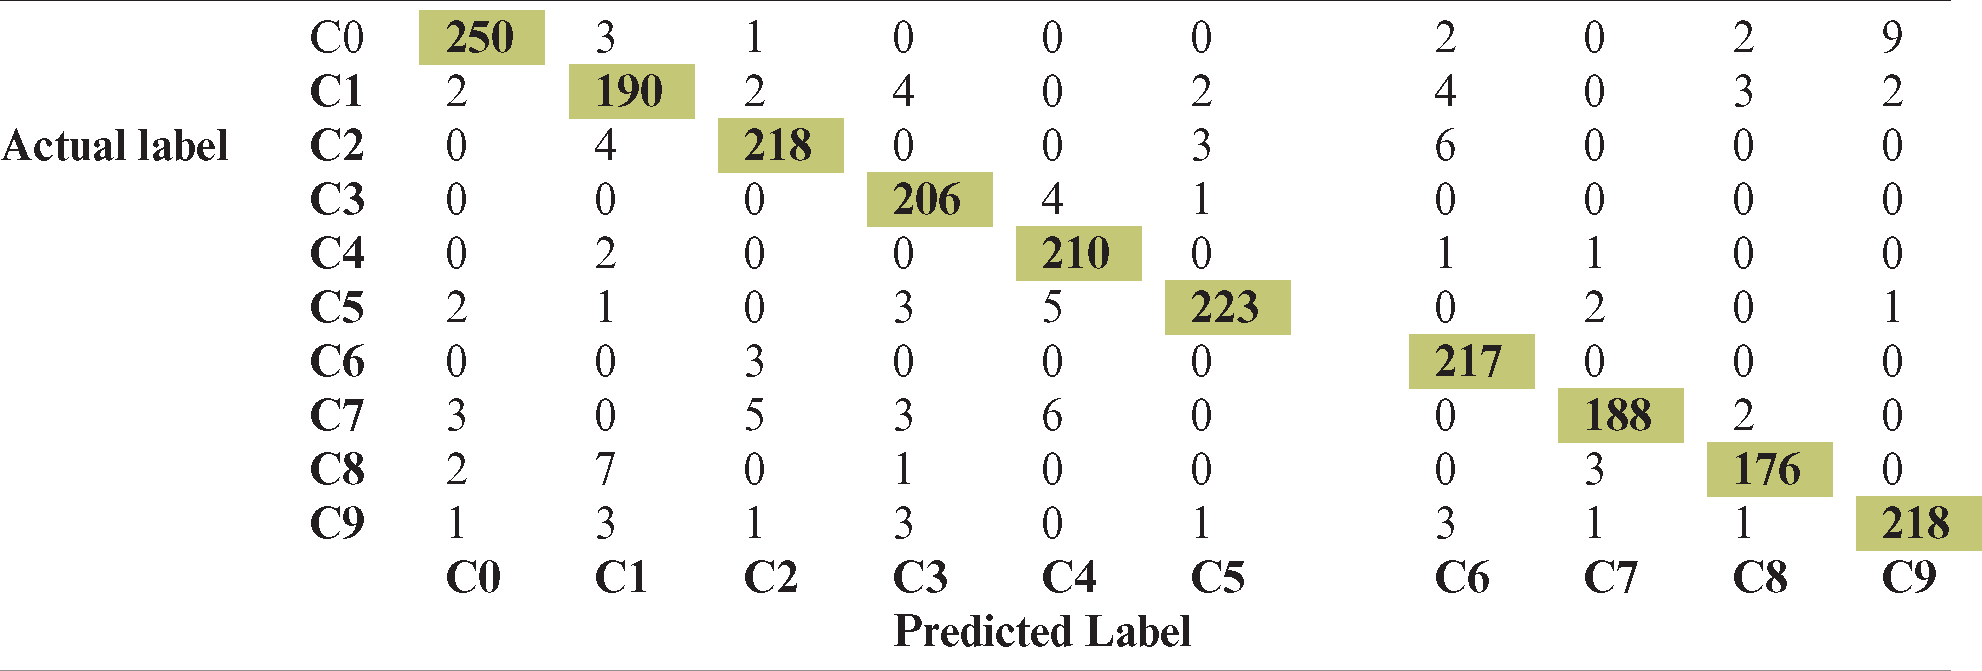
Table 4: Accuracy of the proposed method for all ten classes
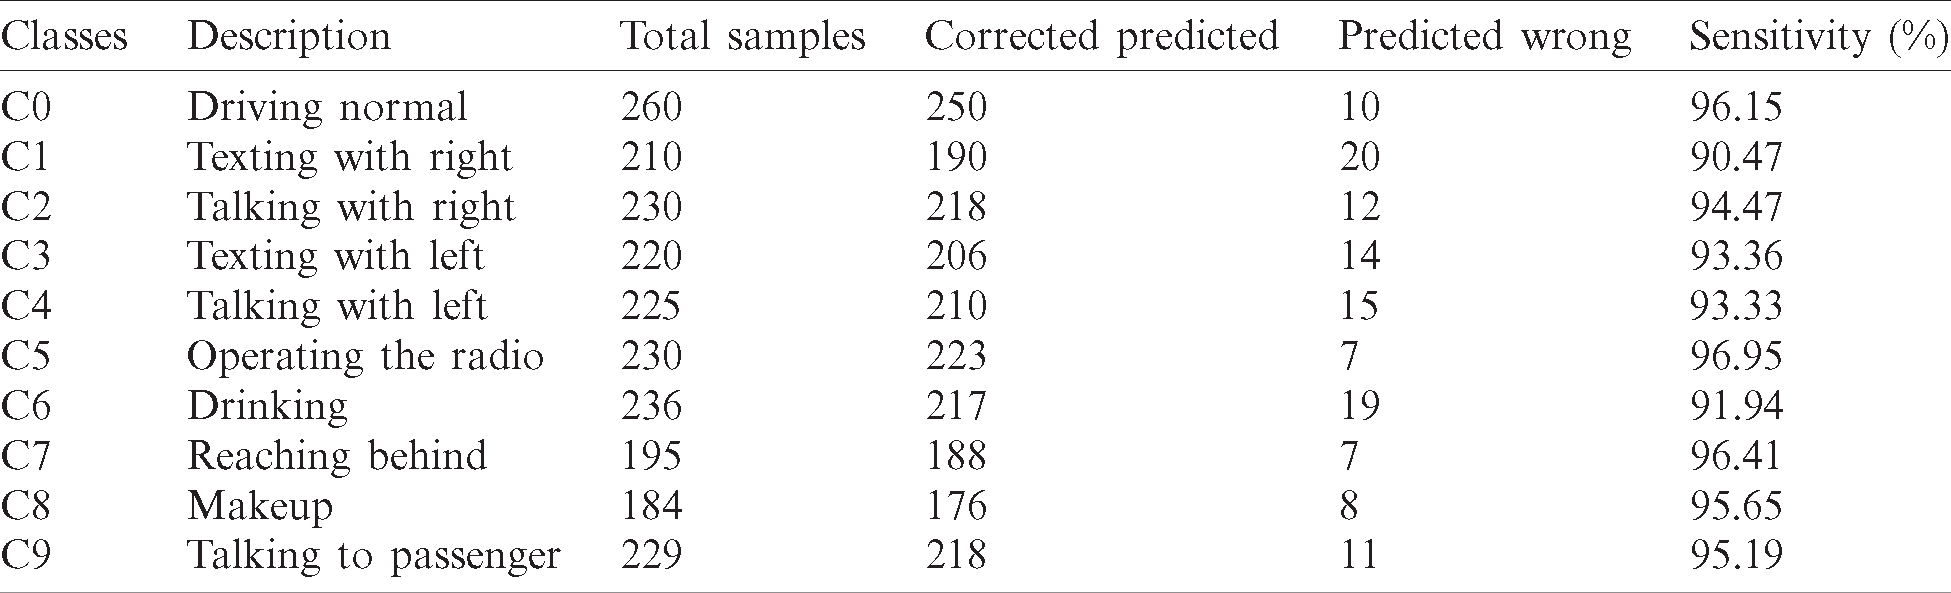
As can be seen from the confusion matrix, the “Driving Normal” and “Talking to Passenger” classes are somewhat similar and were difficult to differentiate because the hand posture in both images is on the wheel; thus, the lack of hand movement caused this misclassification. In addition, the “Talking with the right” and “Texting with the right” classes were also mismatched and difficult to differentiate because, in the images in these classes, the right is used and had to make the action. This misclassification is the cause of a few temporal information of the image and its analysis. As shown in Tab. 3, the “C0” and “C9” classes achieve almost near accuracy, and the remaining classes also show promising results. The “Driving Normal” class obtained an accuracy of 96.15% and the “Talking to Passenger” class obtained 95.19% accuracy. The best accuracy (96.95%) was obtained for the “Operating the Radio” class (with class name “C5”). The worst accuracy was obtained for the “Texting with Right” class (90.47%), as shown in Tab. 4. However, real-time performance was realized with real-time dynamic data. To achieve real-time prediction accuracy and apply the system to real images, the parameters list should be reduced. If the number of parameters is large, computational overhead increases, which may lead to breaking the system. The loss and accuracy of the proposed model is shown in Fig. 6.
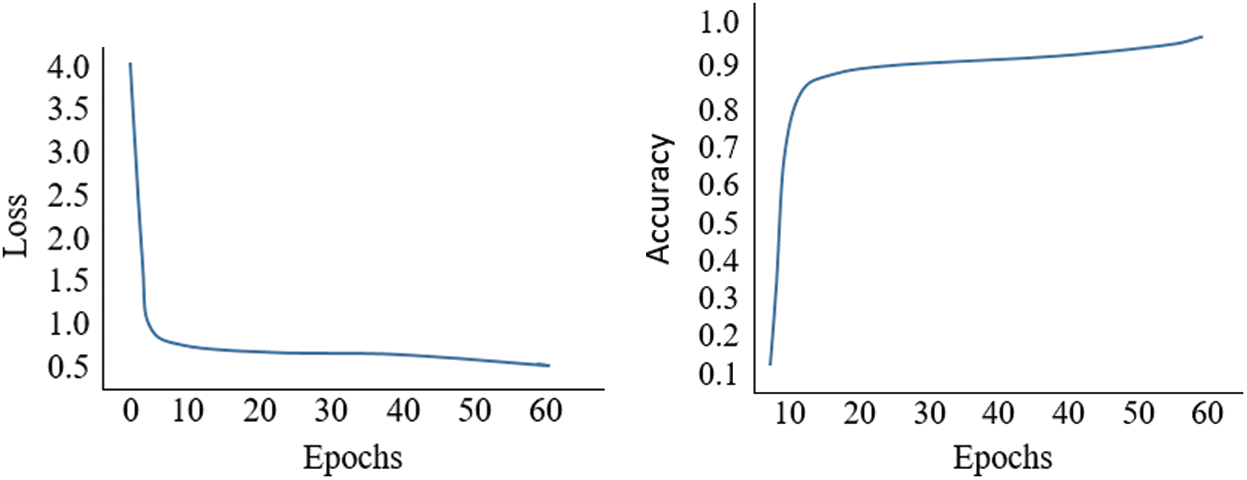
Figure 6: Loss and accuracy of the proposed method
Driver distraction is a major issue leading to a consistent increase in the number of vehicle-related accidents. Drivers can become distracted by various activities, e.g., talking on the phone, texting on the phone, eating, drinking, and talking to passengers. A system to detect such actions and warn drivers to avoid them to reduce accidents is therefore required. The StateFarm dataset was developed to facilitate such research and is available on Kaggle for public use. This dataset comprises many images, each action is classified, and their images are listed separately. The total number of actions (classes) in this dataset is 10. The dataset is divided into training and testing data, where 70% of the data are dedicated to training and 30% for testing and validation. These images were applied to deep learning to learn the image features and train the system with some efficient models. These models were tested on the test images. In this study, the VGG architecture, which has shown promising results in the past, was used. However, the VGG architectures include a vast number of parameters. In this study, this parameter issue was handled, and our modified VGG architecture achieved an accuracy of approximately 96.95%.
The current methodology is working fine, but, in the future, developing our own dataset with a larger size and applying this methodology to further try and use the more intensive techniques and customize the current methodology are desirable. Planned future work also includes development of real-time detection of driver distraction and application of wireless techniques to impose tickets on drivers based on images of driver distraction. Such a system would detect the distraction and send a traffic violation ticket as a message to the driver’s mobile phone.
Funding Statement: This work is a partial result of a research project supported by Grant Number 13-INF2456-08-R from King Abdul Aziz City for Sciences and Technology (KACST), Riyadh, Kingdom of Saudi Arabia.
Conflicts of Interest: The authors declare that they have no conflicts of interest to report regarding the present study.
1. WHO. (2018). “Global Status Report on Road Safety 2018: Summary,”. [Google Scholar]
2. Al-Turaiki, Isra, Maryam Aloumi, Nour Aloumi and Khulood Alghamdi. (2016). “Modeling traffic accidents in Saudi Arabia using classification techniques,” in Proc. SICIT, Riyadh, Saudi Arabia, pp. 1–5. [Google Scholar]
3. P. F. Ehrlich, B. Costello and A. Randall. (2020). “Preventing distracted driving: A program from initiation through to evaluation,” American Journal of Surgery, vol. 219, no. 6, pp. 1045–1049. [Google Scholar]
4. Testimony of The Honorable David L. Strickland. (2013). “Administrator national highway traffic safety administrationitle,” House Committee on Transportation and Infrastructure Subcommittee on Highways and Transit, vol. 10, no. 6, pp. 1–8. [Google Scholar]
5. G. Savelli, S. Silveira Stein, G. Bernard-Granger, P. Faucherand and L. Montès. (2016). “Driving to safety,” Superlattices Microstruct, vol. 20, no. 16, pp. 124–134. [Google Scholar]
6. National Highway Traffic Safety Administration. (2015). “Traffic safety facts 2015: A compilation of motor vehicle crash data from the fatality analysis reporting system and the general estimates system,” U.S. Department of Transportation, vol. 1, no. 3, pp. 45–55. [Google Scholar]
7. G. M. Fitch, S. A. Soccolich, F. Guo, J. McClafferty, Y. Fang et al. (2013). , “The impact of hand-held and hands-free cell phone use on driving performance and safety-critical event risk,” National Highway Traffic Safety Administration, vol. 34, no. 3, pp. 23–33. [Google Scholar]
8. C. Streiffer, R. Raghavendra, T. Benson and M. Srivatsa. (2017). “DarNet: A deep learning solution for distracted driving detection,” in Proc. IMC, Las Vegas Nevada, USA, pp. 22–28. [Google Scholar]
9. F. Vicente, Z. Huang, X. Xiong, F. TDe La Torre, W. Zhang et al. (2015). , “Driver gaze tracking and eyes off the road detection system,” IEEE Transactions on Intelligent Transportation Systems, vol. 16, no. 4, pp. 2014–2027. [Google Scholar]
10. Q. Ji and X. Yang. (2002). “Real-time eye, gaze, and face pose tracking for monitoring driver vigilance,” Real-Time Imaging, vol. 8, no. 5, pp. 357–377. [Google Scholar]
11. M. S. Young, J. M. Mahfoud, G. H. Walker, D. P. Jenkins and N. A. Stanton. (2008). “Crash dieting: The effects of eating and drinking on driving performance,” Accident Analysis and Prevention, vol. 40, no. 1, pp. 142–148. [Google Scholar]
12. S. Koppel, J. Charlton, C. Kopinathan and D. Taranto. (2011). “Are child occupants a significant source of driving distraction?,” Accident Analysis and Prevention, vol. 43, no. 3, pp. 1236–1244. [Google Scholar]
13. A. Theofilatos, A. Ziakopoulos, E. Papadimitriou and G. Yannis. (2018). “How many crashes are caused by driver interaction with passengers? A meta-analysis approach,” Journal of Safety Research, vol. 65, pp. 11–20. [Google Scholar]
14. F. Zhang, S. Mehrotra and S. C. Roberts. (2019). “Driving distracted with friends: Effect of passengers and driver distraction on young drivers’ behavior,” Accident Analysis and Prevention, vol. 132, pp. 1–9. [Google Scholar]
15. K. Shinohara, T. Nakamura, S. Tatsuta and Y. Iba. (2010). “Detailed analysis of distraction induced by in-vehicle verbal interactions on visual search performance,” International Association of Traffic and Safety Sciences Research, vol. 34, no. 1, pp. 42–47. [Google Scholar]
16. M. Krause, A. S. Conti, M. Henning, C. Seubert, C. Heinrich et al. (2015). , “App analytics: Predicting the distraction potential of in-vehicle device applications,” in Proc. AHFE, Las Vegas, USA, pp. 2658–2665. [Google Scholar]
17. J. Edquist, T. Horberry, S. Hosking and I. Johnston. (2011). “Effects of advertising billboards during simulated driving,” Applied Ergonomics, vol. 42, no. 4, pp. 619–626. [Google Scholar]
18. A. Eriksson and N. A. Stanton. (2017). “Takeover time in highly automated vehicles: Noncritical transitions to and from Manual Control,” Human Factors and Ergonomics Society, vol. 59, no. 4, pp. 689–705. [Google Scholar]
19. H. M. Eraqi, M. N. Moustafa and J. Honer. (2017). “End-to-end deep learning for steering autonomous vehicles considering temporal dependencies,” in Proc. NIPS, Long Beach, CA, USA, pp. 10–15. [Google Scholar]
20. H. M. Eraqi, J. Honer and S. Zuther. (2017). “Static free space detection with laser scanner using occupancy grid maps,” in Proc. NIPS, Long Beach, CA, USA, pp. 1–8. [Google Scholar]
21. H. M. Eraqi, Y. E. Eldin and M. N. Moustafa. (2016). “Reactive collision avoidance using evolutionary neural networks,” in Proc. IJCCI, Portugal, pp. 1–7. [Google Scholar]
22. R. A. Berri, A. G. Silva, R. S. Parpinelli, E. Girardi and R. Arthur. (2014). “A pattern recognition system for detecting use of mobile phones while driving,” in Proc. VISAPP, Portugal, pp. 1–8. [Google Scholar]
23. Y. Artan, O. Bulan, R. P. Loce and P. Paul. (2014). “Driver cell phone usage detection from HOV/HOT NIR images,” in Proc. CVPR, Columbus, Ohio, USA, pp. 225–230. [Google Scholar]
24. C. Craye and F. Karray. (2015). “Driver distraction detection and recognition using RGB-D sensor,” in Proc. CVPR, Las Vegas, USA, pp. 1–11. [Google Scholar]
25. X. Zhang, N. Zheng, F. Wang and Y. He. (2011). “Visual recognition of driver hand-held cell phone use based on hidden CRF,” in Proc. ICVES, Beijing, China, pp. 248–251. [Google Scholar]
26. T. H. N. Le, Y. Zheng, C. Zhu, K. Luu and M. Savvides. (2016). “Multiple scale faster-RCNN approach to driver’s cell-Phone usage and hands on steering wheel detection,” in Proc. CVPR, Las Vegas, NV, USA, pp. 46–53. [Google Scholar]
27. N. Das, E. Ohn-Bar and M. M. Trivedi. (2015). “On performance evaluation of driver hand detection algorithms: Challenges, dataset, and metrics,” in Proc. ITSC, NW Washington, DC, USA, pp. 2953–2958. [Google Scholar]
28. K. Seshadri, F. Juefei-Xu, D. K. Pal, M. Savvides and C. P. Thor. (2015). “Driver cell phone usage detection on Strategic Highway Research Program (SHRP2) face view videos,” in Proc. CVPR, Boston, MA, USA, pp. 35–43. [Google Scholar]
29. C. H. Zhao, B. L. Zhang, J. He and J. Lian. (2012). “Recognition of driving postures by contourlet transform and random forests,” IET Intelligent Transport Systems, vol. 6, no. 2, pp. 161–168. [Google Scholar]
30. C. H. Zhao, B. L. Zhang, X. Z. Zhang, S. Q. Zhao and H. X. Li. (2013). “Recognition of driving postures by combined features and random subspace ensemble of multilayer perceptron classifiers,” Neural Computing and Applications, vol. 22, pp. 175–184. [Google Scholar]
31. S. Ren, K. He, R. Girshick and J. Sun. (2017). “Faster R-CNN: Towards real-time object detection with region proposal networks,” IEEE Transactions on Pattern Analysis and Machine Intelligence, vol. 39, no. 6, pp. 1137–1149. [Google Scholar]
32. E. Ohn-Bar, S. Martin, A. Tawari and M. M. Trivedi. (2014). “Head, eye, and hand patterns for driver activity recognition,” in Proc. ICPR, Sweden, pp. 660–665. [Google Scholar]
33. C. Yan, F. Coenen and B. Zhang. (2016). “Driving posture recognition by convolutional neural networks,” IET Computer Vision, vol. 10, no. 2, pp. 103–114. [Google Scholar]
34. Y. M. Song, S. Noh, J. Yu, C. W. Park and B. G. Lee. (2014). “Background subtraction based on Gaussian mixture models using color and depth information,” in Proc. ICCAIS, Gwangju, South Korea, pp. 132–135. [Google Scholar]
35. A. Krizhevsky, I. Sutskever and G. E. Hinton. (2017). “ImageNet classification with deep convolutional neural networks,” Communications of the ACM, vol. 60, no. 6, pp. 84–90. [Google Scholar]
36. I. Jegham, A. Ben Khalifa, I. Alouani and M. A. Mahjoub. (2018). “Safe driving: Driver action recognition using SURF keypoints,” in Proc. ICM, Sousse, Tunisia, pp. 60–63. [Google Scholar]
37. O. D. Okon and L. Meng. (2017). “Detecting distracted driving with deep learning,” in Proc. ICR, Russia, pp. 170–179. [Google Scholar]
38. StateFarm. (2016). State Farm Distracted Driver Detection. Kaggle. [Google Scholar]
39. H. M. Eraqi, Y. Abouelnaga, M. H. Saad and M. N. Moustafa. (2019). “Driver distraction identification with an ensemble of convolutional neural networks,” Journal of Advanced Transportation, vol. 2019, pp. 1–12. [Google Scholar]
40. B. Baheti, S. Gajre and S. Talbar. (2018). “Detection of distracted driver using convolutional neural network,” in Proc. CVPR, Salt Lake City, Utah, pp. 1032–1038. [Google Scholar]
41. A. Behera, A. Keidel and B. Debnath. (2019). “Context-driven multi-stream LSTM (M-LSTM) for recognizing fine-grained activity of drivers,” in Proc. GCPR, Dortmund, Germany, pp. 298–314. [Google Scholar]
42. A. Sharif Razavian, H. Azizpour, J. Sullivan and S. Carlsson. (2014). “CNN features off-the-shelf: An astounding baseline for recognition,” in Proc. CVPR, Columbus, Ohio, USA, pp. 806–813. [Google Scholar]
43. K. Simonyan and A. Zisserman. (2015). “Very deep convolutional networks for large-scale image recognition,” in Proc. ICLR, Vancouver, BC, Canada, pp. 1–14. [Google Scholar]
44. G. Chaudhary and S. Srivastava. (2020). “A robust 2D-Cochlear transform-based palmprint recognition,” Soft Computing, vol. 24, no. 3, pp. 2311–2328. [Google Scholar]
45. Afzal, H. M. Rehan, L. Suhuai, M. Kamran Afzal, G. Chaudhary et al. (2020). , “3D Face reconstruction from single 2D image using distinctive features,” IEEE Access, vol. 8, pp. 180681–180689. [Google Scholar]
46. B. Baheti, S. Talbar and S. Gajre. (2015). “Towards computationally efficient and realtime distracted driver detection with MobileVGG network,” IEEE Transactions on Intelligent Vehicles, vol. 14, no. 8, pp. 1–11. [Google Scholar]
 | This work is licensed under a Creative Commons Attribution 4.0 International License, which permits unrestricted use, distribution, and reproduction in any medium, provided the original work is properly cited. |