DOI:10.32604/cmc.2021.015349
| Computers, Materials & Continua DOI:10.32604/cmc.2021.015349 | |
| Article |
Thermodynamic Simulation on the Change in Phase for Carburizing Process
1Ho Chi Minh city University of Technology (HUTECH), Ho, Vietnam
2Ho Chi Minh city University of Transport, Ho Chi Minh city, Vietnam
3Al-Nahrain University, Al-Nahrain Nanorenewable Energy Research Center, Baghdad, Iraq
4Hanoi University of Science and Technology, Hanoi, Vietnam
5Industrial University of Ho Chi Minh City (IUH), Ho Chi Minh city, Vietnam
6Vietnam Maritime University, Haiphong, Vietnam
*Corresponding Author: Duong Nam Nguyen. Email: namnguyenduong1985@gmail.com
Received: 16 November 2020; Accepted: 03 January 2021
Abstract: The type of technology used to strengthen the surface structure of machine parts, typically by carbon-permeation, has made a great contribution to the mechanical engineering industry because of its outstanding advantages in corrosion resistance and enhanced mechanical and physical properties. Furthermore, carbon permeation is considered as an optimal method of heat treatment through the diffusion of carbon atoms into the surface of alloy steel. This study presented research results on the thermodynamic calculation and simulation of the carbon permeability process. Applying Fick’s law, the paper calculated the distribution of carbon concentration in the alloy steel after it is absorbed from the surface into the internal of the sample. Using the SYSWELD software, an analysis was performed on the carbon permeability process to determine the distribution of carbon concentrations in 20CrMo steel that was then followed by a detailed analysis of the microstructure of the sample post the carburizing process. According to the calculation results, the surface carbon content was 0.9% and steadily decreased into the core. After 3 hours, the depth of the absorbent layer was measured at 0.5 mm for both the cylindrical and cubic samples. By analyzing the phase, the distribution of martensite phases such as ferrite/pearlite and residual austenite was also determined after the carburizing process.
Keywords: Carburizing process; 20CrMo steel; thermodynamic analysis; microstructure formation; carbon concentration
Heat treatment played an important role in mechanical fabrication because it not only instilled in the post-machined parts the necessary properties but also increased the mechanical properties of the material. Therefore, it could be said that heat treatment was one of the important technological factors that determined the quality of mechanical products [1,2]. In addition, heat treatment had a decisive effect on the life of mechanical products. Therefore, if the heat treatment were not guaranteed, the life of the part might be reduced and the accuracy of the machine could no longer be kept as required [3]. For industrialized countries, the assessment of the mechanical manufacturing industry often relied on the level of heat treatment. In the absence of heat treatment, the quality of the mechanical fabrication could not be qualified no matter how precise the mechanical processing was.
Under high temperatures, heat treatment process applied a thermal diffusion treatment to saturate the surface layer of parts with different elements in the atomic state of the external environment [4]. Moreover, heat treatment was intended to improve hardness, wear resistance, fatigue strength, long contact durability, against electrochemical and gas corrosion [5]. The carburizing process was a thermochemical method consisting of saturation (permeability, diffusion) of carbon into the surface of low carbon steel followed by quenching and tempering to attain increased surface hardness and high abrasion resistance, while the core had good strength and toughness [6]. The main purpose of carbon impregnation was to make the surface of steel hardened to 60–64 HRC with high wear resistance, good fatigue resistance, while the core was durable and tough with a hardness of 30–40 HRC. The permeability layer had a carbon concentration in the range of 0.8–1%, while if it were below this limit after quenching the permeation layer would not have enough hardness and wear resistance [6]. If it were above this limit, the absorbent layer might become brittle or flaky. The experiment showed that, with such a satisfactory carbon concentration of the permeability layer, the part with both hardness and good abrasion resistance achieved the highest durability. Furthermore, the microstructure of surfaces and cores after penetration, low quenching, and tempering should be achieved: surface-martensite and fine carbon particles evenly distributed, core-martensite and ferrite free [7].
Studying the effects of the element carbon on the process was quite complex. In research work, D’ Maz Silva et al. [8] conducted a carbon-nitrogen permeability experiment for low-alloy steel. In this work, the composition of the elements introduced into the permeable medium was identified as well as the structure of the phases formed in this process. The work of Catteau et al. [9] determined the effect of bainite transformation on the carburizing process; carbon-nitriding and nitriding of low-alloy carbon steel. Also in this work, the morphology of phases was examined by the experimental method. According to Stone et al. [10] using the X-ray method, austenite, and bainite phases were determined in steel. In the study of Esin et al. [11], they also observed the austenite phase formation in steel during heat treatment by experiment and X-ray diffraction. Moreover, the research on the effect of H2 content on carbon permeability by Pham et al. [12] revealed that the ratio of the mixture of CO2/gas could determine the penetration and the impact of H2 on the carbon permeability [13–16]. More interestingly, with a CO2/gas ratio between 2.5 and 3.0, a temperature of
The 20CrMo steel was a low carbon alloy steel, which was commonly used in the fabrication of heavy-duty gears with high corrosion resistance. Therefore, it was very necessary to improve the surface hardness of the machine parts using 20CrMo steel [18]. The application of a thermochemical process such as carbon ingress into the billet fabrication process was considered to be an effective solution in mechanical fabrication because it could both harden the surface while maintaining inner strength and toughness [19–22]. Despite the high numbers of studies focusing on the chemical heat treatment method, they only showed empirical methods to determine the phase structure. Specifically, the formation of phases from the input surface was examined without the introduction of any method of calculating prediction or simulating the formation of this phase when performing the permeation process. Therefore, in this study, we presented the calculation and simulation method of the seepage process to determine the phases, as well as the distribution of these phases while performing the process of carbon impregnation on 20CrMo steel. Besides, the mechanism of phase transformation and composition changes in the carburizing process was also clarified, which was very complex and difficult to recognize individual phases. More surprisingly, the simulation solution was seen as a salvage for the studies of the physical and chemical mechanisms that took place during the heat treatment of alloys. The phase transition state and the composition in the 20CrMo alloy steel during the carburizing process were supported by the SYSWELD simulation tool.
The properties of steel may depend on the carbon content. In the process of carbon permeability, the carbon content obtained in the diffusion process always obeys the law of diffusion. According to Fick I’s law [23]:
where: J—diffusion rate per unit area; D—diffusion coefficient;
According to Fick II’s law:
where:
where:
Solving Eq. (2), it can be obtained:
where: C—carbon concentration at time t (s) and from the surface of the workpiece x (mm); Cg—carbon concentration in the carburizing environment; CO—initial carbon concentration of the sample.
From Eq. (4) and with the surface with
Where: CS is carbon content on the surface. By combining Eqs. (3) and (5), the required carbon content can achieve as follows:
Thus, the total amount of carbon per unit surface area can be determined [25]:
The relationship between Mh/(Cg − CO) and the dimensionless parameter
At a defined distance, in which the diffusion coefficient can be determined, a carbon and nitrogen content distribution curve can be built. The relationship between diffusion coefficients and temperature could be illustrated by Eq. (10).
Assuming that the carbon content on the surface is in equilibrium with the carbon content in the environment of carburizing, the relationship between the time and the distribution of carbon from the surface to the core could be depicted in Fig. 1.

Figure 1: Distribution of carbon from the surface to the core
In Fig. 1, it could be seen that, if the diffusion time is greater, the slope of the distribution of carbon content from the surface to the core decreases. However, the steel grade for the core fabrication is 20CrMo, which is low alloy steel with some alloying elements such as Cr and Mo (Tab. 1), so it has a great influence on the carbon concentration [26]. The calculation results show that increasing permeability time increases the surface carbon content in the steel. However, that carbon concentration also depends on different distances. On the surface layer (distance less than 0.1 mm), the carbon concentration is almost constant at all three different permeate intervals. Meanwhile, the carbon concentrations at different permeation times have significant changes with depth from 0.1 to 0.5 mm. Especially with a depth of 0.3mm, the carbon concentration after 3 hours of penetration is 0.44% while the carbon concentration is 0.27% after 1h. As a result, the difference between these two seepage intervals of 0.17% is much greater than that of the surface layer. This can be explained that with a longer permeability time the carbon has time to diffuse inward, leading to a significant difference between the different permeability times.
Table 1: Table of the composition of the elements in 20CrMo steel

Here we only consider the effect on the carbon addition during the carburizing process, not the effect of alloying elements on the properties of the material after heat treatment. The activity coefficient
where: xi—the molar fraction of element i and
According to Gunnarson,
For 20CrMo steel:
Calculation results based on Eqs. (14), (16) and (18) are depicted in Fig. 2, which presents the distribution of carbon from the surface to the core. This is similar to the data shown in Fig. 1 on the diffusion of carbon in the carburizing process at different time intervals.
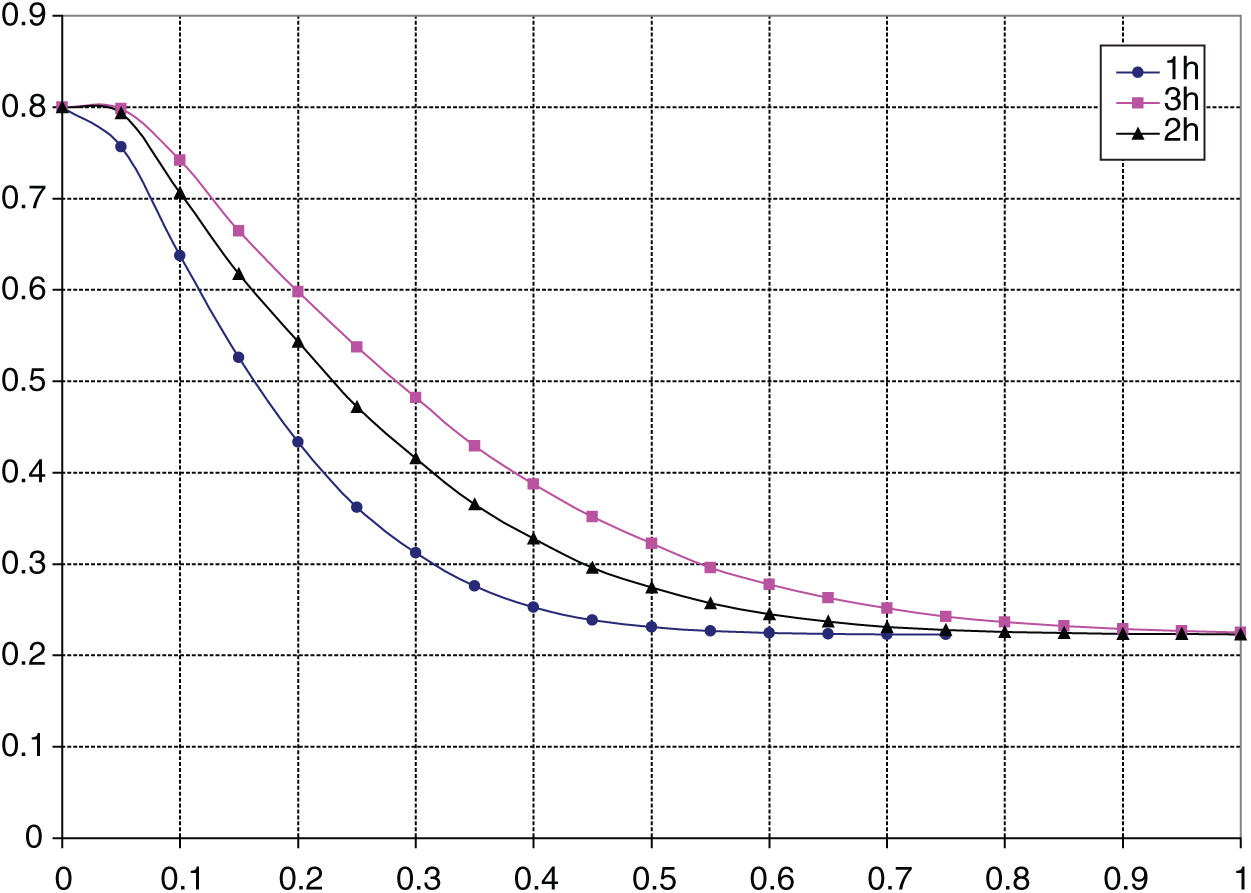
Figure 2: The theoretical carbon concentration distribution in 20CrMo steel
3.1 Simulation of Carburizing Process
Based on the finite element method, solve the Fick II equation with boundary conditions, initial conditions, and calculation parameters as mentioned above. The calculation results using the specialized software SYSWELD are shown from Figs. 3–10. At the initial time (0s), there is no diffusion of carbon from the permeable environment to surface of steel. Therefore, the carbon content in the whole model is still 0.184%. This result is matched with the carbon concentration of 20CrMo steel (Figs. 3 and 4), and with 0 sec time to describe the composition of the steel in equilibrium and prepare for the permeation process. After 10 seconds, the activated carbon from the absorbent medium diffuses into the sample and the maximum carbon content is 0.8348% at the sample surface (Fig. 5). We notice that at the corners of the model the thickness of the diffuse layer is greater than where there is a flat surface. This is because the diffusion here is the synthesis of 2 diffusion directions Y and Z.
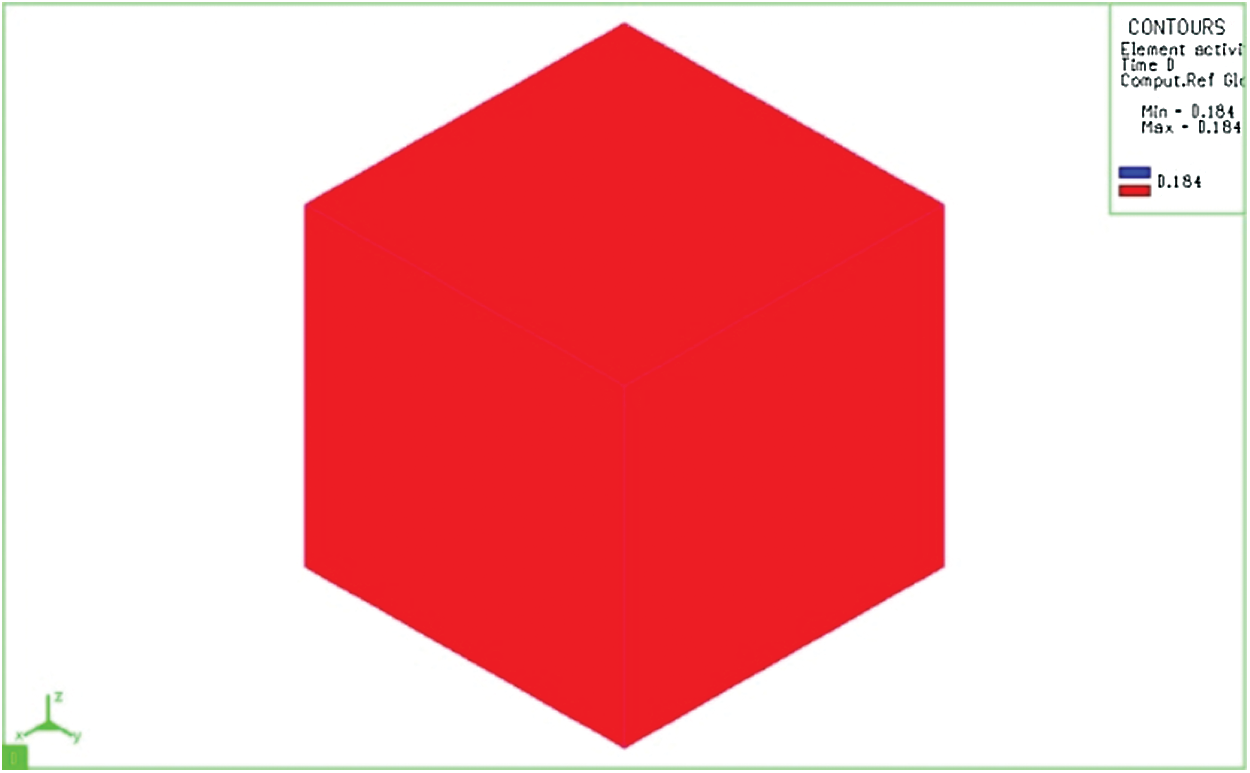
Figure 3: Diffusion of carbon in the mass sample at 0 sec
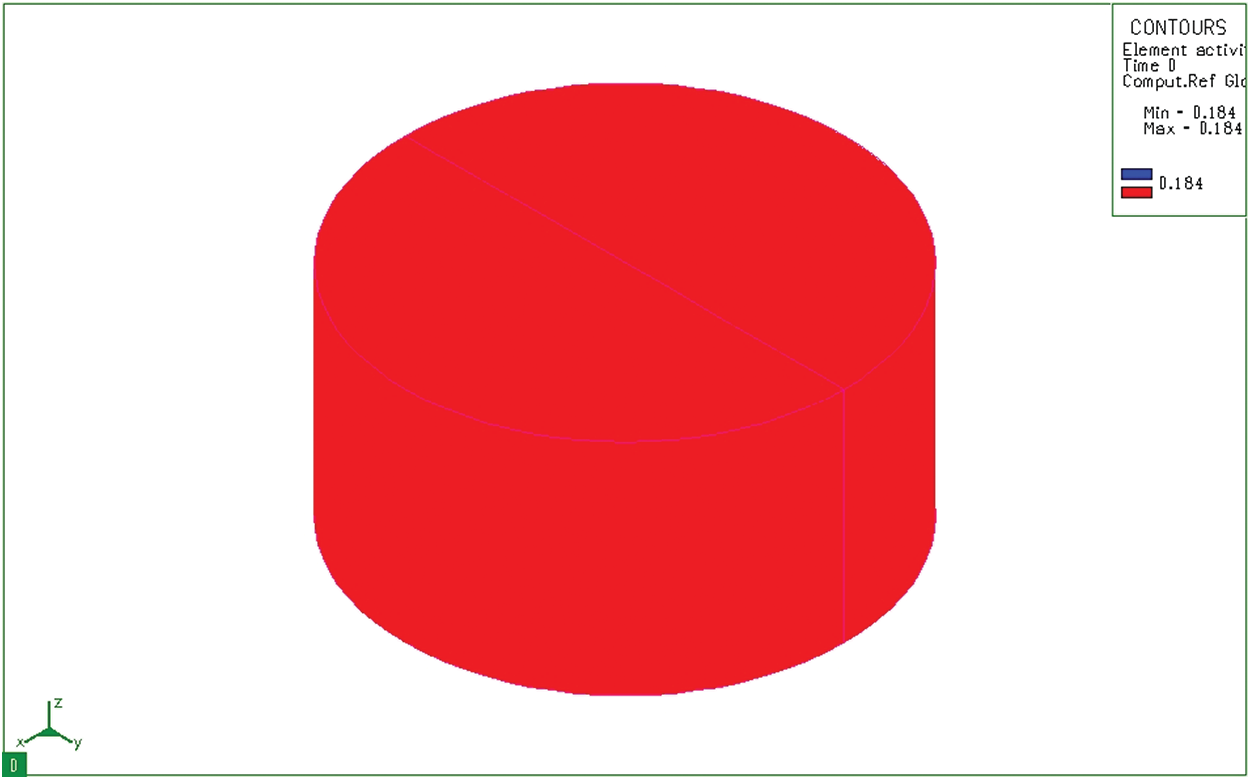
Figure 4: Diffusion of carbon in a cylindrical sample at 0 sec
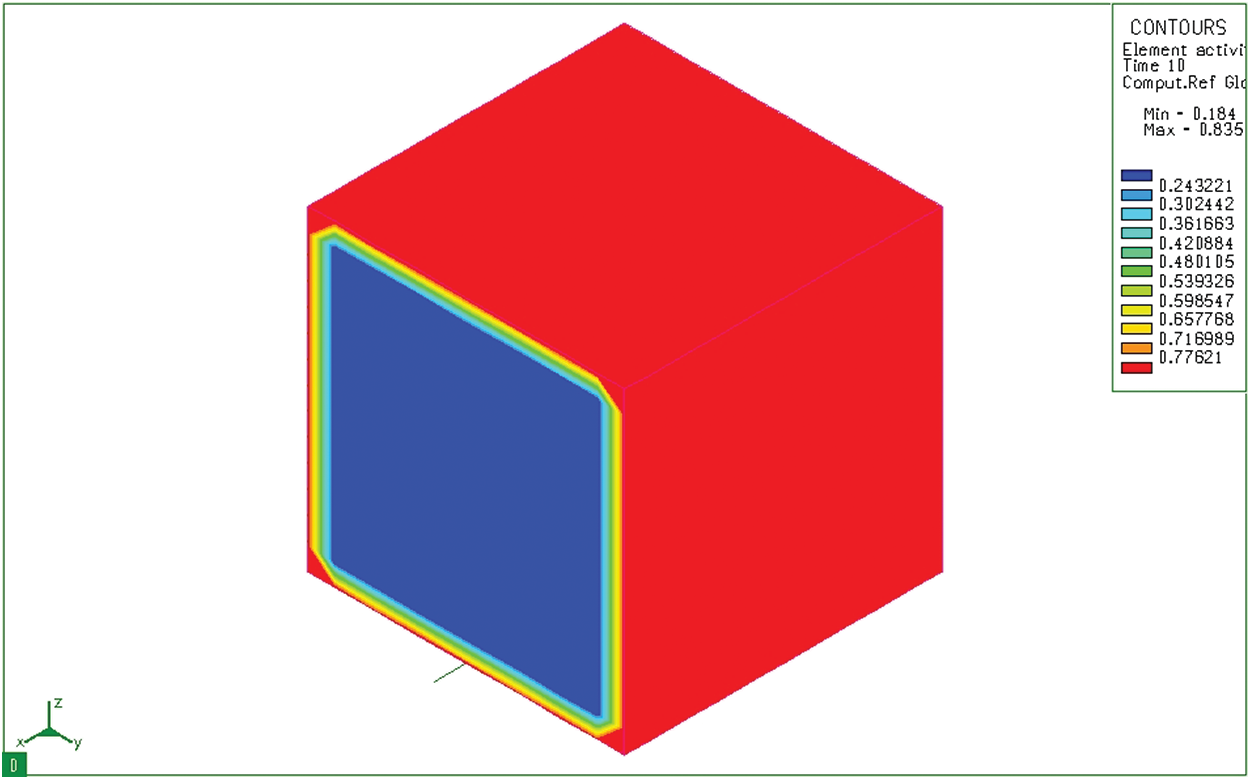
Figure 5: Diffusion of carbon at 10 seconds on a bulk sample
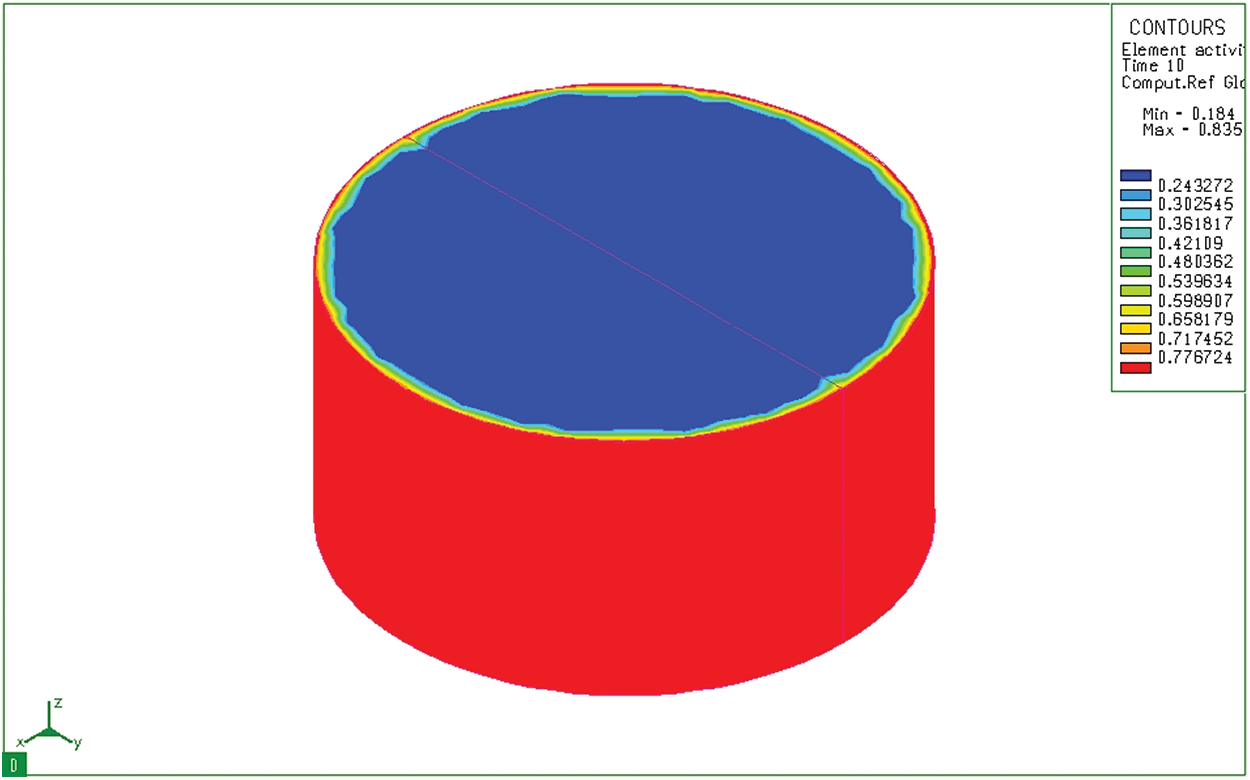
Figure 6: Diffusion of carbon at 10 seconds on cylinder sample
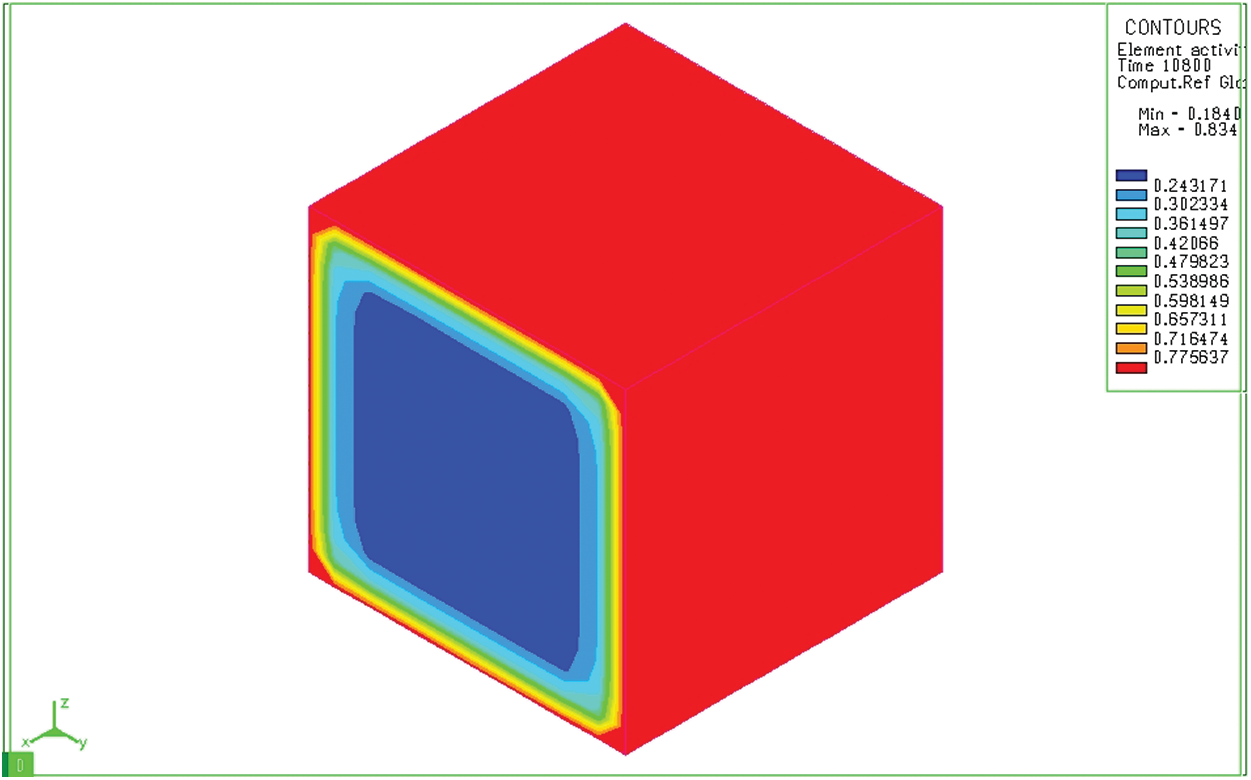
Figure 7: Diffusion of carbon after absorbing for 3 hours on a bulk sample
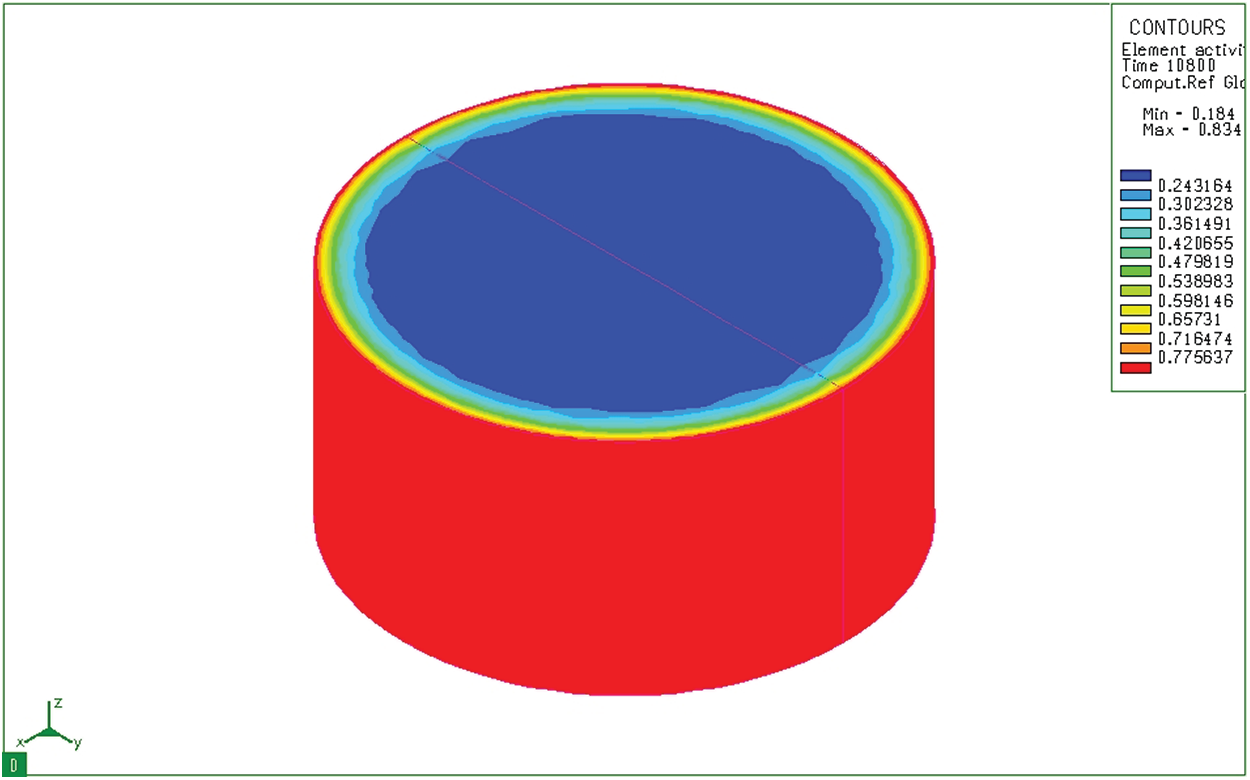
Figure 8: Diffusion of carbon after 3 hours infiltration on cylinder sample
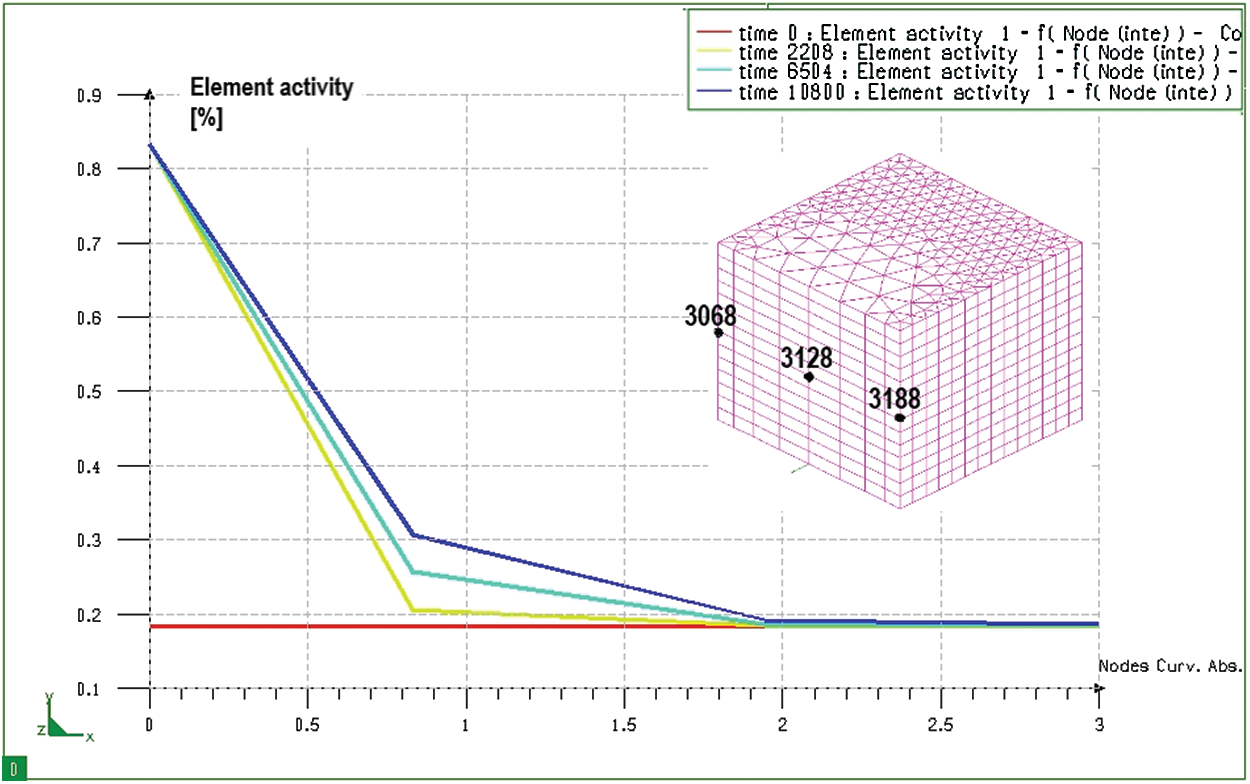
Figure 9: Graph of distribution of carbon content when seeping at different times on the block sample, from node 3068 to node 3128 (from the surface to the inside of the core)
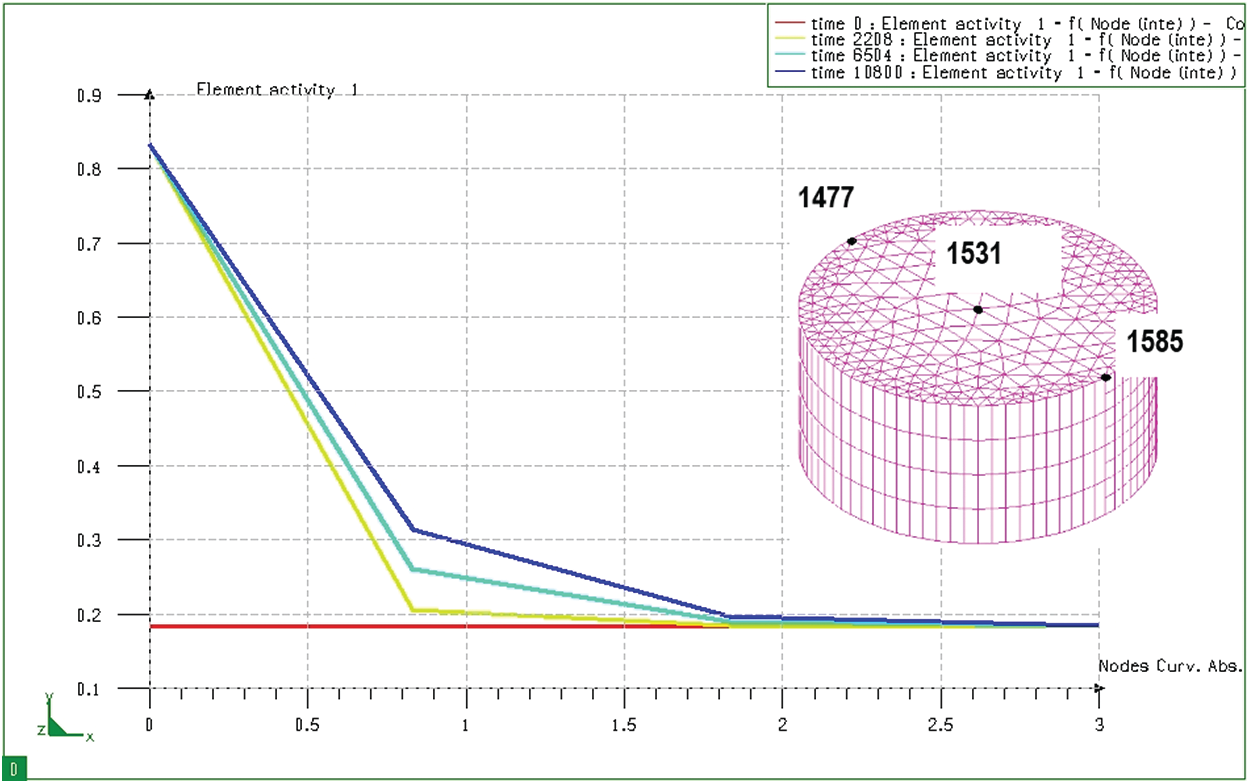
Figure 10: Graph of distribution of carbon content when seeping at different times on cylinder sample, from node 1585 to node 1531 (from the surface to the core)
Fig. 6 shows the distribution of carbon content in a cylindrical sample 10 seconds after the sample has been placed in the furnace. We see that although the depth of diffusion is still not great, the carbon concentration on the surface has reached the maximum value (0.8348%). Results of simulation of the carbon permeability process at 10 seconds both cylindrical and bulk samples show the carbon concentration on the surface of the sample. This carbon concentration is similar to that of the permeable environment. The carburizing process revealed only a thin layer of carbon adhered to the surface layer of the sample. After absorbing time of 3 hours, activated carbon from the absorbent medium diffuses into the model with a great depth (Fig. 7). Like the block sample, on the cylindrical sample (Fig. 8), after 3 hours of absorbing, the diffused carbon into the model also reaches a relatively large depth. The thickness of the region with a carbon concentration above 0.5% is also larger than that of the previous time. However, the cube pattern shows that at sharp angles, the carbon content corresponding to 0.77% is concentrated in the corners. Besides, the cylindrical permeation sample is quite even in all positions. This simulation result is completely consistent with the carburizing principle of the carburizing process when there is a concentration of absorbent elements at sharp corners.
Indeed, with different two models, increasing the carburizing time increases the depth of the permeation layer. However, the depth of the permeation layer at the corner point of the block sample is greater than that of other locations. This is not the case with a cylindrical sample. The above-mentioned results could be explained because, at the angular positions of the block sample, the permeable and diffusion process is more easily. This effect is known as the “spike effect” in the carburizing process.
Studying the variation of carbon content after permeating each determined time, it can be known the diffusion path of carbon and its content at all positions in the model. Fig. 9 shows the distribution of carbon content at different times and different positions from the surface to the core. It can be seen that, after 3 hours of permeability, the carbon has diffused deeply into the block sample about 2 mm from the absorbent surface. However, the depth of the permeate layer with carbon concentration greater than 0.5% is only 0.5 mm. In the rest of the core, the carbon content remains unchanged (0.184%).
Fig. 10 shows the change of carbon content from the surface of the cylinder sample after 3 hours (with the same permeability as the block sample mentioned above). It can be seen that the diffusion depth and carbon concentration distribution of these two samples are the same. That is, the diffusion depth and carbon concentration distribution in the absorbent sample do not depend on the size of the absorbent sample but they only depend on the carburizing technology parameters. From the results of determining the distribution of the permeability layer, it shows that the carbon distribution of the permeable layer in both samples is similar and similar to the calculation results determined above. When determining the carbon concentration of the seepage in both samples, we can see that the depth of the seepage at the same period is similar.
3.2 Simulating the Quenching Process after Carburizing
The purpose of carbon permeability is to enrich the surface layer of the machine part carbon to improve their mechanical properties and increase their service life. However, after permeability, a subsequent heat treatment is usually required such as low quenching to improve the mechanical properties of samples. The post-permeation low-alloy steel quenching environment is usually hot oil at temperature of 60–
The simulation results in Fig. 11 show the surface temperature change of the quenched sample in hot oil (at node 3188). Based on the graph, we can see that the cooling rate in the first stage is quite large. After only about 10 seconds, the surface layer temperature has decreased from
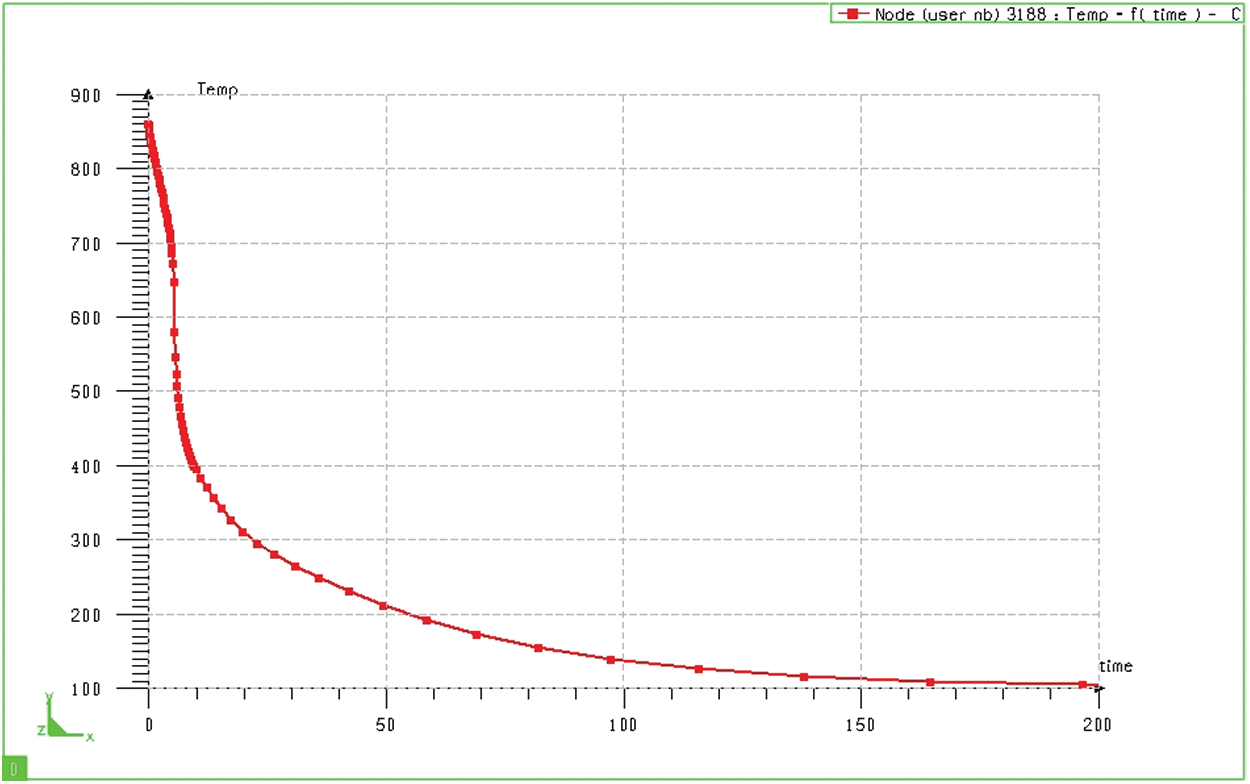
Figure 11: Change of sample surface temperature when quenched in oil (bulk sample)
3.2.2 Distribution of Structure when Tempering
The rate of quenching is of great importance in phase transition in metals. It determines the microstructure, particle size, residual stress, and thereby it affects the properties and workability of parts after tempering. Phase 1 is the initial microstructure before the calculation, Phase 2 is the bainite microstructure (B), Phase 3 is the martensite microstructure (M), Phase 4 is the ferrite/pearlite (F/P) mixed microstructure, Phase 5 is the microstructure after tempering, and Phase 6 is the residual austenitic microstructure (A).
Along with martensite, a banite-typed microstructure also appears when the sample is rapidly cooled. However, in this case (Fig. 12), the bainite is hardly presented because they only appear inside the core—where the cooling rate is not great. Indeed, the largest bainite content is only 0.3995%. Therefore, it can be seen that, in this case, after carburizing and quenching in hot oil (
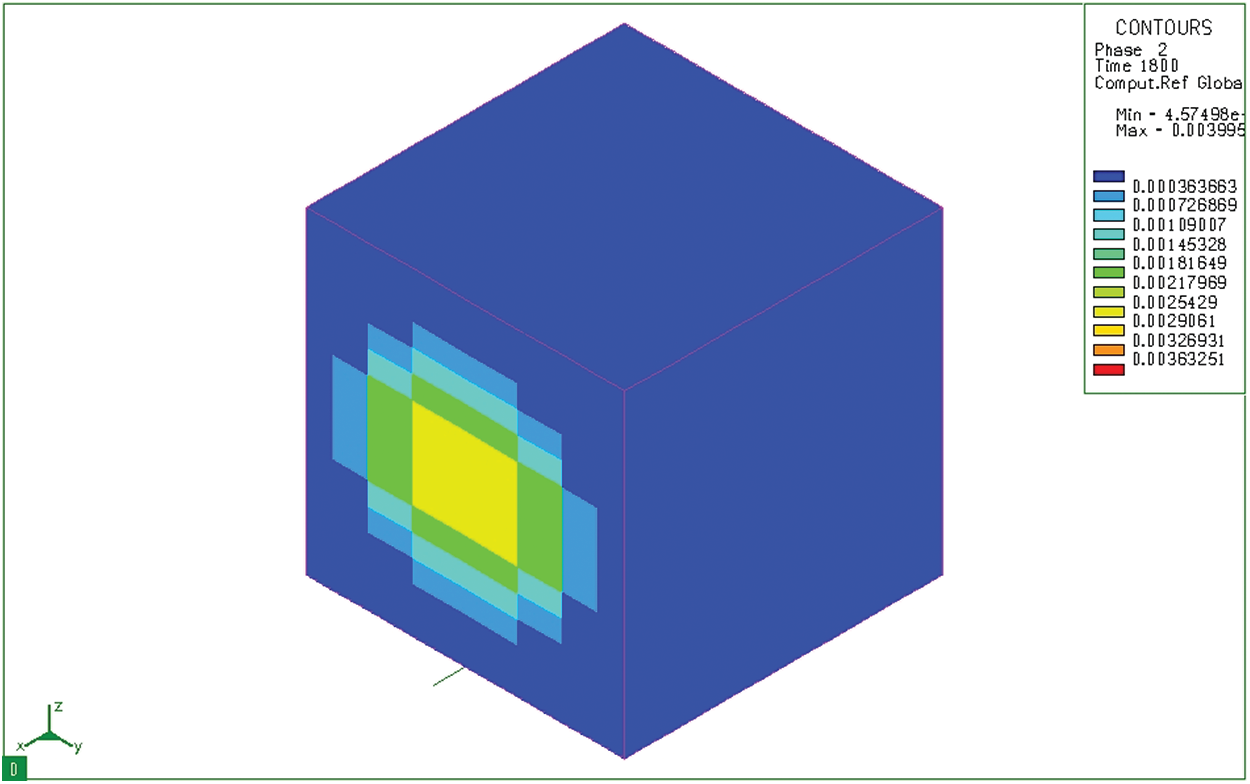
Figure 12: Bainite microstructure distribution (Phase 2) after tempering
Martensite is the structure that always appears on the surface’s sample during quenching and tempering steel. Fig. 13 shows the distribution of martensite structure after carburizing, quenching in hot oil and tempering of 20CrMo steel. In this case, the martensite is formed at the surface layer and reaches the maximum value of 91.7%. In the surface layer, the martensite content is much larger than that in the core (only about 61% in the core). The analytical data of the proportion of martensites formed on the surface layer show that a certain amount of martensite is formed on the surface layer after permeability. These results are consistent with the carbon content on the surface layer calculated above.
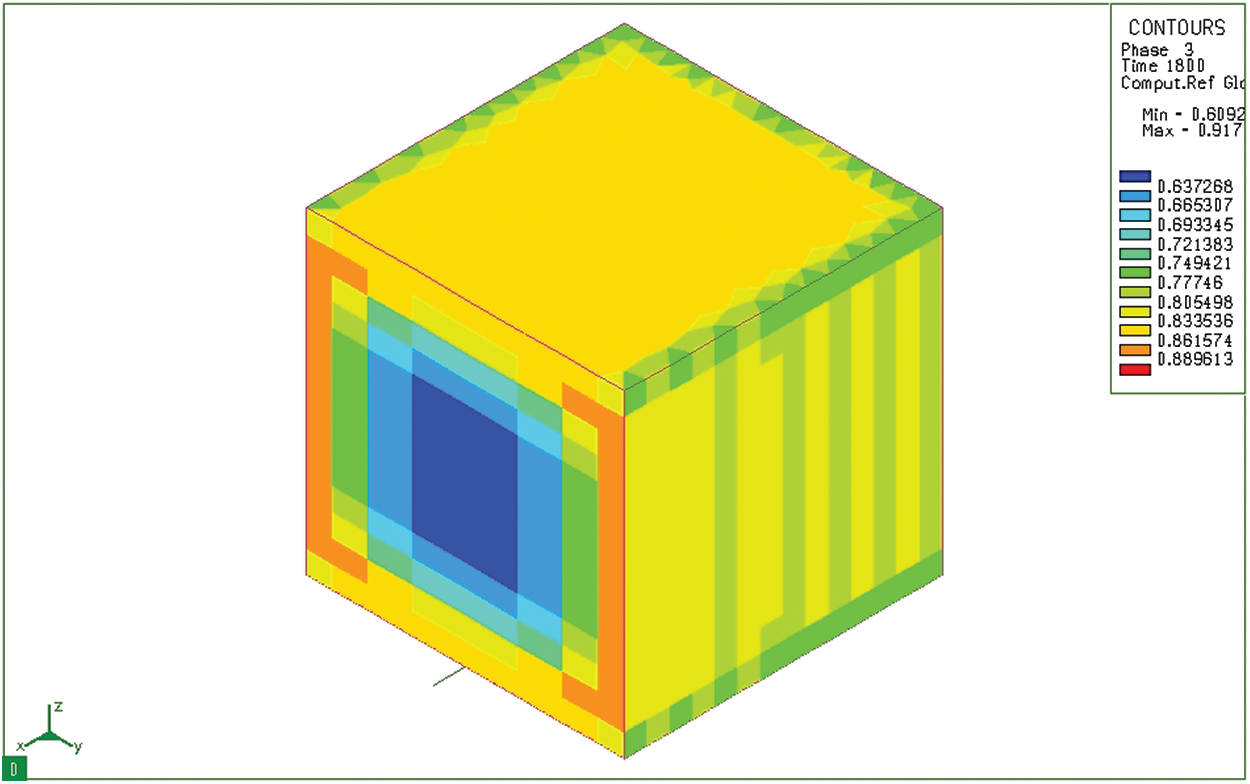
Figure 13: Martensite microstructure distribution (Phase 3) after tempering
Fig. 14 shows the distribution of ferrite/pearlite mixture after carburizing and tempering of 20CrMo steel in hot oil. It could be seen that the ferrite/pearlite content in the surface layer is very small (3.48%) and this fraction in the core is very large. The large distribution of ferrite/pearlite in the core could be because the quenching temperature is
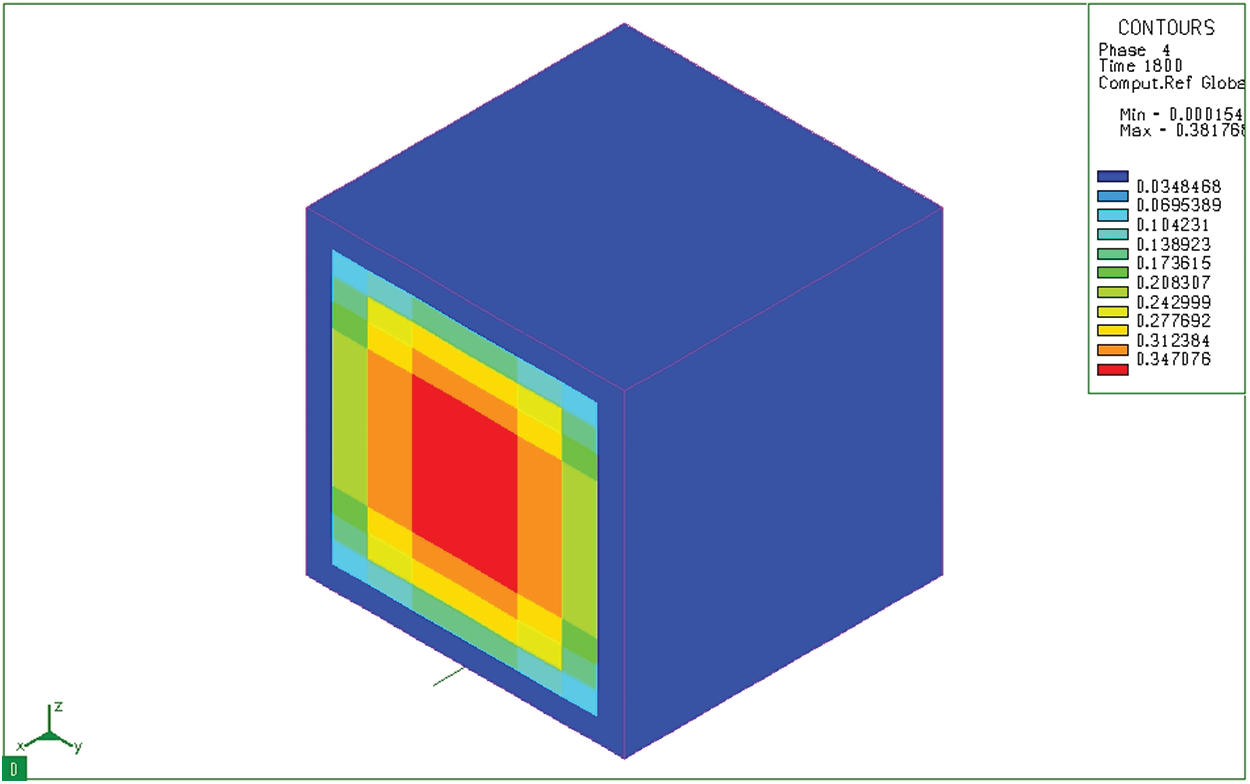
Figure 14: Ferrite/pearlite fusion (Phase 4) distribution after tempering
The produced products are not only mainly martensite but also residual austenite. Fig. 15 shows the distribution of residual austenite in a mass sample from 20CrMo steel after carburizing, quenching in hot oil (
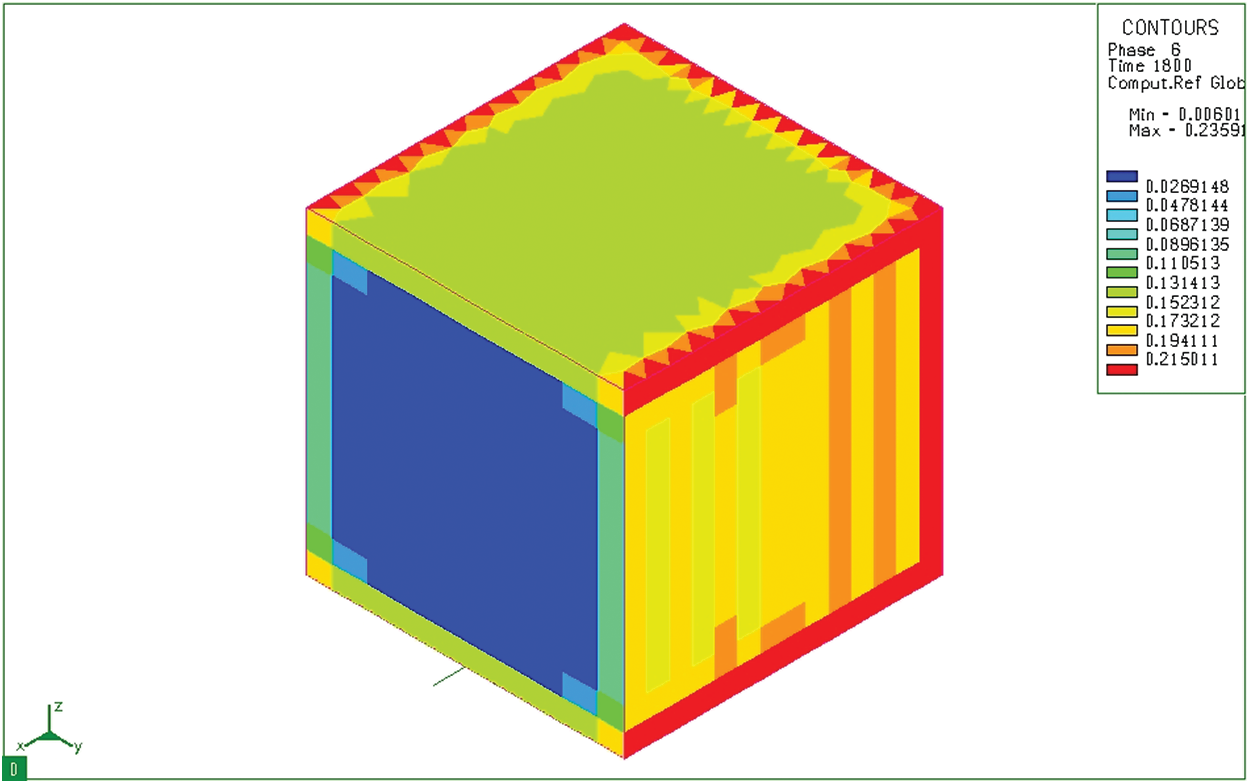
Figure 15: Distribution of residual austenite (phase 6) after tempering
Simulations by SYSWELD show the progression of phase transformation at any position in the research model. Fig. 16 depicts the phase transition process at node 3188 on the boundary of the model during the quenching process. It could be seen that the following product on the model boundary, in which, in this case, it consists of only two residual martensites and austenite (the ferrite/pearlite composite content in the surface layer is extremely small with the blue line lying close to the horizontal axis). The simulation results also show that after immersing the sample in hot oil for about 18 seconds, the transition from austenite to martensite begins. The transformation speed in the next phase (from 20 seconds to about 70 seconds) is quite large, after which the phase transformation speed decreases. After about 150 seconds from my start, the microstructure is almost stable (no longer phase transitions).
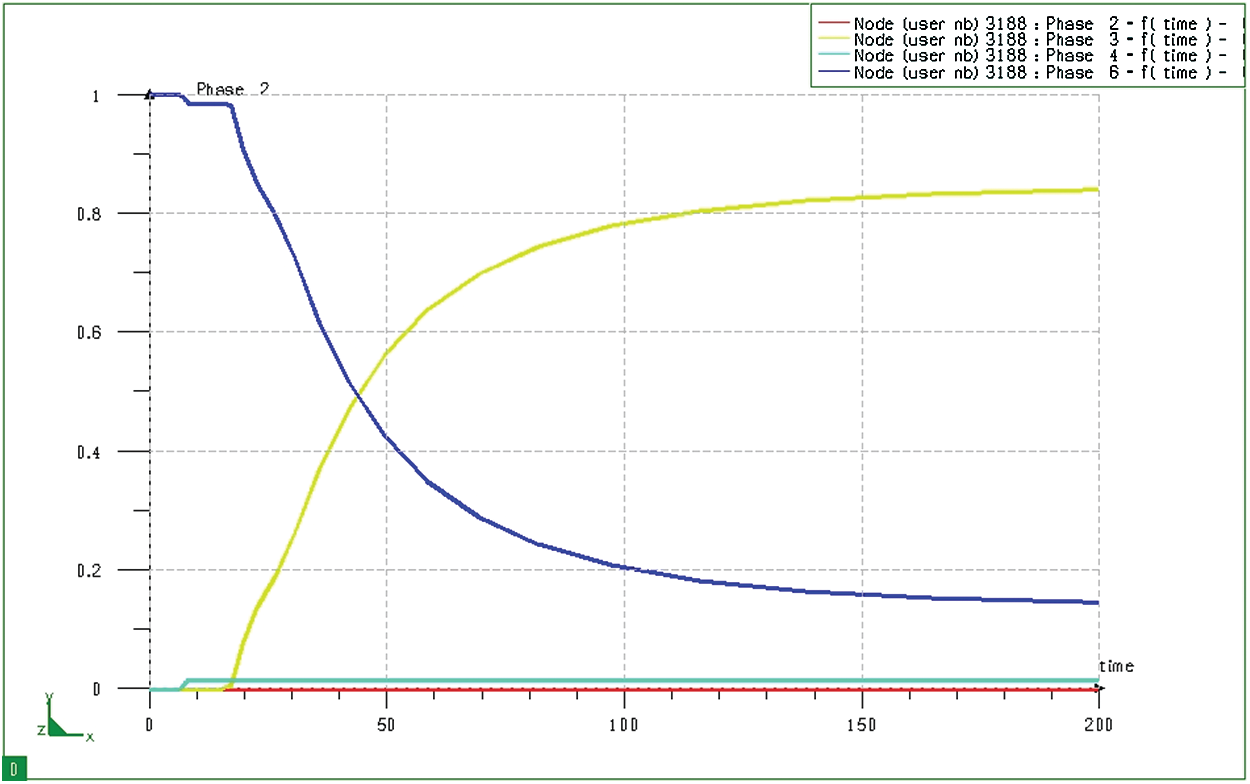
Figure 16: Diagram of phase transition at node 3188 (at the surface) of block sample when quenching
Fig. 17 depicts the phase transformation process when quenching at node 3128 (in the core) of the model during the 20CrMo steel hardening process after the carburizing process. The simulation results show that, after quenching, the phase transformation in the core of the model (Fig. 17) is much different from that in the surface layer (Fig. 16). In this case, the core of the model consists of only two bodies, martensite and ferrite/pearlite, without residual austenite. It is explained that the selected temperature (
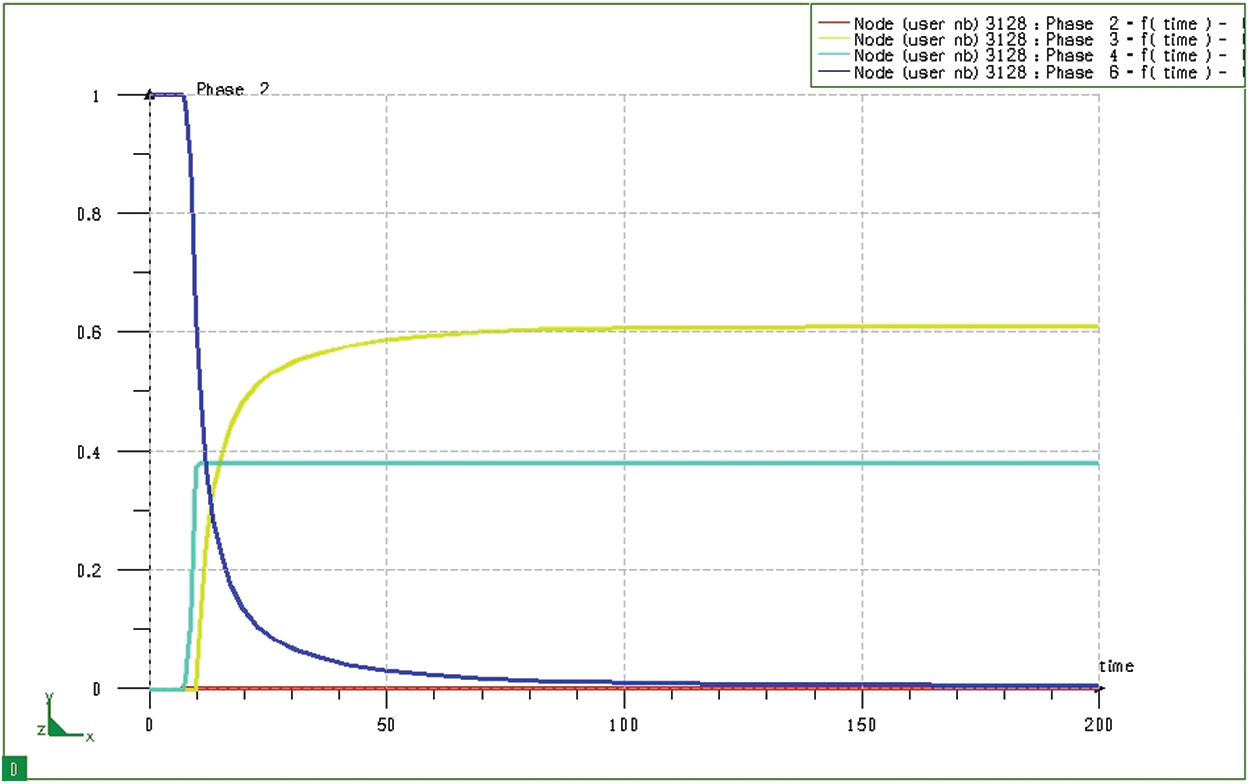
Figure 17: Diagram of phase transformation at node 3128 (at the core) of the block sample when quenching
By calculating techniques and simulating the carburizing process, the article has identified the depth of the 20CrMo steel layer of 0.5 mm after absorbing for 03 hours. Next, the composition of phases at different positions in the permeable steel was also determined. On the surface of the steel after carburizing, the main microstructure was the martensite with a content percentage of up to 91.7%. The external measurement level was much higher than that of the core (around 61%). Finally, the distribution of ferrite/pearlite content in the surface layer was 3.48%, which was also much smaller than that in the core (around 38.17%). Using the simulation technique, the residual austenite content after quenching was measured at 23.591% and most of this residual austenite was concentrated on the surface of steel after carburizing. However, this work has not determined the stress distribution as the simulation has only been used to analyze the carbon permeability process. These processes need to continue being studied to characterize the distribution of elements in the carburizing process as well as to determine the structural characteristics of the formed permeability layer.
Acknowledgement: This research is supported by Industrial University of Ho Chi Minh City (IUH) under grant number 68/HĐ-ĐHCN. Additionally, the authors are grateful to Ho Chi Minh City University of Technology (HUTECH), Vietnam Maritime University, Hanoi University of Science and Technology for providing necessary facilities during the research.
Funding Statement: The authors received no specific funding for this study.
Conflicts of Interest: The authors declare that they have no conflicts of interest to report regarding the present study.
References
[1]X. D. Pham, A. T. Hoang and D. N. Nguyen, “A study on the effect of the change of tempering temperature on the microstructure transformation of Cu-Ni-Sn alloy,” International Journal of Mechanical & Mechatronics Engineering, vol. 18, no. 4, pp. 27–34, 2018. [2]M. Ashraf, A. Abbas, S. Zia, Y. M. Chu, I. Khan et al., “Computational analysis of the effect of nano particle material motion on mixed convection flow in the presence of heat generation and absorption,” Computers Materials and Continua, vol. 65, pp. 1809–1823, 2020. [3]A. T. Hoang, V. V. Le, A. X. Nguyen and D. N. Nguyen, “A study on the changes in microstructure and mechanical properties of multi-pass welding between 316 stainless steel and low-carbon steel,” Journal of Advanced Manufacturing Technology, vol. 12, no. 2, pp. 25–40, 2018. [4]Y. Sun, Y. Yuan, Q. Wang, S. Ji, L. Wang et al., “Impact force magnitude and location recognition of composite materials,” Computers Materials and Continua, vol. 64, no. 3, pp. 1329–1342, 2020. [5]A. T. Hoang, D. N. Nguyen and V. V. Pham, “Heat treatment furnace for improving the weld mechanical properties: Design and fabrication,” International Journal of Mechanical Engineering and Technology, vol. 9, no. 6, pp. 496–506, 2018. [6]D. Papagianni and M. A. Wahab, “Multi-scale analysis of fretting fatigue in heterogeneous materials using computational homogenization,” Computers Materials and Continua, vol. 62, no. 1, pp. 79–97, 2020. [7]D. N. Nguyen, A. T. Hoang, M. T. Sai, M. Q. Chau and V. V. Pham, “Effect of Sn component on properties and microstructure Cu-Ni-Sn alloys,” Jurnal Teknologi, vol. 80, no. 6, pp. 43–51, 2018. [8]W. Dal’Maz Silva, J. Dulcy, J. Ghanbaja, A. Redjaïmia, G. Michel et al., “Carbonitriding of low alloy steels: Mechanical and metallurgical responses,” Materials Science and Engineering A, vol. 693, pp. 225–232, 2017. [9]S. D. Catteau, H. P. Landeghem, J. Teixeira, J. Dulcy, M. Dehmas et al., “Carbon and nitrogen effects on microstructure and kinetics associated with bainitic transformation in a low-alloyed steel,” Journal of Alloys and Compounds, vol. 658, pp. 832–838, 2016. [10]H. J. Stone, M. J. Peet, H. K. D. H. Bhadeshia, P. J. Withers, S. S. Babu et al., “Synchrotron X-ray studies of austenite and bainitic ferrite,” Proc. of the Royal Society A: Mathematical, Physical and Engineering Sciences, vol. 464, pp. 1099–1027, 2008. [11]V. A. Esin, B. Denand, Q. L. Bihan, M. Dehmas, J. Teixeira et al., “In situ synchrotron X-ray diffraction and dilatometric study of austenite formation in a multi-component steel: Influence of initial microstructure and heating rate,” Acta Materialia, vol. 80, pp. 118–131, 2014. [12]X. D. Pham, A. T. Hoang, D. N. Nguyen and V. V. Le, “Effect of factors on the hydrogen composition in the carburizing process,” International Journal of Applied Engineering Research, vol. 12, no. 19, pp. 8238–8244, 2017. [13]O. I. Khalaf and G. M. Abdulsahib, “Frequency estimation by the method of minimum mean squared error and P-value distributed in the wireless sensor network,” Journal of Information Science and Engineering, vol. 35, no. 5, pp. 1099–1112, 2019. [14]G. M. Abdulsahib and O. I. Khalaf, “Comparison and evaluation of cloud processing models in cloud-based networks,” International Journal of Simulation–Systems, Science & Technology, vol. 19, no. 5, pp. 1–6, 2018. [15]X. Xiang, Q. Li, S. Khan and O. I. Khalaf, “Urban water resource management for sustainable environment planning using artificial intelligence techniques,” Environmental Impact Assessment Review, vol. 86, pp. 106515, 2021. [16]O. I. Khalaf and G. M. Abdulsahib, “Energy efficient routing and reliable data transmission protocol in WSN,” International Journal of Advances in Soft Computing and its Applications, vol. 12, no. 3, 2020. [17]S. Wei, G. Wang, X. Zhao, X. Zhang and Y. Rong, “Experimental study on vacuum carburizing process for low-carbon alloy steel,” Journal of Materials Engineering and Performance, vol. 23, no. 2, pp. 545–550, 2014. [18]D. A. Lesyk, S. Martinez, B. N. Mordyuk, V. V. Dzhemelinskyi, A. Lamikiz et al., “ Post-processing of the Inconel 718 alloy parts fabricated by selective laser melting: Effects of mechanical surface treatments on surface topography, porosity, hardness and residual stress,” Surface and Coatings Technology, vol. 381, pp. 125136, 2020. [19]E. J. Mittemeijer, “Steel Heat treating Fundamentals and Processes,” ASM Handbook A, vol. 4, 2013. [20]C. J. Stevens, “Power transfer via metamaterials,” Computers Materials and Continua, vol. 33, no. 1, pp. 1–18, 2013. [21]J. P. Yun, S. Choi and S. W. Kim, “Vision-based defect detection of scale-covered steel billet surfaces,” Optical Engineering, vol. 48, no. 3, pp. 37205, 2009. [22]S. Zanoni and L. Zavanella, “Model and analysis of integrated production-inventory system: The case of steel production,” International Journal of Production Economics, vol. 93, pp. 197–205, 2005. [23]S. W. Webb and K. Pruess, “The use of Fick’s law for modeling trace gas diffusion in porous media,” Transport in Porous Media, vol. 51, no. 3, pp. 327–341, 2003. [24]X. Liu, J. Chen and H. Hou, “Theoretical analysis of water diffusivity estimated by crank’s equation,” Chemical Engineering and Processing: Process Intensification, vol. 55, pp. 24–28, 2012. [25]P. Kula, K. Dybowski, E. Wolowiec and R. Pietrasik, “Boost-diffusion’ vacuum carburising-Process optimisation,” Vacuum, vol. 99, pp. 175–179, 2014. [26]M. K. Pham, D. N. Nguyen and A. T. Hoang, “Influence of vanadium content on the microstructure and mechanical properties of high-manganese steel,” International Journal of Mechanical & Mechatronics Engineering, vol. 18, no. 2, pp. 141–147, 2018. [27]O. Karabelchtchikova and R. D. Sisson, “Carbon diffusion in steels: A numerical analysis based on direct integration of the flux,” Journal of phase equilibria and diffusion, vol. 27, no. 6, pp. 598–604, 2006. [28]Y. Wang, J. Gong, D. Rong and F. Gao, “Measurement and calculation of carbon concentration and diffusion-induced stress in stainless steel after low temperature gas carburizing,” Acta Metallurgica Sinica, vol. 50, no. 4, pp. 409–414, 2014. | This work is licensed under a Creative Commons Attribution 4.0 International License, which permits unrestricted use, distribution, and reproduction in any medium, provided the original work is properly cited. |