DOI:10.32604/cmc.2021.015085
| Computers, Materials & Continua DOI:10.32604/cmc.2021.015085 | |
| Article |
Deep Trajectory Classification Model for Congestion Detection in Human Crowds
1Department of Computer Engineering, College of Computing and Information Systems, Umm Al-Qura University, Makkah, Saudi Arabia
2Department of Computer Science, National University of Technology, Islamabad, Pakistan
3Science and Technology Unit, Umm Al-Qura University, Makkah, Saudi Arabia
4Institute of Consulting Research and Studies, Umm Al-Qura University, Makkah, Saudi Arabia
*Corresponding Author: Faizan Ur Rehman. Email: fsrehman@uqu.edu.sa
Received: 06 November 2020; Accepted: 02 February 2021
Abstract: In high-density gatherings, crowd disasters frequently occur despite all the safety measures. Timely detection of congestion in human crowds using automated analysis of video footage can prevent crowd disasters. Recent work on the prevention of crowd disasters has been based on manual analysis of video footage. Some methods also measure crowd congestion by estimating crowd density. However, crowd density alone cannot provide reliable information about congestion. This paper proposes a deep learning framework for automated crowd congestion detection that leverages pedestrian trajectories. The proposed framework divided the input video into several temporal segments. We then extracted dense trajectories from each temporal segment and converted these into a spatio-temporal image without losing information. A classification model based on convolutional neural networks was then trained using spatio-temporal images. Next, we generated a score map by encoding each point trajectory with its respective class score. After this, we obtained the congested regions by employing the non-maximum suppression method on the score map. Finally, we demonstrated the proposed framework’s effectiveness by performing a series of experiments on challenging video sequences.
Keywords: Crowd congestion; trajectory; classification; crowd analysis
Public gatherings, such as concerts, political and religious processions, festivals and sports, etc., are commonly observed in human societies. Often, thousands of participants end up gathering in a limited space. Although these public gatherings are organized for peaceful purposes, crowd disasters occur frequently. For example, during the Hajj in 2015, a stampede killed more than 700 people died. A similar event happened during the Love Parade in 2010 and at a religious procession in Baghdad in 2005 [1].
It is imperative to monitor the crowded scene to prevent disasters. For this, hundreds of surveillance cameras are installed in different places to cover the area efficiently. Crowd management’s current practice is based on manual analysis that requires tremendous human effort to review incoming video streams to identify potential abnormal situations [2]. Such manual analysis of the crowd is tedious and leads to errors due to limited human capabilities. The other complementary approach is based on experiments. Researchers manually analyze recorded videos and employ different models to simulate pedestrians’ behaviour [3,4], particularly to identify and predict choke points. Such empirical studies are always useful and result in infrastructure improvements [5]. However, these models suffer from the following limitations: (1) Simulations cannot simultaneously cover different real-time crowd situations. (2) These models cannot provide precise results: They provide only limited responses to other input parameters.
An alternative approach is to automatically analyze crowded scenes in real-time by employing computer vision and machine-learning techniques. Several methods and techniques have been proposed for automated analysis [6]. This has numerous applications, such as anomaly detection [7,8], panic detection [9,10], counting [11,12], density estimation [13,14], and tracking [15,16]. Generally, during the past few years, each of these applications has attracted considerable attention from the research community, and various algorithms and methods have been proposed. However, congestion detection in high-density crowded videos has not received adequate attention in the existing literature.
Congestion is a prolonged temporal situation wherein many people cannot move at their desired speeds [17]. Timely detection of congested regions is essential for efficient crowd management systems. If congestion is not addressed well in time, it may cause a cascading effect and lead to disasters. Despite its importance, only a limited amount of work [1,18,19] has been reported in the literature that automatically detects regions in high density crowded scenes. Significantly, none of these studies has explored crowd congestion detection using pedestrian trajectories with deep learning.
In this paper, we propose a deep learning framework for detecting congestion in crowds. The pipeline of the proposed framework is shown in Fig. 1. First, we divided the input video stream into multiple overlapped video segments. We extracted dense trajectories from each part and generated a spatio-temporal image that effectively characterizes relative motion in the respective video segment. Then, we employed a Convolutional Neural Network (CNN) to extract hierarchical features from the fully connected layer and learn more about the influence representation of trajectories. CNN classifies each spatio-temporal image into two classes, i.e., ‘congested’ and ‘normal’. After classification, we generated a score map by encoding them with their respective class scores. We followed this by applying the non-maximum suppression method on the score map to obtain a congested region(s) in the given video segment.
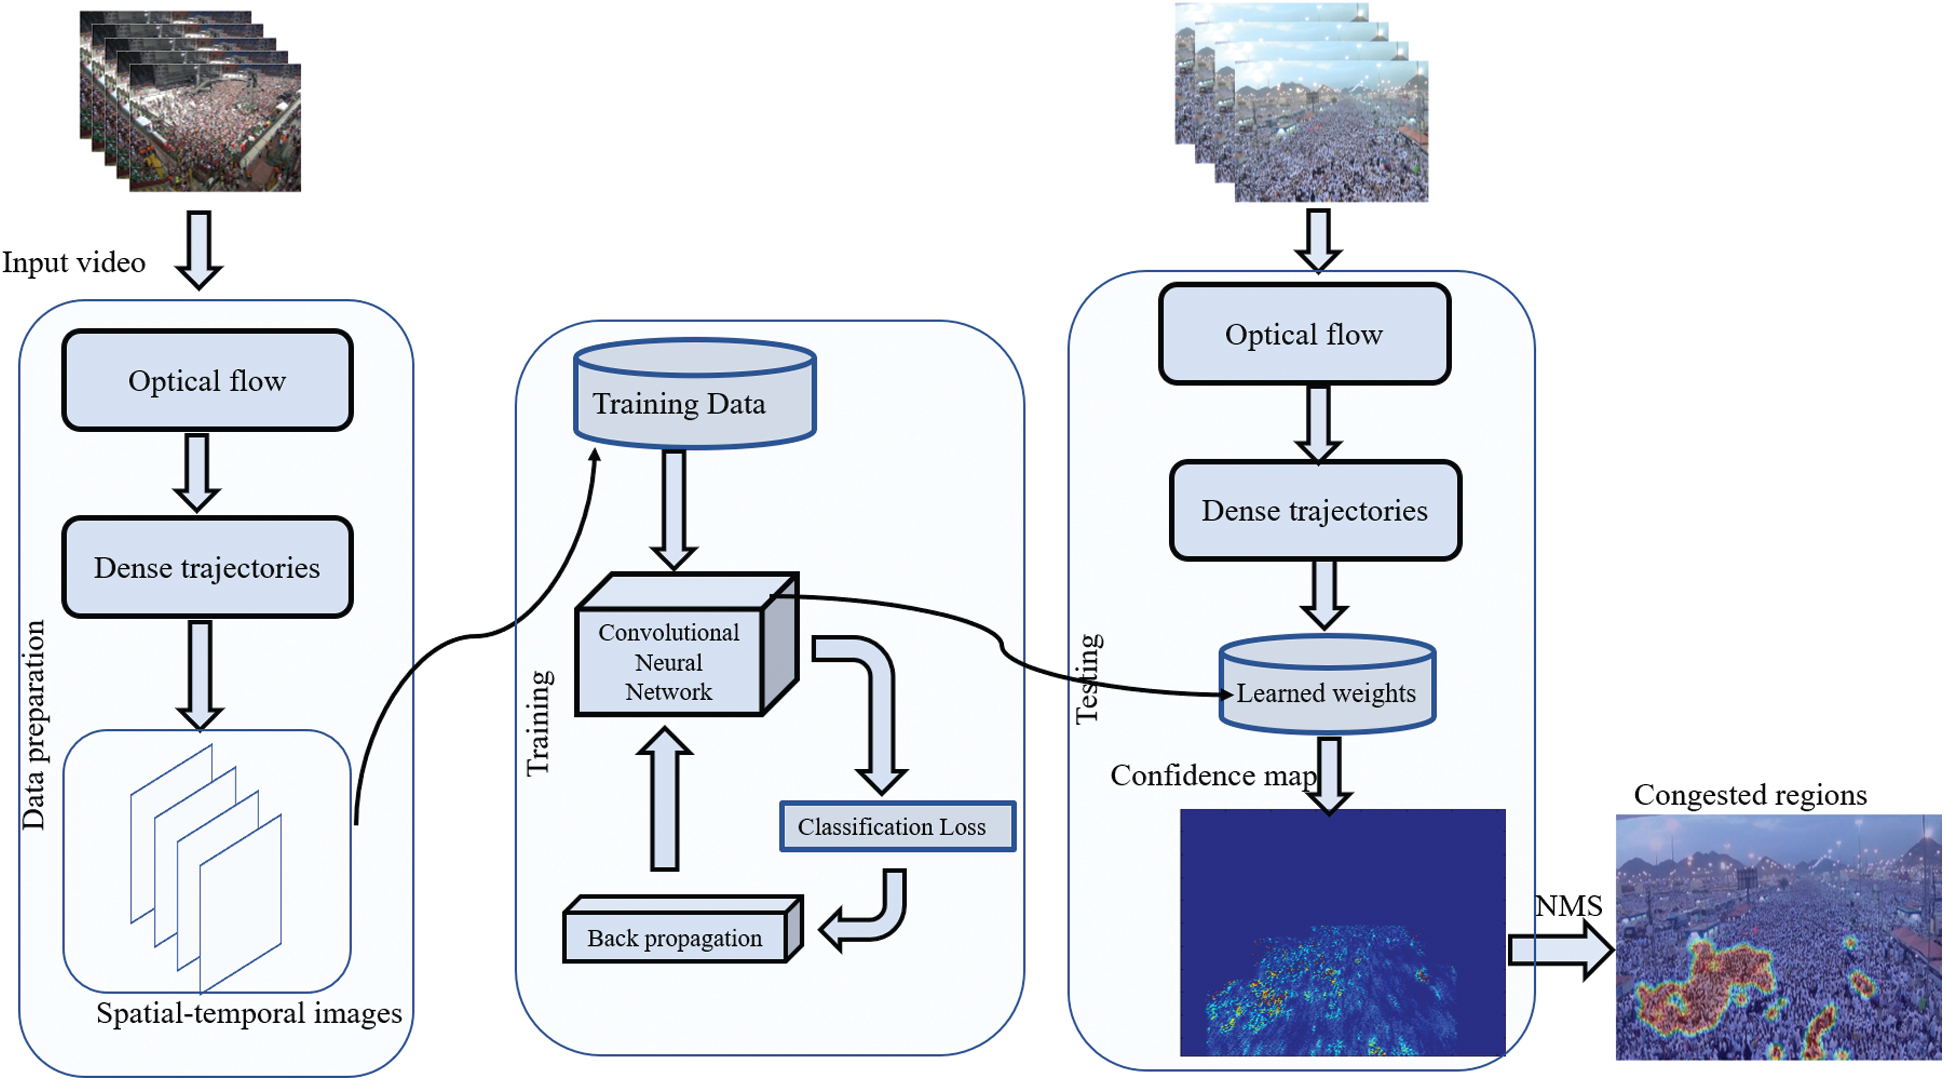
Figure 1: Illustrates the pipeline of proposed framework
Comparison and Differences with other methods
We summarize the differences between the proposed framework and other existing methods in the following manner:
a) State-of-the-art primarily adopted unsupervised machine-learning approaches for classifying the scene into two categories, i.e., ‘congested’ and ‘normal’ [1,18]. We discard the traditional machine-learning techniques and propose a convolutional neural network that our empirical studies have shown to be a better counterpart.
b) The previous methods use holistic approaches to extract hand-crafted [19] features from the whole image. In contrast, our network undertakes a robust and compact representation of trajectories by learning hierarchical features from spatio-temporal images.
c) The previous methods cannot deal with complex scenes since they were trained for limited scenarios due to datasets’ unavailability. We introduced our model on a large dataset that enhanced its discriminative power of detecting congestion in complex scenes.
Contribution
a) This paper has proposed a novel approach to detect and localize congested regions in videos using spatio-temporal images.
b) Instead of extracting hand-crafted [19] features from trajectory data, we achieved effective representation of the trajectory using 2-D spatio-temporal images and shifted the problem to image classification.
c) We are amongst the first to create and build a dataset of spatio-temporal images generated from trajectory data.
d) We performed an extensive evaluation of the proposed framework in different scenarios, thereby confirming its effectiveness.
Crowd management is a significant area of research wherein scholars have been working for several years. Numerous techniques have been used to analyze crowds, like simulation and modelling or Computer Vision techniques. Computer Vision is a relatively new technique for analyzing gatherings and has produced marvellous results in the last decade. The essential analysis activities are counting individuals, tracking, and exploring the crowd’s behavior. Several methods from different fields have been applied to the problem of crowd management. Examples include disaster risk reduction and crowd simulation [6,20]. Simulation is one of the most used methods to analyze crowds. Zhan et al. [21] and Jacques et al. [22] describe crowd analyses using simulation.
Computer Vision (CV) has played an essential role in crowd management for the past many years. The evaluation of these techniques is highly dependent on the dataset used during experimentation. Vision-based crowd analysis focuses on four significant aspects, as shown in Fig. 2: (i) Counting, (ii) Tracking, (iii) Behaviour, and (iv) Congestion Detection.
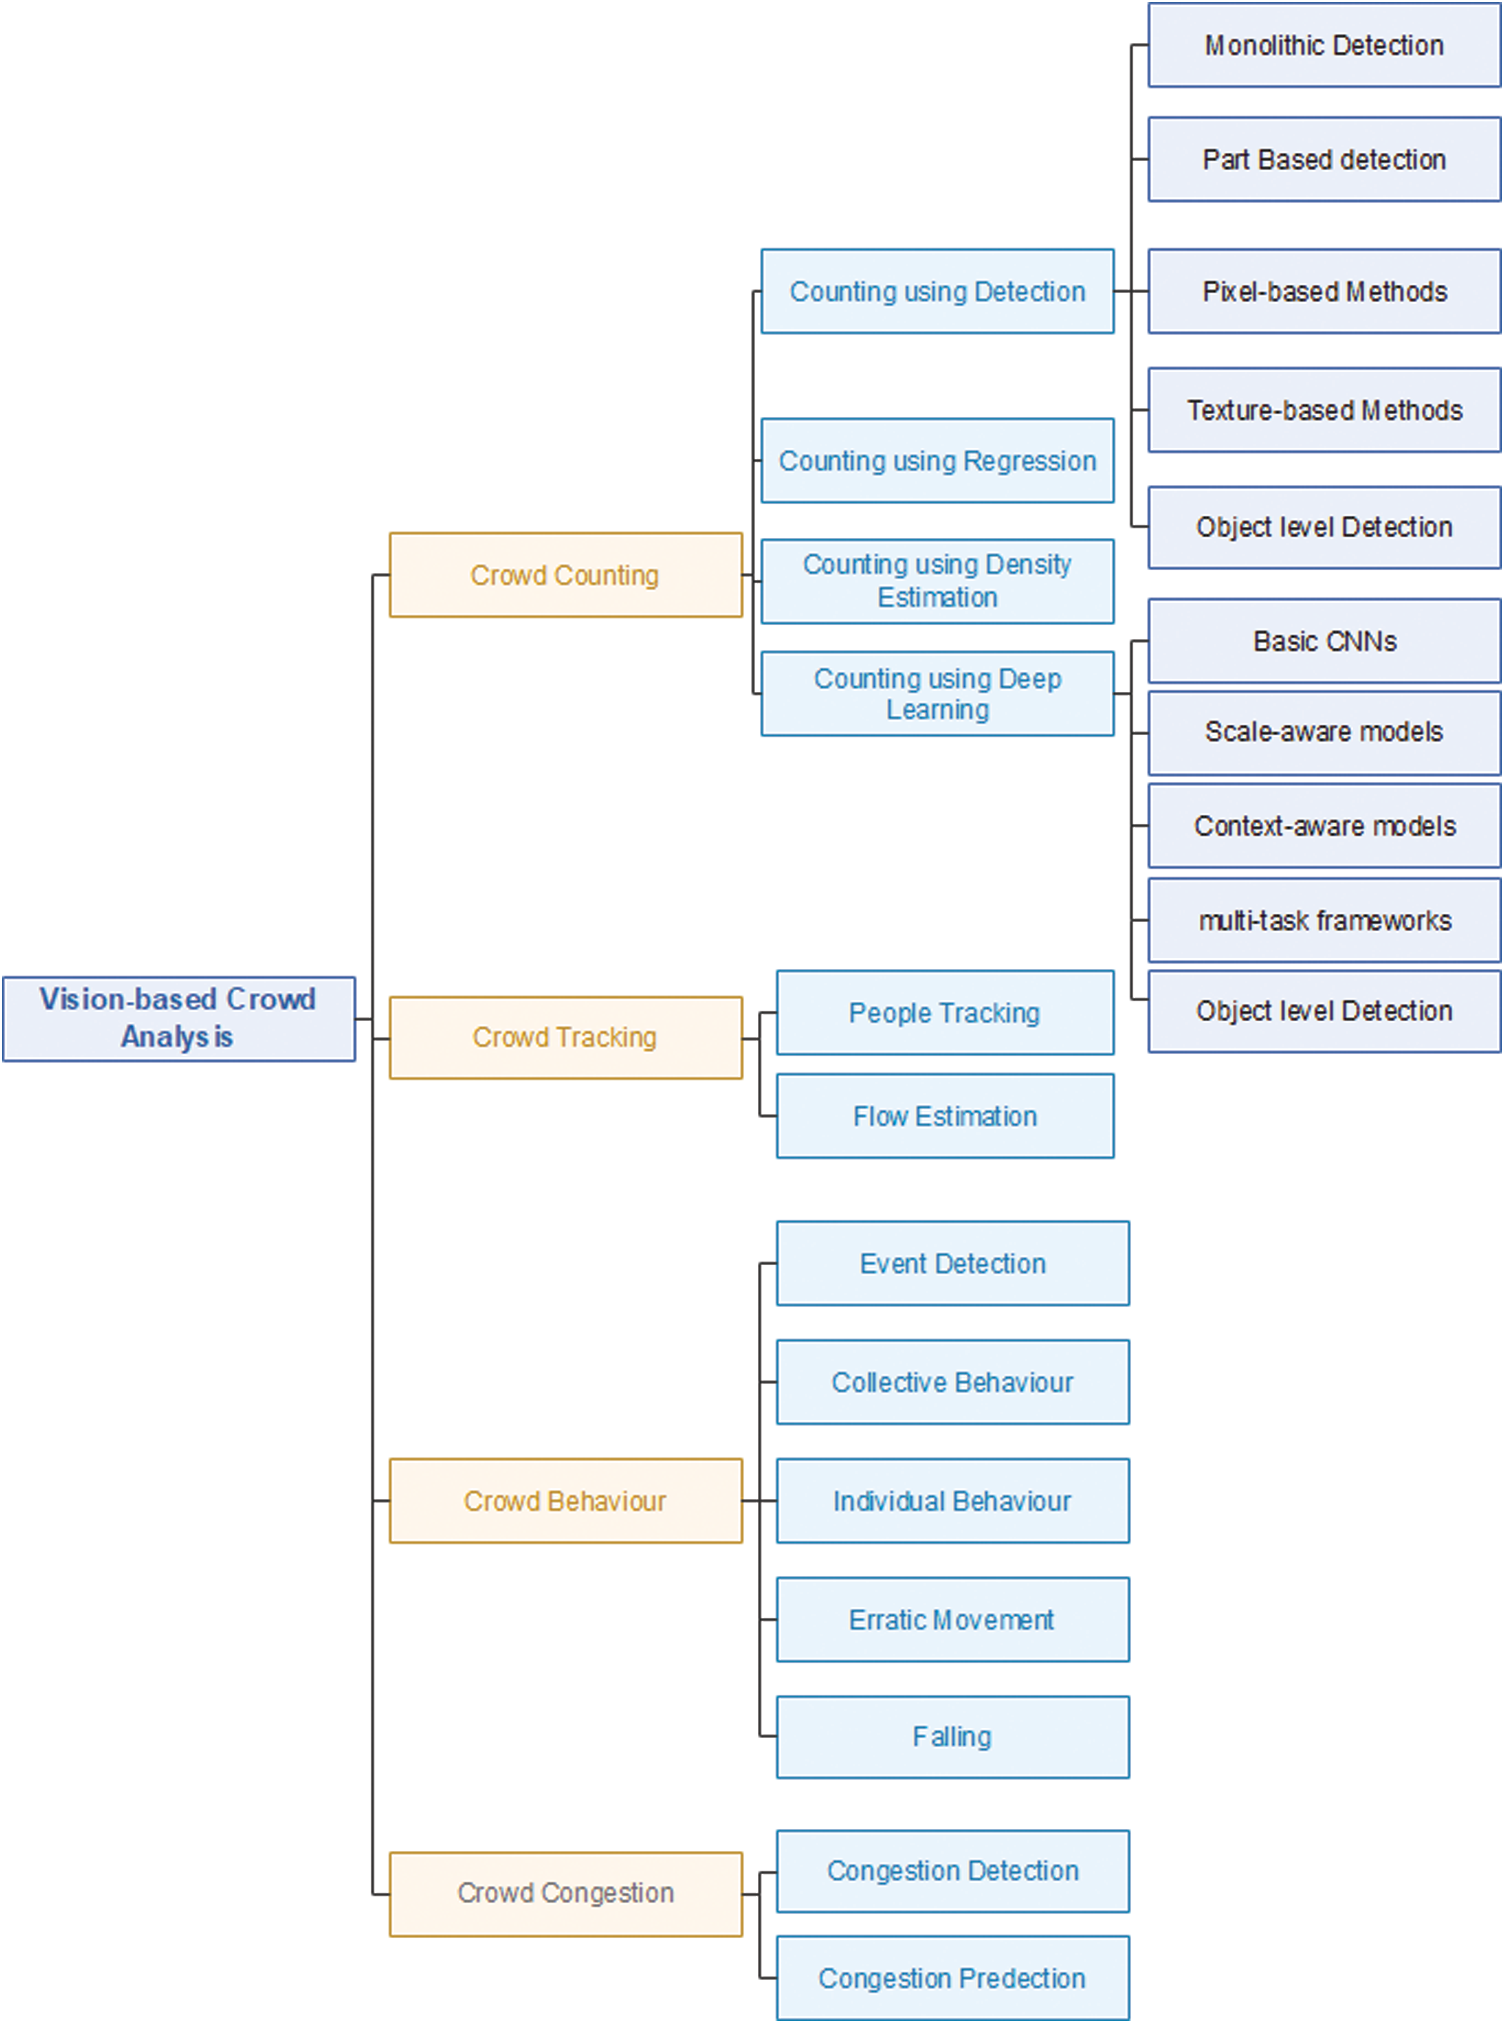
Figure 2: Vision-based crowd analysis
Computer Vision-based Crowd Counting uses multiple approaches to count people in a scene. Crowd Counting can be achieved via direct methods, such as-detecting faces or body parts. Indirect detection can be done by estimating crowd density ranges. Along with traditional approaches [23], some advanced techniques—object density map, regression techniques, monolithic, part-based, pixel-based, texture-based, and deep learning-based methods—are also used for crowd counting.
Crowd Counting—using density maps—bypasses all the difficulties arising from image occlusion. Lempitsky et al. [24] proposed a crowd counting method based on density maps. Similarly, some other researchers [25,26] found object density maps effectively for crowd counting. Kang et al. [27] provided a comprehensive comparison of crowd counting using density maps, wherein density values were calculated from low-level features, even as information location was maintained. Lempitsky et al. [24] introduced a linear model that predicts the pixel’s density value from the extracted part. Kang et al. [28] proposed a computer vision-based framework to count the people in Tawaf.
Regression-based methods work more efficiently as compared to tracking-based and detection-based methods. Regression-based counting uses image features for counting. Idress et al. [29] used multiple sources like SIFT, heat detector confidence, and frequency domain analysis. They found that a single source is not enough for counting in distorted and severe occlusion datasets. One of the drawbacks of this technique is the lack of location information; hence, it cannot be used for object localization [30]. Arteta et al. [25] used ridge regression (RR) for the interactive counting of people.
Regression-based methods can be improved by applying the Convolutional Neural Network (CNN). These methods use density maps generated from images. Zhang et al. [31] proposed a CNN model that uses switchable alternative learning for crowd counting and density maps. They presented a Multi-column Convolutional Neural Network (MCNN) trained to estimate crowd density in still images. Sindagi et al. [32] proposed the Contextual Pyramid CNN (CP-CNN) that created good quality density images by incorporating contextual information with a density map. Xiong et al. [33] proposed Convolutional LSTM (convLSTM) to improve count accuracy using spatial and temporal information.
Advancement in deep learning improves results significantly in people-detection, counting, and tracking. Deep CNN is a model in which features are extracted from the lower-level layers up to the final layer. Nowadays, faster R-CNN [34] algorithms are used widely to count the crowd.
People tracking in videos is crucial for Computer Vision. The tracking algorithm is useful in video surveillance. Tracking can be done using multiple cameras or a single camera. State-of-the-art approaches for multi-view [35–37] uses multiple cameras to monitor the object, while the single-view method [38–40] uses a single camera but provides lesser information. Khanloo et al. [41] combined motion and colour features to track people.
The behaviour of the crowd is an essential feature in video analytics. Studies discuss a lot of approaches to analyze crowd behaviour in real-time and offline videos. Some of the most common approaches are optical flow [42,43], particle flow [44], streaklines flow [45,46], spatio-temporal features [47,48], and tracklets [49,50]. These approaches determine the collective behaviour of the crowd. Saqib et al. [51] developed a framework that took multiple snapshots from videos of the moving Haram crowd and extracted crowd density and directional flow information by applying an unsupervised hierarchical clustering algorithm.
Crowd congestion-detection is another area where computer vision can play an influential role. Unfortunately, very little work has been done on congestion-detection and prediction using computer vision. Khan et al. [52] proposed a computer vision-based framework that estimates crowd density, detects congestion-levels, and identifies dominant patterns using videos from the IP cameras installed in Masjid al-Haram. They also proposed a congestion-detection mechanism [19] using multiple overlapping temporal segments of equal duration. The trajectories extracted from these segments are used to calculate the oscillation map to identify critical congestion areas in videos.
Another challenging task is anomaly detection to sense any casualty in crowded scenes. Initially, the anomaly is detected using hand-crafted features and object trajectories [53,54]. Abnormal courses are obtained from the motion of humans that serve as features. Due to the advancement of deep neural networks, feature extraction has become more representative than hand-crafting.
Similarly, Yang et al. [55] proposed an anomaly detection approach based on the deep learning generative model. Hasan et al. [56] used convolutional AEs on spatio-temporal frames to detect anomalies. The LSTM based CAEs are also based on convolutional AEs used to detect anomalies [57].
Our proposed framework discards traditional machine-learning approaches and recommends a Convolutional Neural Network (CNN). In contrast to holistic approaches to extract hand-crafted features from the whole image, our network learns a robust and compact representation of trajectories by extracting hierarchical features from spatio-temporal images. Moreover, we have trained the model on a large dataset that has enhanced its discriminative power of detecting congestion in complex scenarios.
The input to the proposed framework is a video sequence. The framework divides this sequence into several overlapping temporal segments, where the length of each part is L. Let V represent an input video sequence. We divided the video sequence V into n number of pieces as
To better understand pedestrians’ behaviour, it is vital to obtain accurate, long, and dense trajectories. Such trajectories help capture the pedestrians’ local motion and provide full coverage of the global context. Conventionally, trajectories are extracted by detecting and tracking each individual in the scene. We observed that the performance of this tracking method depends upon the accuracy of a detector. While this works fine in low-density crowds, where half/full pedestrians’ bodies are visible, it is not satisfactory in high-density crowds. This phenomenon explains why researchers tend to avoid this method to understand the dynamics of high-density groups and, instead, adopt holistic approaches by gathering global information [19].
We group the holistic approaches into two categories: (1) Interest point tracking and (2) dense optical flow tracking. In the first category, interest points—for example, corner points, edges of SIFT features—are extracted from the initial frame of a video sequence and tracked through subsequent frames. The trajectories obtained by this method are sparse and cannot provide full coverage of motion in the scene since a limited number of features are generated for tracking. In the second category, the optical flow field is computed between every consecutive frame of the video sequence. Since the flow vector is calculated for every pixel, it provides better coverage of moving crowds in the scene. However, a small change in illumination causes a significant difference in the flow vector. Thus, the trajectories obtained by this method are unreliable.
Accordingly, we have used both the techniques mentioned above and employed KLT [58], Particle Video (PV) [59], Large displacement optical flow method [60], and particle advection [61] techniques to extract motion information from the video. Among these methods, the particle advection approach produces denser trajectories than KLT or Particle Video. It has been widely used in many applications for extracting dense and reliable global motion information. From empirical evidence, we observed that particle advection produces more plausible trajectories, and we adopted this approach in the proposed framework.
The first step is to compute dense optical flow between each consecutive frame of the video sequence to obtain trajectories using the particle advection approach. We employed a popular optical flow technique [62], which calculates the optical flow vector for every pixel using gradient and brightness consistency constraints. Since the flow vector is computed for every pixel of an image, the trajectories obtained by this approach are dense. Generally, dense flow tracking can cause substantial computational costs. To reduce the computation cost, we sampled anchor points from a uniform grid G overlaying the initial frame of the video sequence. Let anchor point
3.2 Spatio-Temporal Image Generation and Classification
Trajectory analysis and classification have played a vital role in object classification and recognition tasks [64–66] and, therefore, obtained considerable importance from the research community. A trajectory can generally be classified using two different ways: (1) Unsupervised clustering and (2) supervised machine-learning. Unsupervised clustering is a data-driven approach, where the trajectories are clustered into other groups based on the similarity measure. This approach finds similar patterns in the input data without using labels that make it impossible to assign a pre-defined class trajectory. Inversely, supervised machine-learning requires labelled samples for training the algorithm that assigns given courses to a pre-defined class. In this paper, we have employed supervised machine-learning for classifying trajectories.
We presented Algorithm 1 that converts the input set of trajectories into corresponding spatio-temporal images. Our method consisted of two steps. In the first step, we reverse the range of lines to fixed-size images. It is vital because trajectory data extracted from different scenes have differing spatial degrees depending on the video frame’s resolution. Generally, CNN requires images of a fixed size. Therefore, we first converted all trajectories to spatio-temporal pictures to the extent that fits the CNN requirement. We then pre-processed each image by subtracting it from the image mean. The input to Algorithm 1 is a set of trajectories represented by
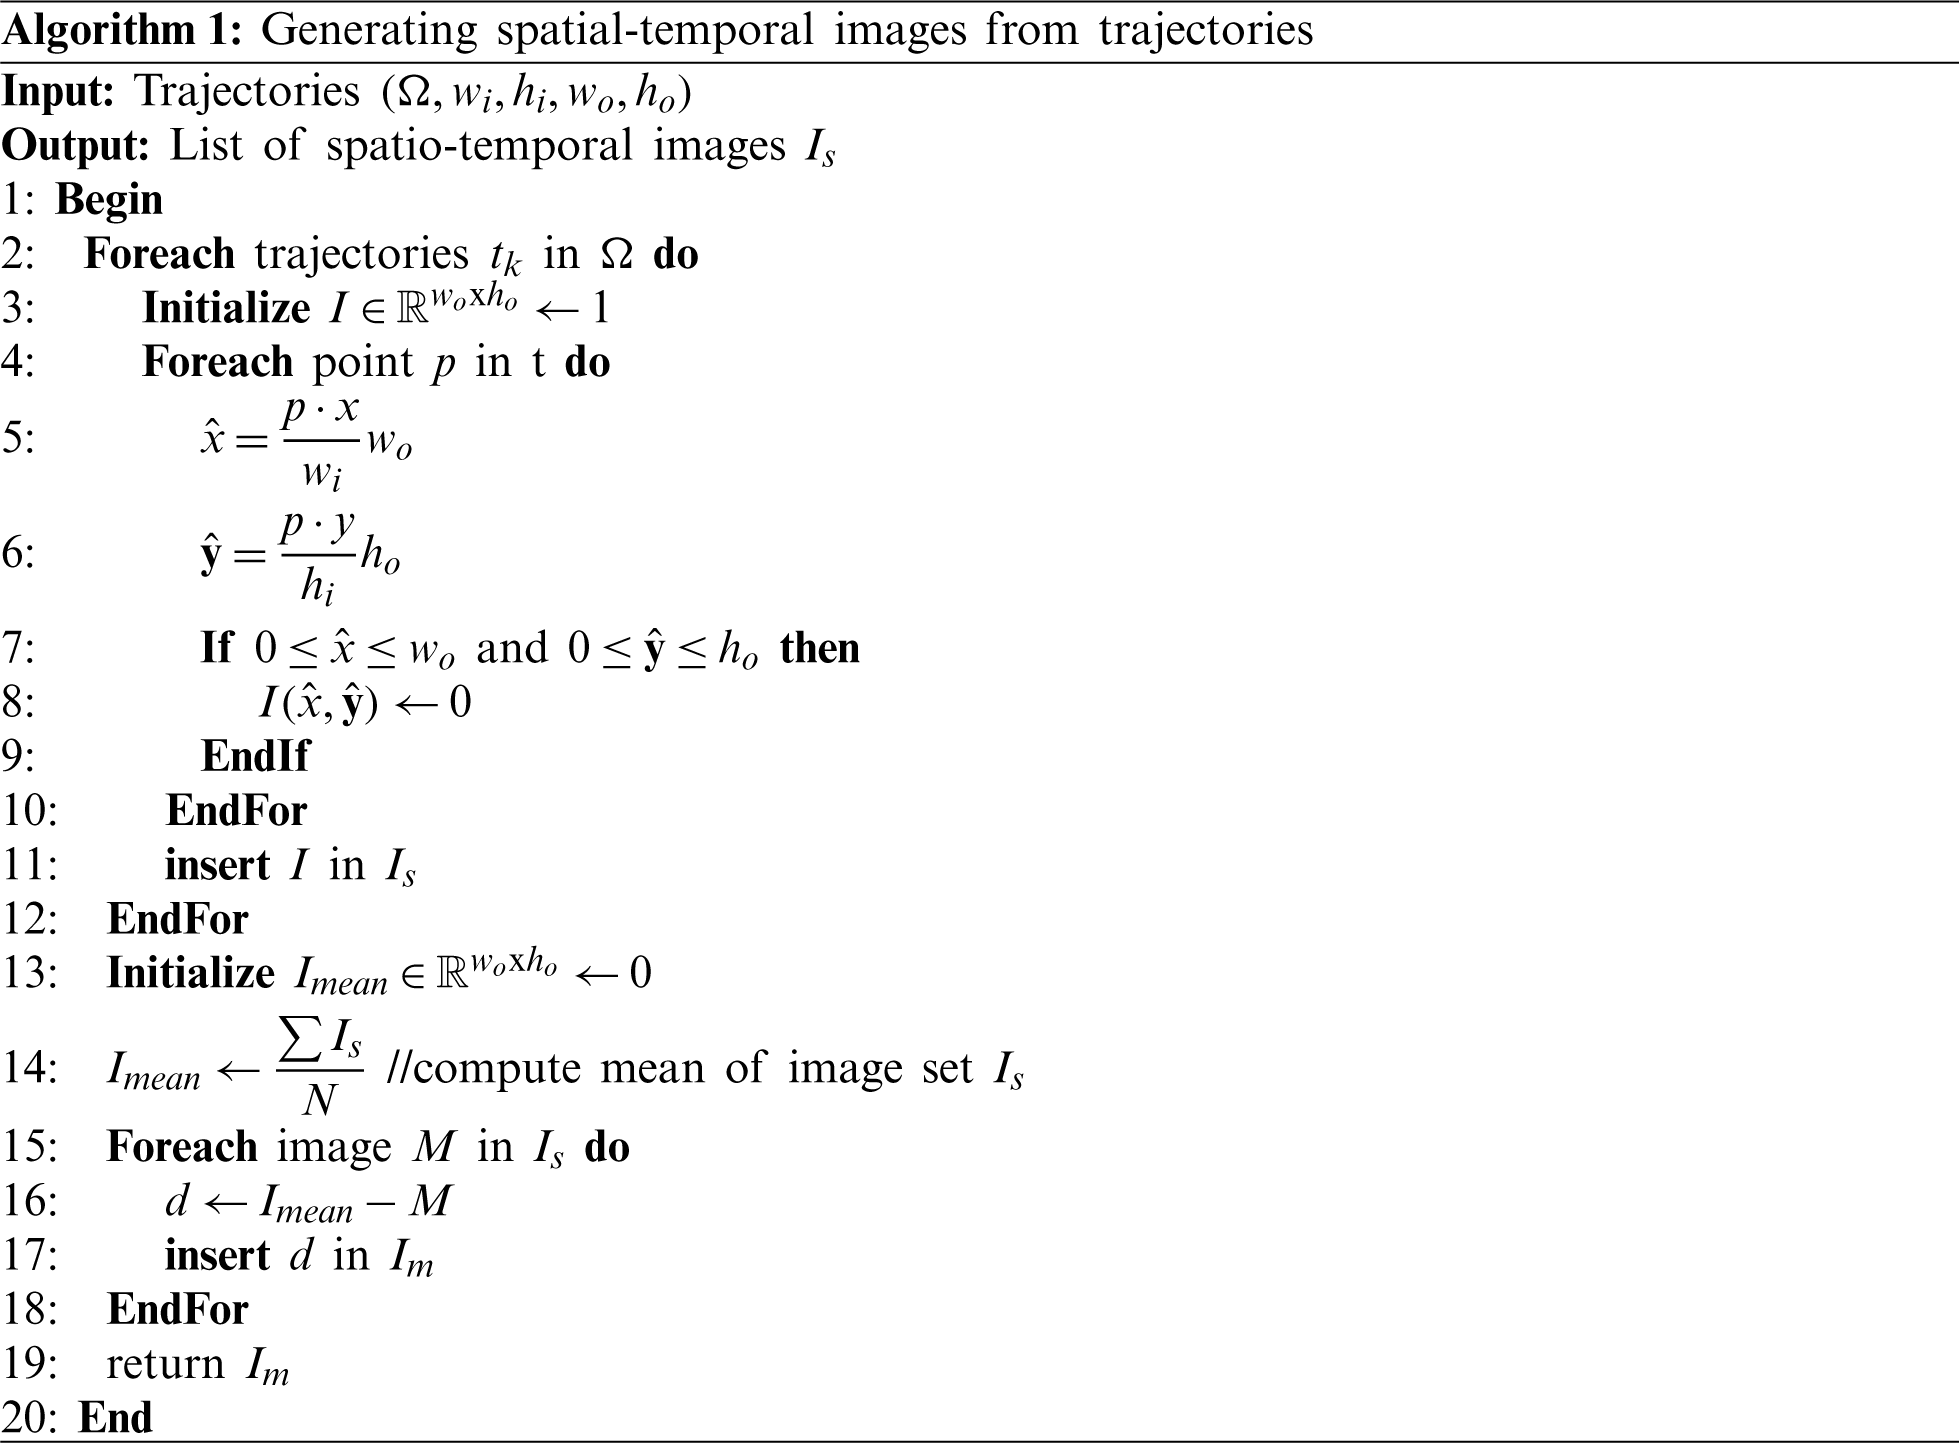
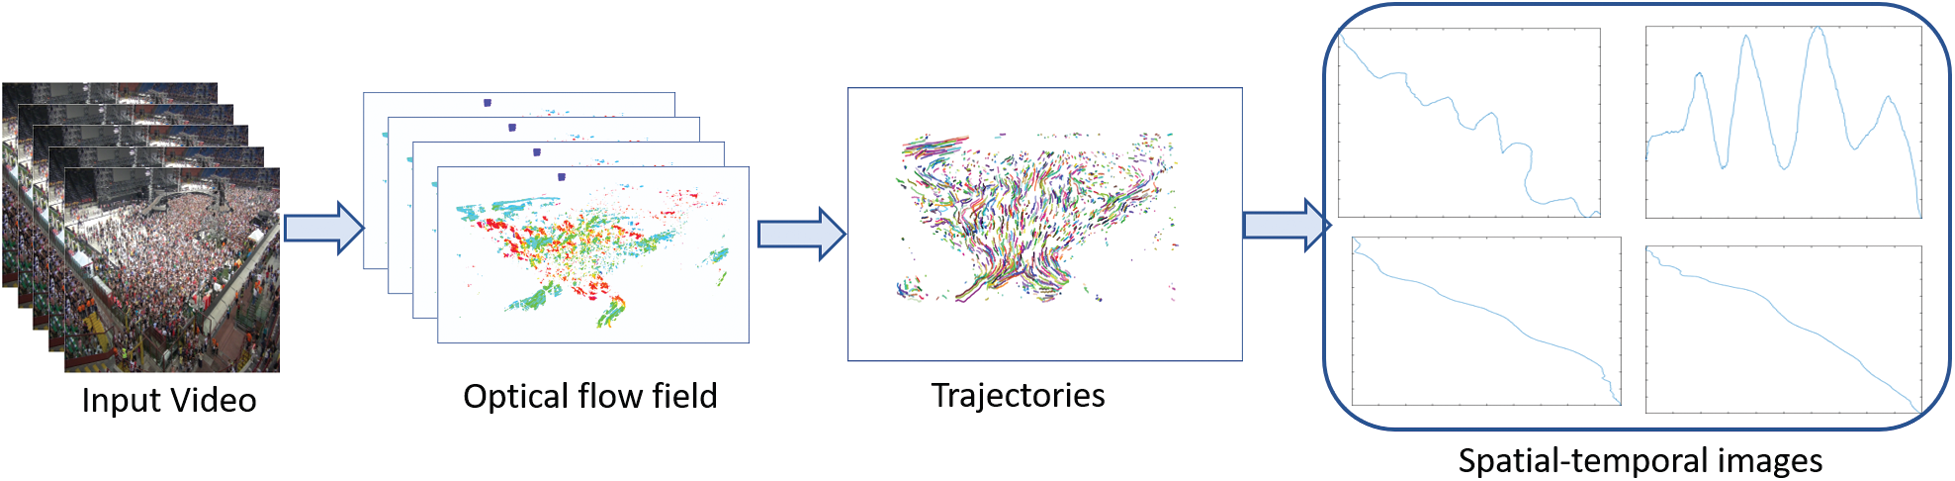
Figure 3: Pipeline of spatial-temporal images generation method
Proposed spatio-temporal images are binary images that contain the connected coordinates of corresponding trajectories’ data, as shown in Fig. 3 and have a white background with black pixels corresponding to the trajectory data. From Fig. 3, it is also apparent that the resultant spatio-temporal images are significantly different from other natural RGB images in the following ways: (1) Natural RGB images are more complex than spatio-temporal pictures since they have three colour channels; (2) RGB images contain creamy texture and high-frequency components while spatio-temporal images lack texture information and most of the image is blank; (3) Due to the lack of texture and colour information, spatio-temporal images belonging to different classes appear similar. Therefore, spatio-temporal images have extensive intraclass similarities compared to natural RGB images.
We introduced a simple yet effective CNN architecture to classify spatio-temporal images. Generally, the architecture of CNN is composed of convolutional, pooling, and fully connected layers. Even though different CNN architectures have been proposed in studies that address distinct recognition and classification tasks, it is still uncertain if CNN can be designed to classify spatio-temporal images. Since spatio-temporal images lack texture and appearance information, we kept the architecture of CNN shallow. Our proposed CNN architecture is similar to VGG-M, consisting of six convolution layers and two fully connected layers. However, due to the uniqueness of spatio-temporal images, we modified the architecture and tuned it accordingly in the following ways:
1. We enhanced the receptive field of VGG-M by increasing the filter size of the first convolution layer. This modification was made to incorporate more context in spatio-temporal images. A small patch from spatio-temporal images may contain only a little information about the trajectory, and most of the image is blank.
2. The original VGG-M accepts 3-channel RGB images, while spatio-temporal images are binary and have only one channel. To make them fit the input size of CNN, we modified the pictures from a single track to a three-channel by copying each image three times.
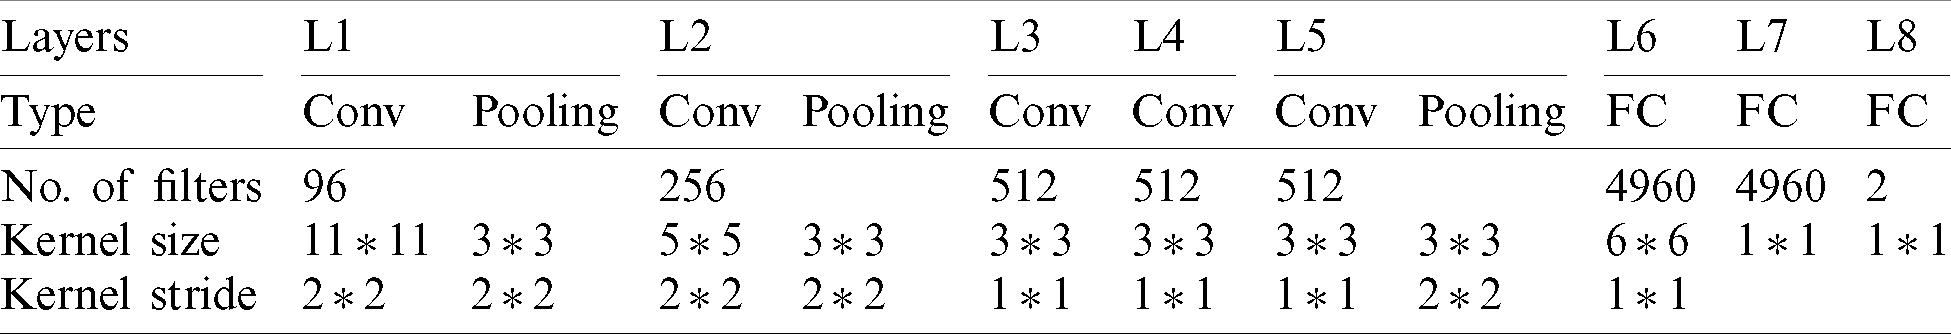
Due to many network parameters and limited training data, overfitting can be a common problem. We adopted the dropout technique [67] to avoid this problem. Generally, a dropout value of 0.5 is considered optimum for most classification problems. However, in our experiments, we kept the dropout value to 0.6 in layers 6 and 7 (fully connected layers). Since we have two classification classes, the last fully connected layer had two outputs. The overall architecture of the proposed CNN is shown in Tab. 1. The stochastic gradient descent learned the weights of different CNN filters with a momentum of 0.6. We limited the batch size of training images to 64. Let
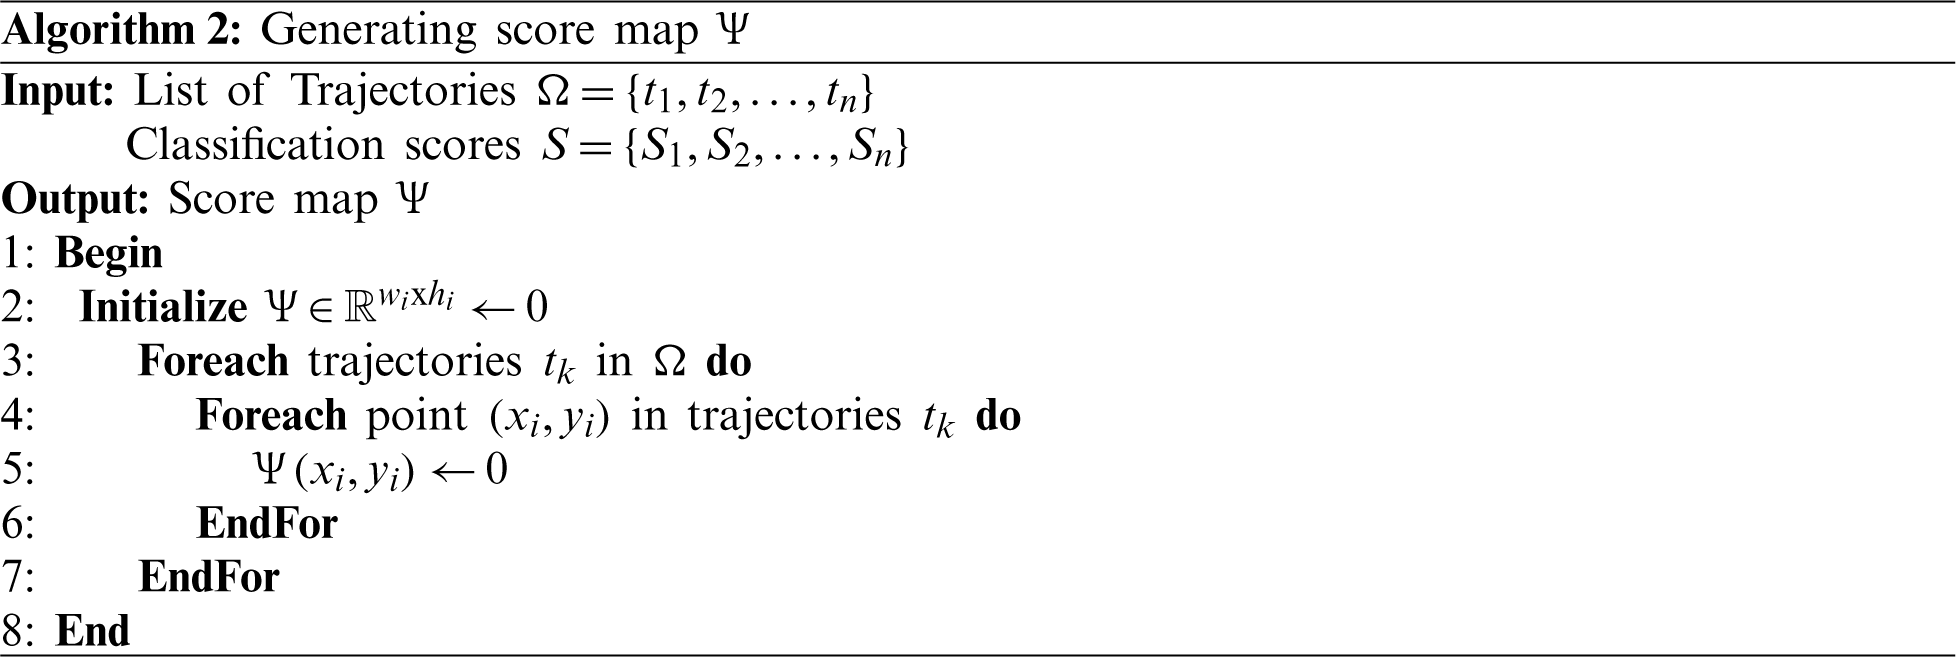
Table 1: Architecture of proposed convolutional neural network
3.3 Congestion Region Detection
For detecting congested regions in the scene, we utilized trajectory information
Input to the algorithm is a set of trajectories
Our score map
Fig. 4a shows the score map with the colour bar. We encoded the higher score with red colour to represent congested and blue to represent non-congested trajectories. After we obtained the score map
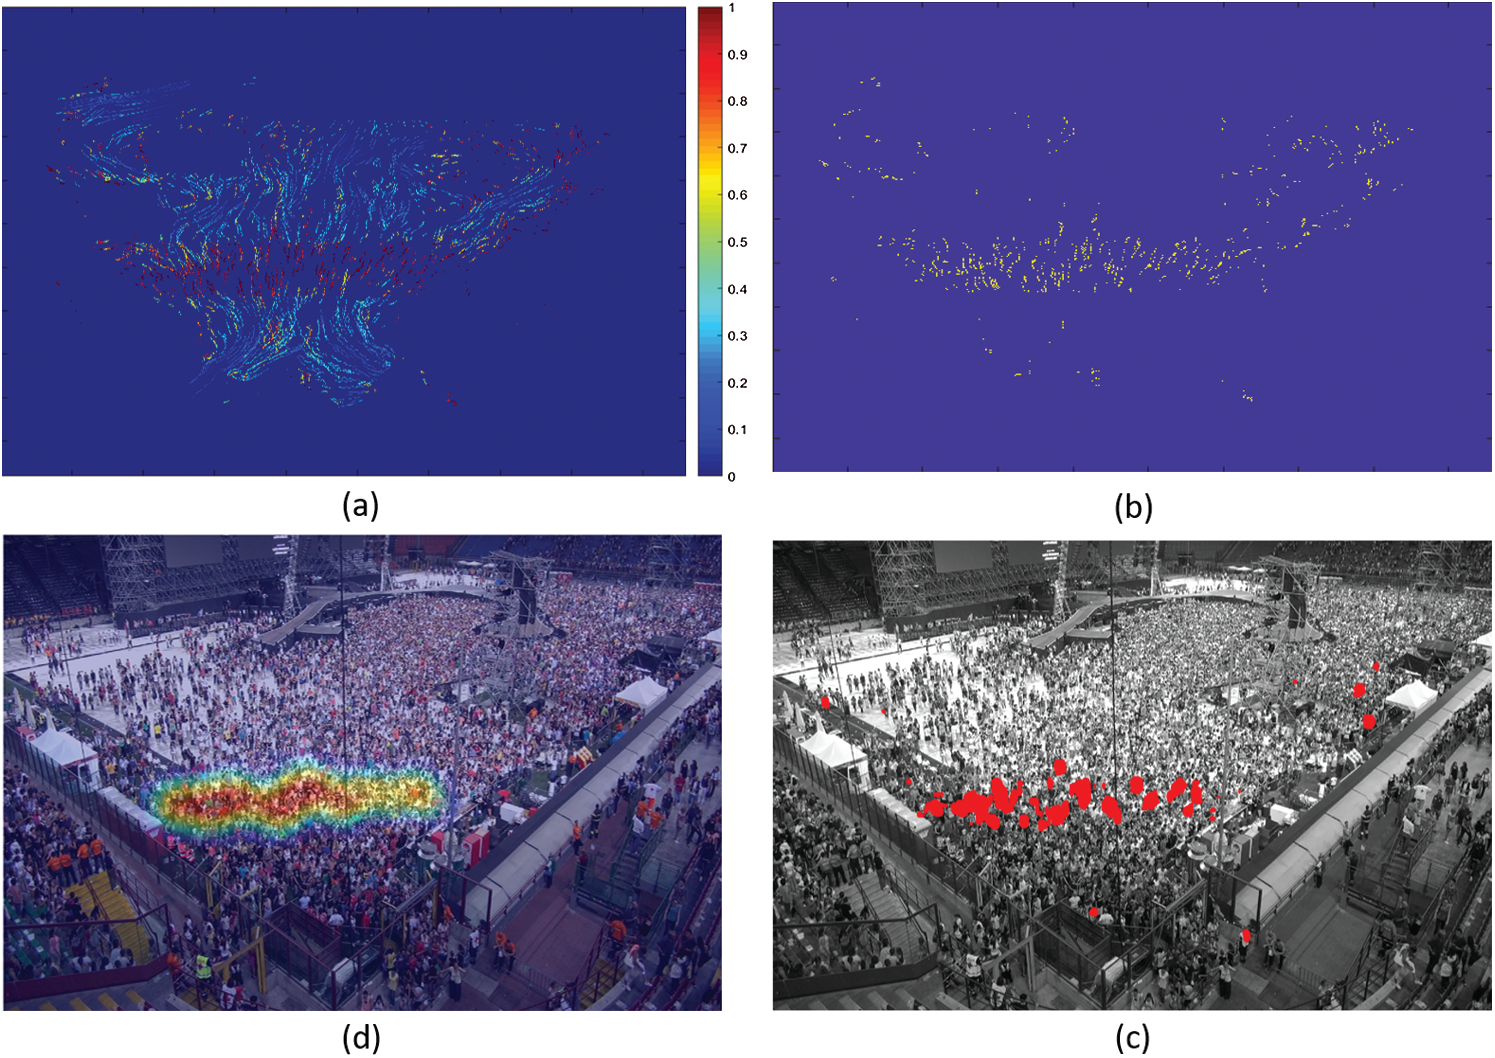
Figure 4: (a) Shows the score map obtained by Algorithm 2. (b) Shows score map obtained after applying non-maximum suppression. (c) Shows blobs appear after applying Gaussian filter which are then clustered to obtain final congested regions in (d). (best view in zoom in)
This section will discuss the dataset’s details and the different schemes adopted to evaluate and compare the proposed approach with other state-of-the-art methods.
To evaluate the proposed approach’s effectiveness, we performed experiments on the dataset presented in [19]. The dataset contained fifteen video sequences that covered different scenarios. It discussed other crowd behaviours that lead to congestion, including evacuation, jostling, conflict, and blockage.
During an evacuation, people try to leave through a single and narrow exit that causes congestion. Generally, this phenomenon is commonly observed at train stations. While jostling, people try to push each other to make their way out. Congestion arises when two or more large groups of people come face to face in a narrow passage. In such a situation, people confront each other to make their way out. Blocking happens when the movement of one large group of people is obstructed.
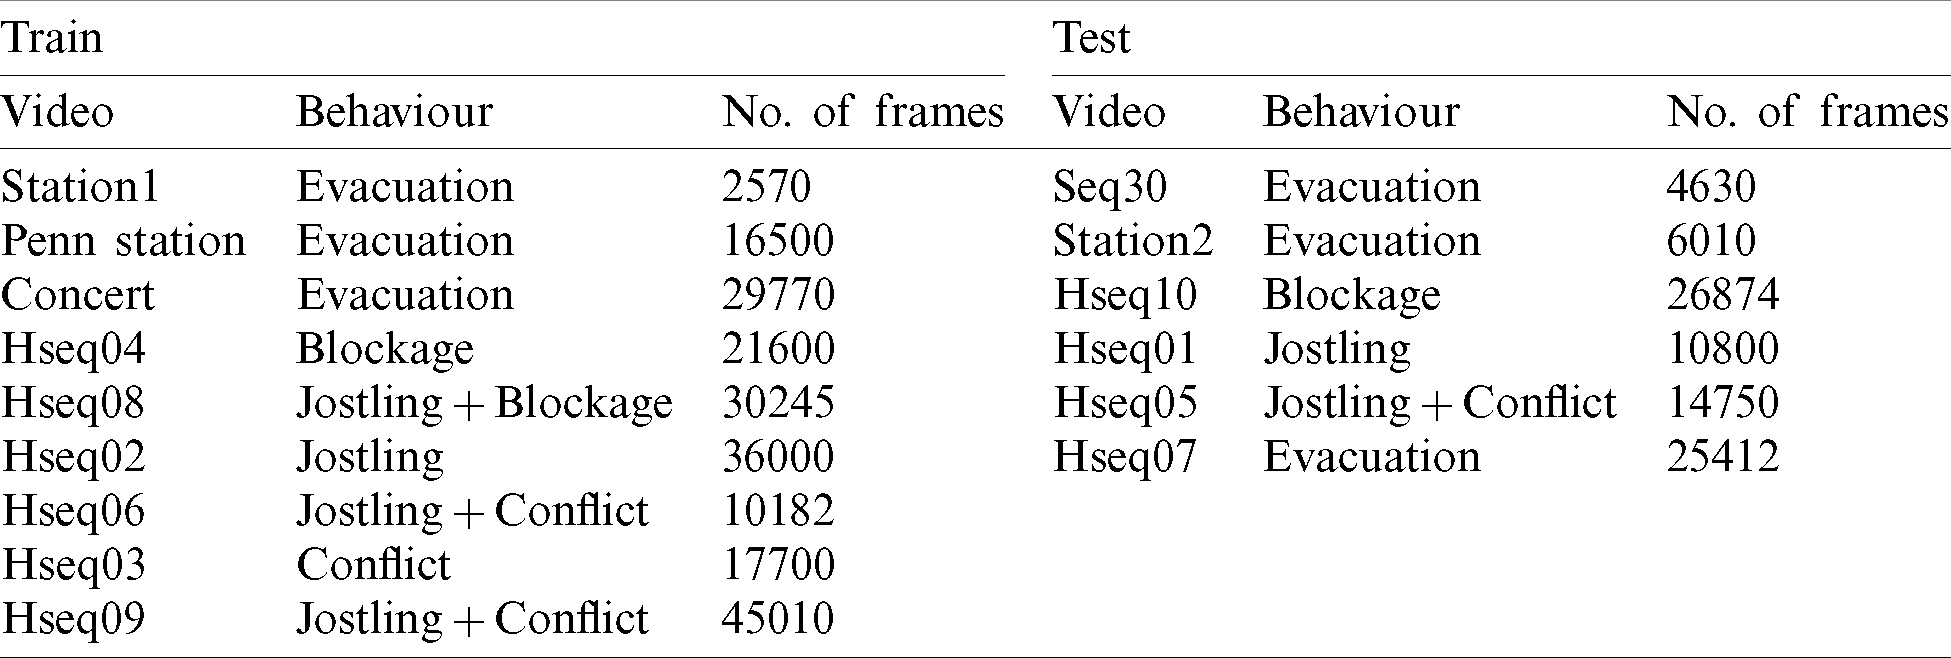
We followed the convention adopted by [19] in the experimental setup and divided the videos into two sets, i.e., test and train. The train set contained nine video sequences, while the remaining six video sequences were used for testing, as shown in Tab. 2.
Table 2: Splitting of the dataset into training and testing sets. Each video is represented by its name, behaviour, and number of frames
The Trajectory Annotation elaborates the method we used. A typical annotation process involves the coder watching the video for several hours, manually tracking each individual, and generating a trajectory. Since we are dealing with high-density crowds, with over 2000 people in a scene, this process consumes a lot of human effort and is usually prone to errors. Another way to annotate trajectories is to employ an unsupervised clustering algorithm that can cluster them into groups. The prominent (big cluster) groups are regarded as ‘normal’, while those belonging to sets containing a smaller number are considered congested trajectories. Although this process necessitates additional annotation, it reduces the cost of manual labelling significantly. Therefore, we adopted this strategy to cluster trajectories into groups, and then, through visual observation of the clusters, we assigned labels to clusters. We observed that the annotation process still requires further refinement as similar trajectories may be transferred to two different classes. This problem cannot be detected through visual observations. Therefore, we employed t-SNE [68] to further refine the training data by visualizing the distribution of trajectories in a low-dimension space. In the visualization plane, similar orbits close to each other, and we manually inspected them that lay farther away from the class. After preparing the data, we trained the model and reported the test set’s classification and localization accuracy.
We also evaluated and compared the performance of other existing methods:
a) Krausz et al. [1] proposed the first method that automatically detects congestion in crowded scenes to the best of our knowledge. The authors evaluated their proposed framework on a single video. They offered a framework that automatically detects congestion in videos, computes the optical flow field from the input video sequence, and generates a 2-D histogram of magnitude and orientation. The framework identifies congestion by detecting a small magnitude along the central axis of the histogram.
b) Huang et al. [18] proposed a vision-based approach that detects congestion in videos using entropy, commonly used to measure a closed system’s stability. The authors used velocity entropy to measure velocity vectors’ dispersion, which serves as an indicator of congestion.
c) Bek et al. [69] proposed a framework that extracts trajectories from the video. Using this, they computed track density and local inertia, which are then combined to estimate the scene’s congestion level.
d) Most recently, Khan et al. [19] proposed a framework that detects and localizes congestion in the scene. They extracted point trajectories from the video and used them to determine the oscillation feature leading to the generation of an oscillation map, which is then quantized and used to identify the scene’s congested regions. Moreover, the authors proposed a novel dataset that contains 15 video sequences to evaluate the congestion detection models.
e) We also trained a binary SVM classifier. For this, we extracted spatio-temporal features from each video using a 3-D convolutional neural network [70]. At the same time, the linear classifier was trained based on the extracted features. We created small clips by trimming congested segments from each video and treated ‘congested’ and ‘normal’ as separate classes. During testing, binary classifiers provided the class score for each video segment.
To evaluate the proposed method’s performance, we used conventional evaluation metrics, i.e., Region of Convergence (ROC) and Area Under Curve (AUC). These are some of the standard metrics used to evaluate binary classifiers. For evaluating the classification performance, we used frame-level classification. A frame is considered ‘congested’ if intersection-over-union (IoU) between the predicted region and the ground truth is
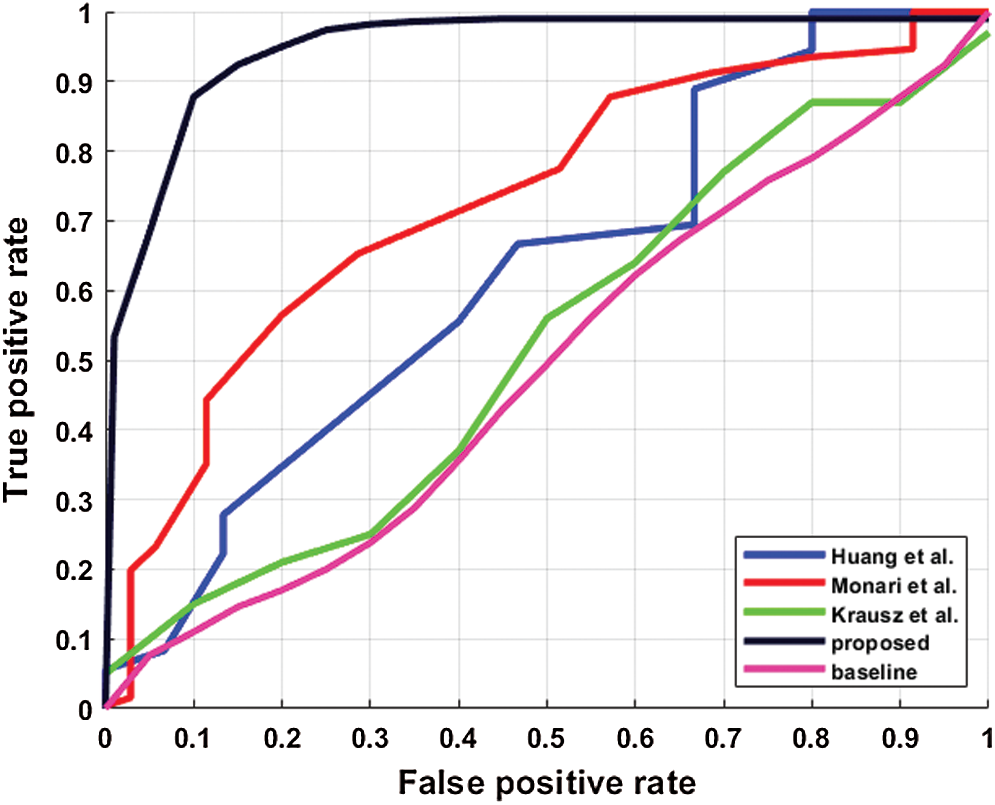
Figure 5: Performance comparison of different methods in terms of ROC. Krausz et al. [1] in green, Huang et al. [18] in blue, Bek et al. [69] in red, baseline in magenta and proposed in black colour
Table 3: Performance comparison of different methods in terms of Area Under Curve (AUC). Large values represent superior performance
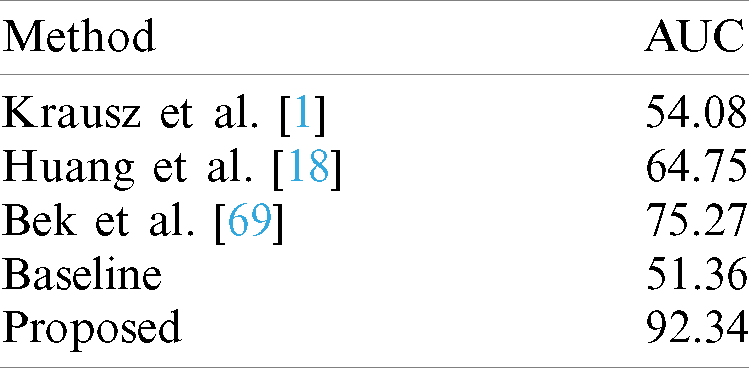
The results can be safely concluded that a binary SVM classifier achieves lower performance than the other methods and cannot be used for congestion detection in videos. It is primarily due to datasets containing long, untrimmed video sequences where most video frames are usual, and congestion occurs only for a short duration. Therefore, a binary SVM classifier could not learn enough discriminative features to distinguish congestion. A two-dimensional histogram (magnitude and directions) obtained by K-mean clustering in [1] was not robust enough to classify congestion accurately. Furthermore, we observed that this method produced a low classification score for both ‘congested’ and ‘normal’ temporal segments since it relied on a weak feature, i.e., the optical flow, which is easily affected by simple changes illumination. Bek et al. [69] achieved a comparable performance, but their method misclassified regular patterns as congested patterns and produced a high congestion score.
We also analyzed the proposed framework’s false alarm rate because a large portion of the video sequence is non-congested in the real world. Ideally, a robust congestion detector’s goal is to produce zero false alarm rate on standard video sequences. Therefore, we evaluated the performance of the proposed method and other reference methods on regular video sequences. We set the threshold value to 0.5 and reported results of the false alarm rate in Fig. 6. As demonstrated in Tab. 3, we can conclude that the proposed method produces relatively fewer false alarms than other reference methods.
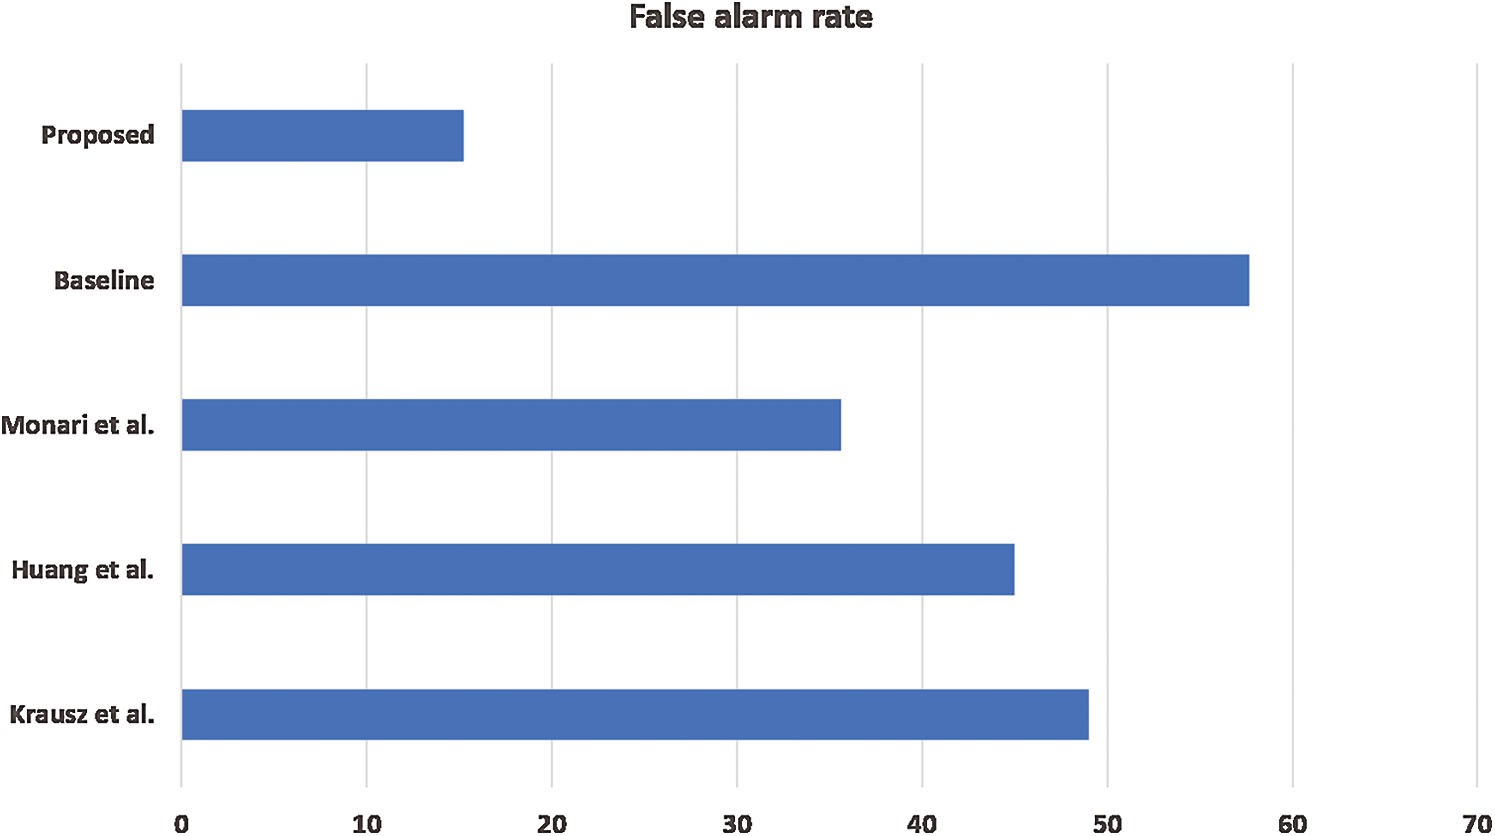
Figure 6: Performance comparison of different methods in terms of false alarm rate
To demonstrate the proposed framework’s robustness, we used an additional video sequence covering the Shibuya Crossing in Japan, duly downloaded from YouTube. Shibuya Crossing happens to be one of the world’s busiest crossings. It is especially famous for its scramble crossing. Even though Shibuya Crossing’s density is usually high during peak times, no congestion situation was reported. We manually analyzed the video sequence and learned that there was, in fact, no congestion in the entire series. We then tested the proposed framework by providing it as an input to the framework. The framework’s output is illustrated in Fig. 7. The algorithm detects no congestion in all temporal segments of the video, indicating that the proposed system is robust in distinguishing the congestion from original video segments.
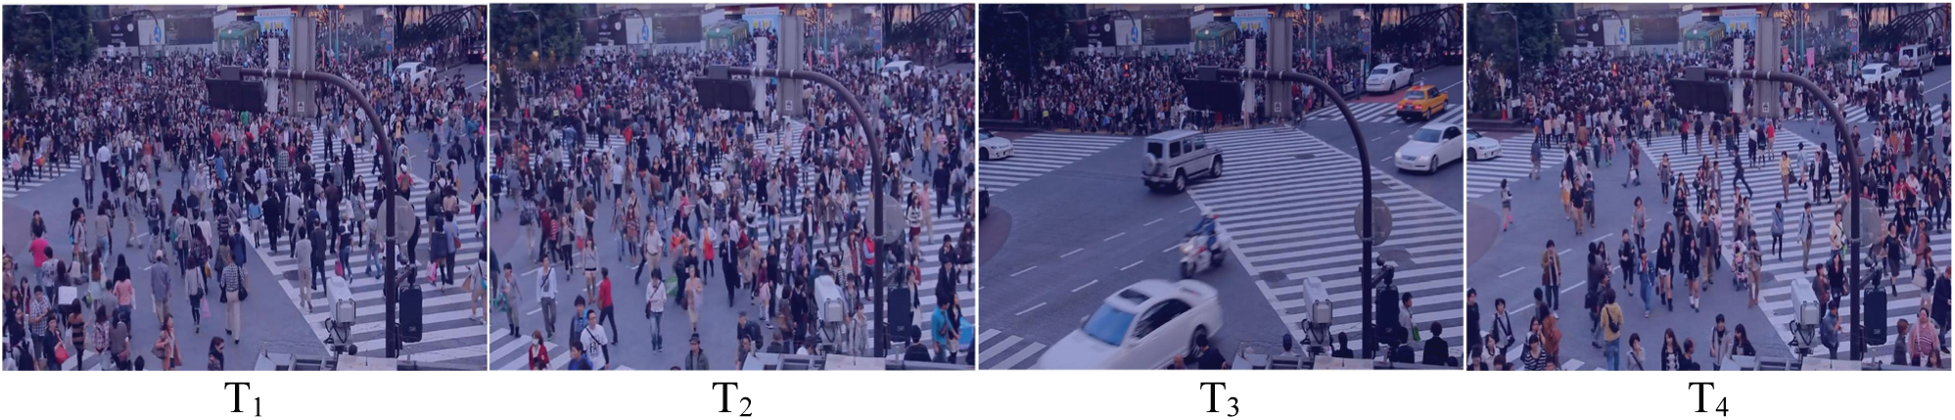
Figure 7: Temporal segments of Shibuya crossing, where
We observed that the model learned more discriminative features when trained with ‘normal’ and ‘congested’ video segments from empirical studies. Further, it was observed that the network could accurately learn to localize the congested region by training it with many positive and negative samples. We also observed that the network learns to discriminate congestion and standard patterns at a high number of training iterations. For example, at 500 iterations, the validation error of the network is increased. After 1,000 iterations, the network starts to learn discriminative features and produces a high score for congested and a low score for regular segments. As the network analyses more video samples and the number of iterations increase, its precision also increases.
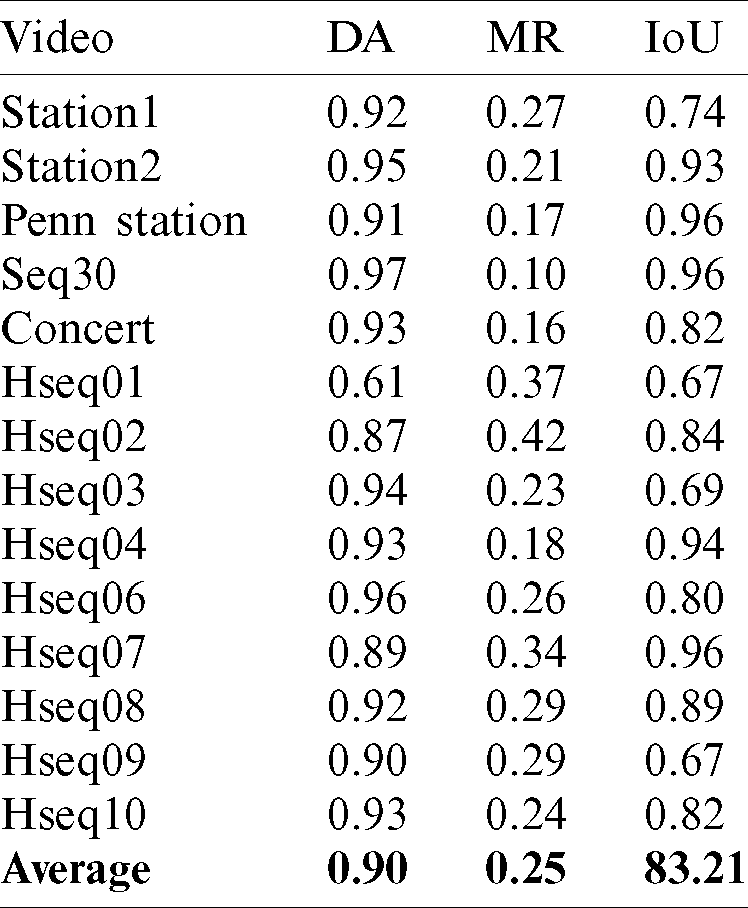
To quantify the performance of the proposed framework, we used three evaluation metrics, i.e., Detection Accuracy (DA), Localization Accuracy (LA), and Missed Rate (MR). DA is calculated by the number of correct predictions/total number of predictions. We regard a frame as congested if the area of the congested region is more significant than a threshold
The performance of the proposed framework in terms of the three evaluation metrics can be seen in Tab. 4, where DA, MR, and LA are computed for all video sequences. Our proposed method detected congestion with an average 0.90 detection accuracy in almost all the video sequences except Hseq01 and Hseq02, where the framework achieved comparatively lower values as the framework did not detect some frames. In these frames, relatively small blobs (congested areas) were produced, filtered out by the threshold
Table 4: Performance of the proposed framework in DA, MR, and IoU for all video sequences
The proposed framework’s effectiveness has been demonstrated qualitatively in Figs. 8 and 9. Fig. 8 shows the output of the framework at independent temporal segments of Station1 video sequence. This sequence demonstrates growing congestion, where the area of the congested region increases with time. This video sequence exhibits evacuation behaviour, where people from different entrances try to leave from a single narrow exit. Fig. 8 illustrates different temporal segments of the video, where people’s density is less in the first temporal segment T1 compared to T4. Therefore, the area of the congested region in the temporal segment T1 is less. With time, more people join, and a crowd starts forming crowded regions in other temporal segments. The output of our framework was then compared with the ground truth.
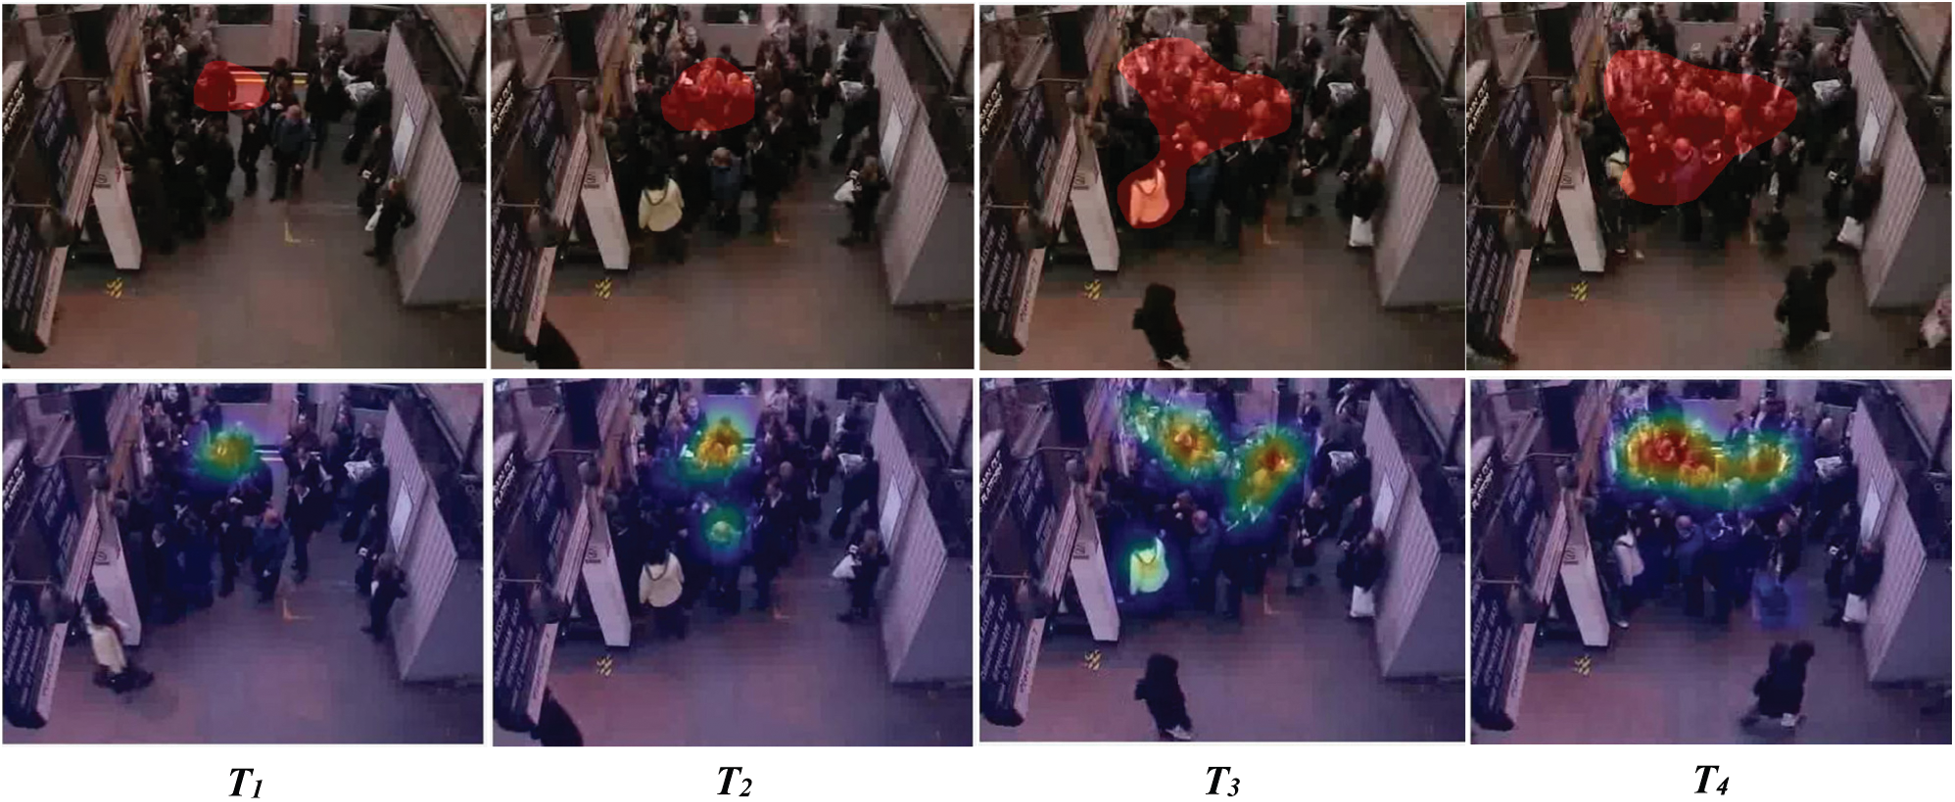
Figure 8: Comparison of the proposed framework with the ground truth in Station1 video sequence. The first row shows the ground truth, where the red blobs show the congested regions in different temporal segments. The second row shows the crowded areas detected by the proposed framework
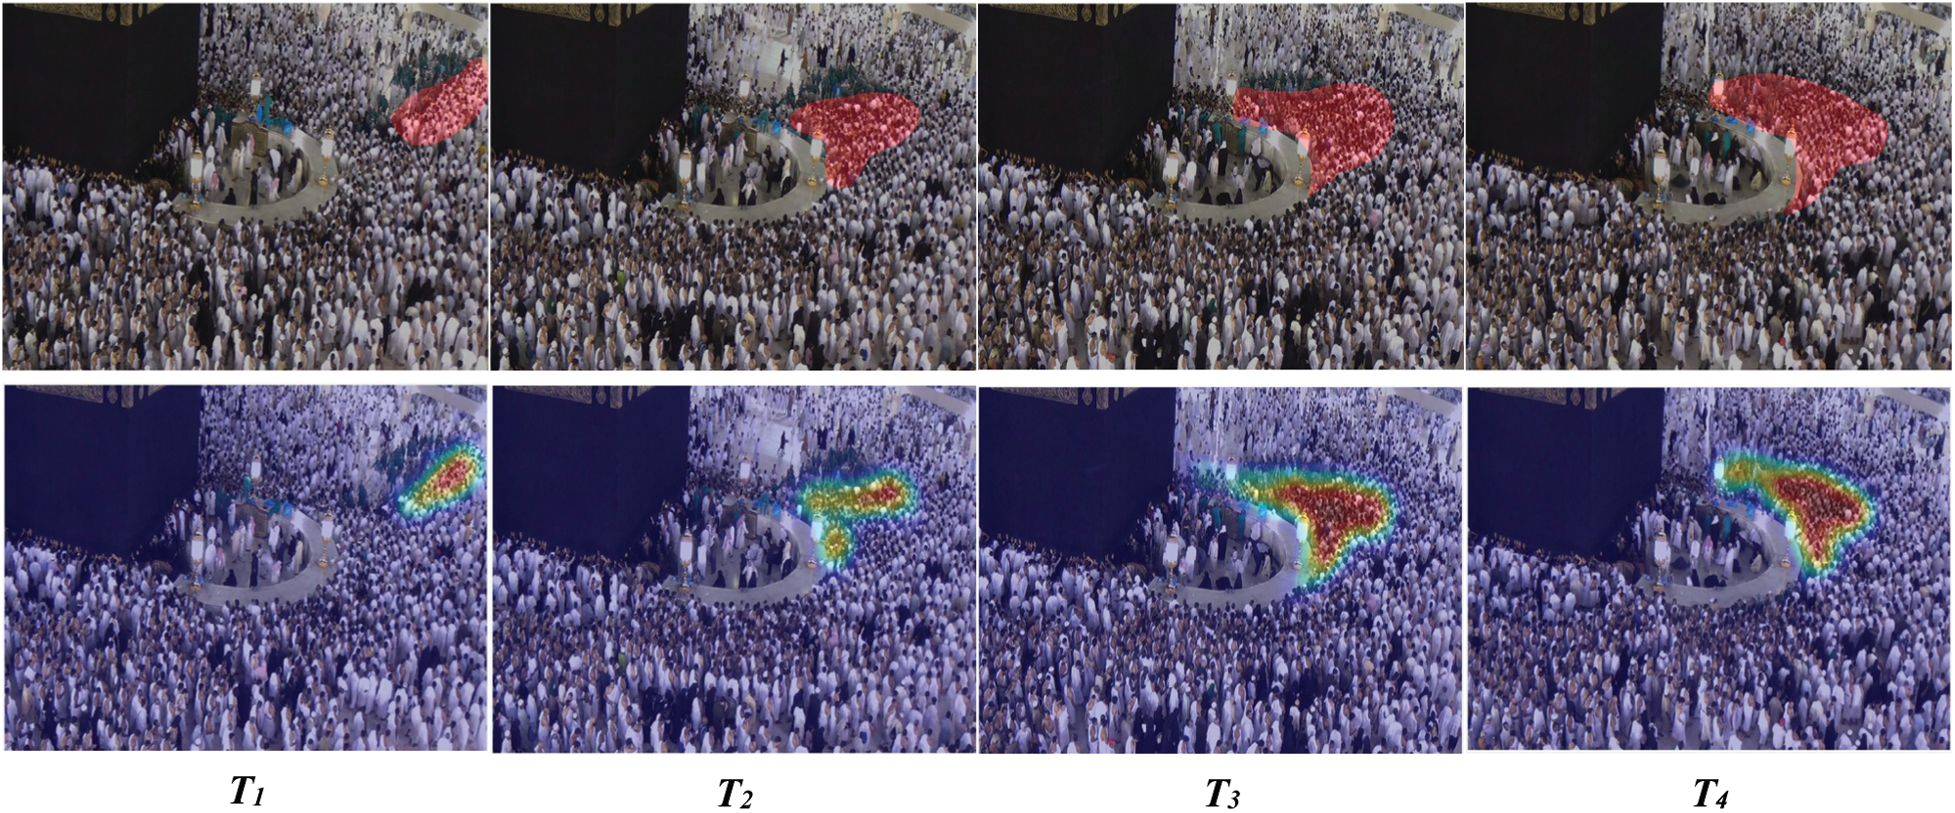
Figure 9: Comparison of the proposed framework with the ground truth in Hseq01 video sequence. The first row shows the ground truth, and the second row shows the congested regions detected by the proposed framework in different temporal segments of the video
Fig. 9 shows congestion in the Hseq01 video sequence. We can observe dynamic congestion in this sequence when congestion is produced at different regions of the scene at multiple temporal segments. In this video sequence, a large group of people circumambulate the Kaaba to perform obligatory rituals. Another group of people blocks their way for cleaning purposes. This small group of pedestrians move orthogonal to the main flow and stop the other group’s path. As the small group penetrates forward, they choke the people’s movement at different spatial-temporal segments, as shown in the video. Fig. 9 compares the performance of the proposed framework with the ground truth. The proposed framework accurately localized the congested region in all temporal segments of the video, as shown in Figs. 8 and 9.
In this work, we have proposed a practical framework for detecting congestion in crowds. The framework generates spatio-temporal images from pedestrian trajectories and introduces CNN to learn the representation. A CNN classifies each spatio-temporal image into two classes, i.e., ‘normal’ and ‘congested.’ The framework then generates a score map by embedding each point of trajectory with its respective class score. Congested regions are obtained after employing the non-maximum suppression algorithm. The proposed framework achieves state-of-the-art performance on challenging video sequences and outperforms other reference methods by a significant margin. This superior performance is because CNN efficiently learns hierarchical features from spatio-temporal images. Empirical studies suggest that the proposed framework is adaptable, and the proposed CNN classifier can be easily replaced with other classifiers.
In the future, we plan to validate our framework on multiple video sequences, including those recorded from various cameras, scenarios from camera feed, or simulation videos taken from different angles. We also plan to optimize our framework to run on low-end hardware and provide analytics in real-time.
Acknowledgement: The authors extend their appreciation to the Deputyship for Research & Innovation, Ministry of Education in Saudi Arabia, for funding this research work through Project Number 0909.
Funding Statement: This research work is supported by the Ministry of Education in Saudi Arabia (Grant Number 0909).
Conflicts of Interest: The authors declare that they have no conflicts of interest to report regarding the present study.
1. B. Krausz and C. Bauckhage. (2012). “Loveparade 2010: Automatic video analysis of a crowd disaster,” Computer Vision and Image Understanding, vol. 53, no. 3, pp. 307–319. [Google Scholar]
2. G. K. Still. (2014). Introduction to Crowd Science, Boca Raton, Florida, United States: CRC Press, . [Online]. Available: https://www.routledge.com/Introduction-to-Crowd-Science/Still/p/book/9781466579644. [Google Scholar]
3. D. Helbing and P. Molnar. (1995). “Social force model for pedestrian dynamics,” Physical Review E, vol. 51, no. 5, pp. 4282–4286. [Google Scholar]
4. C. Burstedde, K. Klauck, A. Schadschneider and J. Zittartz. (2001). “Simulation of pedestrian dynamics using a two-dimensional cellular automaton,” Physica A: Statistical Mechanics and Its Application, vol. 295, no. 3, pp. 507–525. [Google Scholar]
5. D. Helbing, A. Johansson and H. Z. Al-Abideen. (2007). “Dynamics of crowd disasters: An empirical study,” Physical Review E, vol. 75, no. 4, pp. 46109. [Google Scholar]
6. T. Li, H. Chang, M. Wang, B. Ni, R. Hong et al. (2015). , “Crowded scene analysis: A survey,” IEEE transactions on Circuits and Systems for Video Technology, vol. 25, no. 3, pp. 367–386. [Google Scholar]
7. X. Zhang, D. Ma, H. Yu, Y. Huang, P. Howell et al. (2020). , “Scene perception guided crowd anomaly detection,” Neurocomputing, vol. 414, no. 5, pp. 291–302. [Google Scholar]
8. W. Sultani, C. Chen and M. Shah. (2018). “Real-world anomaly detection in surveillance videos,” in Proc. IEEE Conf. on Computer Vision and Pattern Recognition, Salt Lake City, USA, pp. 6479–6488. [Google Scholar]
9. X. Zhang, X. Shu and Z. He. (2019). “Crowd panic state detection using entropy of the distribution of enthalpy,” Physica A: Statistical Mechanics and Its Application, vol. 525, no. 7, pp. 935–945. [Google Scholar]
10. R. Mehran, A. Oyama and M. Shah. (2009). “Abnormal crowd behavior detection using social force model,” in Proc. IEEE Conf. on Computer Vision and Pattern Recognition, Florida, USA, pp. 935–942. [Google Scholar]
11. W. Liu, M. Salzmann and P. Fua. (2019). “Context-aware crowd counting,” in Proc. IEEE Conf. on Computer Vision and Pattern Recognition, Long Beach, USA, pp. 5099–5108. [Google Scholar]
12. J. Chen, W. Su and Z. Wang. (2020). “Crowd counting with crowd attention convolutional neural network,” Neurocomputing, vol. 382, no. 3, pp. 210–220. [Google Scholar]
13. G. Zhang, Y. Pan, L. Zhang and R. L. K. Tiong. (2020). “Cross-scale generative adversarial network for crowd density estimation from images,” Engineering Applications of Artificial Intelligence, vol. 94, pp. 103777. [Google Scholar]
14. X. Ding, F. He, Z. Lin, Y. Wang, H. Guo et al. (2020). , “Crowd density estimation using fusion of multi-layer features,” IEEE Transactions on Intelligent Transportation Systems, New York, United States: IEEE, . [Online]. Available: https://ieeexplore.ieee.org/document/9063540. [Google Scholar]
15. S. Ali and M. Shah. (2008). “Floor fields for tracking in high density crowd scenes,” in Proc. European Conf. on Computer Vision, Marseille, France, pp. 1–14. [Google Scholar]
16. I. Ali and M. N. Dailey. (2012). “Multiple human tracking in high-density crowds,” Image and Vision Computing, vol. 30, no. 12, pp. 966–977. [Google Scholar]
17. L. Q. Xu and A. Anjulan. (2008). “Crowd behaviours analysis in dynamic visual scenes of complex environment,” in Proc. IEEE Int. Conf. on Image Processing, San Diego, USA, pp. 9–12. [Google Scholar]
18. L. Huang, T. Chen, Y. Wang and H. Yuan. (2015). “Congestion detection of pedestrians using the velocity entropy: A case study of love parade 2010 disaster,” Physica A: Statistical Mechanics and Its Application, vol. 440, no. 10, pp. 200–209. [Google Scholar]
19. S. D. Khan. (2019). “Congestion detection in pedestrian crowds using oscillation in motion trajectories,” Engineering Applications of Artificial Intelligence, vol. 85, no. 10, pp. 429–443. [Google Scholar]
20. J. M. Grant and P. J. Flynn. (2017). “Crowd scene understanding from the video: A survey,” ACM Transaction on Multimedia Computing, Communications and Applications, vol. 13, no. 2, pp. 1–23. [Google Scholar]
21. B. Zhan, D. N. Monekosso, P. Remagnino, S. A. Velastin and L. Q. Xu. (2008). “Crowd analysis: A survey,” Machine Vision and Applications, vol. 19, no. 5, pp. 345–357. [Google Scholar]
22. J. C. S. Jacques, S. R. Musse and C. R. Jung. (2010). “Crowd analysis using computer vision techniques,” IEEE Signal Processing Magazine, vol. 27, no. 5, pp. 66–77. [Google Scholar]
23. M. Rodriguez, I. Laptev, J. Sivic and J. Y. Audibert. (2011). “Density aware person detection and tracking in crowds,” in Proc. IEEE Int. Conf. on Computer Vision, Barcelona, Spain, pp. 2423–2430. [Google Scholar]
24. V. Lempitsky and A. Zisserman. (2010). “Learning to count objects in images,” in Proc. Int. Conf. on Neural Information Processing, Vancouver, Canada, pp. 1324–1332. [Google Scholar]
25. C. Arteta, V. Lempitsky, J. A. Noble and A. Zisserman. (2014). “Interactive object counting,” in Proc. European Conf. on Computer Vision, Zurich, Switzerland, pp. 504–518. [Google Scholar]
26. L. Fiaschi, R. Nair, U. Koethe and F. A. Hamprecht. (2012). “Learning to count with regression forest and structured labels,” in Proc. Int. Conf. on Pattern Recognition, Tsukuba, Japan, pp. 2685–2688. [Google Scholar]
27. D. Kang, Z. Ma and A. B. Chan. (2019). “Beyond counting: Comparisons of density maps for crowd analysis tasks—Counting, detection, and tracking,” IEEE Transactions on Circuits and Systems for Video Technology, vol. 29, no. 5, pp. 1408–1422. [Google Scholar]
28. D. Kang, Z. Ma and A. B. Chan. (2019). “Beyond counting: Comparisons of density maps for crowd analysis tasks—Counting, detection, and tracking,” IEEE Transactions on Circuits and Systems for Video Technology, vol. 29, no. 5, pp. 1408–1422. [Google Scholar]
29. H. Idrees, I. Saleemi, C. Seibert and M. Shah. (2013). “Multi-source multi-scale counting in extremely dense crowd images,” in Proc. IEEE Conf. on Computer Vision and Pattern Recognition, Portland, Oregon, USA, pp. 2547–2554. [Google Scholar]
30. A. B. Chan and N. Vasconcelos. (2012). “Counting people with low-level features and Bayesian regression,” IEEE Transactions on Image Processing, vol. 21, no. 4, pp. 2160–2177. [Google Scholar]
31. C. Zhang, H. Li, X. Wang and X. Yang. (2015). “Cross-scene crowd counting via deep convolutional neural networks,” in Proc. IEEE Conf. on Computer Vision and Pattern Recognition, Boston, MA, USA, pp. 833–841. [Google Scholar]
32. V. A. Sindagi and V. M. Patel. (2017). “Generating high-quality crowd density maps using contextual pyramid CNNS,” in Proc. IEEE Int. Conf. on Computer Vision, Venice, Italy, pp. 1879–1888. [Google Scholar]
33. F. Xiong, X. Shi and D. Yeung. (2017). “Spatiotemporal modeling for crowd counting in videos,” in Proc. IEEE Int. Conf. on Computer Vision, Venice, Italy, pp. 5161–5169. [Google Scholar]
34. S. Ren, K. He, R. Girshick and J. Sun. (2017). “Faster R-CNN: Towards real-time object detection with region proposal networks,” IEEE Transactions on Pattern Analysis and Machine Intelligence, vol. 39, no. 6, pp. 1137–1149. [Google Scholar]
35. A. Mittal and L. S. Davis. (2003). “M2tracker: A multi-view approach to segmenting and tracking people in a cluttered scene,” International Journal of Computer Vision, vol. 51, no. 3, pp. 189–203. [Google Scholar]
36. J. Kang, I. Cohen and G. Medioni. (2004). “Tracking people in crowded scenes across multiple cameras,” Proc. Asian Conf. on Computer Vision, vol. 7, pp. 1–15. [Google Scholar]
37. J. Black, T. Ellis and P. Rosin. (2002). “Multi view image surveillance and tracking,” in Proc. Workshop on Motion and Video Computing, Motion and Video Computing, Orlando, USA, pp. 169–174. [Google Scholar]
38. M. Han, W. Xu, H. Tao and Y. Gong. (2004). “An algorithm for multiple object trajectory tracking,” in Proc. IEEE Computer Society Conf. on Computer Vision and Pattern Recognition, Washington, USA, pp. I–864. [Google Scholar]
39. M. Isard, J. MacCormick and Bramble. (2001). “A Bayesian multiple-blob tracker,” in Proc. The Eighth IEEE Int. Conf. on Computer Vision, Vancouver, BC, Canada, pp. 34–41. [Google Scholar]
40. D. Comaniciu, V. Ramesh and P. Meer. (2000). “Real-time tracking of non-rigid objects using mean shift,” in Proc. IEEE Conf. on Computer Vision and Pattern Recognition, Hilton, USA, pp. 142–149. [Google Scholar]
41. B. Y. S. Khanloo, F. Stefanus, M. Ranjbar, Z.-N. Li, N. Saunier et al. (2010). , “Max-margin offline pedestrian tracking with multiple cues,” in Proc. IEEE Canadian Conf. on Computer and Robot Vision, Ottawa, Canada, pp. 347–353. [Google Scholar]
42. J. L. Barron, D. J. Fleet and S. S. Beauchemin. (1994). “Performance of optical flow techniques,” International Journal of Computer Vision, vol. 12, no. 1, pp. 43–77. [Google Scholar]
43. B. K. Horn and B. G. Schunck. (1981). “Determining optical flow,” Artificial Intelligence, vol. 17, no. 1–3, pp. 185–203. [Google Scholar]
44. S. C. Shadden, F. Lekien and J. E. Marsden. (2005). “Definition and properties of lagrangian coherent structures from finite-time lyapunov exponents in two-dimensional aperiodic flows,” Physica D: Nonlinear Phenomena, vol. 212, no. 3, pp. 271–304. [Google Scholar]
45. J. L. Helman and L. Hesselink. (1991). “Visualizing vector field topology in fluid flows,” IEEE Computer Graphics and Applications, vol. 11, no. 3, pp. 36–46. [Google Scholar]
46. J. J. Van Wijk. (2002). “Image based flow visualization,” ACM Transactions on Graphics, vol. 21, no. 3, pp. 745–754. [Google Scholar]
47. L. Kratz and K. Nishino. (2009). “Anomaly detection in extremely crowded scenes using spatiotemporal motion pattern models,” in Proc. Computer Vision and Pattern Recognition, Miami, Florida, USA, pp. 1446–1453. [Google Scholar]
48. L. Kratz and K. Nishino. (2011). “Spatio-temporal motion pattern models of extremely crowded scenes,” in Machine Learning for Vision-Based Motion Analysis, London, UK: Springer, pp. 263–274, . [Online]. Available: https://link.springer.com/chapter/10.1007/978-0-85729-057-1˙10. [Google Scholar]
49. B. Zhou, X. Wang and X. Tang. (2011). “Random field topic model for semantic region analysis in crowded scenes from tracklets,” in Proc. IEEE Computer Vision and Pattern Recognition, Colorado Springs, CO, USA, pp. 3441–3448. [Google Scholar]
50. B. Zhou, X. Wang and X. Tang. (2012). “Understanding collective crowd behaviors: Learning a mixture model of dynamic pedestrian-agents,” in Proc. Computer Vision and Pattern Recognition, Providence, Rhode Island, pp. 2871–2878. [Google Scholar]
51. M. Saqib, S. Daud Khan, N. Sharma and M. Blumenstein. (2017). “Extracting descriptive motion information from crowd scenes,” in Proc. Int. Conf. on Image and Vision Computing, New Zealand, pp. 1–6. [Google Scholar]
52. S. D. Khan, M. Tayyab, M. K. Amin, A. Nour, A. Basalamah et al. (2017). , “Towards a crowd analytic framework for crowd management in Majid-Al-Haram,” arXiv preprint, vol. 1709.05952, pp. 1–11, . [Online]. Available: https://arxiv.org/abs/1709.05952. [Google Scholar]
53. C. Piciarelli, C. Micheloni and G. L. Foresti. (2018). “Trajectory-based anomalous event detection,” IEEE Transactions on Circuits and Systems for Video Technology, vol. 18, no. 11, pp. 1544–1554. [Google Scholar]
54. F. Tung, J. S. Zelek and D. A. Clausi. (2011). “Goal-based trajectory analysis for unusual behaviour detection in intelligent surveillance,” Image and Vision Computing, vol. 29, no. 4, pp. 230–240. [Google Scholar]
55. B. Yang, J. Cao, R. Ni and L. Zou. (2018). “Anomaly detection in moving crowds through spatiotemporal autoencoding and additional attention,” Advances in Multimedia, vol. 1, pp. 1–8. [Google Scholar]
56. M. Hasan, J. Choi, J. Neumann, A. K. Roy-Chowdhury and L. S. Davis. (2016). “Learning temporal regularity in video sequences,” in Proc. IEEE Conf. on Computer Vision and Pattern Recognition, Las Vegas, USA, pp. 733–742. [Google Scholar]
57. Y. S. Chongand and Y. H. Tay. (2017). “Abnormal event detection in videos using spatiotemporal autoencoder,” Advances in Neural Networks, vol. 10262, pp. 189–196. [Google Scholar]
58. J. Shi and Tomasi. (1994). “Good features to track,” in Proc. IEEE Conf. on Computer Vision and Pattern Recognition, Seattle, Washington, pp. 593–600. [Google Scholar]
59. P. Sand and S. Teller. (2008). “Particle video: Long-range motion estimation using point trajectories,” International Journal of Computer Vision, vol. 80, no. 1, pp. 72–91. [Google Scholar]
60. N. Sundaram, T. Brox and K. Keutzer. (2010). “Dense point trajectories by gpu accelerated large displacement optical flow,” in Proc European Conf. on Computer Vision, Heraklion, Crete, Greece, pp. 438–451. [Google Scholar]
61. S. Ali and M. Shah. (2007). “A lagrangian particle dynamics approach for crowd flow segmentation and stability analysis,” in Proc. IEEE Conf. on Computer Vision and Pattern Recognition, Minneapolis, US, pp. 1–6. [Google Scholar]
62. T. Brox, A. Bruhn, N. Papenberg and J. Weickert. (2004). “High accuracy optical flow estimation based on a theory for warping,” in Proc. European Conf. on Computer Vision, Prague, Czech Republic, pp. 25–36. [Google Scholar]
63. S. Khan, G. Vizzari, S. Bandini and S. Basalamah. (2014). “Detecting dominant motion flows and people counting in high density crowds,” Journal of WSCG, vol. 22, no. 1, pp. 21–30. [Google Scholar]
64. Y. Shi, Y. Tian, Y. Wang and T. Huang. (2017). “Sequential deep trajectory descriptor for action recognition with three-stream cnn,” IEEE Transactions on Multimedia, vol. 19, no. 7, pp. 1510–1520. [Google Scholar]
65. Y. Endo, H. Toda, K. Nishida and J. Ikedo. (2017). “Classifying spatial trajectories using representation learning,” International Journal of Data Science and Analytics, vol. 2, no. 3, 4, pp. 107–117. [Google Scholar]
66. S. K. Kumaran, D. P. Dogra, P. P. Roy and A. Mitra. (2018). “Video trajectory classification and anomaly detection using hybrid CNN-VAE,” arXiv preprint, vol. 1812.07203, pp. 1–9, . [Online]. Available: https://arxiv.org/abs/1812.07203. [Google Scholar]
67. N. Srivastava, G. Hinton, A. Krizhevsky, I. Sutskever and R. Salakhutdinov. (2014). “Dropout: A simple way to prevent neural networks from overfitting,” Journal of Machine Learning Research, vol. 15, no. 1, pp. 1929–1958. [Google Scholar]
68. L. V. D. Maaten and G. Hinton. (2008). “Visualizing data using t-SNE,” Journal of Machine Learning Research, vol. 9, pp. 2579–2605. [Google Scholar]
69. S. Bek and E. Monari. (2016). “The crowd congestion level—A new measure for risk assessment in video-based crowd monitoring,” in Proc. IEEE Global Conf. on Signal and Information Processing (GlobalSIPWashington, DC, USA, pp. 1212–1217. [Google Scholar]
70. D. Tran, L. Bourdev, R. Fergus, L. Torresani and M. Paluri. (2015). “Learning spatiotemporal features with 3d convolutional networks,” in Proc. IEEE Int. Conf. on Computer Vision, Santiago, Chile, pp. 4489–4497. [Google Scholar]
 | This work is licensed under a Creative Commons Attribution 4.0 International License, which permits unrestricted use, distribution, and reproduction in any medium, provided the original work is properly cited. |