DOI:10.32604/cmc.2021.015411
| Computers, Materials & Continua DOI:10.32604/cmc.2021.015411 | |
| Article |
Effect of Poly-Alkylene-Glycol Quenchant on the Distortion, Hardness, and Microstructure of 65Mn Steel
1Hanoi University of Science and Technology, Hanoi, Vietnam
2Ho Chi Minh City University of Transport, Ho Chi Minh City, Vietnam
3Vietnam Maritime University, Haiphong, Vietnam
4Industrial University of Ho Chi Minh City (IUH), Ho Chi Minh City, Vietnam
5Al-Nahrain Nanorenewable Energy Research Center, Al-Nahrain University, Baghdad, Iraq
6Ho Chi Minh city University of Technology (HUTECH), Ho Chi Minh City, Vietnam
*Corresponding Author: Anh Tuan Hoang. Email: hatuan@hutech.edu.vn
Received: 19 November 2020; Accepted: 03 January 2021
Abstract: Currently, the 65Mn steel is quenched mainly by oil media. Even though the lower cooling rate of oil compared to water reduces the hardness of steel post quenching, the deforming and cracking of parts are often minimized. On the other hand, the oil media also has the disadvantage of being flammable, creating smoke that adversely affects the media. The poly alkylene glycol (PAG) polymer quenchant is commonly used for quenching a variety of steels based on its advantages such as non-flammability and flexible cooling rate subjected to varying concentration and stirring speed. This article examines the effect of PAG polymer quenching solution (with concentrations of 10% and 20%) on deformation, hardness, and microstructure of C-ring samples made of 65Mn steel. Furthermore, the performance of PAG polymer quenchant is also compared with those of two common quenching solutions: Water and oil. When cooling in water, the C-ring samples had the largest deformation and 2 times higher than the results obtained when a 10% PAG solution was used. In particular, similar levels of deformation on the C-ring samples were observed in both cases of 20% PAG solution and oil as the primary quenching media. Furthermore, the hardness level measured between the sampled parts quenched in the 20% PAG solution appeared to be more uniform than that obtained from the oil-quenched sample. The study of the microscopic structure of steel by optical microscopy combined with X-ray diffraction showed that the water hardened sample exhibited cracks and comprised of two phases, martensite and retained austenite. According to the results of Electron Back Scattering Diffraction (EBSD) analysis and backscattering electronic image (BSE), the content of austenite residue in the sample when the sample was cooled in PAG 10 and 20% solution was 3.21% and 4.73%, respectively and smaller than the measurements obtained from oil quenching solution. Thus, the 65Mn steel is cooled in 20% PAG solution for high hardness and more evenly distributed than when it is quenched in oil while still ensuring a small level of deformation. Therefore, the PAG 20% solution can completely replace oil as the main media used to quench the 65Mn steel.
Keywords: Polyethylene glycol; electron backscattering diffraction; quenching media; cooling rate; backscattering electronic image
In the quenching process, steel is heated to certain temperatures, at which it is kept for a determined period, and then it is cooled quickly. his process is suitable for the austenite to transform to martensite or other unstable structure with high hardness and strength [1]. The quality of the quenched product depends on many factors such as heating temperature, holding time, and cooling speed. Among these, the cooling rate which is determined by the quenching media is the most important factor (often called the quenchant) [2]. The cooling media should have a cooling rate equal to or greater than the critical cooling rate so that when cooling steel does not switch to a low hardness microstructure such as ferrite, perlite, or bainite [3]. On the other hand, the quenching media must have a small cooling rate that does not cause stress that can lead to part deformation or fracture, especially in the martensite transformation zone. Currently, there is a very diverse and rich selection of quenchant, including some liquid quenching media such as water, oil, polymer solution, and saltwater. In the gas-quenching environment, helium, hydrogen, argon, and nitrogen can be used to quench parts in a vacuum furnace. Some of these quenchants, however, could cause negative consequences to the environment [4–7]. With the quenching process, the mechanism of heat transfer was confirmed to be the same as when the metal was quenched in the water, oil, polymer solution (Fig. 1), including 3 stages: The vapor film phase (boiling stage), the bubble boiling stage and the convection (liquid cooling phase) [8–10].
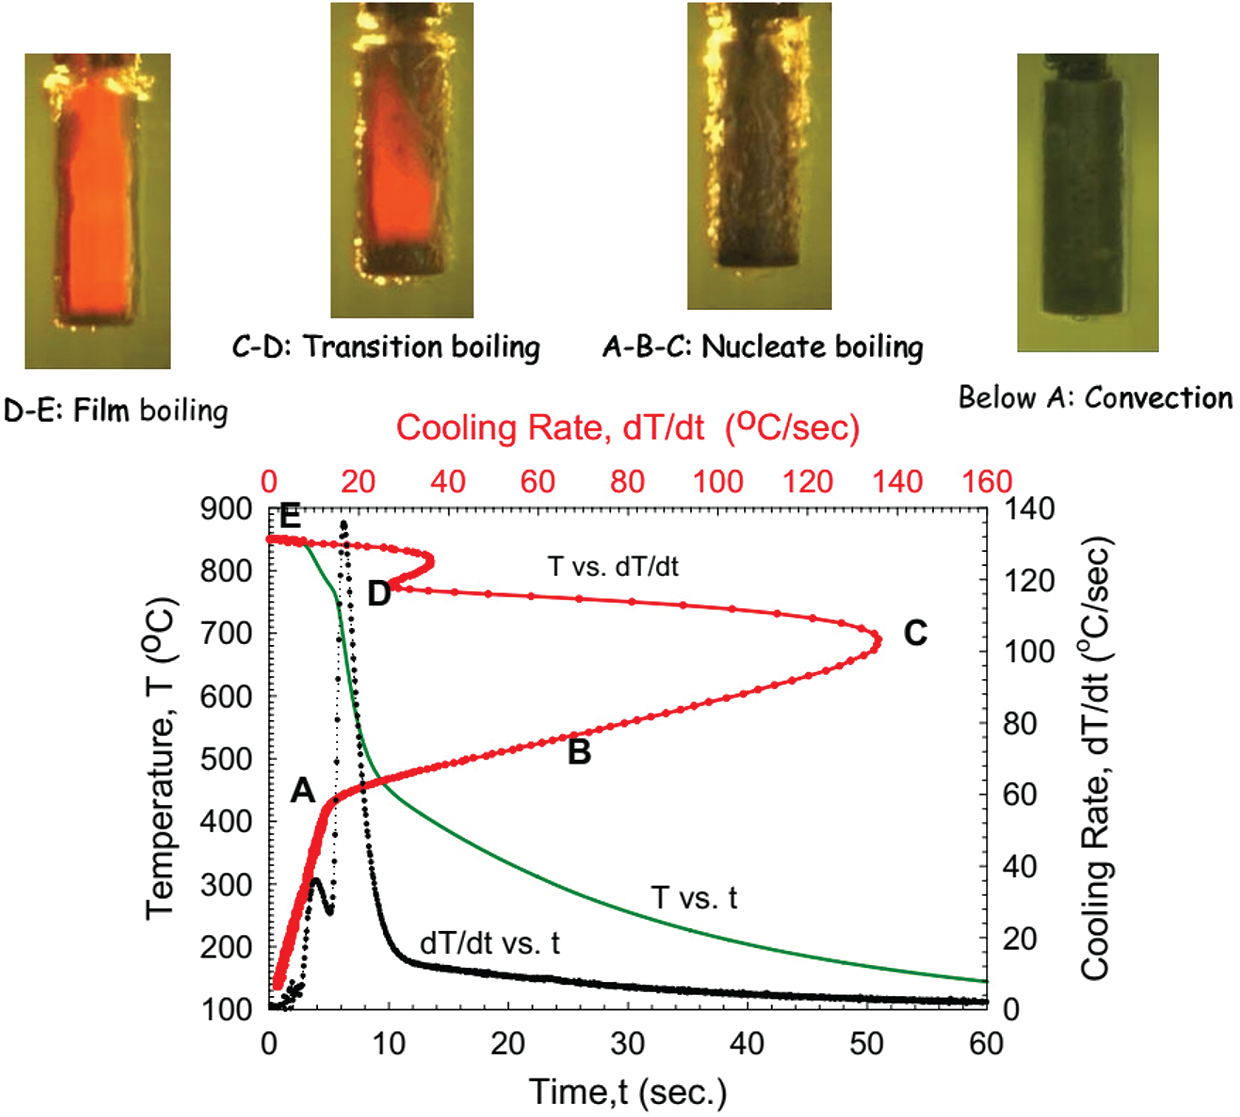
Figure 1: Cooling mechanism [9]
It could be seen from Fig. 1 that the boiling stage is the first one of cooling, marked from point E to point D. When the component is cooled in the quenching solution, the coolant will soak the metal surface. Because the temperature of the part is very high, immediately the liquid layer in contact with the surface of the component evaporates, forming a vapor film surrounding the part called a blanket. The formation of the vapor film surrounding the detail is characterized by the Leidenfrost phenomenon [11]. Because the vapor has a very small coefficient of thermal conductivity, the vapor film acts as an insulation layer, heat transfer process by radiation through the vapor film. Therefore, during this period the cooling process occurs at a slow cooling rate. For the polymer cooling solution, this stage is supplemented with the formation of a polymer-rich film, which wraps around the vapor blanket and makes the film slightly more stable than when the metal was quenched in water. This vapor film grows and is maintained when the heat source from the inside of a part surface of the part exceeds the total amount of heat needed to evaporate the slurry and maintain the vapor phase. The temperature at which the vapor film begins to be maintained is called the liquid characteristic temperature, or the Leidenfrost temperature [9]. The Leidenfrost temperature of a liquid does not depend on the quenching temperature of the part but depends on many factors and one of these factors has not been determined up to the present time [12]. Occasionally, the vapor film may be broken and maybe re-formed in certain areas of the part surface (Fig. 2) [13,14]. It is the main reason that leads to an unstable vapor film and transition to the bubble boiling stage. The heterogeneity of the heat transfer mechanism at the surface of the part during the boiling process leads to a high risk of deformation during tempering. The retention time of steam film depends on many factors: such as weight and shape of the part, physical properties of tempering media, temperature, and stirring speed.
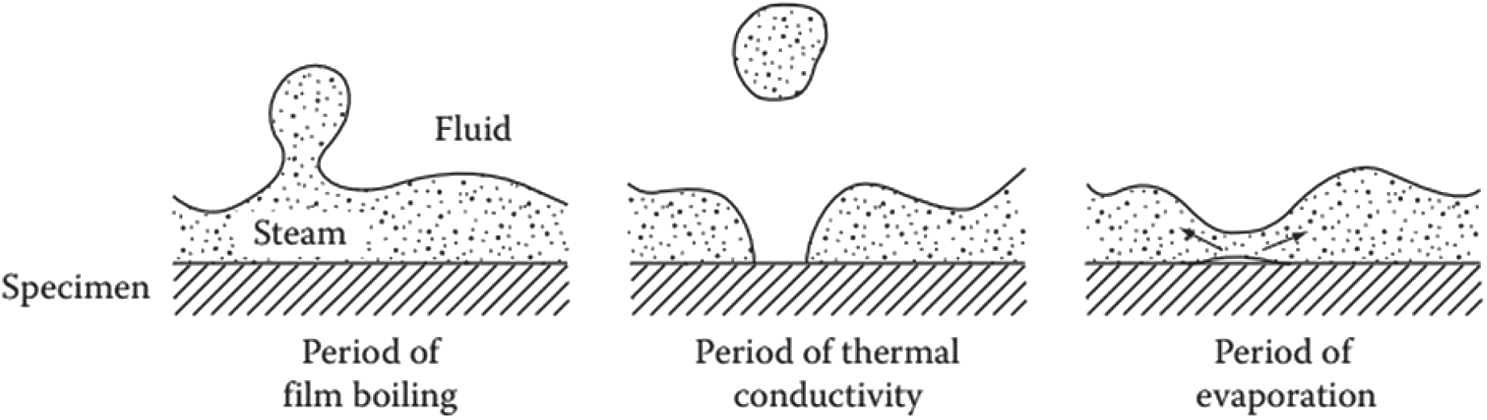
Figure 2: Heat transition having phases of wetting during film boiling [13,14]
When the temperature of the component drops below the Leidenfrost temperature of the liquid, the vapor film begins to break and the cooling solution wipes the surface of the hardened object (phase D–A), then the bubble boiling period begins. The cooling rate increases rapidly and reaches its maximum at point C. During this period, the heat exchange capacity is greatest due to the formation and separation of hundreds of small bubbles from the surface of the quenched material per second [13]. The duration of the bubble boiling period is directly proportional to the square of the thickness of the hardening metal and inversely proportional to the heat diffusion of matter. It depends on the shape of the slurry, the stirring speed, the kinematic viscosity, the initial temperature, and the thermal properties of the slurry. When the bubble boiling stage ends, the surface temperature of the part continues to fall below the boiling point of the liquid. The cooling rate of this stage is the smallest of the three stages and depends mainly on the stirring speed, the viscosity of the quenching solution [14]. The higher the viscosity of the solution, the smaller the stirring speed, the worse the convective heat transfer, so the smaller the cooling rate in the part. Because, at this stage, the austenitic phase transforms martensite, the cooling rate in this stage is as low as possible to minimize deformation and cracking of details. The complexity of quenching cooling in liquids can be described in Fig. 3 [15]. The three mechanisms of the cooling process (bubbling, bubble boiling, and convection) can occur simultaneously on the surface of a part. This shows a huge difference in the heat transfer coefficient, as well as the temperature field on different parts of the quenching material. It is this difference that leads to residual stress and deformation on the part after tempering.
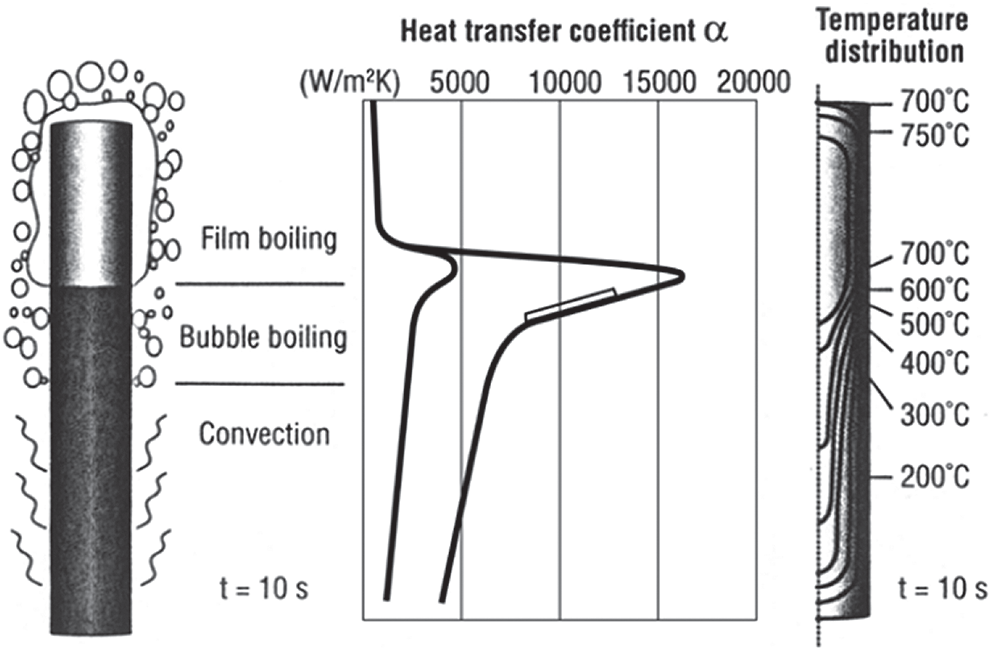
Figure 3: Heat transfer coefficient, temperature fields, and gradients at a cylinder when all three heat transfer mechanisms are present simultaneously [15]
Facing this situation, the polymer quenchants has been studied to apply to serve as the quenching medium for many types of steel. Among them, the Poly Alkylene Glycol (PAG) quenchant (an aqueous solution of a water-soluble of PAG has some advantages such as friendly, non-flammable, it was thus considered to use more [16]. The cooling process in PAG polymer quenching solution also consists of 3 stages: Vapor film, bubble boiling, and convection [17]. When steel is quenched in PAG solution, the formation of uniform polymer film evenly surrounds the details that reduce the gradient of temperature from the machine part to the quenchant, thus reducing the deformation of the details [18,19]. Besides, providing substantially greater safety concerning fire and disposal, polymer quenchants have been shown to provide more uniform heat transfer during quenching resulting in reduced thermal gradients and reduced distortion. The PAG quenching solution has also been researched for aluminum alloy plates 2024-T851, 7075-T73 [20–22]. The results showed that deformation and stress on aluminum alloy plate samples, when quenched in PAG solution, are smaller than when quenching in water. In addition to the above studies, the PAG quenching solution is also studied on steel for its resistance to deformation, while still ensuring the working requirements. According to document [23], a forging mold made of H13 steel (according to US standards) is also quenched in 23.5% PAG solution, the result shows that the hardness of steel when quenched in this PAG solution is 55–56 HRC higher than when quenched in oil with the hardness is 53–55 HRC, and the deformation on quenched samples in this polymer solution is smaller than when quenched in oil. The 65Mn steel is widely used in the manufacture of heavy machine parts, cutting blades and spring parts, etc. These parts usually work in relatively harsh conditions subjected to wear and brittle destruction [24]. To achieve high mechanical requirements, the 65Mn steel needs to undergo hardening processes such as quenching, in which the quenchant is the most important factor [25]. For a long time, the oil quenchant has been widely used to quench alloy steel in general and 65Mn steel in particular [26,27]. Li et al. [28] studied the results when the 65Mn steel was quenched in the oil media at different temperatures. The results showed that, in the range of  C, the strength and hardness of 65Mn steel increased firstly, reached the maximum at 790
 C, and then decrease with increasing quenching. In the temperature range, the hardness and the tensile strength of 830
 C and 790
 C twice quenched have the maximum values, and also appear to be better than that of samples 830
 C once quenched. The studying about wear resistance for 65Mn steel was also conducted by Du et al. [29]. The result showed that the optimum heat treatment parameter for maximum anti-wear ability is obtained as follows: 852.64
 C for quenching temperature, 18.36 min for quenching time, and 145.44
 C for tempering temperature, respectively. The oil-quenchant has a slow cooling rate, which reduces residual stress and deformation on machine parts after quenching, but the hardness and depth of the quenched layer do not meet the requirements to improve durability and lifetime of the machine parts. On the other hand, the oil-quenchant produces smoke and flame during quenching, it is dangerous and toxic to the media and people [30]. Therefore, the research of 65Mn steel quenching in a new quenching environment—different from oil is very important and urgent at present. This quenching environment needs to ensure the appropriate cooling rate for austenite to martensite conversion to occur, while reducing stress and deformation on the hardening part, and minimizing the risk of ignition and emissions of toxic fumes. Therefore, the research of 65Mn steel quenching in a new quenching media—different from oil is very important and urgent at present. From the above points, this study performs experiments involving the 65Mn steel in PAG polymer quenching solution with concentrations of 10% and 20% and then compared with quenching in the traditional quenchants such as oil and water. Based on the results of hardness, distortion, and microstructure, a suitable quenching medium will be selected for 65Mn steel to replace the oil-quenchant.
This study uses a C-ring sample made of 65Mn steel with the shape and size as described in Fig. 4. The C-ring sample is considered as a “standard sample” for studying of quenching process because the C-ring has different thicknesses, sharp corners, and gap opening, so with one sample, many factors can be studied in the quenching process such as heat transfer, phase transformation, hardness, stress, and deformation [31,32].
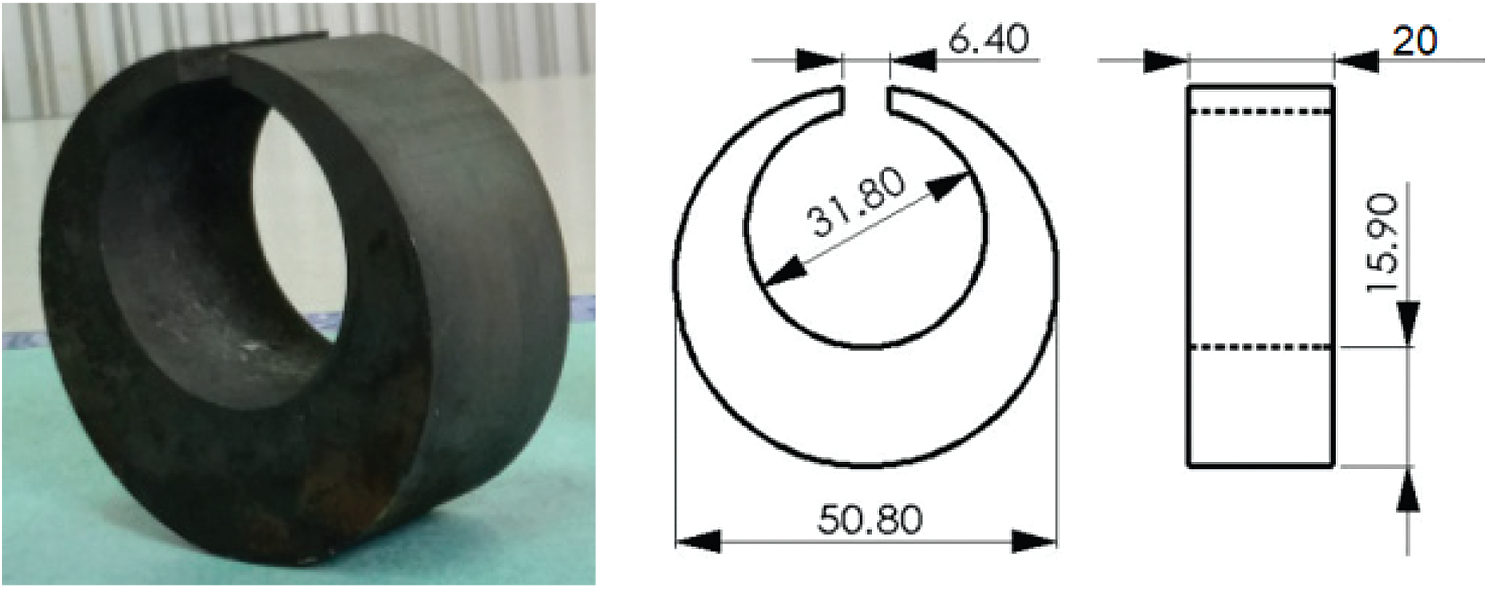
Figure 4: Shape and size of the C-ring sample
The C-ring samples with the same size, shape, and material are heated and kept at the same temperature and time but cooled at different rates corresponding to the quenchants are PAG 10%, PAG 20%, oil, and water. The cooling rates of PAG with a concentration of 10% and 20% are between water and oil. The quenching procedure of the C-ring sample is shown in Fig. 5. For the simultaneous study of deformation, hardness, and microstructure, C-ring samples are carried out according to the following procedure:
+ Step 1: Grinding and polishing the samples before quenching
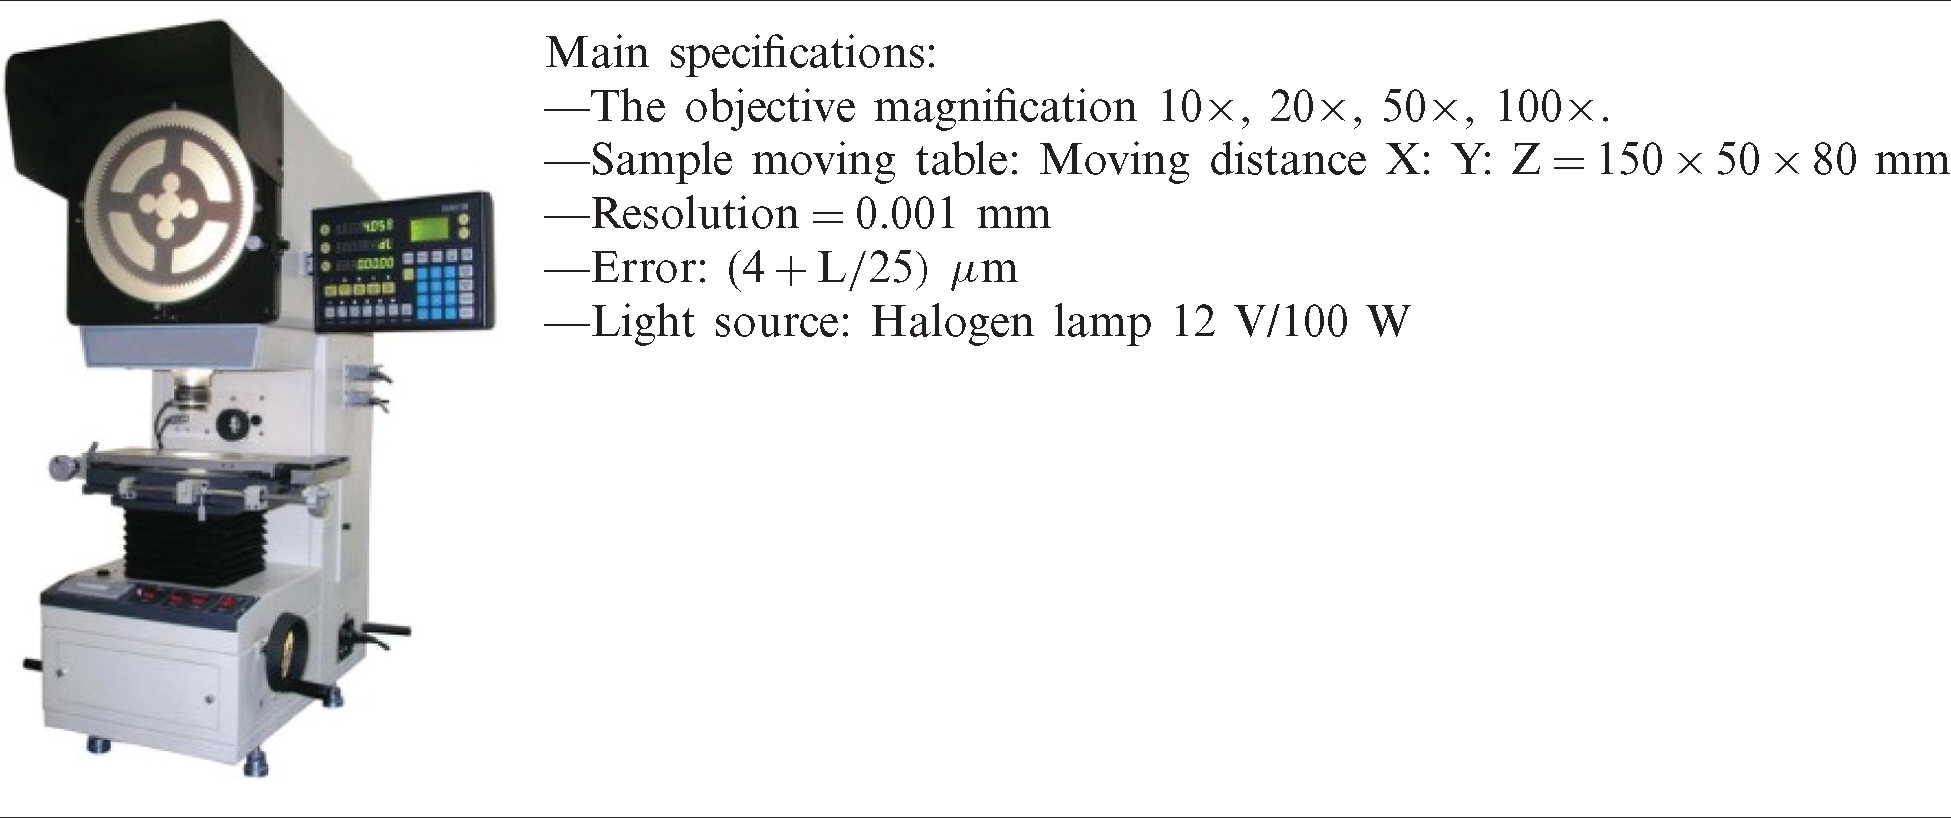
+ Step 2: Measure the gap width (n) of the C-ring samples before heat treatment (Fig. 6) by coordinate measuring machine—model Profile projector has images and parameters like Tab. 1.
+ Step 3: The samples were heated in the N11/H furnace and quenched following the procedure in Fig. 5.
+ Step 4: Preliminary cleaning and measuring the gap width (n′) of the samples after quenching (Fig. 6, also by the Profile projector machine). The changing of the gap opening of the C-ring is determined by the following expression:  . Besides, the deformation of the C-ring samples is determined by the following formula: %
 .
.
+ Step 5: The samples, after measuring the gap opening, are taken to cut by the wire electrical discharge machine and then polished to examine on the microscope Axiovert 100A (Carl Zeiss) and the samples were analyzed by XRD Smartlab Rigaku and EBSD of FE-SEM JEOL-7001FA.
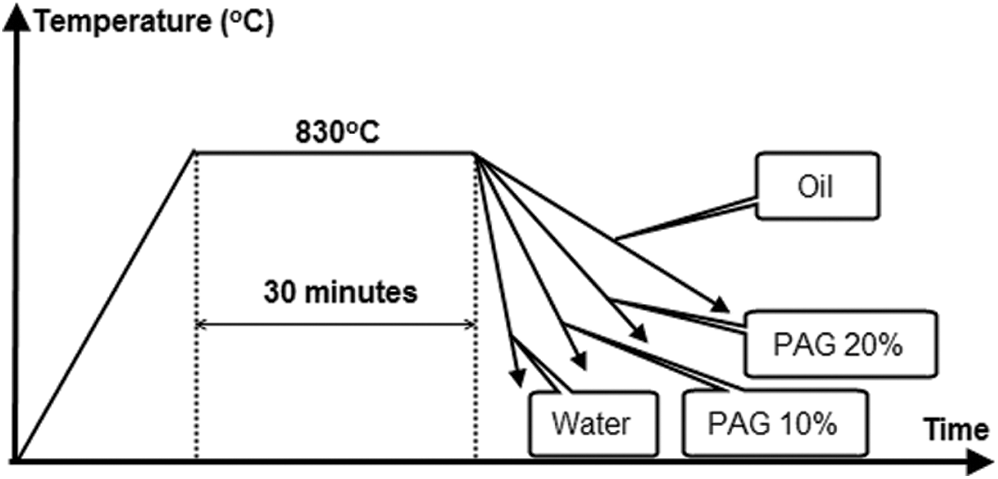
Figure 5: Quenching procedure of C-ring
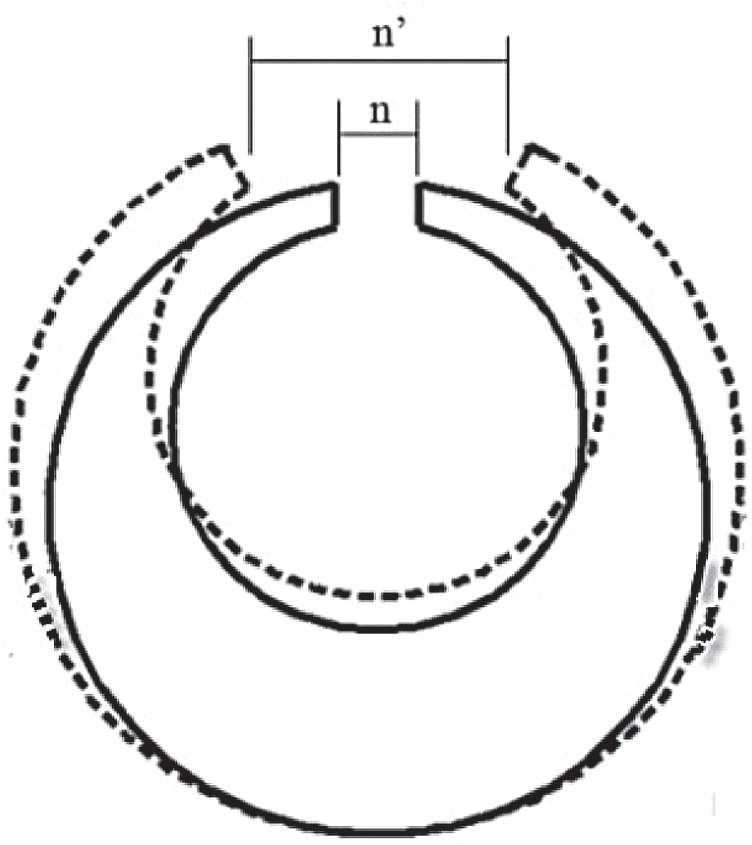
Figure 6: C-ring specimen before heat treatment (n dimensions) and after quenching (n′ dimensions)
Table 1: Main specifications of the sample sizing equipment
3.1 Distortion of the 65Mn Steel Samples when Quenched
Measure the gap opening of the C-ring before (n) and after (n’) quenching as described in Fig. 6 by using the coordinate measuring machine Profile projector with an accuracy of 0.001 mm, we get the results shown in Tab. 2. In which, the nominal size of the gap is  mm, but due to errors when making samples by the wire discharge cutting machine, the actual size of the different samples has different values. The results of measuring the gap openings of C-ring samples when quenched in different quenching media in Tab. 2 show that: After quenched in the quenchants, the gap of the C-ring samples always widened, as indicated by the value n’ measured after quenching is always greater than the value of n before quenching.
Table 2: Distortion of C-ring samples when quenched in different quenching media
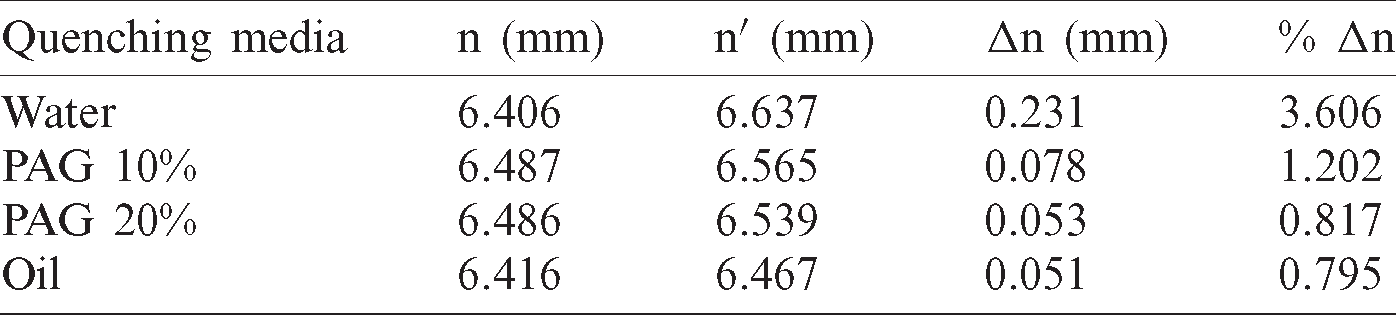
The deformation degree (%  n) of C-ring samples is determined by the formula and recorded in column 5 of Tab. 2, showing that: when the C-ring sample was quenched in water with a very high cooling rate, it was most deformed (approximately 3.6%), about 2 times larger than the quenched sample in PAG 10% solution (1,202%) and 4.4 times larger than the quenched sample in PAG 20% solution (0.817%). Thus, when dissolving the PAG polymer into the water to form a PAG polymer quenching solution, the deformation of C-ring samples is significantly reduced, the reason is that when dissolving PAG polymers in water, the viscosity of the solution will be increased that lead to a reduced the heat transfer capacity. On the other hand, when quenched in polymer quenchants there is always a polymer film surround the quenched parts-this film reduces the temperature gradient from the component to the medium, causing the cooling rate was decreased and evenly across the whole details. When increasing the concentration of PAG polymer in a solution from 10% to 20%, the cooling rate of the polymer solution was decreased and the deformation degree of the C-ring sample also decreased by approximately 1.47 times (from 1,202% to 0.817%). When the sample is quenched in oil, the deformation degree on the sample is the smallest, about 0.8%. That means the greater the cooling rate of the solution, the greater the deformation of the quenched sample. The measured results also showed that the deformation of the C-ring sample when quenched in PAG 20% polymer solution, is approximately the same as when quenched in oil quenchant. In other words, a PAG 20% polymer quenching solution gives a low deformation equivalent to the oil quenching medium.
3.2 Microstructure of the 65Mn Steel Samples When Quenched
The C-ring models of 65Mn steel with a thickness of 20 mm after quenching in different quenchants are subjected to deformation measurement, then cut into two halves through cross-section by the wire discharge cutting machine to switch to study the microstructure and hardness. Half of the sample after being cross-sectional continues to be chopped for sampling for metallographic analysis. The location of sampling is the B zone-the thickest and lowest cooling point of the C-ring sample (Fig. 7). To evaluate the results uniformly, the author used the method of wire cutting to take samples in region B with the same size of  (mm). To study the microstructure of steel after quenching in different media, the author used an optical microscope with a magnification of 1000 times and X-ray diffraction analysis. In the distribution of the phases in my sample, the author uses the Backscatter electrons image (BEI) method in combination with the image analysis software (Image pro plus) and Electron Backscatter Diffraction images (EBSD). Samples after being uniformly cut to the size
  mm will be numbered and then honed, polished, and etched in 4% HNO3 solution in alcohol for 15 s. The sample is then washed with water and dried before being taken to an optical microscope to take the microstructure. With the different quenching media, the results of the microstructure of samples are shown in Fig. 8.
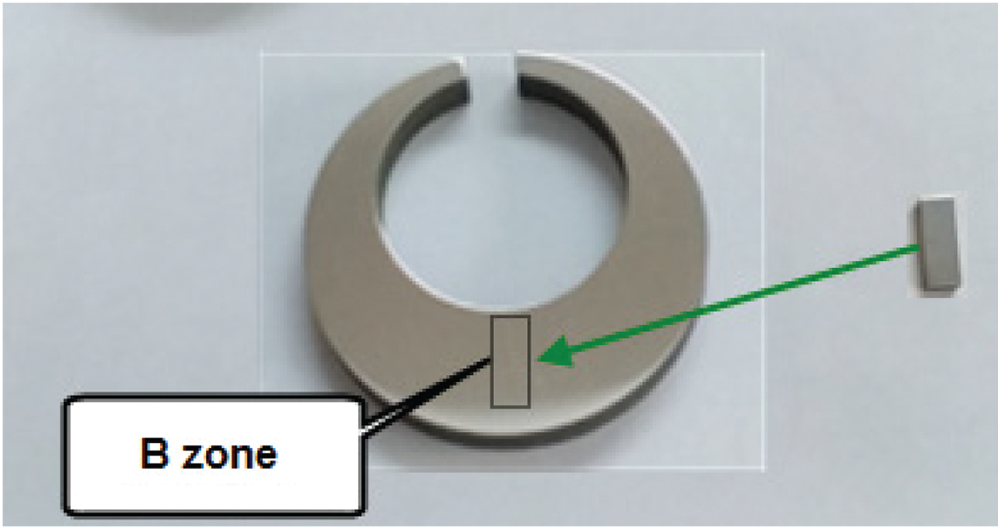
Figure 7: Sampling location for microstructure analysis
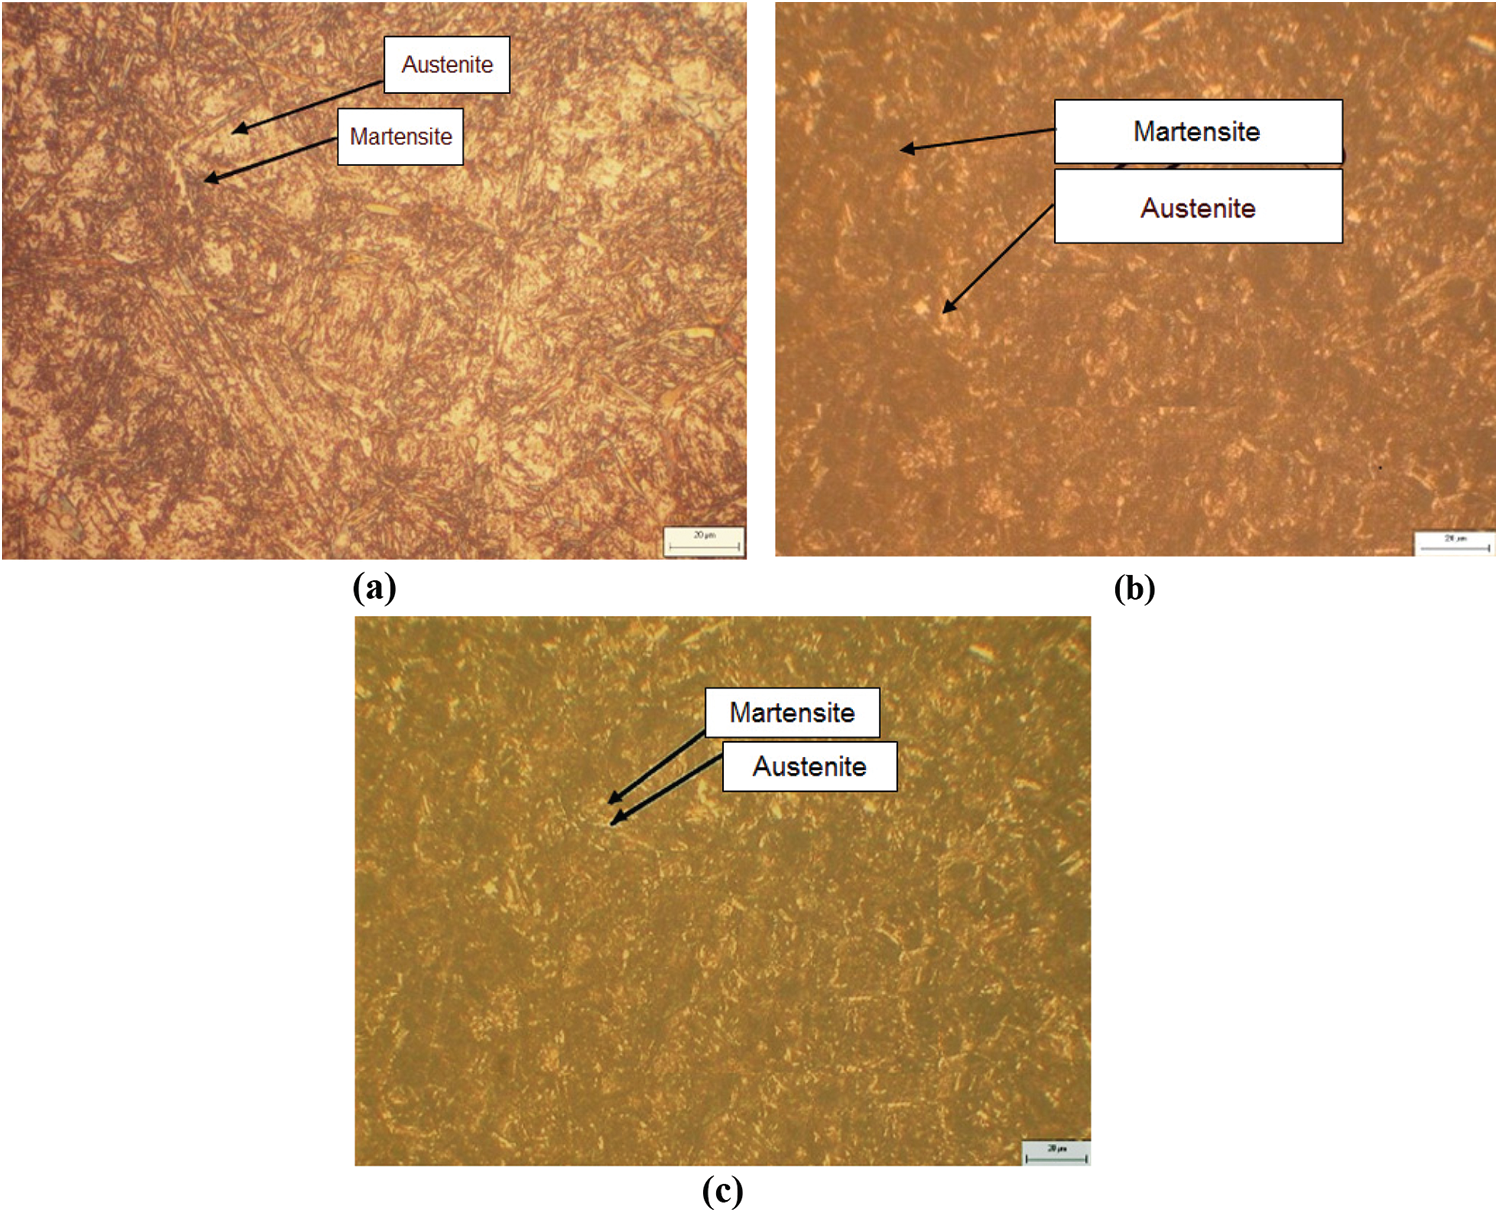
Figure 8: Microstructure of 65Mn steel after quenching in oil (a); in PAG 10% (b); and in PAG 20% (c)
From the results of optical microscopy we see, when samples were quenched in media of water, oil, 10% and 20% PAG on microorganism photos, it exists 2 phases retained austenite and dark martensite plates. However, the quenching media has a large cooling rate, so 65Mn steel after quenching had some cracked positions as shown in Fig. 9. The structure of the 65Mn steel after quenching includes martensite, manganese carbide, and residual austenite, but by optical microscopy, it can only distinguish martensite and residual austenite. To see clearly, manganese carbide is conducted by SEM images with a magnification of 10,000 times. However, SEM images of 65Mn steel when quenched in oil media, PAG 10 and 20% respectively in Fig. 10 did not observe manganese carbide. The results of the X-ray diffraction diagram of 65Mn steel samples tempered in 20% PAG and oil as shown in Fig. 11.
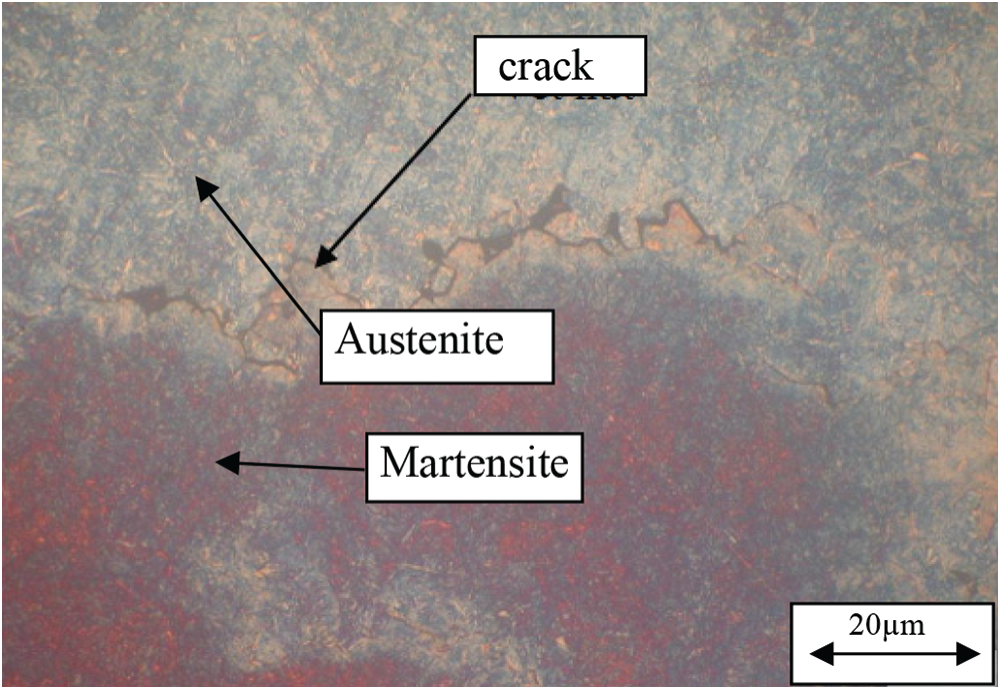
Figure 9: Microstructure of 65Mn steel after quenching in water
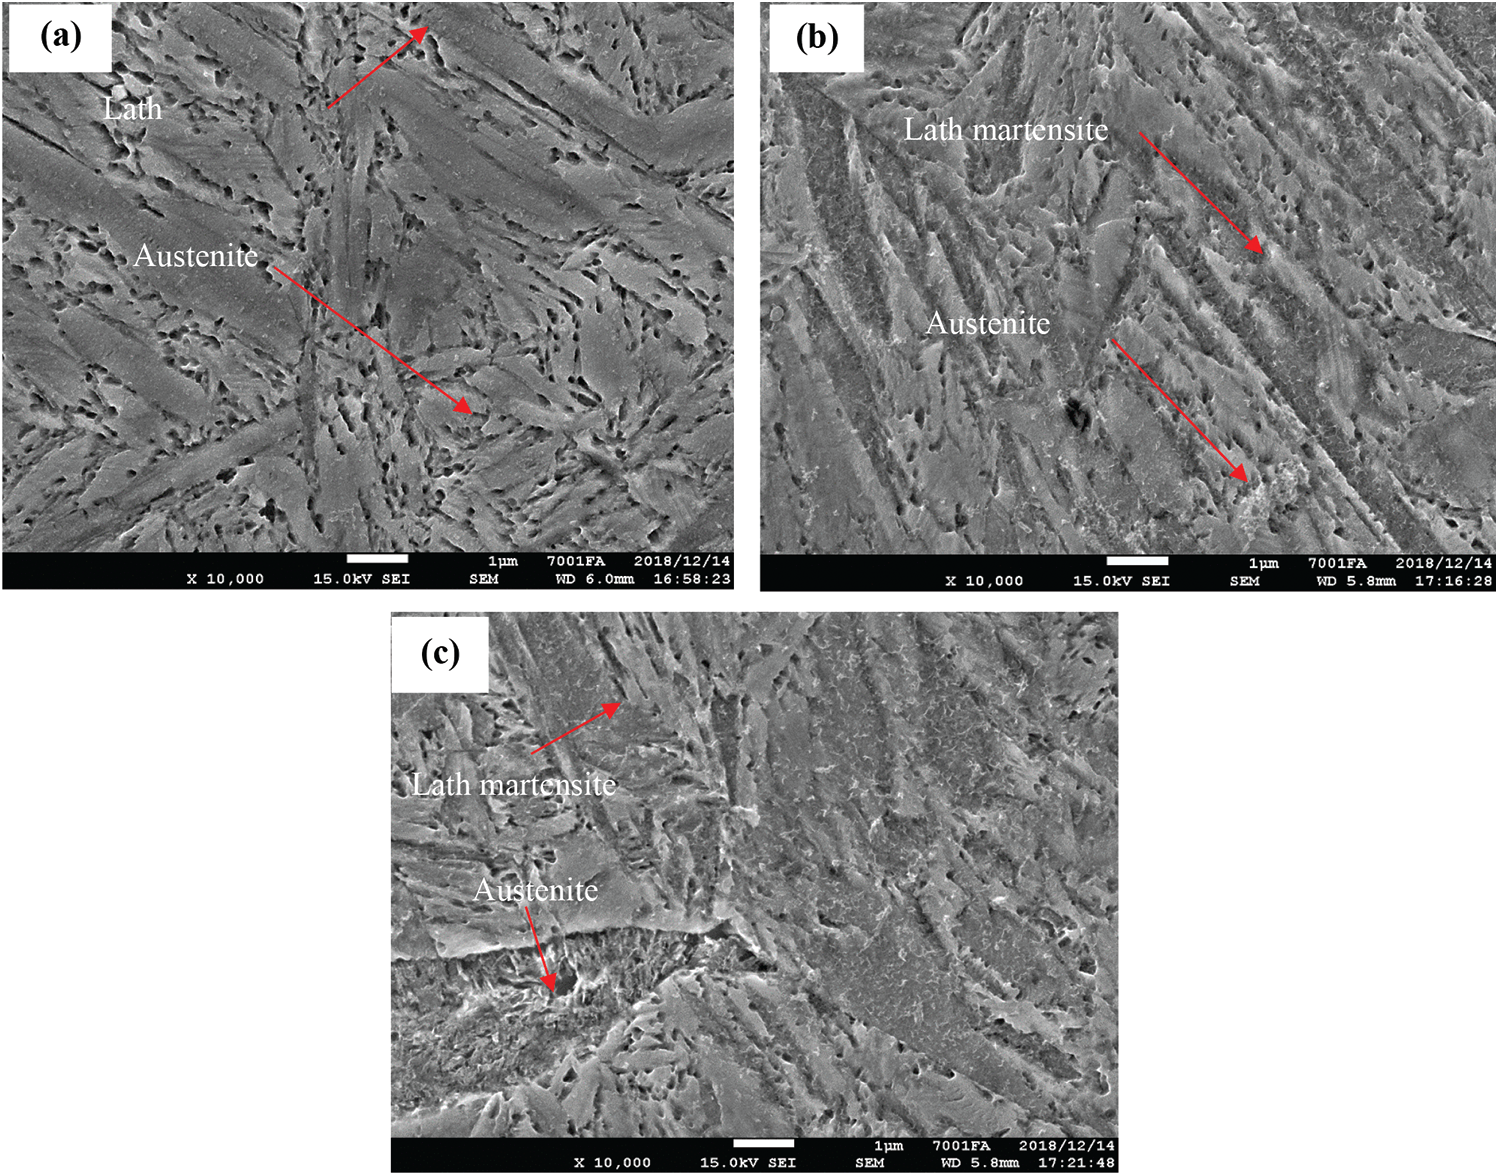
Figure 10: SEM of 65Mn steel after quenching; (a)—in PAG 10%; (b)—in PAG 20%; (c)—in oil
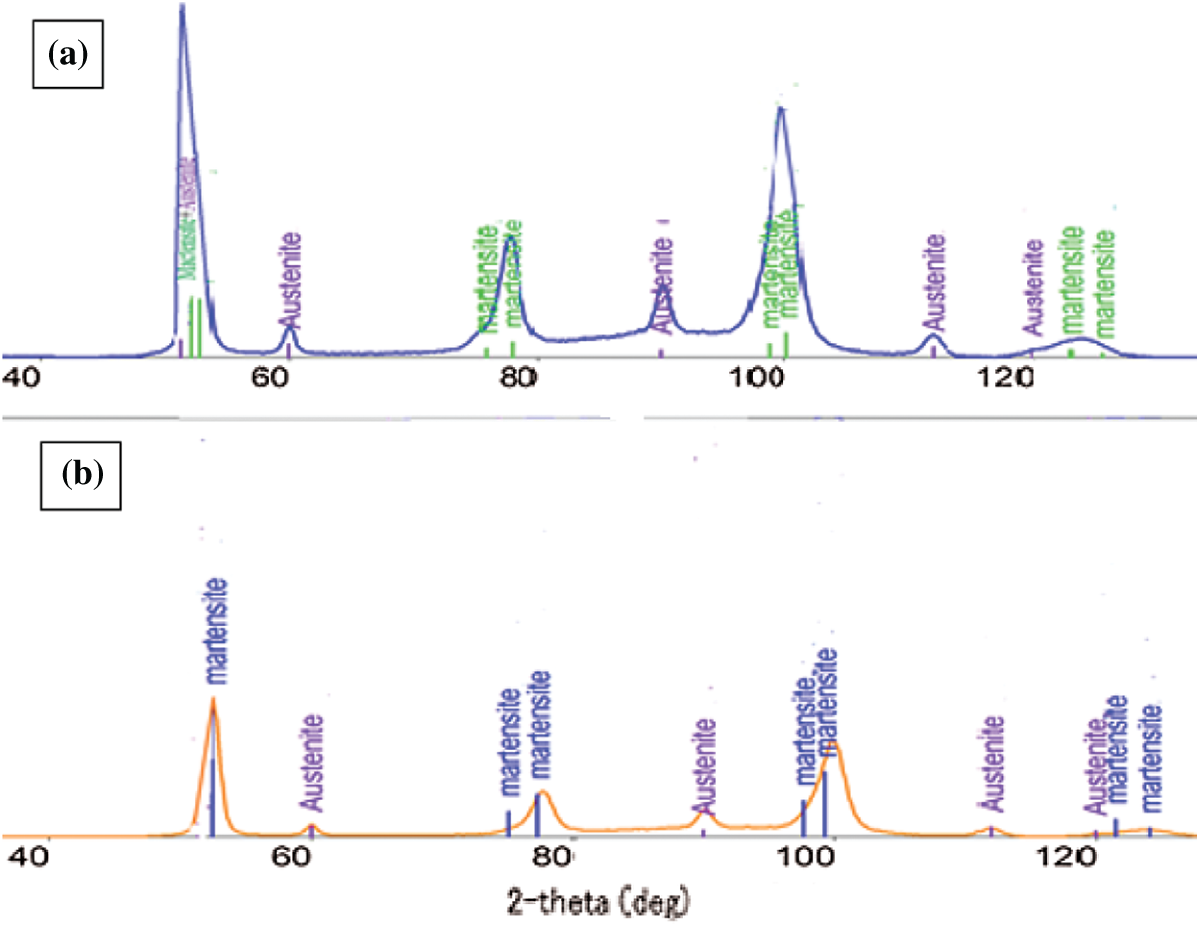
Figure 11: XRD of 65Mn steel after quenching in: (a) PAG 20%, và (b) oil
Fig. 11a is a diagram of X-ray diffraction of samples which cooled in 20% PAG solution. This result showed that a diffraction peak appeared of austenite and martensite phases. Thus, when the 65Mn steel sample is cooled in 20% PAG solution, in the microstructure, there exist two phases of martensite and retained austenite. Fig. 11b shows a diffraction diagram of a 65Mn steel sample when quenched in oil. The results obtained were similar to the sample cooled in 20% PAG quenching solution-the steel microstructure also includes two phases, martensite and retained austenite. Also on the diffraction pattern, there is no peak of manganese carbide, caused by very little manganese carbide, and very small size. Thus, the results of X-ray diffraction are completely similar to the results of the microscopic microstructure of the sample received in Figs. 8 and 10. To clarify the differences in microstructure between the samples quenched in oil, in PAG 10 and 20% solution, the author presents the composition results of the martensite and retained austenite phases.
Residual of austenite plays a crucial role in determining the hardness, toughness, and strength of martensitic steel alloys. The quenching of these alloys forms a hard martensite phase, but incomplete transformation can result in a retained austenite phase. Measurements of the amount of retained austenite is a crucial step for optimizing the processing conditions of martensitic steel alloys in order to achieve the desired mechanical properties. In this paper, to assess the proportion of residual austenite and martensite phases, we conducted an analytical analysis by EBSD (Electron Back Scattering Diffraction) technique. EBSD measurements were made on the FE-SEM JEOL-7001FA equipped with EDAD-TSL EBSD systems. The voltage used is 15 kV, the scanning step is 50 nm with two assumed phases: gamma iron (austenite) and alpha iron (martensite). Fig. 12 showed Inverse Pole Figure (IPF) map (a), GrayScale map (b), and phase map (c) obtained by EBSD analysis of 65Mn steel after quenching in PAG 20%. The results showed that there were only 2 phases in the sample: residual austenite (green) and martensite (red).
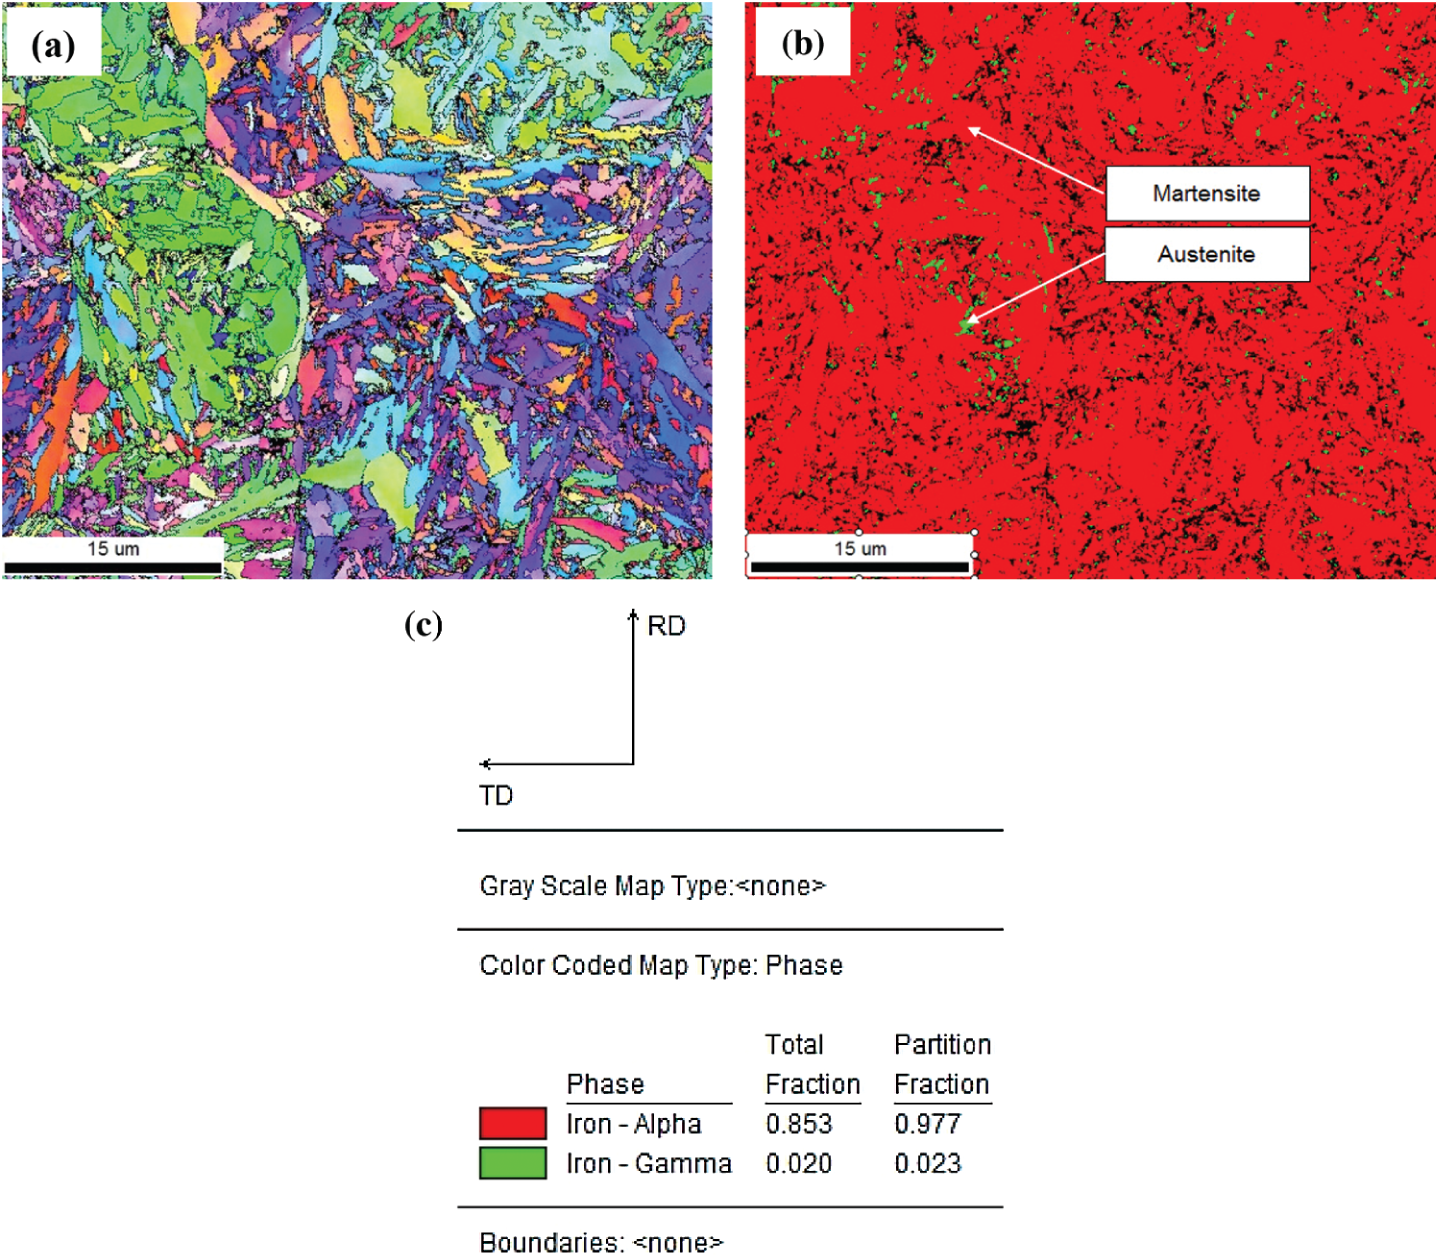
Figure 12: IPF map (a), GrayScale map (b), and phase map (c) obtained by EBSD analysis of 65Mn steel after quenching in PAG 20%
The results in Fig. 12a show the crystal orientation of martensite plates. In the same initial austenite grain, the color between the plates does not change much, in other words, the orientation of the martensite plates in the same initial austenite grain is similar. Comparing the results obtained in Figs. 12a and 12b, we see that the residual austenite phase exists between the martensite plates and has a much smaller size than the martensite plates. Figs. 12b and 12c results show that when quenched samples in 20% PAG, retain austenite content is approximately 2.3% and martensite phase content is approximately 98%. According to the EBSD analysis, theory to determine the excess austenitic content, when the residual austenite content is less than 10%, the accuracy of the analysis results will decrease. Continue to determine the residual austenite content by analyzing the backscattering electronic image (BSE) of 65Mn steel when quenching in oil, PAG 10 and 20% on Image-Pro plus software, we get the corresponding results in Fig. 13, the martensite phase is dark and retain austenite phase is light. On each sample, the results of retained austenite and martensite content in 3 BSE images were analyzed. The concentration of the retained austenite phase and martensite in region B on C-shaped samples when cooling in oil and 10 and 20% PAG solution is summarized Fig. 14. The sample quenched in 20% PAG solution measured by the EBSD method is about 2.73% smaller than the result measured through the BSE image. At the same time, we see that the sample is hardened in the media with a small cooling rate, the amount of retained austenite phase tends to increase.
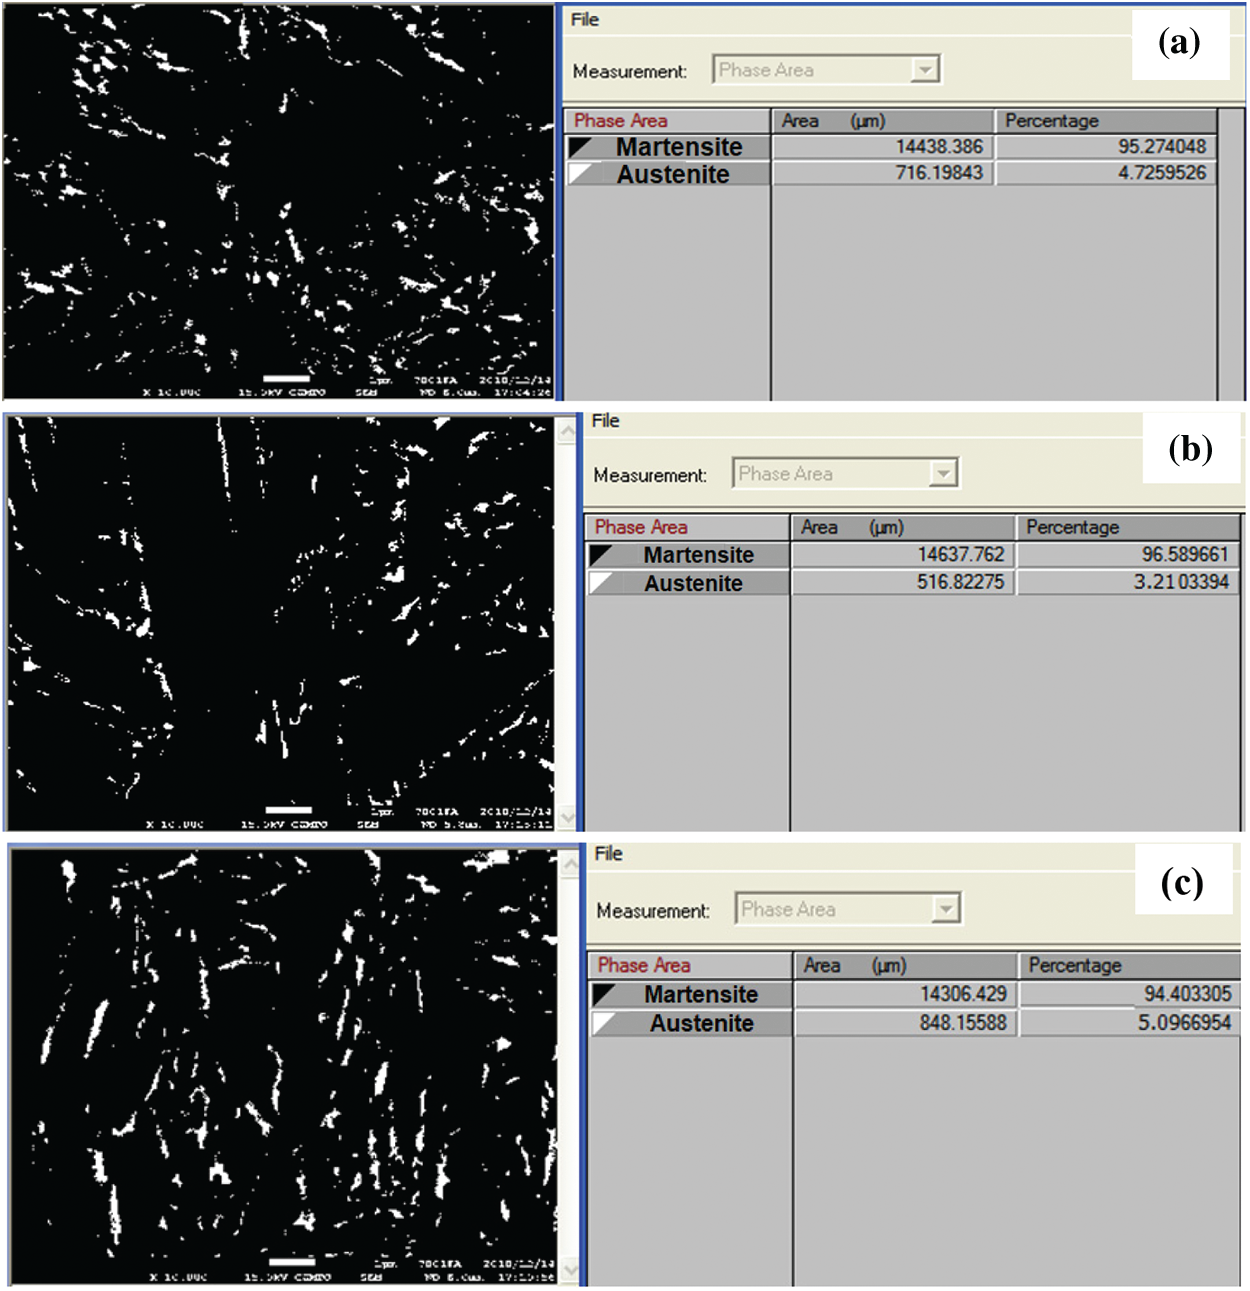
Figure 13: Backscattered electron microscope (BSE) image and content of phase in 65Mn steel after quenching process; (a)—in PAG 10%; (b)—in PAG 20%; (c)—in oil
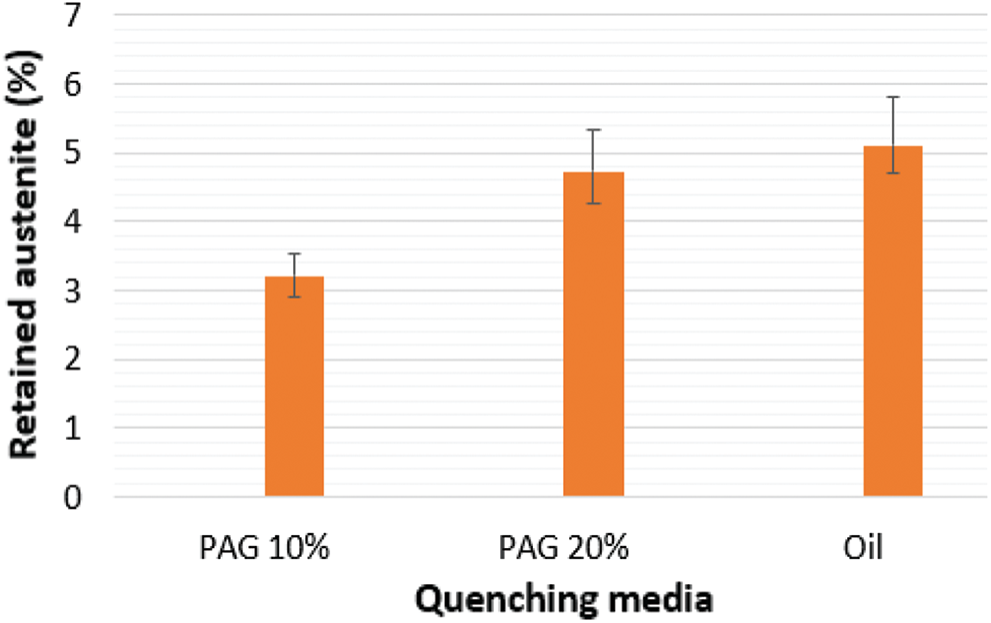
Figure 14: Content of retaining the austenite phase in 65Mn steel when quenching in a different media
3.3 Hardness of the 65Mn Steel Samples When Quenched in Some Quenchants
C-ring samples, after cooling in the quenching media of oil, water, PAG 10, and 20%, were taken to measure hardness in two areas A and B as shown in Fig. 15a. At each area, A and B on the sample Hardness is measured at 5 different locations and the hardness value received is the average of the five measurement points shown in Fig. 15b.
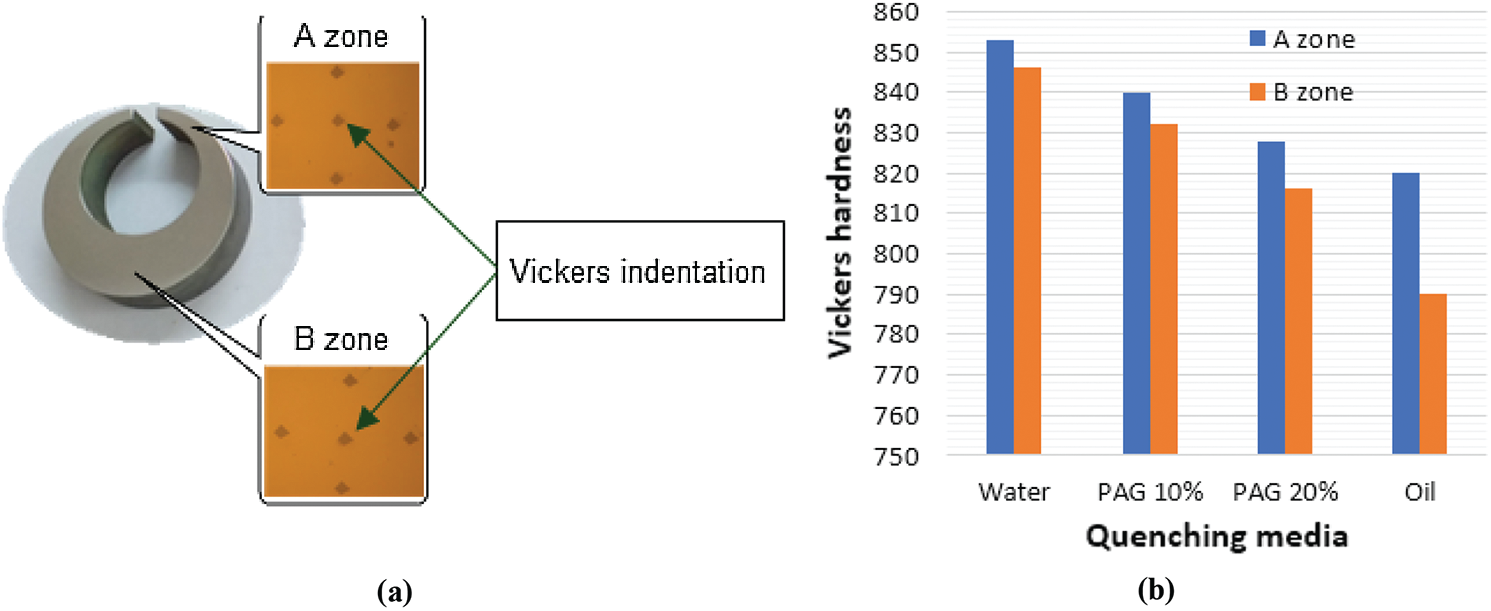
Figure 15: (a)—Vickers indentation and zone of C-ring sample and (b)—Hardness of C-ring sample in different quenching solution
From the results, the smaller the coolant in the quenching media, the lower the hardness gets. On the other hand, when the sample was cooled in a quenchant with a large cooling rate, the difference in hardness between regions A and B was smaller than the sample which was quenched with a small cooling rate. Specifically, when the sample was cooled in water and water solutions, the hardness difference between the 2 regions A and B is about 8 HV, but when using in the 10% PAG solution, the oil and 20% PAG, the difference in hardness between the regions A, B receive 8 respectively; 12 and 30 HV. Thus, when the sample was cooled in a solution with a greater cooling rate, the difference in hardness between regions A and B is smaller. In particular, in the 20% PAG solution, the sample deformation is similar to that when using the oil media, but the mechanical properties of the details are more even than when cooling in the oil.
The research results show that the C-ring sample made from 65Mn steel cannot be cooled in water because of great deformation and cracking of the part. Deformation on C-ring samples decreased by 1.47 times when the concentration of PAG polymers in solution increased from 10% to 20%. The C-ring sample tempered in 20% PAG solution has small deformation and close approximation to that observed in the sample when quenched in oil. The bigger the cooling rate in the solution is, the smaller the difference in hardness between the two regions A and B on the C-ring sample becomes. In particular, in a 20% PAG solution hardened on the whole parts more evenly than when quenched in oil. Specifically, when the sample was quenched in 20% PAG and oil, on the C-ring sample the difference in hardness between the thin area (A) and the thickest area (B) is 12 and 30 HV respectively. The retained austenite content measured by the BSE image analysis method based on Image-pro plus software shows that the smaller the sample in the cooler is, the higher austenite content in the structure of the steel is observed. Specifically, the residual austenite content when quenching in oil, PAG 20, and 10% solution are 5.1%, 4.73%, and 3.21%, respectively. Thus, when quenching in 20% PAG and oil, the residual austenite content in the sample shows very little difference (approximately 0.37%). Thus 20% PAG solution can replace the oil media to quench 65Mn steel. The paper indicated the potential results of using 10 and 20% PAG solution to temper 65Mn steel. The results of the paper are the basis for further research using PAG polymer solution, as well as other polymers with appropriate concentrations for quenching for some other alloy steels.
Acknowledgement: This research is supported by Industrial University of Ho Chi Minh City (IUH) under grant number 68/HĐ-ĐHCN. Additionally, the authors are grateful to Ho Chi Minh City University of Technology (HUTECH), Vietnam Maritime University, Hanoi University of Science and Technology for providing necessary facilities during the research.
Funding Statement: The author(s) received no specific funding for this study.
Conflicts of Interest: The authors declare that they have no conflicts of interest to report regarding the present study.
1. J. L. Dossett and H. E. Boyer. (2006). Practical Heat Treating. Ohio: ASM International. [Google Scholar]
2. A. T. Hoang, T. T. Van Tran, V. B. Nguyen and D. N. Nguyen. (2019). “Effect of heat treatment process on the microstructure and mechanical properties of the spray coating Ni–Cr on CT38 steel,” International Journal on Advanced Science, Engineering and Information Technology, vol. 9, no. 2, pp. 560. [Google Scholar]
3. G. E. Totten, J. L. Dossett, N. I. Kobasko, J. Dossett and G. E. Totten. (2013). “Quenching of steel,” ASM Handbook, vol. 4, pp. 91–157. [Google Scholar]
4. X. D. Pham, A. T. Hoang, D. N. Nguyen and V. V. Le. (2017). “Effect of factors on the hydrogen composition in the carburizing process,” International Journal of Applied Engineering Research, vol. 12, no. 19, pp. 8238–8244. [Google Scholar]
5. G. M. Abdulsahib and O. I. Khalaf. (2018). “Comparison and evaluation of cloud processing models in cloud-based networks,” International Journal of Simulation-Systems, Science & Technology, vol. 19, no. 5, pp. 1–6. [Google Scholar]
6. X. Xiang, Q. Li, S. Khan and O. I. Khalaf. (2021). “Urban water resource management for sustainable environment planning using artificial intelligence techniques,” Environmental Impact Assessment Review, vol. 86, pp. 106515. [Google Scholar]
7. O. I. Khalaf and G. M. Abdulsahib. (2019). “Frequency estimation by the method of minimum mean squared error and P-value distributed in the wireless sensor network,” Journal of Information Science and Engineering, vol. 35, no. 5, pp. 10. [Google Scholar]
8. K. N. Prabhu and P. Fernades. (2008). “Nanoquenchants for industrial heat treatment,” Journal of Materials Engineering and Performance, vol. 17, no. 1, pp. 101–103. [Google Scholar]
9. R. A. Wallis and W. G. Forgings. (2010). “Modeling of quenching, residual-stress formation, and quench cracking,” ASM Handbook, vol. 22, pp. 547–585. [Google Scholar]
10. S. R. Chitra, S. Sendhilnathan and S. Suresh. (2015). “Investigation of heat transfer characteristics of mgmnni/diw-based nanofluids for quenching in industrial applications,” Journal of Enhanced Heat Transfer, vol. 22, no. 1, pp. 1–28. [Google Scholar]
11. X. Luo and G. E. Totten. (2014). “Distortion control: Quenching apparatus for hardening parts: An overview,” Mater. Perform. Charact, vol. 3, no. 4, pp. 477–504. [Google Scholar]
12. I. P. Starodubtseva, A. N. Pavlenko and A. S. Surtaev. (2017). “Heat transfer during quenching of high temperature surface by the falling cryogenic liquid film,” International Journal of Thermal Sciences, vol. 114, pp. 196–204. [Google Scholar]
13. R. E. Henry. (1973). “A generalized correlation for the minimum point in film boiling,” in 14th National Heat Transfer Conf. AICHE-ASME. [Google Scholar]
14. J. Sinha. (2003). “Effects of surface roughness, oxidation level, and liquid subcooling on the minimum film boiling temperature,” Experimental Heat Transfer, vol. 16, no. 1, pp. 45–60. [Google Scholar]
15. A. Stich and H. M. Tensi. (1995). “Wärmeübertragung und temperaturverteilung mit benetzungsablauf beim Tauchkühlen,” HTM Härterei-technische Mitteilungen, vol. 50, no. 1, pp. 31–35. [Google Scholar]
16. X. T. Tran, T. D. Vu and K. Q. Dang. (2017). “Numerical simulation of the heat treatment process for 100Cr6 steel,” Acta Metallurgica Slovaca, vol. 23, no. 3, pp. 236–243. [Google Scholar]
17. G. Ramesh and N. K. Prabhu. (2011). “Review of thermo-physical properties, wetting and heat transfer characteristics of nanofluids and their applicability in industrial quench heat treatment,” Nanoscale Research Letters, vol. 6, no. 1, pp. 334. [Google Scholar]
18. N. Kobasko. (2007). “Some new approaches in the field of quenching fundamentals,” in Proc. of the 24th ASM Heat Treating Society Conf., Detroit, Michigan, USA, pp. 17–19. [Google Scholar]
19. N. Kobasko and B. Liscic. (2017). “Liscic/petrofer probe to investigate real industrial hardening processes and some fundamentals during quenching of steel parts in liquid media,” EUREKA: Physics and Engineering, no. 6, pp. 48–56. [Google Scholar]
20. G. S. Sarmiento, D. M. Coscia, C. Jouglard, G. E. Totten and G. M. Webster. (2000). “Residual stresses, distortion and heat transfer coefficients of 7075 aluminum alloy probes quenched in water and polyalkylene glycol solutions,” in 20th ASM Heat Treating Society Conf. and Show, St. Louis. [Google Scholar]
21. G. M. Webster, C. E. Bates and G. E. Totten. (2003). “Quenching,” in Handbook of Aluminum, New York: CRC Press, pp. 969–1060. [Google Scholar]
22. T. Croucher. (2010). “Using polyalkylene glycol quenchants to effectively control distortion and residual stresses in heat treated aluminum alloys,” in Quenching and Cooling, Residual Stress and Distortion Control, West Conshohocken, PA, USA: ASTM International. [Google Scholar]
23. G. Ramesh and K. N. Prabhu. (2016). “Effect of polymer concentration on wetting and cooling performance during immersion quenching,” Metallurgical and Materials Transactions B, vol. 47, no. 2, pp. 859–881. [Google Scholar]
24. T. C. Zhang and Z. Q. Peng. (2003). “Mechanical properties of 27 simn steel after critical temperature quenching and high temperature tempering,” Heat Treatment of Metals(China), no. 10, pp. 32–34. [Google Scholar]
25. M. K. Pham, D. N. Nguyen and A. T. Hoang. (2018). “Influence of vanadium content on the microstructure and mechanical properties of high-manganese steel,” International Journal of Mechanical & Mechatronics Engineering, vol. 18, no. 2, pp. 141–147. [Google Scholar]
26. H. Wang, Y. Zhao, X. Yuan, K. Chen and R. Xu. (2013). “Effects of boronizing treatment on corrosion resistance of 65Mn steel in two acid mediums,” Physics Procedia, vol. 50, no. 1, pp. 124–130. [Google Scholar]
27. Y. Wang, J. Sun, T. Jiang, C. Yang, Q. Tan et al. (2019). , “Super strength of 65Mn spring steel obtained by appropriate quenching and tempering in an ultrafine grain condition,” Materials Science and Engineering: A, vol. 754, pp. 1–8. [Google Scholar]
28. A. M. Li and M. J. Hu. (2011). “Microstructure and properties of 65Mn steel after austenite inverse phase transformation by sub-temperature quenching,” Advanced Materials Research, vol. 194, pp. 89–94. [Google Scholar]
29. Y. Y. Du and D. Jin. (2012). “Research on the effect of heat treatment parameters of rotary tiller blade on anti-wear properties,” Advanced Materials Research, vol. 391, pp. 620–624. [Google Scholar]
30. T. V. S. Rajan, C. P. Sharma and A. Sharma. (2011). Heat Treatment: Principles and Techniques, New Delhi, India: PHI Learning Pvt. Ltd. [Google Scholar]
31. C. Y. Nan, D. O. Northwood, R. J. Bowers and X. C. Sun. (2010). “Study on the dimensional changes and residual stresses in carbonitrided and ferritic nitrocarburized SAE, 1010 plain carbon steel,” Materials Science Forum, vol. 638, pp. 829–834. [Google Scholar]
32. M. Aramaki, M. Kozin, K. Yoshida and O. Furukimi. (2018). “Effects of nitriding-quenching and carburizing-quenching on wear properties of industrial pure iron,” HTM Journal of Heat Treatment and Materials, vol. 73, no. 3, pp. 131–143. [Google Scholar]
 | This work is licensed under a Creative Commons Attribution 4.0 International License, which permits unrestricted use, distribution, and reproduction in any medium, provided the original work is properly cited. |