DOI:10.32604/cmc.2021.015399
| Computers, Materials & Continua DOI:10.32604/cmc.2021.015399 | |
| Article |
CNN Ensemble Approach to Detect COVID-19 from Computed Tomography Chest Images
Department Computer Engineering, Advanced Lab for Intelligent Systems,
College of Computer and Information Sciences, King Saud University, Riyadh, 11543, Saudi Arabia
*Corresponding Author: Haikel Alhichri. Email: hhichri@ksu.edu.sa
Received: 19 November 2020; Accepted: 16 January 2021
Abstract: In January 2020, the World Health Organization declared a global health emergency concerning the spread of a new coronavirus disease, which was later named COVID-19. Early and fast diagnosis and isolation of COVID-19 patients have proven to be instrumental in limiting the spread of the disease. Computed tomography (CT) is a promising imaging method for fast diagnosis of COVID-19. In this study, we develop a unique preprocessing step to resize CT chest images to a fixed size ( pixels) that preserves the aspect ratio and reduces image loss. Then, we present a deep learning (DL) method to classify CT chest images based on the light-weight pre-trained EfficientNet-B3 CNN model and ensemble techniques. The proposed method, which we refer to as EfficientNet-B3-GAP-Ensemble, comprises an ensemble of a modified version of the EfficientNet-B3. We build the ensemble using multiple runs and multiple training epochs. We test the EfficientNet-B3-GAP-Ensemble on two common benchmark datasets, i.e., the COVID19-CT and SARS-CoV-2-CT datasets. The proposed method has outperformed state-of-the-art methods for both datasets. For the COVID19-CT dataset, it achieved 88.18% sensitivity, 88.29% precision, 88.18% accuracy, an F1-score of 88.15%, and AUC of 92.10%. With the SARS-CoV-2-CT dataset, we tested the proposed method under different train-test splits, i.e., 20%–80%, 50%–50%, and 80%–20%. For the latter split, the proposed method achieved 99.72% accuracy, 99.80% sensitivity, precision, and F1-scores, and an AUC score of 99.99%.
Keywords: COVID-19 detection; computed tomography; deep learning; convolutional neural network; EffecientNet-B3; ensemble techniques
The rapid global spread of COVID-19 put healthcare systems under tremendous pressure [1]. Doctors and researchers found themselves facing a daunting challenge to find ways to diagnose the disease quickly. Early diagnosis and isolation are key to fighting the disease by minimizing the speed of transmission [2]. The RT-PCR laboratory test is used as a reference tool to detect COVID-19. However, this test is expensive and time consuming. Typically, it takes one to two days to obtain the result. In some countries, it may take up to five days or more due to the overwhelming number of tests that need to be analyzed.
Therefore, a faster and less costly IT solution for COVID-19 detection is urgently required. In Wuhan, China, Tao et al. [3] studied 1014 patients who received both RT-PCR tests and computed tomography (CT) images of their chest. They found that 97% of patients with a positive RT-PCR test also had positive CT results. The relatively high cost of RT-PCR tests and the length of time required to obtain results, particularly in areas with epidemic levels of the disease [4], made CT chest images a potential, cost-effective diagnostic tool for COVID-19 [5].
Recently, DL has proven to be an important tool in medical image processing, for example, for classification, detection, and segmentation tasks [6]. DL models provide the ability to automatically extract features, thereby reducing the burden on medical specialists and enabling accurate diagnoses. DL outperforms traditional, manual feature extraction methods for CT images; such methods require medical experts and take significant time [7].
The number of studies focused on the detection of COVID-19 has increased in the last ten months [7], and several proposed methods have used CT chest scans. The problem with this body of research is the lack of benchmarks to compare results. Typically, researchers build their own datasets and use them for experimentation. However, standard datasets are beginning to become available. For example, Zhao et al. [8] made the relatively small COVID19-CT dataset available online. This dataset contains 746 CT chest images, 349 images of COVID-19 patients and 463 images of people who had not contracted the disease. Zhao et al. [8] developed a classification method based on multi-task and self-supervised learning that achieved an F1-score of 0.90, AUC of 0.98, and accuracy of 0.89. According to specialist in the medical field, models with that level of performance are sufficient for use in clinical environments. Recently, Soares et al. [9,10] collected a larger dataset, i.e., the SARS-CoV-2-CT dataset (2482 images), from hospitals in São Paolo, Brazil. These two datasets are available online and many research studies based on these datasets have been published [8,9,11–18]. Therefore, in this paper, we focus on these two datasets.
Wang et al. [11] collected 1,065 CT chest images, 325 images of pathogen-confirmed COVID-19 cases and 740 images of patients previously diagnosed with typical viral pneumonia. They modified the inception transfer-learning model to establish an algorithm and then performed internal and external validation. The external testing dataset showed a total accuracy of 79.3%, with specificity of 0.83 and sensitivity of 0.67. Additionally, in 54 COVID-19 images 46 were predicted correctly as COVID-19 positive by the algorithm (85.2% accuracy). Song et al. [12] proposed a DL-based DRE-Net architecture that aims to quickly and accurately diagnose COVID-19 using CT chest images. Their proposed model was able to distinguish between bacterial pneumonia and viral pneumonia (COVID-19). The proposed structure achieved high performance and outperformed ResNet, DenseNet, and VGG16 for both detection and classification of pneumonia. The DL-based DRE-Net architecture could differentiate COVID-19 patients from others with an excellent AUC of 0.99 and recall (sensitivity) of 0.93. Additionally, the proposed model could differentiate COVID-19 infected patients and bacteria pneumonia-infected patients with an AUC of 0.95 and recall (sensitivity) of 0.96. In another study,
He et al. [13] proposed a Self-Trans approach, which synergistically integrates contrastive self-supervised learning with transfer learning to learn powerful and unbiased feature representations to reduce the risk of overfitting. Their approach achieved an F1-score of 0.85 and an AUC of 0.94 in diagnosing COVID-19 from CT scans. Mobiny et al. [14] proposed a novel learning architecture, called Detail-Oriented Capsule Networks (DECAPS), for automatic diagnosis of COVID-19 from CT scans. They constructed a network that combines the strength of capsule networks with several architectural improvements meant to boost classification accuracy. First, DECAPS uses an inverted dynamic routing mechanism that prevents the passage of information from non-descriptive regions, thereby increasing model stability. Second, DECAPS employs a Peekaboo training procedure that employs a two-stage patch crop and drop strategy, which fosters the generation of activation maps for every target concept. The proposed model was tested on the COVID19-CT dataset and achieved 84.3% precision, 91.5% recall, and 96.1% AUC, significantly outperforming previous methods. Polsinelli et al. [15] selected a light pre-trained convolutional neural network (CNN) called SqueezeNet to build a solution for efficient discrimination of COVID-19 CT images from other CT images, such as community-acquired pneumonia and/or images of healthy individuals. On the COVID19-CT dataset, the proposed modified SqueezeNet CNN achieved 83.00% accuracy, 85.00% Sensitivity, 81.00% specificity, 81.73% precision, and an F1 score of 0.8333. Additionally, SqueezeNet was very efficient, returning results in 7.81 s on a mid-range laptop without GPU acceleration.
As mentioned previously, Soares et al. [9] built and made available the SARS-CoV-2-CT dataset. The data was collected from real patients in Brazilian hospitals. The dataset contained 2482 CT scans, 1252 CT scans positive for SARS-CoV-2 infection (COVID-19) and 1230 CT scans for patients not infected by COVID-19. Then, they introduced a baseline approach using an explainable DL approach that achieved an F1-score of 97.31% when trained on 80% of the dataset. Angelov et al. [16] used the SARS-COV-2 dataset and proposed an approach to detect COVID-19, which they referred to as an explainable DL classifier. The proposed method achieved 88.6% accuracy, 89.7% precision, 88.6% recall, 89.3% F1-score, and 88.6% AUC. Jaiswal et al. [17] introduced a COVID-19 classification model based on deep transfer learning using the pre-trained DenseNet201 model. This model can classify CT chest images with an overall accuracy of 97%. Silva et al. [18] proposed an efficient DL technique for screening COVID-19 using a voting-based approach. In their approach, images from a given patient are classified together as one unit in a voting system. The approach was tested using the COVID19-CT and SARS-CoV-2-CT datasets using a patient-based split. A cross-dataset study was also performed to assess the robustness of the proposed method in a more realistic scenario, in which the data come from different distributions. The cross-dataset analysis showed that the generalization power of DL models is not sufficient for the task since accuracy for the COVID19-CT dataset dropped from 87.68% to 56.16% on the best evaluation scenario.
Hu et al. [19] presented a design for weakly supervised DL using CT chest images for automatic detection and classification of COVID-19 infection. Their proposed model made it possible to distinguish COVID-19 cases from community-acquired pneumonia and non-pneumonia, and achieved high classification accuracy. Additionally, it could detect the exact location of pneumonia lesions. Harmon et al. [20] introduced a series of DL algorithms, trained in a CT chest scans from four hospitals in China, Italy, and Japan. Additionally, the clinical timing and practice to obtain CT scans varied significantly. These algorithms were evaluated on an independent test group, which differed from the training group, and achieved 90.8% accuracy for classification of COVID-19 with sufficient scalability.
In a study by Xu et al. [21] the candidate infection regions were segmented out from a pulmonary CT image set using a 3D DL model. These separated images were then categorized into COVID-19, IAVP, and irrelevant to infection groups using a location-attention classification model that achieved overall accuracy of 86.7%.
In this work, we first propose a method for preprocessing CT chest images and unifying their sizes without distorting the aspect ratio or losing any part of the image. Using this method, all images are resized to  pixels. Then, we propose a method to classify COVID-19 CT chest images based on a modified EfficientNet CNN model and ensemble techniques. The proposed method is based on a new family of powerful CNN models called EfficientNet [22]. We selected the EfficientNet-B3 CNN model because it presents a reasonable compromise between performance and required computational resources. Then, we propose and investigate two modified versions, i.e., EfficientNet-B3-GAP and EfficientNet-B3-GAP-FC(128). Finally, we present the complete method based on ensemble techniques. We call the complete method EfficientNet-B3-GAP-Ensemble. We perform many experiments and test the proposed EfficientNet-B3-GAP-Ensemble method on two benchmark CT image datasets. The experimental results demonstrate that the capabilities of the proposed approach.
The primary contributions of this study are as follows:
• We propose an effective preprocessing step to unify the size of CT chest images without distortion or loss of image parts.
• We present an innovative DL solution for the diagnosis of COVID-19 using CT chest images based on the pre-trained EfficientNet-B3 CNN model and ensemble techniques.
• We present an effective ensemble approach to improve the overall accuracy of the solution and reduce its variability based on building an ensemble using multiple runs and multiple epochs.
The remainder of this paper is divided into three sections. The proposed methodology is presented in Section 2. Section 3 describes the experimental work and results. Conclusions and suggestions for future work are presented in Section 4.
In this section, we present the details of the proposed solution based on a modified version of one of the EfficientNet CNN models and ensemble techniques.
2.1 Proposed EfficientNet-B3-GAP-Ensemble Method
In 2019, Tan et al. [22] developed EfficientNet, a new family of CNN models that focuses on measuring different network dimensions, i.e., width, depth, and resolution. Their proposed method scales each dimension of the network uniformly by a fixed set of measurement coefficients to achieve high accuracy and efficiency [22].
Compared to previous CNN models, the family of EfficientNet CNN models achieved higher performance on the ImageNet dataset, which contains  14 million images. EfficientNet showed a performance increase of up to 5% for the same number of parameters. This also means it is much faster than previous CNN models. The EfficientNet family consists of eight models, starting from the smallest base model, called EfficientNet-B0, and extending to the largest model, called EfficientNet-B7. The baseline model was developed using the automatic machine learning MNAS framework, which automatically searches for a CNN model that optimizes both precision and effectiveness. The B1 to B7 models are scaled up versions of B0. The idea of building deeper models from a baseline using a well-thought-out scaling approach is the main contribution of Tan et al. [22].
In this work, we investigate two modified versions of the EffecientNet-B3 model. These versions are illustrated in Fig. 1. The original EffecientNet-B3 model is shown in Fig. 1a. To build the proposed two versions, we remove the top layers, indicated by the red lines in Fig. 1a. Then, we replace these layers with our own top layers, which are shown in yellow in Figs. 1b and 1c. The feature map sizes are shown below each layer. The original layers of the EffecientNet-B3 model are pre-trained on the ImageNet dataset [23]. Consequently, initially, the new added layers will be assigned random weights. Then, during training, all model weights are updated using the back-propagation algorithm, which is the main algorithm for training neural network models.
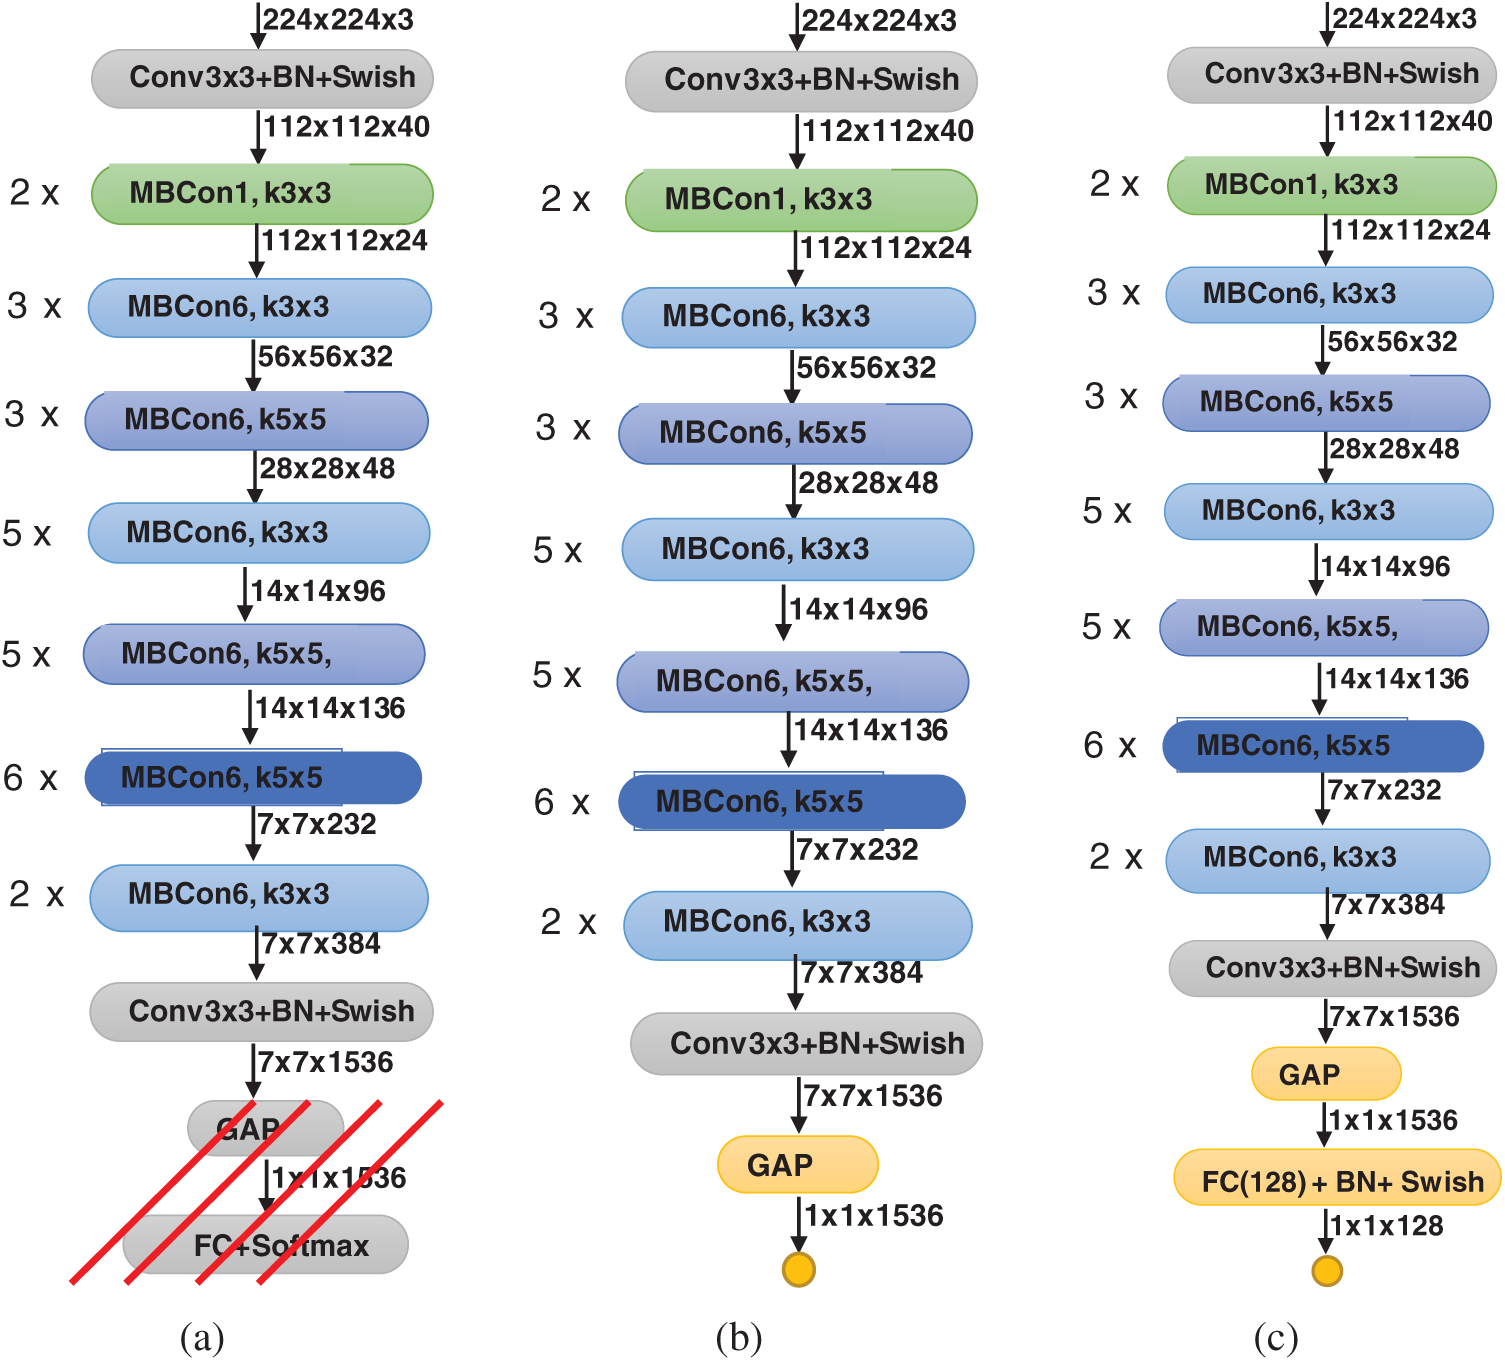
Figure 1: Modified versions of proposed EfficientNet-B3 model; (a) original pre-trained model, (b) EfficientNet-B3-GAP, (c) EfficientNet-B3-GAP-FC(128)
When we remove the top layers of the EfficientNet-B3 model, the output of the new top layer is a feature map that is the result of successive convolutional and other operations. Here, let the size of the feature map be  (in this model it is
  ), where
  is the size of convolved images and C is the number of channels, which correspond to the number of convolutional filters. In version one, i.e., EfficientNet-B3-GAP, we apply a global average pooling (GAP) layer to flatten the feature map into a single feature vector and then follow it by the output neuron, which is fully connected to all neurons in the GAP layer. The GAP layer performs the following averaging operation:

where Fi, j are the individual feature vectors in the feature map. Thus, the size of the output feature F is now  . The output neuron uses the sigmoid activation function, which is given by

The sigmoid function produces a value in the range [0, 1], which is considered the probability of belonging to the COVID-19 class. Therefore, given the output P(Mi) of the model for a given image Mi, we consider that it represents a COVID-19 case if  , where T is a given threshold. In our case, we set T = 0.5.
In the second version, called EfficientNet-B3-GAP-FC(128), we add an extra fully connected layer between the GAP layer and the output layer. The size of this fully connected layer is 128, and it is followed by a BatchNormalization layer, then by the novel Swish activation function, and finally the output neuron. We use BatchNormalization because it is effective in combating network overfitting, as suggested in the literature [24]. Overfitting occurs when the CNN model learns the training data extremely well but does not generalize well to other testing data. It is a common problem in DL models, and the risk of falling into this problem increases in situations where the training dataset is small, which is the case in this study.
Machine learning algorithms always produce results with a degree of variability [25] because, in such algorithms, many steps involve a degree of randomness. Thus, one way to improve the performance of machine learning algorithms is to use ensemble learning. One of the main types of ensemble learning is called stacking or stacked generalization [26–28]. Stacking has been successfully implemented in regression, density estimations, distance learning, and classification, and has been used in many medical applications [29–31]. This technique works because it allows multiple algorithms to collaborate to solve the same problem; the various solutions can be aggregated into one better final solution.
In our work, we propose to implement stacked generalization in two ways. The first approach is to generate an ensemble of M classifiers by performing multiple training runs of the same model. We refer to this as the multiple-runs ensemble. In the second approach, an ensemble can be obtained by varying the number of training epochs. We accomplish this by training a model for 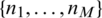 epochs. A copy of the trained model is saved each time we reach a given number of epochs. Thus, we refer to this approach as multiple-epochs ensemble.
Once we have built an ensemble of models, we can aggregate their results in many ways. Here we use the naïve unweighted average of the output probabilities, as shown in Eq. (3):

Here, pm is the output probability of the Mth model for the given image xi, and  is the final fused output probability of predicting the COVID-19 class. Naïve unweighted averaging reduces the variability of the model’s outputs. Additionally, naïve unweighted averaging is also effective in improving performance of CNN models of similar architectures [26].
The goal of a classifier is to learn to predict the class of a given input sample xi. Training is the process of updating the parameters of the classifier, e.g., the different convolutional filters and other weights in the CNN, until its predictions match the true class for all or most of the training samples.
Our problem is a binary classification scenario where the CNN outputs a probability p(xi) of the given sample xi belonging to class one (the COVID-19 class). Consequently, the probability that the same sample belongs to class zero (the non-COVID-19 class) is 1 − p(xi). This description reminds us of Bernoulli distribution in statistics; thus, we can use this distribution to model the output of the network. The Bernoulli distribution is defined as follows:

or

A neural network learns to produce an approximate probability distribution  of a true probability distribution
  . The true probability distribution
  is usually unknown. However, we have training data
 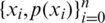 that can be used to estimate it. For each training sample xi, the network will produce a prediction
  .
.
To measure how good the prediction of the CNN model is, we need a metric that can measure the distance between distributions. Cross entropy (CE) is widely used to indicate the distance between what the model believes the output distribution should be and what the original distribution actually is. CE is defined as follows:

and the total CE loss is computed over all training samples xi:

The optimal weights W of each CNN model of the ensemble are learned by minimizing the cross entropy loss function.
3.1 COVID-19 CT Image Datasets
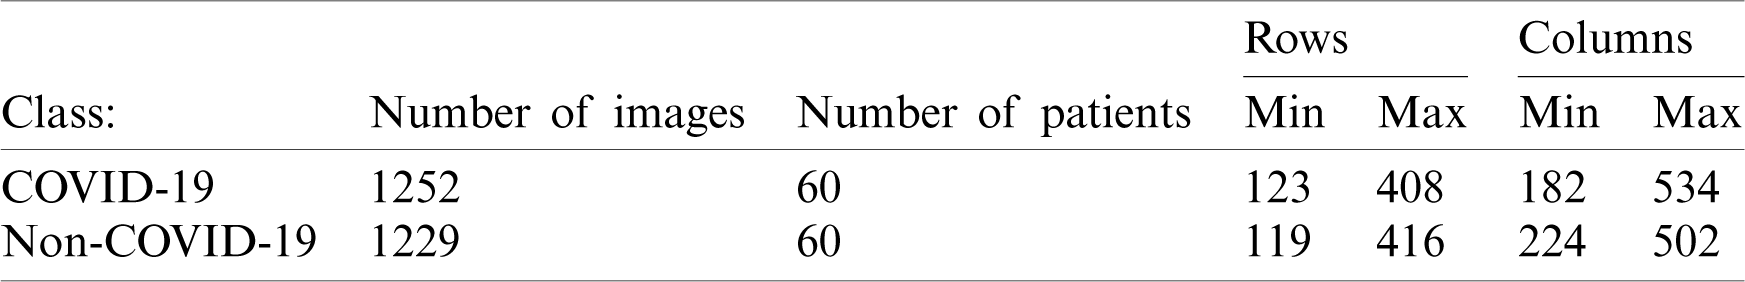
We used two datasets in our experiments COVID19-CT and the SARS-CoV-2-CT We used these two datasets because they were publicly available online [10,32,33]. The COVID19-CT dataset was collected by Zhao et al. [8]. They collected 349 images from 216 COVID-19 patients from scientific articles and hospitals. Then, they collected another set of 463 images from healthy individuals and non-COVID-19 patients. The latter set included an additional 55 patients that were not included in the original 216 patients. Thus, the total number of images in this dataset is 812. The SARS-CoV-2-CT was collected from hospitals in São Paulo, Brazil and is much larger. It consists of 2482 CT chest images, 1252 images of 60 patients with COVID-19 and 1230 images of 60 patients with non-COVID-19 pulmonary diseases. The size of this dataset makes it suitable for executing machine learning algorithms on available computing resources. The images in the SARS-CoV-2-CT dataset are printed images and do not have a standard size. Additionally, image contrast has not been standardized. Tab. 1 shows the minimum and maximum width and height of the images in the SARS-CoV-2-CT dataset.
Table 1: SARS-CoV-2-CT dataset meta information
Input images for CNN models must be the same size. Thus, resizing the images is an important preprocessing step. Early CNN models only accepted images of size  pixels. In this work, we decided to use a fixed size of
  pixels, which is a middle ground between the minimum and maximum number of rows and columns, as shown in Tab. 1.
However, we still needed to deal with the problem of variable image sizes. One option is to separately resize every image to the fixed target size. However, this option will distort the images significantly and affect their aspect ratio, which will have a negative effect on classification model performance. A second option is to use the maximum number of rows and columns, i.e., 534 (Tab. 1), as a reference. With this option, all images are downsized by a factor of 534/256 = 2.1, and images that end up smaller than  are padded with zeros. This option, albeit better than the first option, still will result in the resolution of smaller images to be significantly degraded. Additionally, large portions of these images will be zero, which will not be of any benefit to the classification model. Therefore, we decided to use a third option in which only the width of the image is used as a reference. For example, given sample image i, let its size be
  . Then, this image should be resized by a factor of
  . That will change the height to
  , which may be less or more than the target height of 256. If the new height is less than 256, then we simply pad the top and bottom equally with zeros, as shown in Fig. 2.
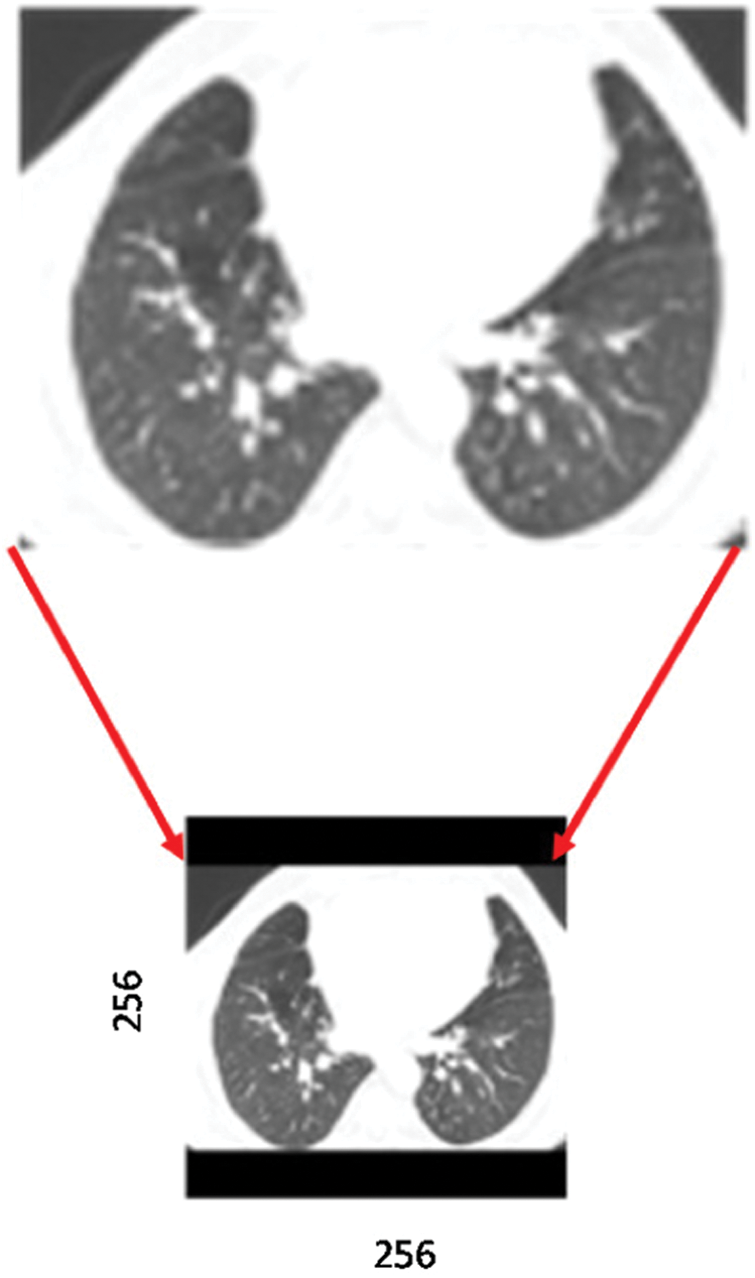
Figure 2: Preprocessing a sample CT scan image, including resizing and padding with zeros. Solid black bars indicate padding
If the new height is more than 256, we need to crop the top and bottom of the image. However, because most CT chest images are in landscape mode, this does not occur often. In fact, in the SARS-CoV-2-CT dataset, only ten images needed to be cropped (Fig. 3a). As can be seen, the amount to be cropped (outside the red box of size  pixels) is always insignificant. We observed the same situation with the COVID19-CT dataset. Out of the 812 images in the dataset, only two required minor cropping (Fig. 3b).
To evaluate performance, we compared our proposed approach with other approaches using the following performance metrics:


Here, TP denotes true positives (patients correctly identified as having COVID-19), TN denotes true negatives (patients correctly identified as not having COVID-19), FP denotes false positives (patients with lung diseases other than COVID-19 identified as having COVID-19), and FN denotes false negatives (patients with COVID-19 identified as not having the disease).
Our proposed approach was developed using Python and Google’s Tensorflow machine learning library. The models investigated were all trained in batches of size of 32 using the Adam optimizer. The default values for the Adam optimizer parameters were used, except for the learning parameter, which was varied over time. The training epochs were divided into two stages. In the first stage, the learning rate was set to 0.001 and then reduced to 0.0001. The number of epochs in stage one and two were determined experimentally using a validation set approach. As for the computational platform, we used an HP Omen Station with an Intel Core i9-7920x CPU@2.9 GHz with 16 GB RAM and a NVIDIA GeForce GTX 1080 Ti (11 GB GDDR5X) GPU.
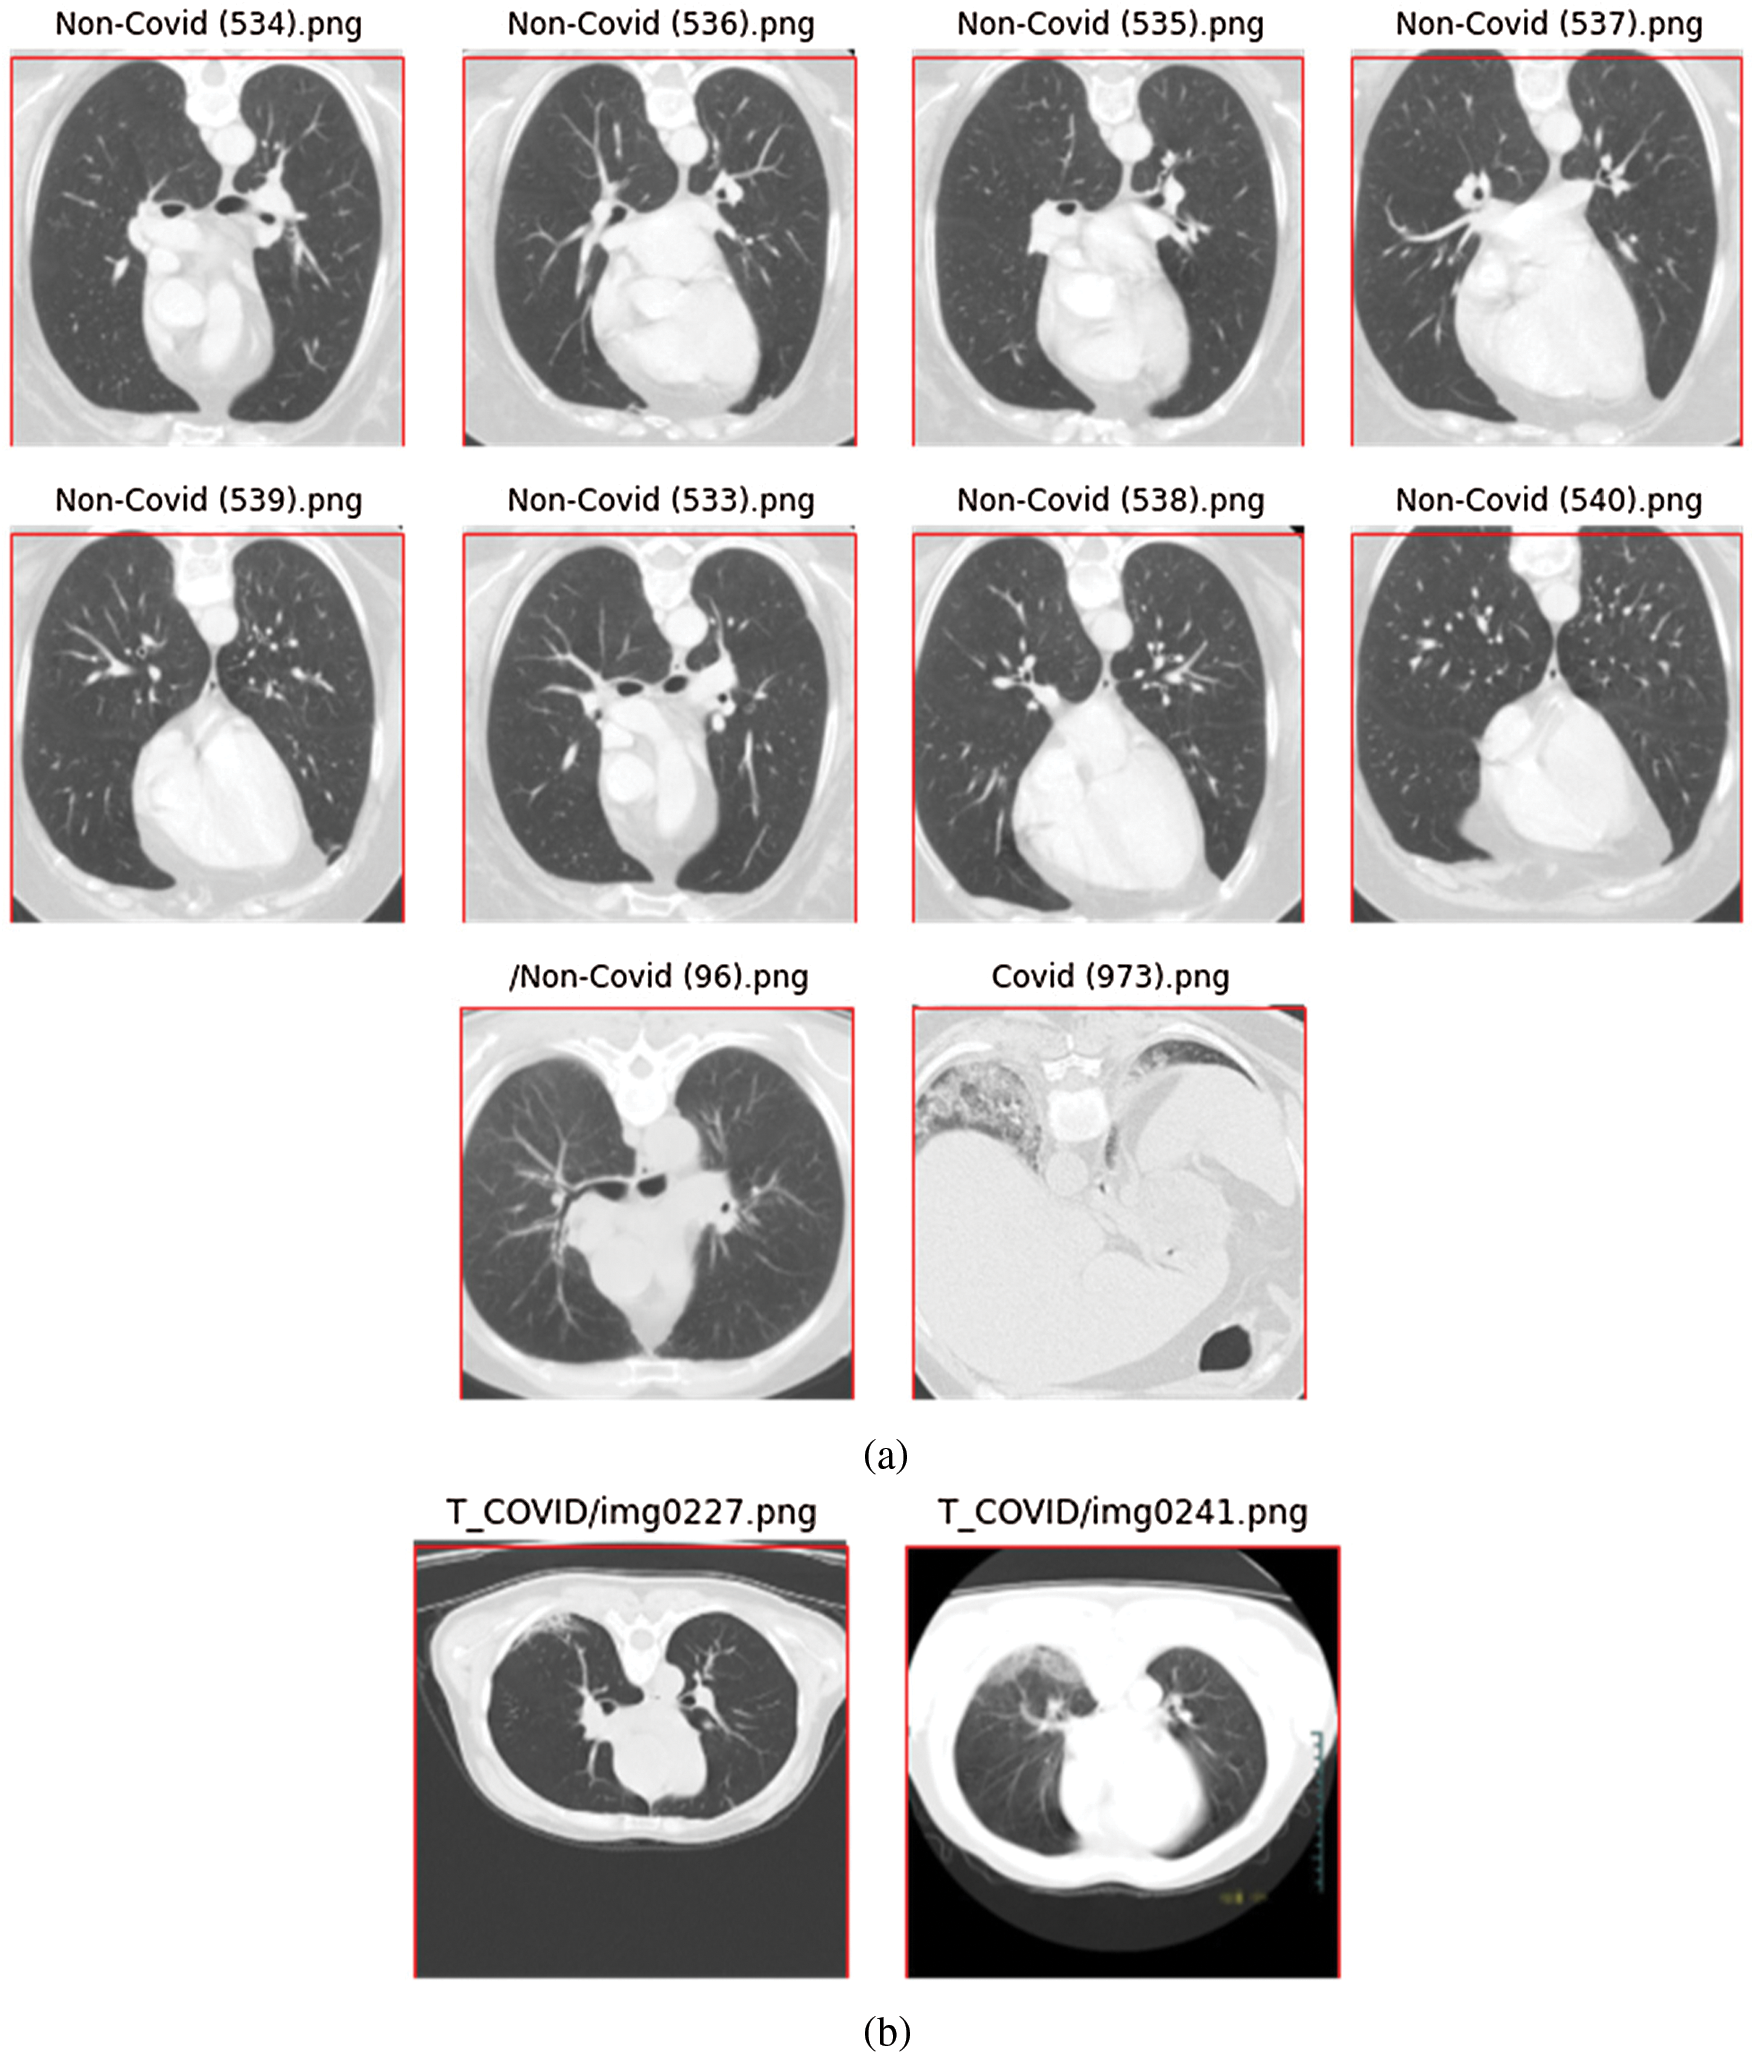
Figure 3: CT scan images that required minor cropping; (a) images from the SARS-CoV-2-CT dataset, (b) images from the COVID19-CT dataset
We tested the proposed models on the SARS-CoV-2-CT and COVID19-CT datasets. For the SARS-CoV-2-CT dataset we performed experiments using three different train-test split scenarios, i.e., 20%–80%, 50%–50%, and 80%–20%. We used cross-validation to train the model several times with different training sets and computed the average accuracy. With the COVID19-CT dataset, we followed the data split used in the paper that proposed the dataset [8]. Note that this data split is also used by most studies in the literature [11–15,18].
3.5 Determining the Number of Epochs
In this section we describe different experiments using the SARS-CoV-2-CT dataset with a 20%–80% train-test split. We selected that split to ensure that execution times were not prohibitive. The findings and conclusions should still be valid to a high degree for the other scenarios with different training splits, and the good results achieved in Section 3.7 attest to that.
In the first experiment, we trained both the EfficientNet-B3-GAP and EfficientNet-B3-GAP + FC(128) models for 45 epochs using 25% of the training set (5% of the total data) as a validation set, a batch size of 32, and a learning rate of 0.001. We executed the training ten times and monitored the loss and accuracy measures over the validation set. The average validation loss curves and validation accuracy curves over the ten runs are plotted in Fig. 4. As can be seen, the loss increases after 20 epochs (a sign of the overfitting problem). Furthermore, validation accuracy does not improve after 20 epochs. Thus, we fixed the number of epochs for this stage at 20.
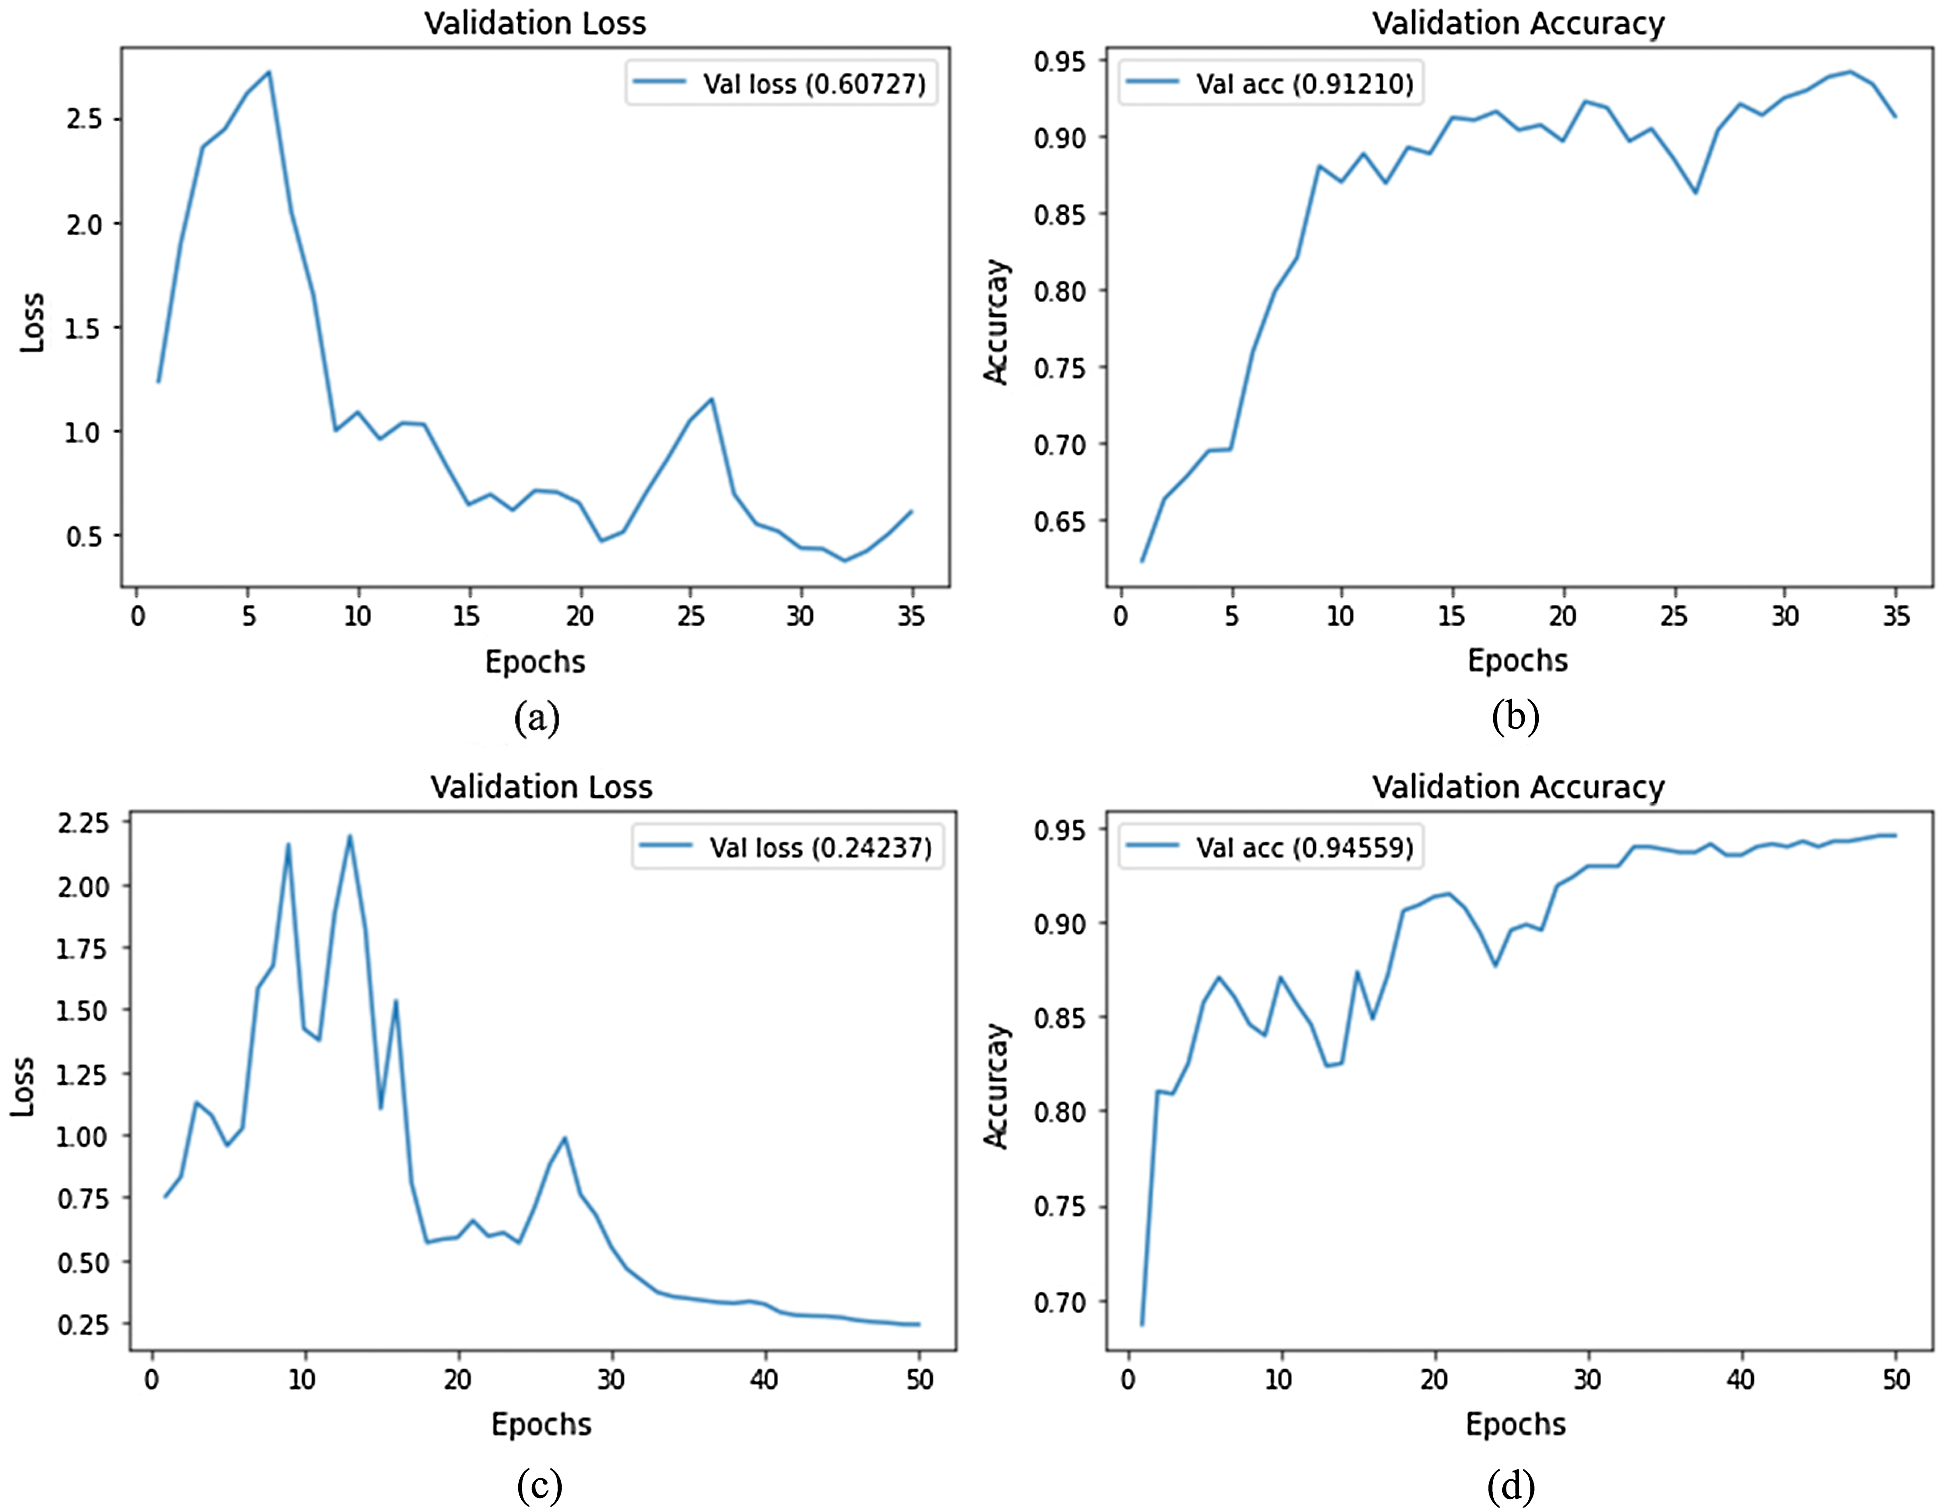
Figure 4: Average validation loss and accuracy curves using the SARS-CoV-2-CT dataset; (a) EfficientNet-B3-GAP average loss, (b) EfficientNet-B3-GAP average accuracy, (c) EfficientNet-B3-GAP-FC(128) average loss, and (d) EfficientNet-B3-GAP-FC(128) average accuracy
A current standard training approach is to continue training for a second stage with a lower learning rate to fine tune the optimization. We implemented this strategy at a learning rate of 0.0001. The average validation loss and validation accuracy curves for both stages are shown in Fig. 5. As can be seen, the validation accuracy improves slightly in this second stage of training, but again reaches a plateau after  20 epochs. Thus, this will also be the number of epochs for the second stage.
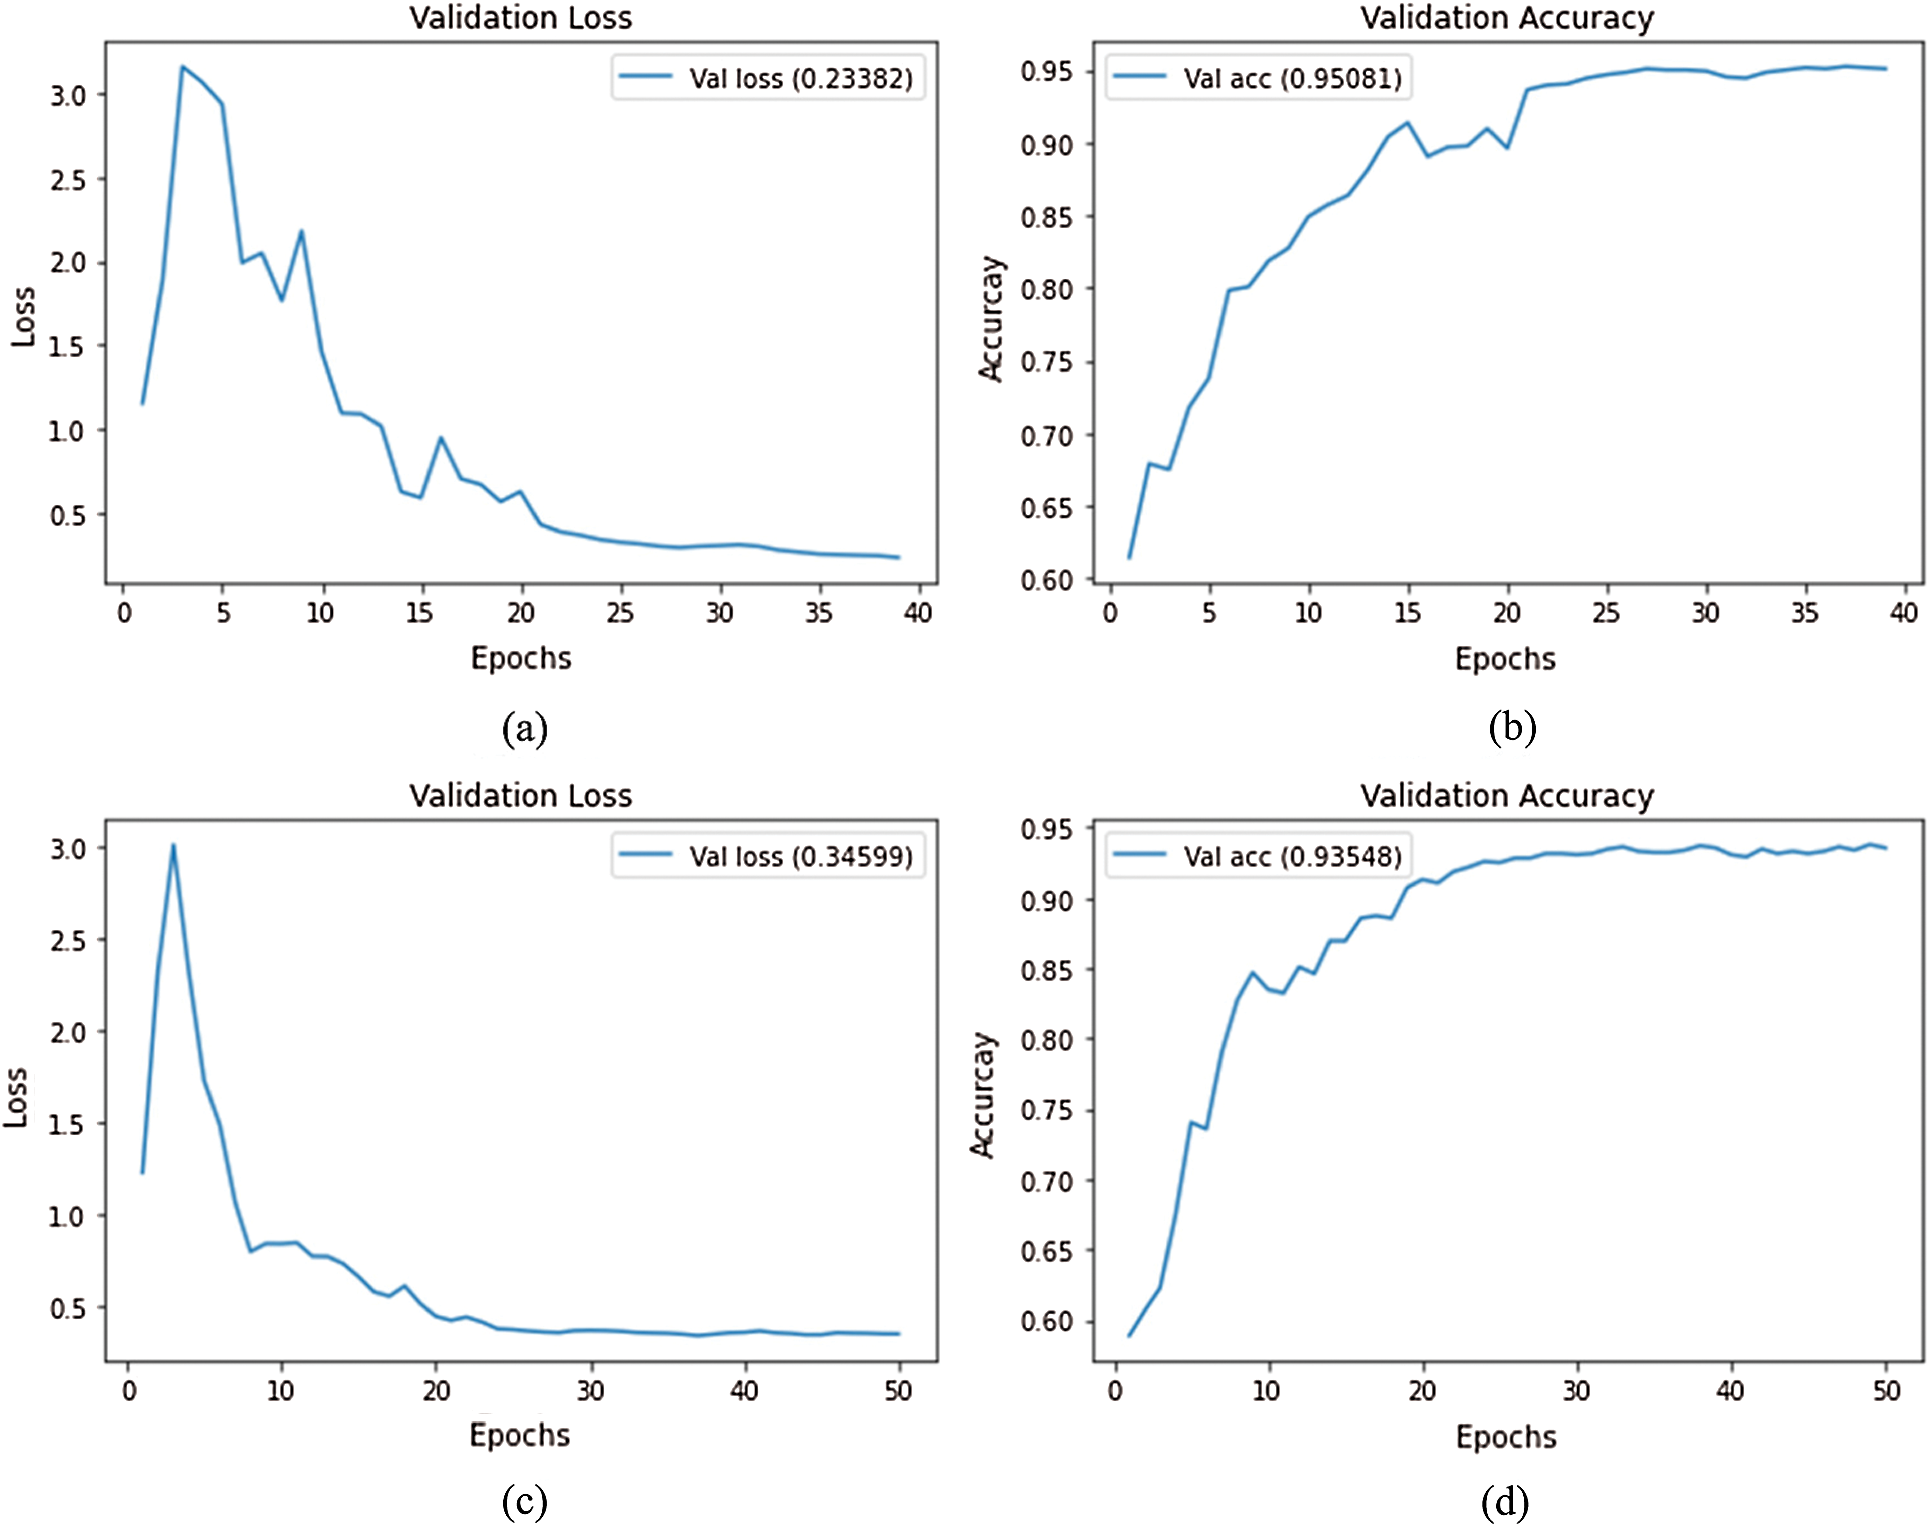
Figure 5: Loss and accuracy curves (average of ten runs) with decreasing learning rate at epoch 20; (a) EfficientNet-B3-GAP average loss, (b) EfficientNet-B3-GAP average accuracy, (c) EfficientNet-B3-GAP-FC(128) average loss, and (d) EfficientNet-B3-GAP-FC(128) average accuracy
Comparing the two versions, the average accuracy for EfficientNet-B3-GAP and EfficientNet-B3-GAP-FC(128) CNN models are 95.08% and 93.55%, respectively. We focus on the EfficientNet-B3-GAP model in the remainder of the experiments because it outperformed the EfficientNet-B3-GAP-FC(128) model.
The disparity in performance can be explained by the fact that the second model has an extra layer that starts with random weights rather than pre-trained weights, as in the other layers. These random weights add extra degrees of freedom to the model and should improve its generalization ability; however, the limited amount of training data in our case, makes it difficult to properly optimize these extra weights. This is a well-known problem with DL models, and because of that, it is preferred to perform tranfer learning from models with pre-trained weights.
3.6 Results of the EfficientNet-B3-GAP-Ensemble Method
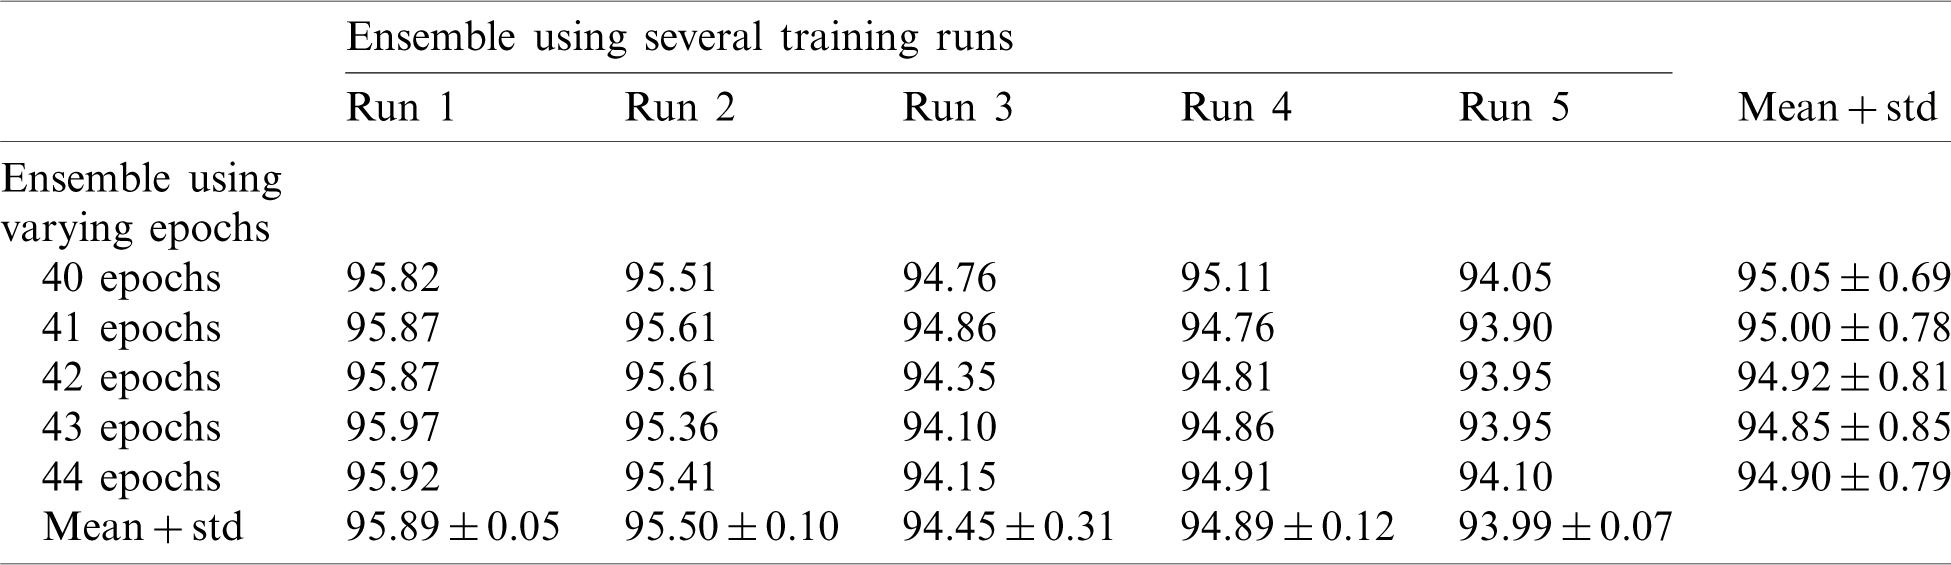
In this section, we report the results using the proposed method. Tab. 2 shows the accuracy of an ensemble of EfficientNet-B3-GAP models. As mentioned previously, we built model ensembles in two ways, i.e., (i) multiple runs (five) to train the same model with the same parameters (Runs 1–5, Tab. 2) and (ii) varying the number of training epochs of training (40, 41, 42, 43, and 44 epochs, column 2, Tab. 2). We note here that “std” stands for standard deviation. Two observations can be made; (i) The accuracy varies from run to run, and (ii) the variability between multiple-runs ensemble is higher than the multiple-epochs ensemble.
Table 2: Average accuracy for EfficientNet-B3-GAP models using the SARS-CoV-2-CT dataset with 20%–80% random split
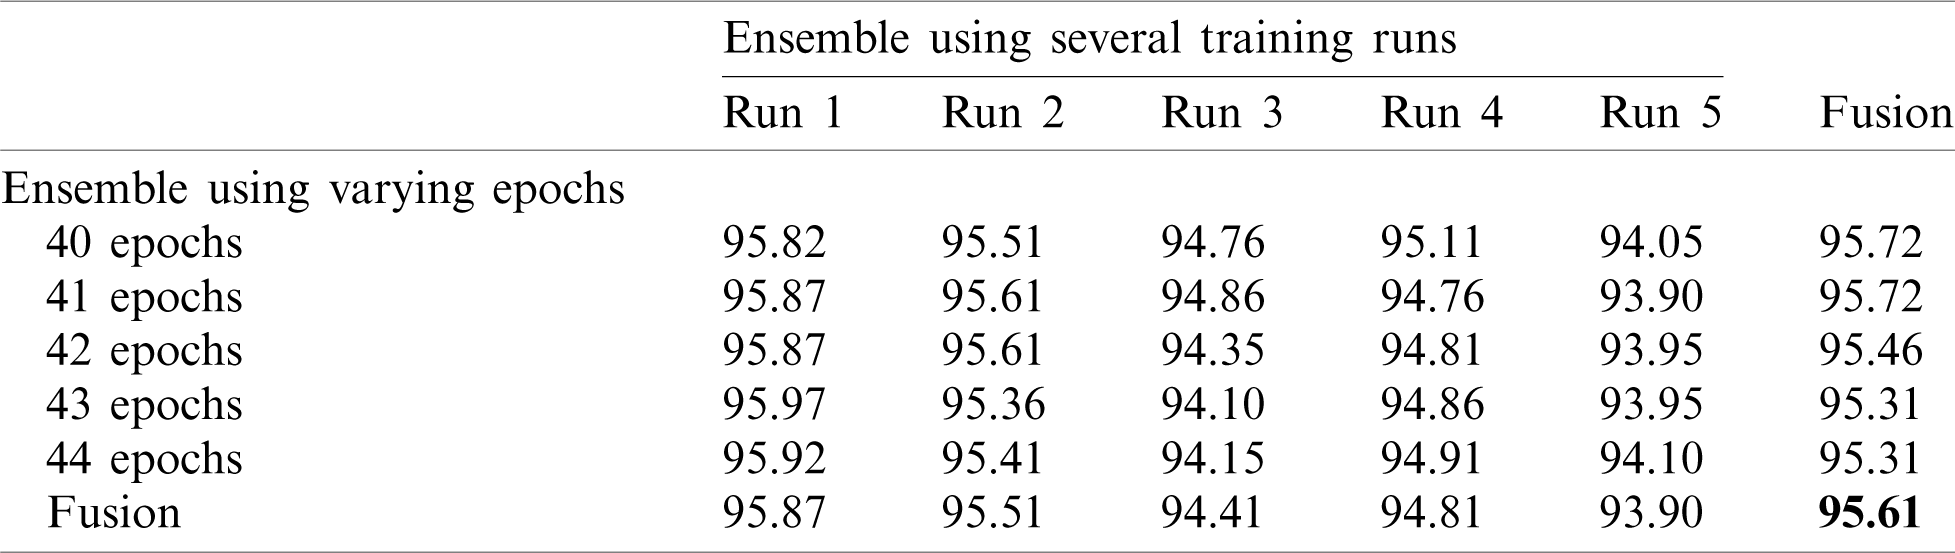
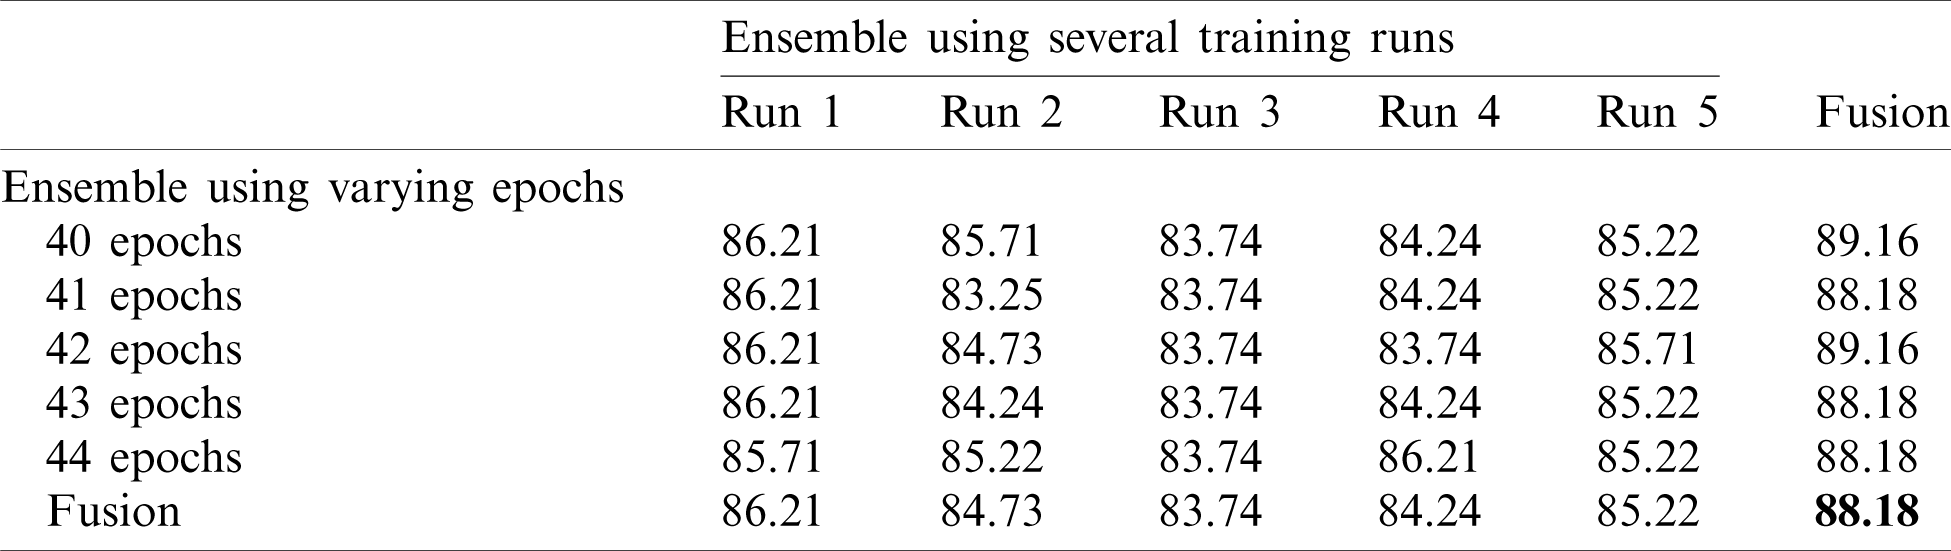
Next, we applied fusion to the two types of ensembles using the naïve average described in Eq. (3). The results of the two ensemble approaches are shown in Tab. 3 where it is evident that multiple-run ensembles outperform multiple-epoch ensembles. Furthermore, the accuracies for the fused multiple-run ensembles are always better than the mean accuracies shown in Tab. 2. It is also possible to fuse the output probabilities of all ensemble models generated by both multiple-runs and multiple epochs (25 models). When we apply this total fusion, we obtain an accuracy of 95.61%.
Table 3: Accuracy for EfficientNet-B3-GAP-ensemble method using the SARS-CoV-2-CT dataset with 20%–80% random split
Note that 50%–50% and 80%–20% splits (Tabs. 4 and 5) return similar results. The final accuracy of the fused model is 99.27% and 99.72% for the 50%–50% and 80%–20% splits, respectively.
Table 4: Accuracy for EfficientNet-B3-GAP-ensemble method using the SARS-CoV-2-CT dataset with 50%–50% random split
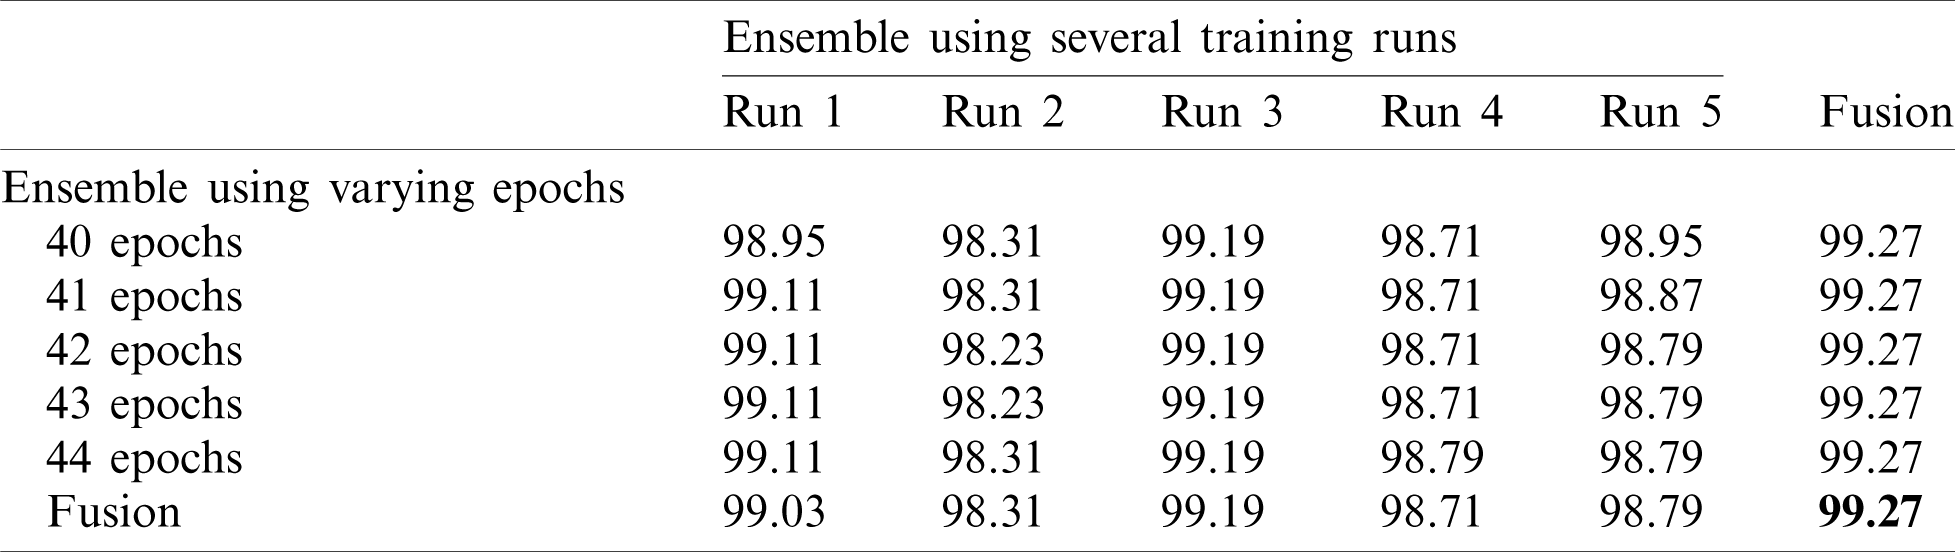
Table 5: Accuracy for EfficientNet-B3-GAP-ensemble method using the SARS-CoV-2-CT dataset with 80%–20% random split

Finally, we applied the proposed method to the COVID19-CT dataset. The results are given in Tabs. 6 and 7.
Table 6: Average accuracy for multiple EfficientNet-B3-GAP models using the COVID19-CT dataset
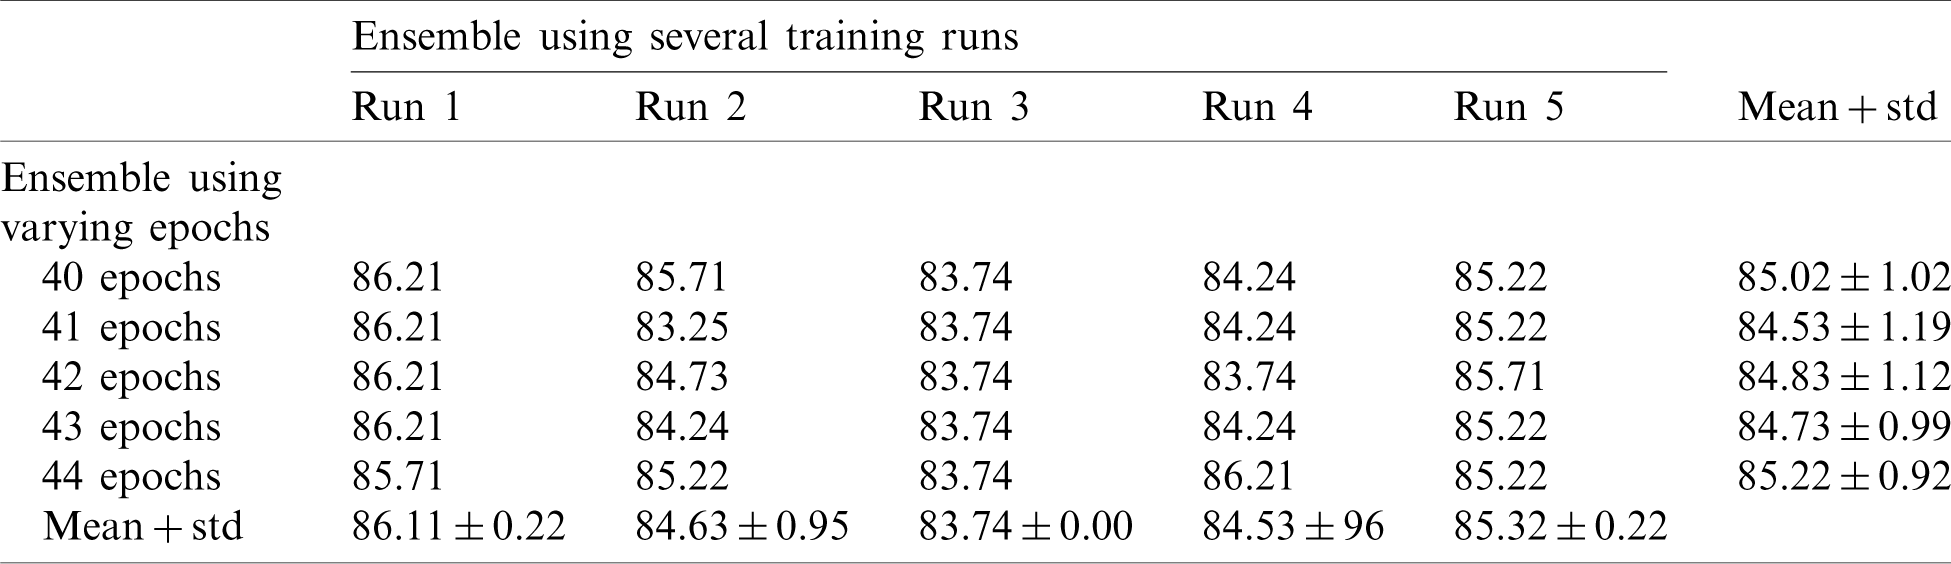
Table 7: Accuracy for EfficientNet-B3-GAP-ensemble method using COVID19-CT dataset
Tab. 6 shows the mean and standard deviation of the multiple-run models and the multiple-epoch models. The same observation that we saw for the SARS-CoV-2-CT dataset applies here. When we applied the fusion strategy on the models, we obtained the impressive results shown in Tab. 7. The accuracy of the fused results improved by up to 5% compared to the individual models. The final accuracy achieved using the EfficientNet-B3-GAP-Ensemble is 88.18% for COVID19-CT dataset.
3.7 Comparison to State-of-the-Art Methods
In this section, we report the results achieved by the proposed EfficientNet-B3-GAP-Ensemble and compare it to state-of-the-art methods as referenced in Tabs. 8 and 9. The first 20 training epochs used a learning rate of 0.001; then, the learning rate is reduced to 0.0001 for the second 20 epochs. We applied the algorithm to the SARS-CoV-2-CT dataset with an 80%–20% train-test split. However, to for the COVID19-CT dataset, we followed the protocol described in [8]. In Tab. 8, the results obtained for the SARS-CoV-2-CT dataset are compared to other methods, while Tab. 9 shows the comparison for the COVID19-CT dataset.
Table 8: Comparison of EfficientNet-B3-GAP-ensemble with other recent methods using SARS-CoV-2-CT and 80%–20% split
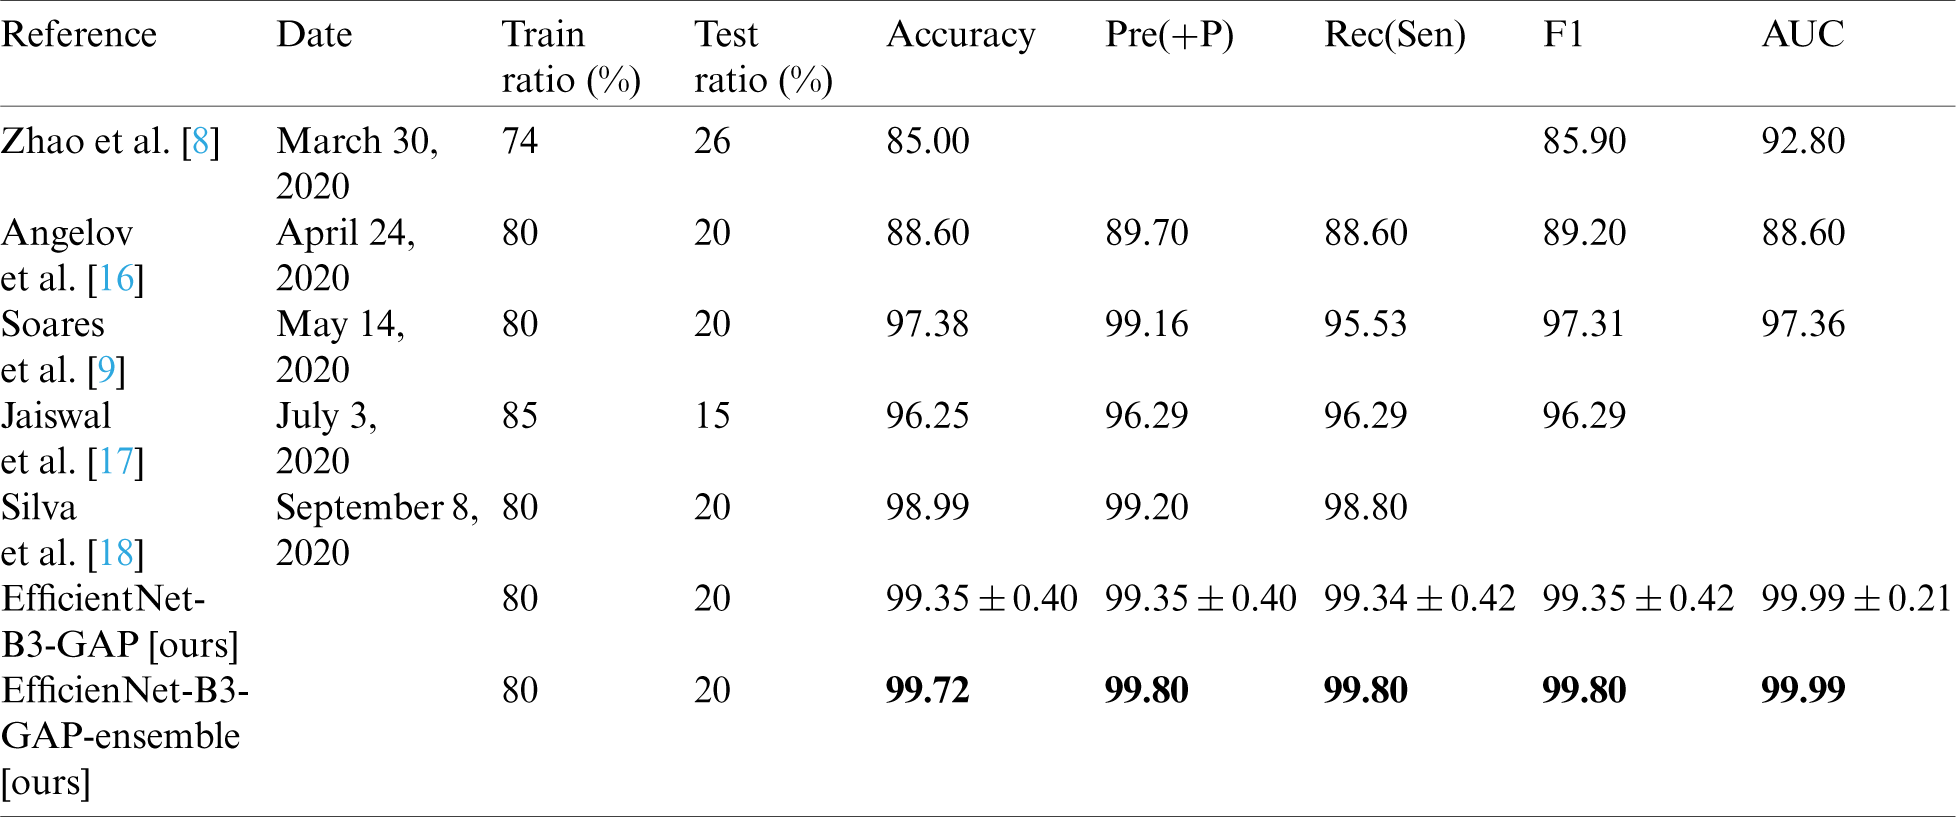
Table 9: Comparison of the proposed method with state-of-the-art methods using COVID19-CT dataset
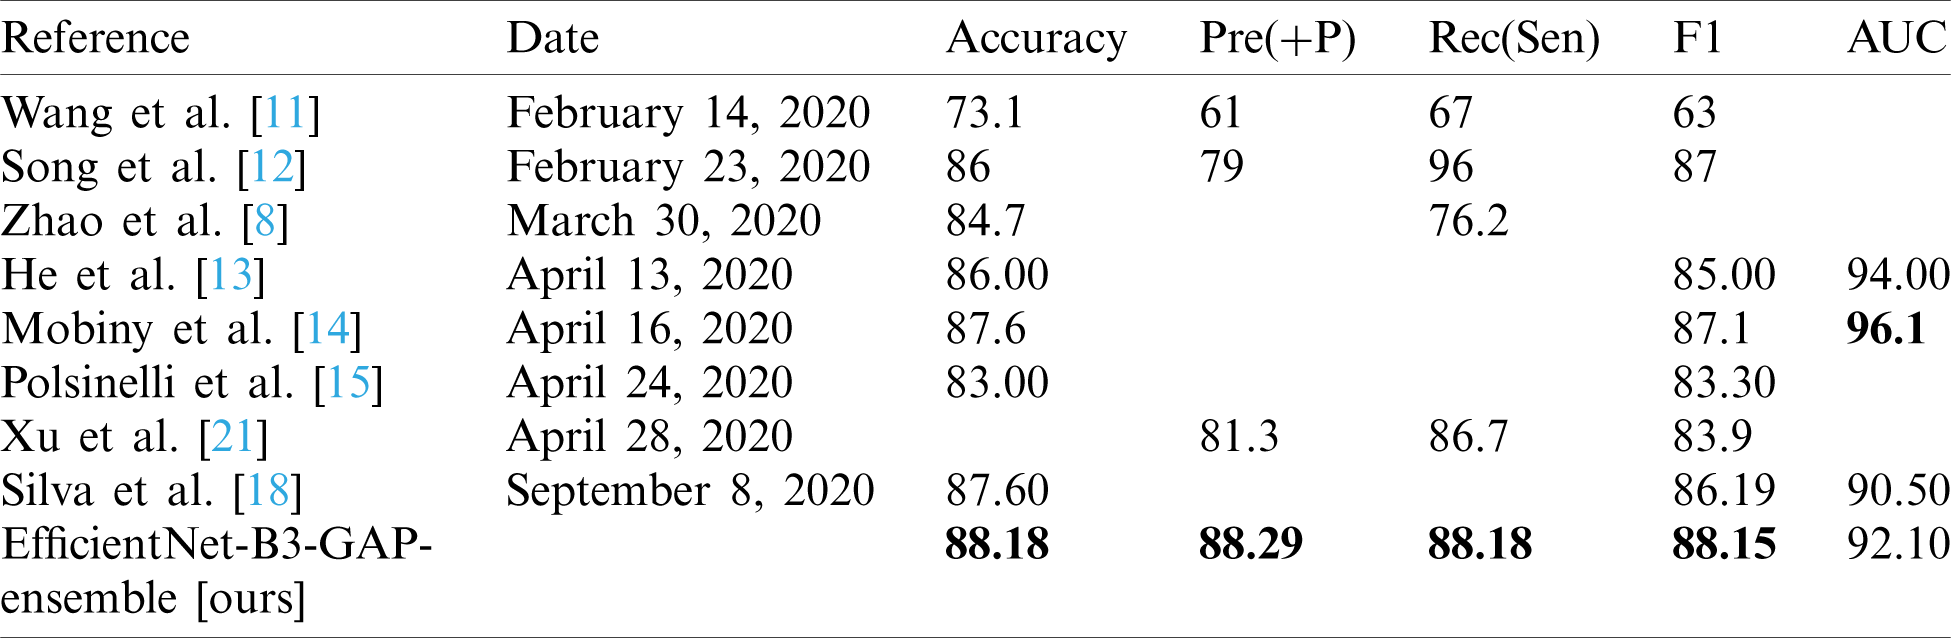
As can be seen, the proposed method achieves impressive results that are better than state-of-the-art methods in terms of accuracy. The proposed method is also more efficient because we use smaller CT images (i.e.,  pixels). Furthermore, the proposed modified EfficientNet-GAP model is light-weight compared to other models, like VGG16 or DenseNet. Additionally, as mentioned previously, we trained our models for only 40 epochs, whereas, with other methods, the models are trained for more epochs. For example, the method proposed by Jaiswal et al. [17] uses 300 epochs. COVID19-CT is a more challenging dataset because the test set is intentionally selected from patients that differ from those in the training set. However, our proposed method still outperformed the state-of-the-art methods in terms of accuracy, precision, sensitivity, and F1-score. The only exception is regarding the AUC metric where methods proposed by He et al. [13] and Mobiny et al. [14] outperformed ours. However, our method outperformed them in terms of F1-score. It may also beat them in terms of other metrics, such as accuracy; however, values for other metrics were not provided.
In this paper, we have proposed an effective DL method to classify CT chest images to detect COVID-19 cases. The proposed method is based on EfficientNet-B3, a new light-weight pre-trained model. We developed a modified version of this model called EfficientNet-B3-GAP and then used ensemble techniques to build a solution that yielded impressive results on two publicly available benchmark datasets; COVID19-CT and SARS-CoV-2-CT. However, the results for the COVID19-CT dataset show that more work is required to build a more general solution. To achieve this, a domain adaption approach must be utilized to eliminate the data shift between datasets. Other techniques that can be investigated include using higher-resolution CT chest images. EfficientNets have low computational cost in terms of latency and memory; therefore, it is possible to exploit higher-resolution input images.
Acknowledgement: The authors extend their appreciation to the Deanship of Scientific Research at King Saud University for funding this work through research group No. (RG-1435-055).
Funding Statement: The authors extend their appreciation to the Deanship of Scientific Research at King Saud University for funding this work through research group No. (RG-1435-055).
Conflicts of Interest: The authors declare that they have no conflicts of interest to report regarding the present study.
1. World Health Organization. (2020). “Weekly operational update on COVID-19 September 27, 2020,” World Health Organization (WHO), vol. 1, pp. 1–10. [Google Scholar]
2. M. S. Pulia, T. P. O’Brien, P. C. Hou, A. Schuman and R. Sambursky. (2020). “Multi-tiered screening and diagnosis strategy for COVID-19: A model for sustainable testing capacity in response to pandemic,” Annals of Medicine, vol. 52, no. 5, pp. 207–214. [Google Scholar]
3. T. Ai, Z. Yang, H. Hou, C. Zhan, C. Chen et al. (2020). , “Correlation of chest CT and RT-PCR testing for coronavirus disease 2019 (COVID-19) in China: A report of 1014 cases,” Radiology, vol. 296, no. 2, pp. 32–40. [Google Scholar]
4. B. Xu, Y. Xing, J. Peng, Z. Zheng, W. Tang et al. (2020). , “Chest CT for detecting COVID-19: A systematic review and meta-analysis of diagnostic accuracy,” European Radiology, vol. 30, no. 866, pp. 5720–5727. [Google Scholar]
5. S. Bd, K. Osei-Poku and E. Brakohiapa. (2020). “Diagnosing COVID-19 from chest X-ray in resource limited environment-case report,” iMedPub Journal, vol. 6, no. 1, pp. 1–3. [Google Scholar]
6. M. Z. Alom, T. M. Taha, C. Yakopcic, S. Westberg, P. Sidike et al. (2019). , “A state-of-the-art survey on deep learning theory and architectures,” Electronics (Switzerland), vol. 8, no. 3, pp. 1–67. [Google Scholar]
7. D. Chen, S. Ji, F. Liu1, Z. Li and X. Zhou, “A review of automated diagnosis of COVID-19 based on scanning images,” arXiv., arXiv:2006.05245 [eess.IV], June 09, 2020. [Google Scholar]
8. J. Zhao, X. He, X. Yang, Y. Zhang, S. Zhang et al., “COVID-CT-dataset: A CT scan dataset about COVID-19,” arXiv., arXiv: 2003.13865 [eess.IV], March 30, 2020. [Google Scholar]
9. E. Soares, P. Angelov, S. Biaso, M. H. Froes and D. K. Abe. (2020). “SARS-CoV-2 CT-scan dataset: A large dataset of real patients CT scans for SARS-CoV-2 identification,” medRxiv, no. 2020.04.24.20078584, . https://doi.org/10.1101/2020.04.24.20078584. [Google Scholar]
10. E. Soares, P. Angelov, S. Biaso, M. H. Froes and D. K. Abe. (2020). “SARS-COV-2 Ct-Scan dataset|Kaggle,” . [Online]. Available: https://www.kaggle.com/plameneduardo/sarscov2-ctscan-dataset. [Google Scholar]
11. S. Wang, B. Kang, J. Ma, X. Zeng, M. Xiao et al. (2020). , “A deep learning algorithm using CT images to screen for Corona Virus Disease (COVID-19),” medRxiv, no. 2020.02.14.20023028, . https://doi.org/10.1101/2020.02.14.20023028. [Google Scholar]
12. S. Ying, S. Zheng, L. Li, X. Zhang, X. Zhang et al. (2020). , “Deep learning enables accurate diagnosis of novel coronavirus (COVID-19) with CT images,” medRxiv, no. 2020.02.23.20026930, February 25, . https://doi.org/10.1101/2020.02.23.20026930. [Google Scholar]
13. X. He, X. Yang, S. Zhang, J. Zhao, Y. Zhang et al. (2020). , “Sample-efficient deep learning for COVID-19 diagnosis based on CT scans,” medRxiv, no. 2020.04.13.20063941, . https://doi.org/10.1101/2020.04.13.20063941. [Google Scholar]
14. A. Mobiny, P. A. Cicalese, S. Zare, P. Yuan, M. Abavisani et al. (2020). , “Radiologist-Level COVID-19 detection using CT scans with detail-oriented capsule networks,” arXiv., arXiv:2004.07407 [eess.IV], April 16. [Google Scholar]
15. M. Polsinelli, L. Cinque and G. Placidi. (2020). “A light CNN for detecting COVID-19 from CT scans of the chest,” Pattern Recognition Letters, vol. 140, no. 6, pp. 95–100. [Google Scholar]
16. P. Angelov and E. Soares. (2020). “Explainable-by-design approach for COVID-19 classification via CT-scan,” medRxiv, no. 2020.04.24.20078584, . https://doi.org/10.1101/2020.04.24.20078584. [Google Scholar]
17. A. Jaiswal, N. Gianchandani, D. Singh, V. Kumar and M. Kaur. (2020). “Classification of the COVID-19 infected patients using DenseNet201 based deep transfer learning,” Journal of Biomolecular Structure and Dynamics, vol. 8, no. 1, pp. 1–8. [Google Scholar]
18. P. Silva, E. Luz, G. Silva, G. Moreira, R. Silva et al. (2020). , “COVID-19 detection in CT images with deep learning: A voting-based scheme and cross-datasets analysis,” Informatics in Medicine Unlocked, vol. 20, no. 1, pp. 100427. [Google Scholar]
19. S. Hu, Y. Gao, Z. Niu, Y. Jiang, L. Li et al. (2020). , “Weakly supervised deep learning for COVID-19 infection detection and classification from CT images,” IEEE Access, vol. 8, no. April, pp. 118869–118883. [Google Scholar]
20. S. A. Harmon, T. H. Sanford, S. Xu, E. B. Turkbey, H. Roth et al. (2020). , “Artificial intelligence for the detection of COVID-19 pneumonia on chest CT using multinational datasets,” Nature Communications, vol. 11, no. 1, pp. 1–7. [Google Scholar]
21. X. Xu, X. Jiang, C. Ma, P. Du, X. Li et al. (2020). , “A deep learning system to screen novel coronavirus disease 2019 pneumonia,” Engineering, vol. 6, no. 10, pp. 1122–1129. [Google Scholar]
22. M. Tan and Q. V. Le. (2019). “EfficientNet: Rethinking model scaling for convolutional neural networks,” in Proc. of the 36th Int. Conf. on Machine Learning (ICML 2019), Long Beach, CA, USA, vol. 97, pp. 6105–6114. [Google Scholar]
23. O. Russakovsky, J. Deng, H. Su, J. Krause, S. Satheesh et al. (2015). , “ImageNet large scale visual recognition challenge,” International Journal of Computer Vision, vol. 115, no. 3, pp. 211–252. [Google Scholar]
24. C. Szegedy, W. Liu, Y. Jia, P. Sermanet, S. Reed et al. (2015). , “Going deeper with convolutions,” in 2015 IEEE Conf. on Computer Vision and Pattern Recognition, Boston, MA, USA, pp. 1–9, . https://doi.org/10.1109/CVPR.2015.7298594. [Google Scholar]
25. F. Renard, S. Guedria, N. De Palma and N. Vuillerme. (2020). “Variability and reproducibility in deep learning for medical image segmentation,” Scientific Reports, vol. 10, no. 13724, pp. 1–16. [Google Scholar]
26. L. Breiman. (1996). “Stacked regressions,” Machine Learning, vol. 24, no. 1, pp. 49–64. [Google Scholar]
27. D. H. Wolpert. (1992). “Stacked generalization,” Neural Networks, vol. 5, no. 2, pp. 241–259. [Google Scholar]
28. A. I. Naimi and L. B. Balzer. (2018). “Stacked generalization: An introduction to super learning,” European Journal of Epidemiology, vol. 33, no. 5, pp. 459–464. [Google Scholar]
29. P. Yang, Y. H. Yang, B. B. Zhou and A. Y. Zomaya. (2010). “A review of ensemble methods in bioinformatics,” Current Bioinformatics, vol. 5, no. 4, pp. 296–308. [Google Scholar]
30. S. Sabra, K. M. Malik, M. Afzal, V. Sabeeh and A. Charaf Eddine. (2020). “A hybrid knowledge and ensemble classification approach for prediction of venous thromboembolism,” Expert Systems, vol. 37, no. 1, pp. 1. [Google Scholar]
31. T. A. Putra, S. I. Rufaida and J. S. Leu. (2020). “Enhanced skin condition prediction through machine learning using dynamic training and testing tugmentation,” IEEE Access, vol. 8, pp. 40536–40546. [Google Scholar]
32. J. Zhao, X. He, X. Yang, Y. Zhang, S. Zhang et al. (2020). , “COVID-CT-Dataset: A CT scan dataset about COVID-19,” . [Online]. Available: https://github.com/UCSD-AI4H/COVID-CT. [Google Scholar]
33. H. Alhichri. (2020). “COVID-19 CT image datasets,” Advanced Lab for Intelligent Systems Research,” . [Online]. Available: http://alhichri.36bit.com/research.html. [Google Scholar]
 | This work is licensed under a Creative Commons Attribution 4.0 International License, which permits unrestricted use, distribution, and reproduction in any medium, provided the original work is properly cited. |