DOI:10.32604/cmc.2021.015291
| Computers, Materials & Continua DOI:10.32604/cmc.2021.015291 | |
| Article |
A New Optimized Wrapper Gene Selection Method for Breast Cancer Prediction
Department of Information Technology, College of Computer and Information Sciences, King Saud University, Riyadh, 11543, Saudi Arabia
*Corresponding Author: Heyam H. Al-Baity. Email: halbaity@ksu.edu.sa
Received: 14 November 2020; Accepted: 02 January 2021
Abstract: Machine-learning algorithms have been widely used in breast cancer diagnosis to help pathologists and physicians in the decision-making process. However, the high dimensionality of genetic data makes the classification process a challenging task. In this paper, we propose a new optimized wrapper gene selection method that is based on a nature-inspired algorithm (simulated annealing (SA)), which will help select the most informative genes for breast cancer prediction. These optimal genes will then be used to train the classifier to improve its accuracy and efficiency. Three supervised machine-learning algorithms, namely, the support vector machine, the decision tree, and the random forest were used to create the classifier models that will help to predict breast cancer. Two different experiments were conducted using three datasets: Gene expression (GE), deoxyribonucleic acid (DNA) methylation, and a combination of the two. Six measures were used to evaluate the performance of the proposed algorithm, which include the following: Accuracy, precision, recall, specificity, area under the curve (AUC), and execution time. The effectiveness of the proposed classifiers was evaluated through comprehensive experiments. The results demonstrated that our approach outperformed the conventional classifiers as expected in terms of accuracy and execution time. High accuracy values of 99.77%, 99.45%, and 99.45% have been achieved by SA-SVM for GE, DNA methylation, and the combined datasets, respectively. The execution time of the proposed approach was significantly reduced, in comparison to that of the traditional classifiers and the best execution time has been reached by SA-SVM, which was 0.02, 0.03, and 0.02 on GE, DNA methylation, and the combined datasets respectively. In regard to precision and specificity, SA-RF obtained the best result of 100 on GE dataset. While SA-SVM attained the best recall result of 100 on GE dataset.
Keywords: Breast cancer; simulated annealing; feature selection; classification; gene expression; DNA methylation; DNA microarray
Breast cancer is the most common type of cancer diagnosed in women of all ages, and one in eight women has a lifetime risk of being diagnosed with breast cancer [1]. This disease occurs because of the uncontrolled growth of breast cells. It is one of the most deadly forms of cancer for women because, despite the prevalence of the disease, most female patients are only diagnosed in the final stages. As a result, they have limited treatment and recovery options. However, better recovery rates can be achieved with early and accurate detection [2].
Many factors can increase the risk of breast cancer, including age (over 55), family history, genetics, and race [1]. Several studies have developed various automated techniques for predicting breast cancer, some of which are based on medical images [3,4] and some depend on genetic data. Genetic data is one of the most valuable resources for machine-learning (ML) algorithms that aim to discover new and hidden data patterns to help predict breast cancer. However, the high dimensionality of genetic data makes the prediction process challenging. Feature selection (FS) algorithms can help reduce the dimensionality of such datasets, which increases the speed of the classification process, decreases cost, and improves the accuracy of the prediction models [5].
Feature (gene) selection algorithms aim to select the most significant genes to address prediction problems. Therefore, they are widely used with genetic analysis [6]. There are three common types of FS algorithm: Filter, wrapper, and embedded. Filter algorithms use the general characteristics of training data and then apply FS by filtering unnecessary features, independent from the classifier. Wrapper algorithms utilize the classifier to measure the quality of the features and then select the features with the highest accuracy. In this method, first the search for possible gene subsets will be conducted in the space of genes. Next, the classifier examines each found gene subset by calculating the accuracy of the classifier. If the subset’s accuracy is satisfied, then the subset will be used for training the classifier. Otherwise, the wrapper will look again for a new gene subset. This process will keep repeating until it reaches the optimal accuracy. The performance of this algorithm outperforms the filter algorithm due to the interaction with the classifier during the process. Embedded algorithms perform FS, which are built into the classifier [5].
In recent years, many studies on breast cancer prediction utilized FS algorithms. Some of these studies addressed breast cancer prediction based on FS with nature-inspired computing (NIC) optimization algorithms, such as particle swarm optimization (PSO) and genetic algorithms (GA). PSO has been used widely in studies. Sheikhpour et al. [2] proposed a new model, PSO-KDE, which combines a kernel density estimation (KDE)-based classifier and a PSO to classify breast tumors into two types: Cancerous and non-cancerous. The PSO-KDE model was evaluated by using different measures: Specificity, accuracy, and sensitivity. The best accuracy obtained by the PSO-KDE was 98.53%. Similarly, Sakri et al. [7] compared the accuracy of a PSO FS with three different classifiers: Naive Bayes, reduced error pruning tree, and k-nearest neighbors (KNN). Naive Bayes provided the best accuracy (81.3%). Another study by Sahu et al. [8] approached the high dimensionality of microarray data by employing a new algorithm that uses FS. The new approach was based on two techniques: Filtering by using a signal-to-noise ratio (SNR) score and optimization by using a PSO algorithm. The original number of genes was 24,481 for breast cancer, and it was decreased to 20 genes after applying the new algorithm. The result showed the superiority of the support vector machine (SVM) classifier over the other classifiers. A study by Jain et al. [9] addressed the high dimensionality of microarray data by employing a hybrid algorithm. The new approach was a combination of correlation-based FS (CFS) and improved-binary PSO. The best accuracy result was 94%.
A cuckoo optimization algorithm (COA) was employed by Addeh et al. [10] who proposed COA-AR-ANFIS, which is a new hybrid method combining COA, association rules (AR), and an adaptive neuro-fuzzy inference system (ANFIS). To formulate a method to diagnose breast cancer, they used ANFIS for classification, AR for FS, and COA for discovering the optimal value of radius in the ANFIS, thus enhancing the accuracy of the classifier. The accuracy of the newly proposed method was 99.26%.
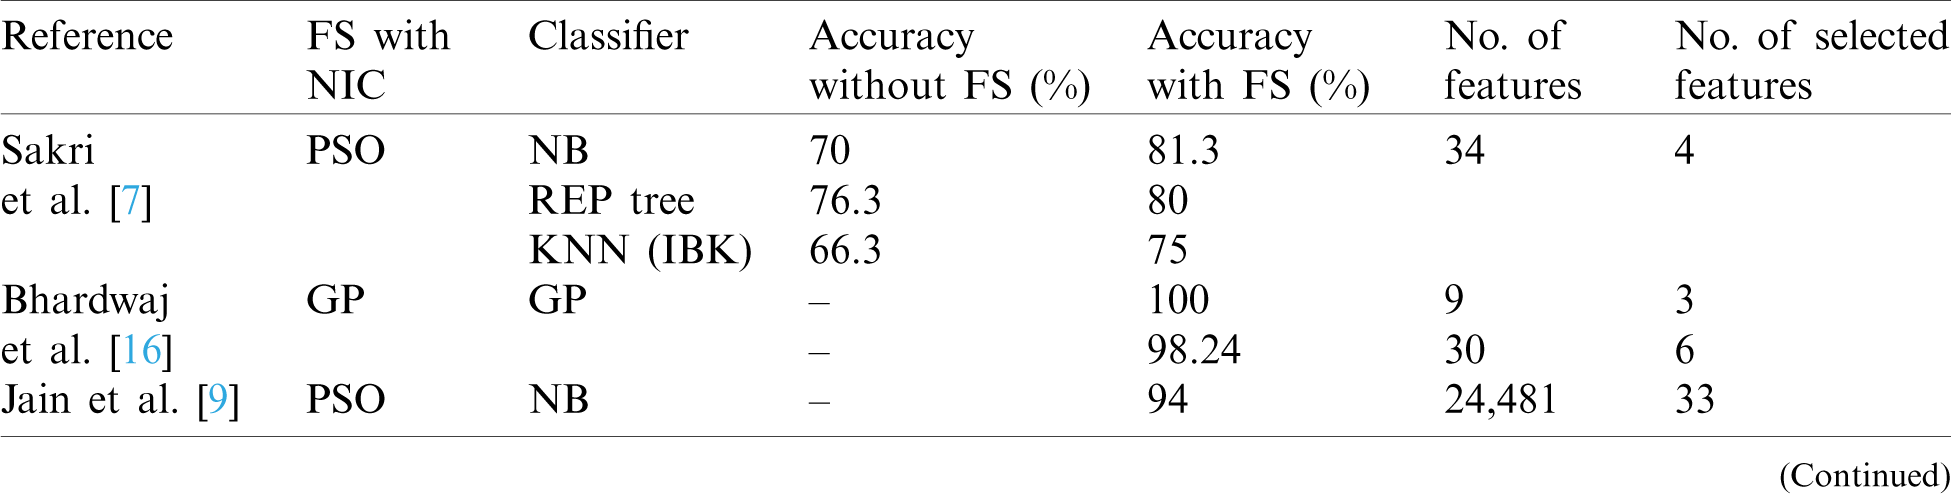
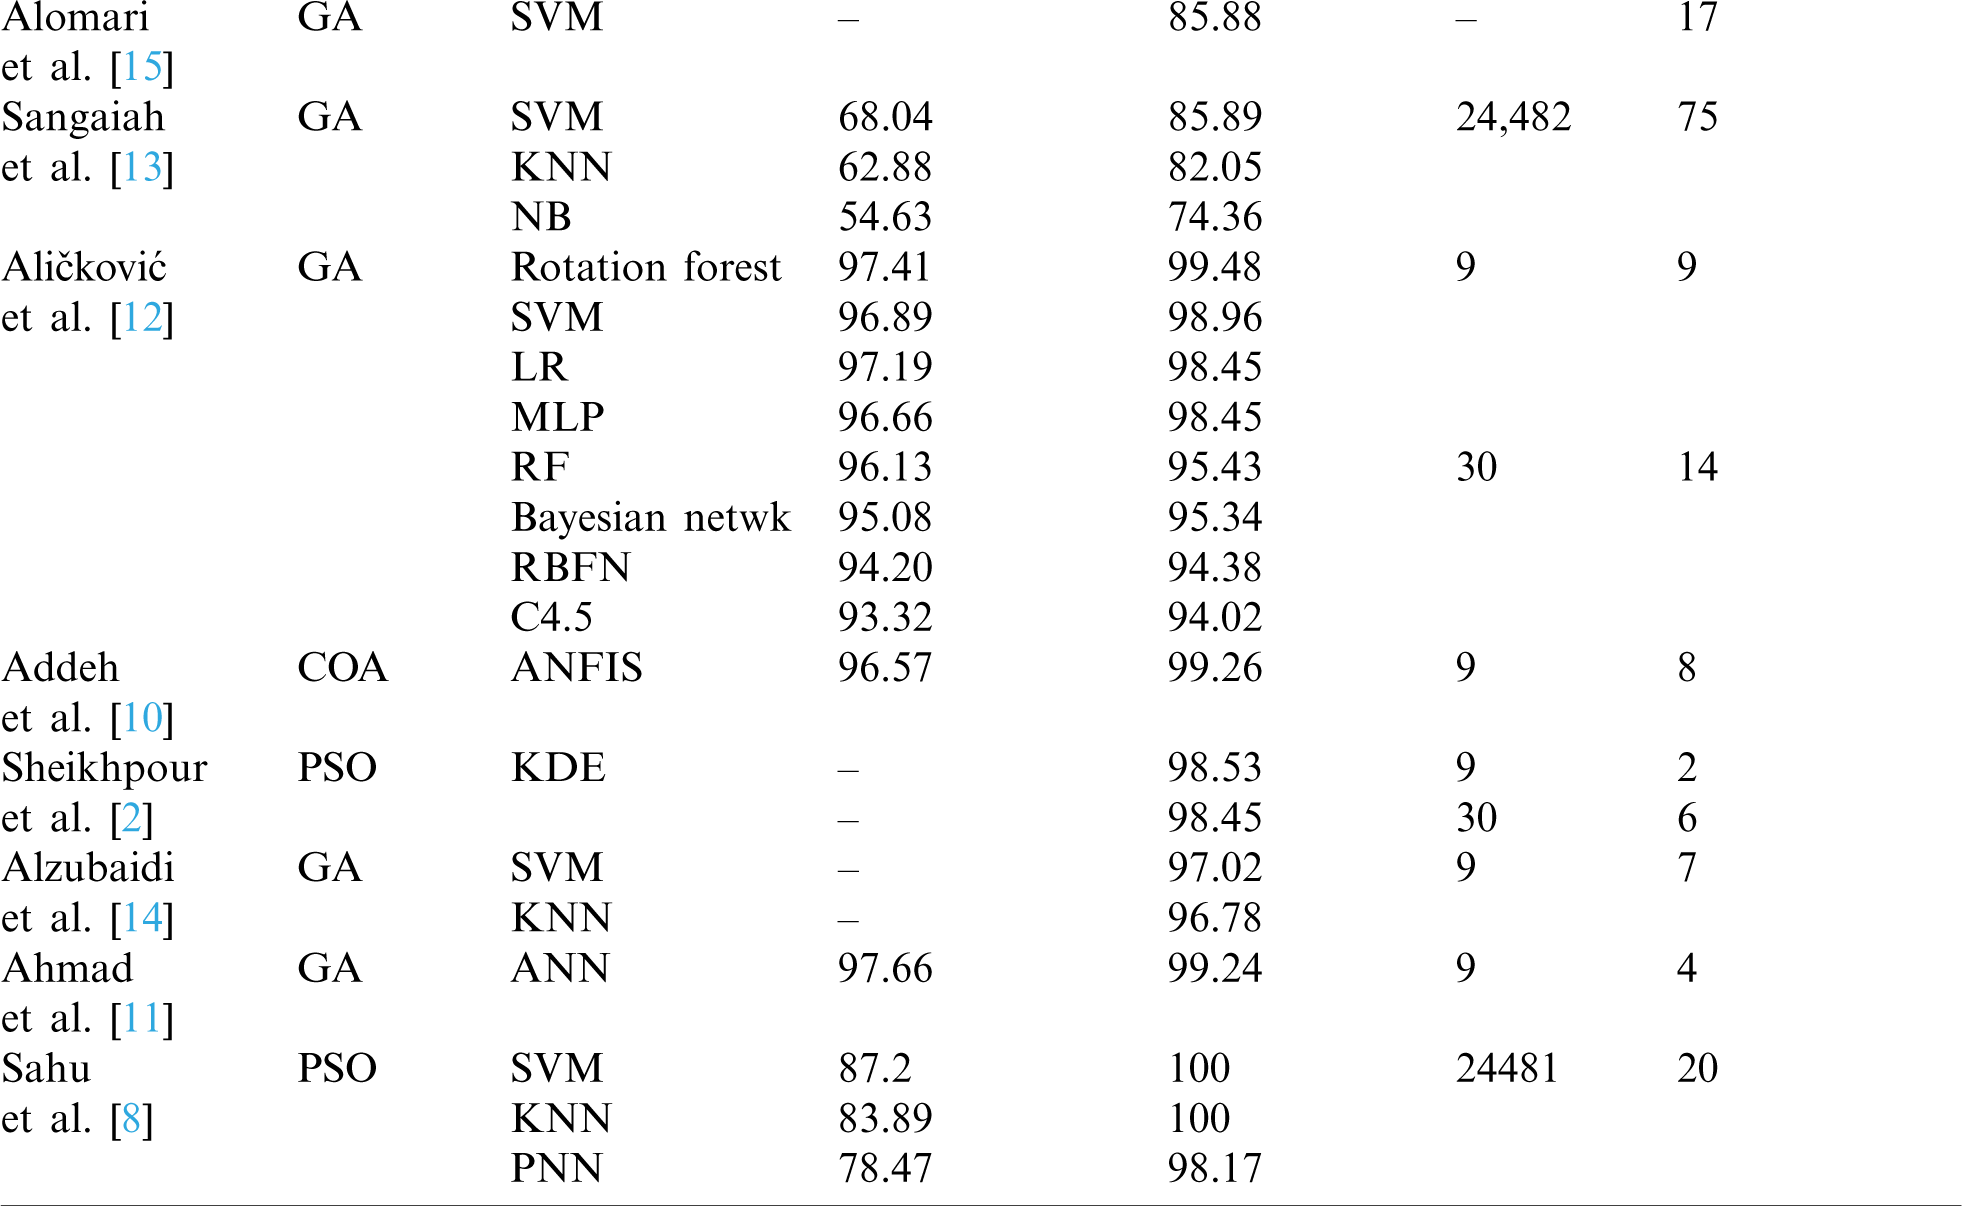
Multiple studies used GA as the FS. Ahmad et al. [11] utilized an artificial neural network algorithm that mimics the human neural learning process to provide a method for automatic breast cancer diagnosis. Moreover, FS was conducted using a wrapper approach and optimization using GA. Their best accuracy result was 99.24%. In another study, Aličković et al. [12] described a two-stage process, with FS using GA to remove uninformative features as the first stage. In the second state, the selected data was used as input for different data mining techniques. Their best accuracy result was 99.48% for rotation forest, followed by 98.96% for SVM. Furthermore, Sangaiah et al. [13] combined ReliefF attribute reduction and entropy-based GA to produce a hybrid method for breast cancer detection. Their solution is also described as a two-phase process. First, the FS process was obtained by using the ReliefF attribute, which filtered irrelevant features. The optimization process was then applied by using entropy GA, which is based on a wrapper approach, to determine the optimal features subset. In the results, the most accurate classifier was SVM with 85.89%. Similarly, Alzubaidi et al. [14] identified malignant tumors in breast cancer through a hybrid model that combined GA with mutual information (MI) to apply FS. MI was utilized to maximize the correlation between the features and the class and GA to avoid local optima in FS. The selected features were used to feed KNN and SVM classifiers. The best result of area under the curve (AUC) was 0.9702 for SVM and 0.9678 for KNN. Similarly, Alomari et al. [15] proposed a hybrid filter-wrapper gene selection method (MRMR-FPA), which combined a minimum redundancy maximum relevance algorithm and a flower pollination algorithm to determine the most informative gene subset. The best accuracy obtained by the MRMR-FPA was 85.88% with an average of 16.80 features. Bhardwaj et al. [16] presented a model, GPsfsc, which is a simultaneous FS and classification technique that uses genetic programming (GP). The best accuracy of GPsfsc was 100% and it demonstrated an average of 1.91 features in the tenfold cross-validation. Tab. 1 presents a comparison of the recent previous work in the field in terms of to the type of NIC optimizer algorithm, type of classifier, as well as the overall accuracy achieved by each proposed method with and without FS.
Table 1: Comparison of previous work based on FS with NIC algorithms
Other studies addressed breast cancer prediction and diagnosis based on FS algorithms that do not rely on NIC algorithms, such as CFS and F-score. Urmaliya et al. [17] suggested a new model to solve the traditional quadratic programming problem in SVM to reduce the training time of large datasets. The new solution is based on using sequential minimal optimization and FS, which was applied using the F-score. The best accuracy result was 100% with four features compared to 99.28% with all features. Pritom et al. [18] researched the returning probability of breast cancer by using three classifiers and FS. In the case of FS, the ranker algorithm was used to remove irrelevant features. The best accuracy (77.27%) was obtained by SVM. Furthermore, a study by Mufassirin et al. [19] used a hybrid filter-wrapper approach using the Gain ratio with the ranker algorithm for filtering and a wrapper subset evaluator. The new approach was evaluated based on five cancer microarray datasets, including a breast cancer dataset that contains 24,481 features. The highest accuracy they obtained was 89.69%. A study by Alyami et al. [20] developed a breast cancer tumor classification model based on FS. The FS utilized the CFS between the features and the class attribute. The overall result demonstrated the superiority of SVM with 97.14% accuracy. Khourdifi et al. [21] used the fast correlation-based FS method for eliminating redundant features. The best precision classifier was 96.3%. In the same context, Shen et al. [22] constructed a model for breast cancer diagnosis that was based on feature selection by using INTERACT. Moreover, INTERACT was selected from among other FS approaches because it considers relationships between features. It searches for features that initially have little correlation with the class but become highly correlated after integration with other features. The result demonstrated the superiority of the FS model with 92% accuracy compared with the model without FS, which had 87% accuracy. Similarly, Turgut et al. [23] used microarray data in breast cancer prediction on two datasets: One with 1919 features and another with 24,481 features. They applied two types of FS techniques: Randomized logistic regression and recursive feature elimination. Ultimately, 50 features were selected using both techniques. Generally, the results after FS outperformed the results before FS. A study by Mohamed [24] applied a sequential forward selection algorithm on two types of classifiers: Linear classification functions (LCF) and quadratic classification functions (QCF). The final accuracy of QCF with FS was higher (96.21%) than without FS (94.31%). In contrast, in the case of LCF, the accuracy without FS was 97.16% compared with 94.79% with FS. However, the researcher mentioned that the decrease in the accuracy was considered small (2.5%) compared to the benefit obtained by using FS, as it reduces the time and features required for the diagnosis by more than 50%. Moreover, Khasburrahman et al. [25] used a MicroRNA expression dataset containing 1,881 features. Greedy stepwise and multilayer perceptron techniques were used to apply FS. The greedy stepwise identified important features by applying a forward or backward search. Both FS techniques selected four different features. The best accuracy after using the FS techniques was 97.1% reached by the greedy stepwise.
Generally, NIC algorithms can be incorporated into wrapper FS method to search globally for optimal genes and enhance prediction accuracy [2]. In a previous work proposed by Alghunaim et al. [26], the authors tackled the breast cancer prediction problem using supervised ML approach without applying any feature selection techniques and this resulted in a long processing time of the predictive model. Therefore, in order to alleviate the curse of dimensionality (16077 genes in the used datasets in [26]), we propose in this work an optimized wrapper gene selection method that is based on simulated annealing (SA) algorithm in combination with three ML algorithms, including support vector machine (SVM), decision tree (DT), and random forest (RF), thereby creating three classifiers referred to as SA-SVM, SA-DT, and SA-RF. The main objective of incorporating SA into the wrapper feature selection method is to identify the most informative genes in the high dimensional genetic data space in a reasonable amount of time. Thereafter, these optimal genes are used to train the classifiers. The reason of choosing the SA algorithm is that most of the NIC algorithms used to optimize the breast cancer problem in the literature are population-based algorithms such as PSO and GA. In this type of algorithms, a population of multiple candidate solutions are evolved, thus making the whole optimization process a time-consuming task. On the other hand, SA is an example of NIC algorithms that depend on a random search to reach global optimization. It is a single-solution-based algorithm, which focuses on improving a single candidate solution and thus it is faster than population-based algorithms [27]. In addition, SA has shown good performance in similar problems. The proposed approach has the potential to significantly improve the efficiency and accuracy of the classifiers. To the best of our knowledge, this is the first attempt to optimize the wrapper feature selection method using SA for breast cancer prediction.
The rest of this paper is organized as follows. We describe the materials and methodology of our work in Section 2. Section 3 discusses the experiment results. Finally, we conclude the paper and propose future work in Section 4.
Our method is inspired by the fact that SA is one of the most popular algorithms for global optimization that mimics the metal annealing process. It can search globally over a large space, avoids local minima, and provides enough randomness with slow cooling to reach an optimal solution [27]. Accordingly, we propose an optimized wrapper gene selection based on the SA algorithm, which can help to identify the most informative genes that contribute to cancer prediction.
As illustrated in Fig. 1, the proposed approach consists of two main phases: The FS phase and the classification phase. These phases are explained in the five subsections that follow.

Figure 1: General structure of the framework
2.1.1 Initialization of SA Parameters
In the FS phase, SA begins by initializing its parameters, which include the following: Initial temperature, final temperature, and cooling schedule. Initial temperature (T0) and cooling schedule are important parameters in SA for reaching the global optimal solution. SA starts with high temperature; thus, all solutions are likely to be accepted. As the temperature decreases, the SA tends to accept only the superior solutions, while the inferior ones are usually rejected. Two common methods are used to set a cooling schedule: Linear and geometric [27,28]. We adopted the latter since it is more commonly used in the literature [28] as it tends to increase the number of iterations when the temperature is decreasing. Therefore, there is no need to assign the number of maximum iterations.
2.1.2 Random Moves and Score Calculation
As SA is a stochastic algorithm, the random search (moving) represents one of its essential components [28]. SA starts with a random gene called the current solution (xi). It then selects another random gene, the new solution (xj). Subsequently, SA calculates the score of each solution, accuracy in this case, according to the objective function (f). The objective function represents the accuracy, which is obtained by one of the three classifiers (DT, RF, and SVM) using tenfold cross-validation. Calculating the accuracy represents the beginning of the classification phase 1. If the accuracy of the new solution is better than that of the current solution, then the new solution is accepted and the current solution is updated with the value of the new solution. Otherwise, a probability (p) is calculated and a random number (r) is generated. This probability is called acceptance (transition) probability, and it refers to the probability of acceptance of the worse or not-ideal solution. Moreover, r is a threshold, a random number in the range between 0 and 1. If  , then the new solution is accepted. Otherwise, it is returned to select a new solution. Eq. (1) represents the acceptance probability [27].

where  is the change of the objective function and T is the current temperature. In this step, the accepted solutions are stored in an optimal genes array.
2.1.3 Update Temperature and Repeat
If the new solution is accepted in the previous step, the current temperature needs to be decreased. To update the temperature, we follow the geometric cooling schedule [27].

where  and t is the current iteration. Thereafter, we return to the step described in Section 2.1.2. and repeat the process until the temperature reaches the final temperature (Tf).
2.1.4 Select the Optimal Gene Subset
The algorithm will stop when the freezing point (final temperature) is reached, which should be equal to zero. However, in practice, the algorithm stops when the current temperature reaches 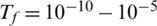 [25]. Upon completion of the algorithm, we obtain the optimal gene subset (optimal genes array), which is used in the classification phase 2.
2.1.5 Evaluate the Optimal Gene Subset
By the end of the SA algorithm, the resulting optimal gene subset is fed to the classifier to perform the final classification using tenfold cross-validation (classification phase 2). The evaluation is based on six evaluation metrics, which include the following: Accuracy, precision, recall, specificity, area under the curve (AUC), and execution time.
2.2.1 Overview of the Datasets
Three datasets were used in this work. The first dataset contains gene expression (GE), while the second dataset contains deoxyribonucleic acid (DNA) methylation. The third dataset is a combination of the two. Originally, GE and (DNA) methylation datasets were obtained from previous work conducted by Benmounah et al. [29] who acquired them from The Cancer Genome Atlas (TCGA) [30]. Each dataset contains 16,077 attributes (genes or features) and 254 instances (people or samples) classified as patients with breast cancer (215 instances) or normal healthy people (39 instances). Moreover, both datasets contain data from the same patients, which means that for each patient, there is information about both the GE and the DNA methylation. Inspired by [26], a third dataset was created that is the result of combining the two previous datasets. This combined dataset can be used as a third benchmark for evaluating the proposed algorithm and for investigating whether the combined information of GE and DNA methylation may help to enhance early prediction of breast cancer.
Data pre-processing entails several steps. Through exploration, described in the previous section, we can recognize that the used datasets can be considered class-imbalanced datasets. Class imbalance refers to a situation in which the presence of the dataset samples in the main class is rare [31]. Therefore, the negative class includes the most data, while the positive class has the least data. To resolve this issue, we have used the synthetic minority oversampling technique (SMOTE) on our training sets. This technique adds synthetic samples that are considered close to the existing positives samples within the sample space. Moreover, we have switched the columns and rows since the original datasets are presented oppositely: The attributes are displayed in rows and instances in columns. Finally, we have combined both the GE and the DNA methylation datasets to create a third dataset that enables us to benefit from both types of information.
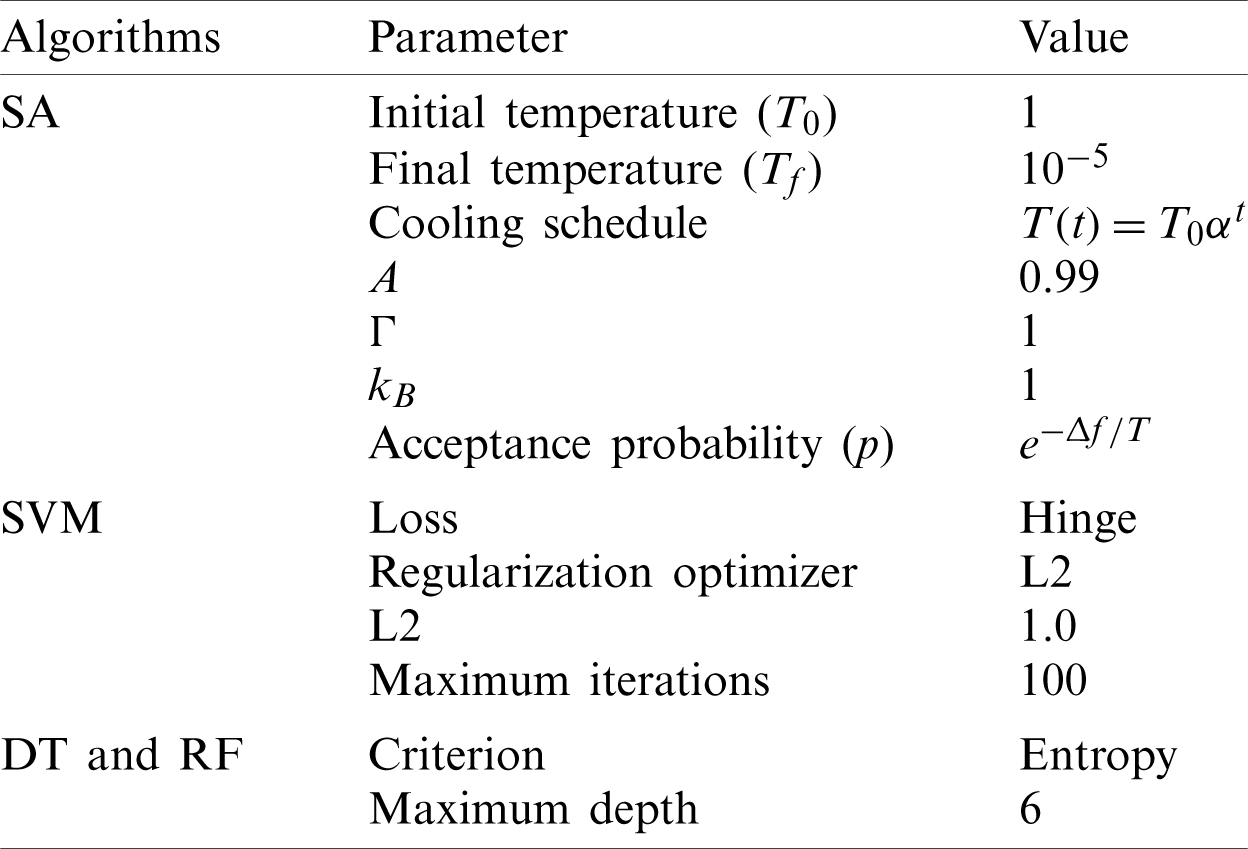
To implement this work, we used a MacBook Pro laptop with a 2.9 GHz Intel Core i5 processor and 8 GB memory. The proposed algorithm is implemented using Python programming language. Anaconda [32] is employed as the primary platform. Anaconda is an open-source platform that provides data scientists with many sophisticated libraries to help them interpret their datasets and discover hidden patterns. Tab. 2 summarizes the selected parameter settings of SA algorithms and the classification algorithms used in the experiments.
Table 2: Parameter settings of the proposed method
For the sake of comparison with the previous work [26], we conducted this experiment to investigate the impact of addressing the imbalanced datasets on the performance of the predictive classifiers. We compared the performance of the three classifiers used in our study under the Python platform and without incorporating any feature selection method to [26]. The authors in [26] tested the three datasets (GE, DNA methylation, and a combination of the two) using three traditional classifiers (SVM, DT, and RF) on Spark and Weka platforms. However in [26], the class imbalance problem in the used datasets has not been solved and no FS techniques have been employed to the classifiers. Therefore, in this experiment, we first applied the SMOTE oversampling technique to address the imbalanced datasets issue and compare the results. The aim behind applying the oversampling technique is to avoid any misleading or biased results as classifiers are more sensitive to detecting the majority class. The results of this experiment are displayed in Tab. 3.
Table 3: First experiment results
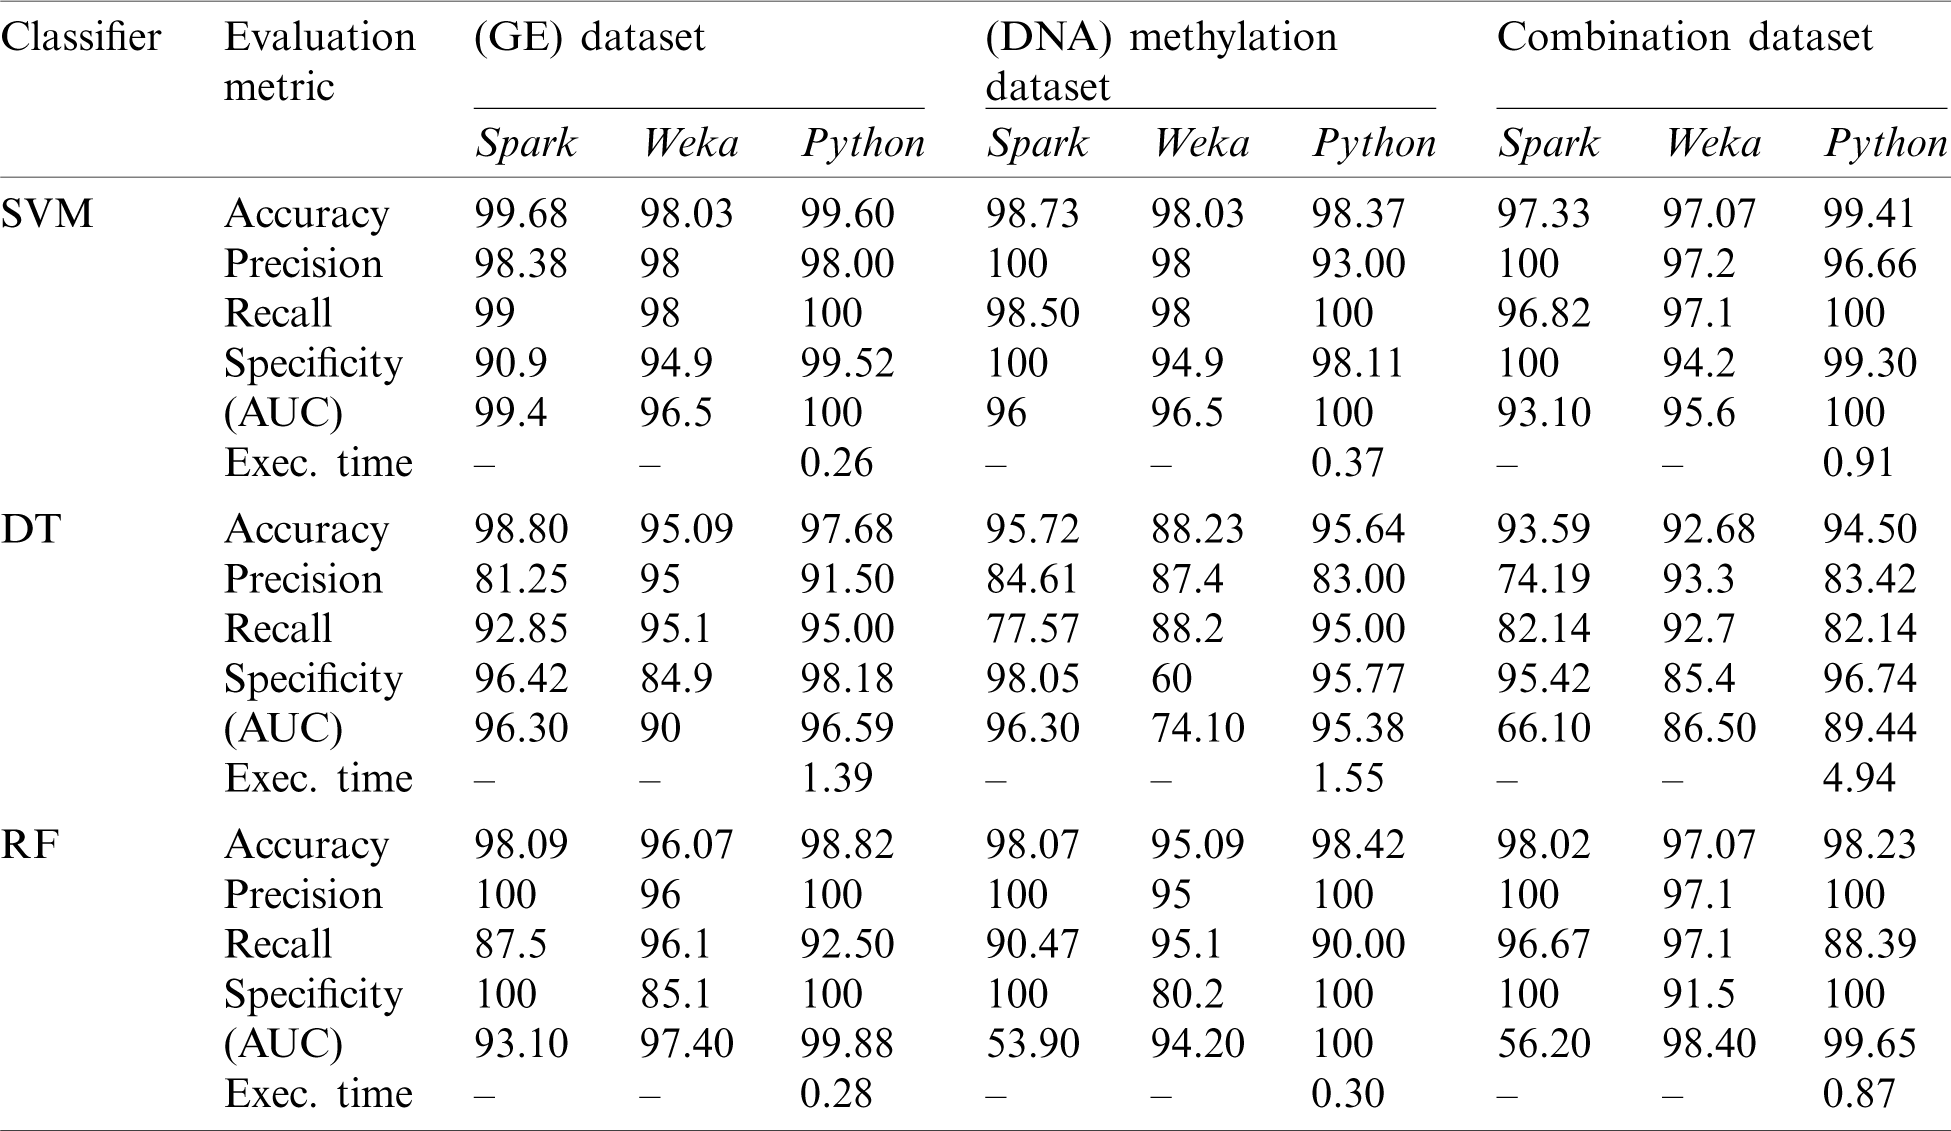
As can be noticed from Tab. 3, the accuracy results were enhanced by our experiment due to the impact of oversampling technique. The Python platform in this experiment showed better accuracy results than the Spark and Weka platforms on the three datasets (98.82% for GE, 98.42% for DNA methylation, and 98.23% for combined dataset) using the RF classifier and in the combination dataset using the three classifiers (99.4% for SVM, 94.50% for DT, and 98.23% for RF). In general, the Python platform outperformed Weka in terms of accuracy. However, it demonstrated a slight decrease in accuracy compared to the Spark platform on GE and DNA methylation datasets using SVM and DT classifiers.
In this experiment, performance comparisons were conducted between the proposed classifiers (SA-SVM, SA-DT, and SA-RF), where only the optimal gene subset is employed in the classification process and the traditional classifiers used in the previous work [26] in the first experiment (SVM, DT, and RF). The intention is to investigate the impact of incorporating the optimized wrapper gene selection method using SA algorithm into the classifiers. Tab. 4 presents the results of this experiment.
Table 4: Second experiment results
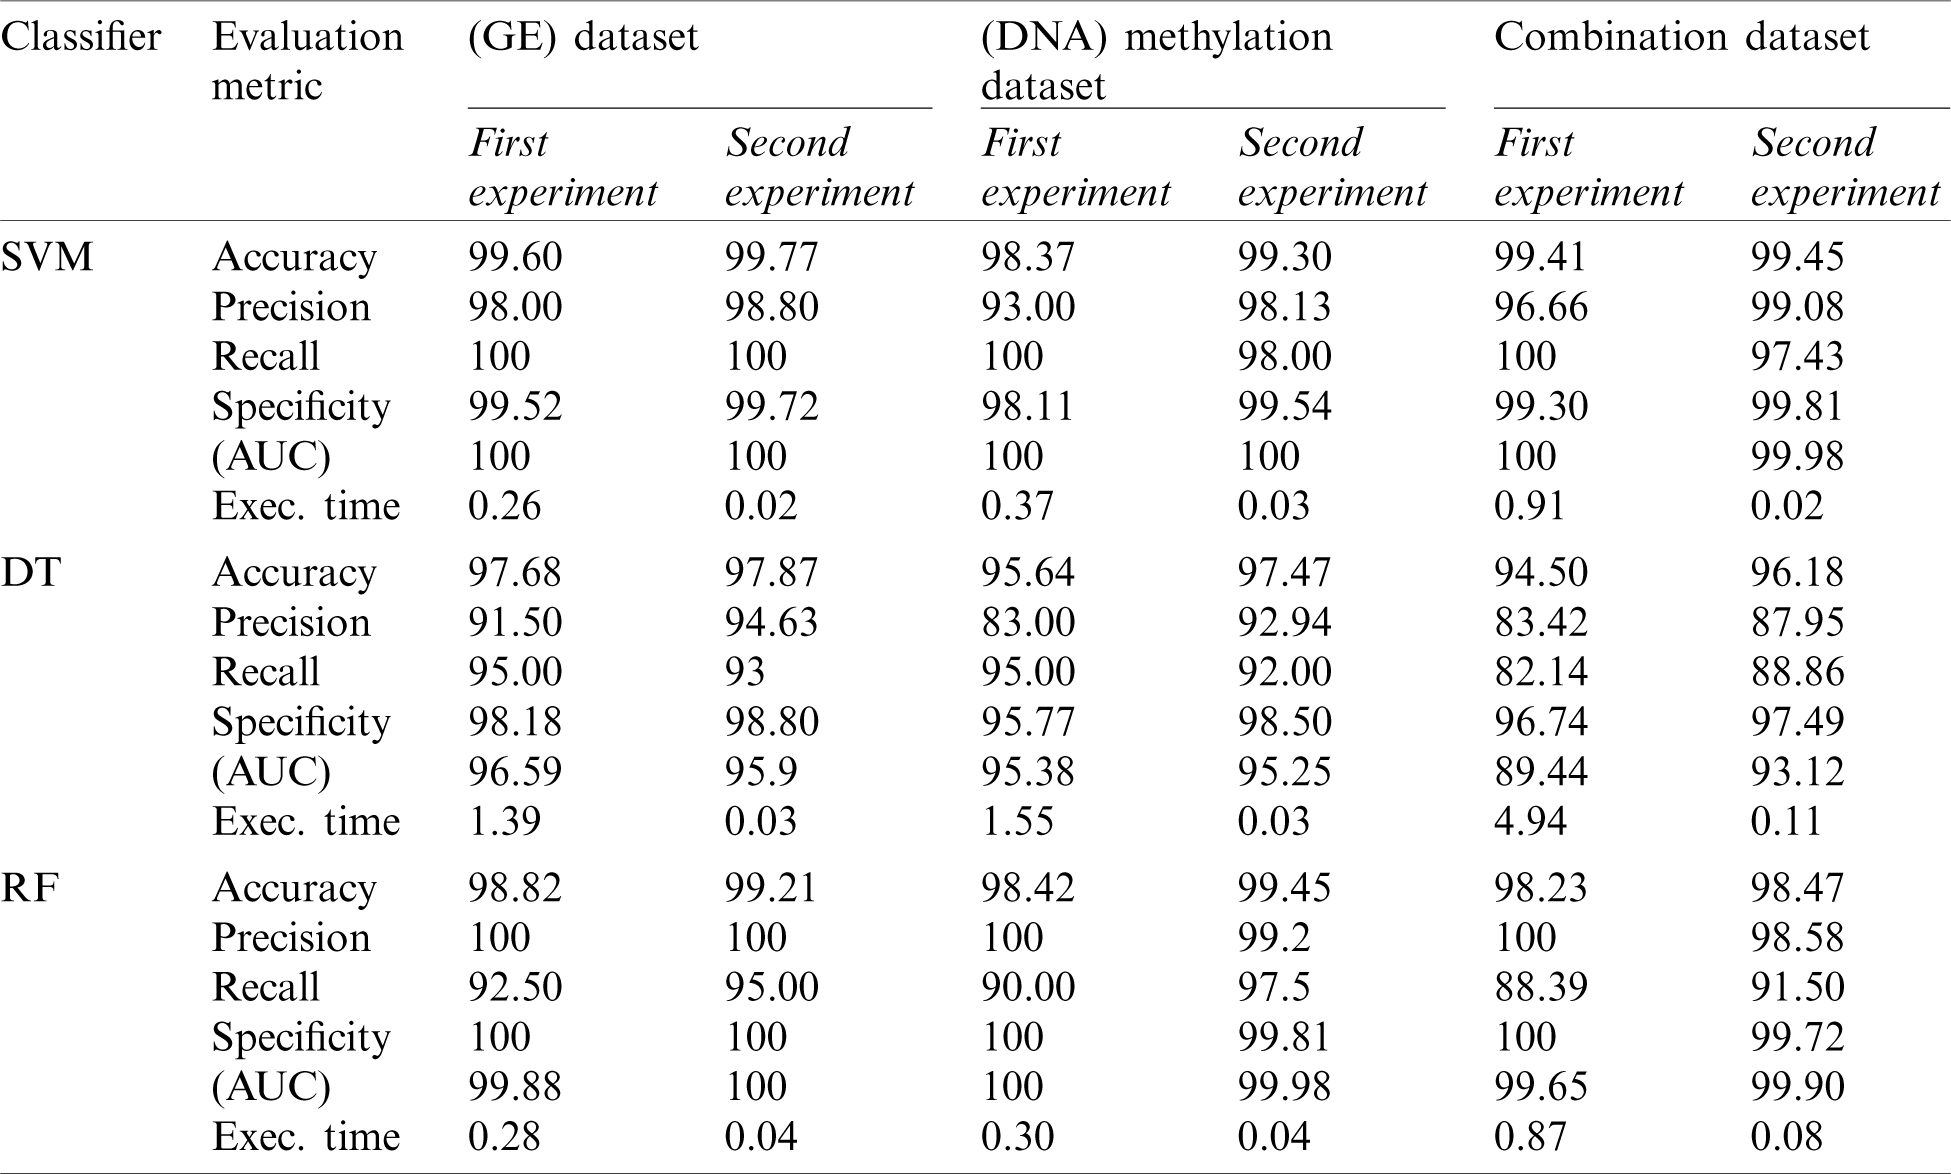
The accuracy results in Tab. 4 and Figs. 2–4 demonstrate the superiority of the three proposed classifiers (SA-SVM, SA-DT, and SA-RF) over the traditional classifiers. This reflects the ability of the proposed wrapper gene selection method to reach the optimal gene subset This reflects the ability of the proposed wrapper gene selection method to reach the optimal gene subset, hence achieving higher classification accuracy. In regard to the SA-SVM classifier, it obtained the highest accuracy value of (99.77%) on GE dataset followed by the combination dataset (99.45%) and the DNA methylation dataset (99.30%). As for the SA-DT classifier, it gave the highest accuracy on the GE dataset (97.87%) compared to the DNA methylation (97.47%) and the combination dataset (96.18%). The SA-RF classifier had the highest accuracy on the DNA methylation dataset (99.45%) followed by the GE dataset (99.21%), then the combination dataset (98.47%). It is clear that the best accuracy result was achieved by the SA-SVM classifier on the GE dataset.

Figure 2: Accuracy comparison between the proposed SA-SVM classifier and the traditional SVM

Figure 3: Accuracy comparison between the proposed SA-DT classifier and the traditional DT

Figure 4: Accuracy comparison between the proposed SA-RF classifier and the traditional RF
Furthermore, the execution time of the proposed classifiers was significantly reduced after employing SA, as shown in Figs. 5–7. SA-SVM is considered to be the fastest classifier and required only 0.02 s to complete the classification task. Unsurprisingly, the execution time on the GE and the DNA methylation datasets was less than the execution time required on the combination dataset.
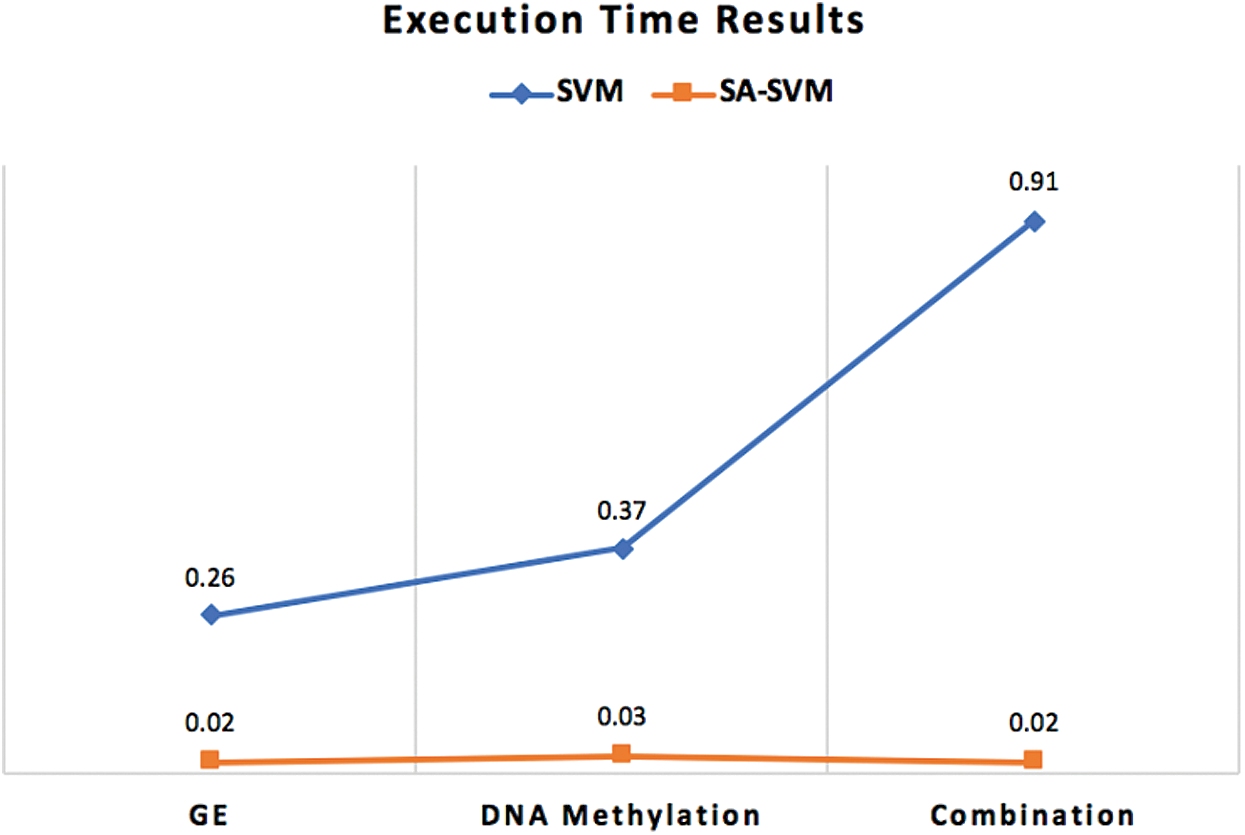
Figure 5: Execution time comparison between SA-SVM classifier and the traditional SVM
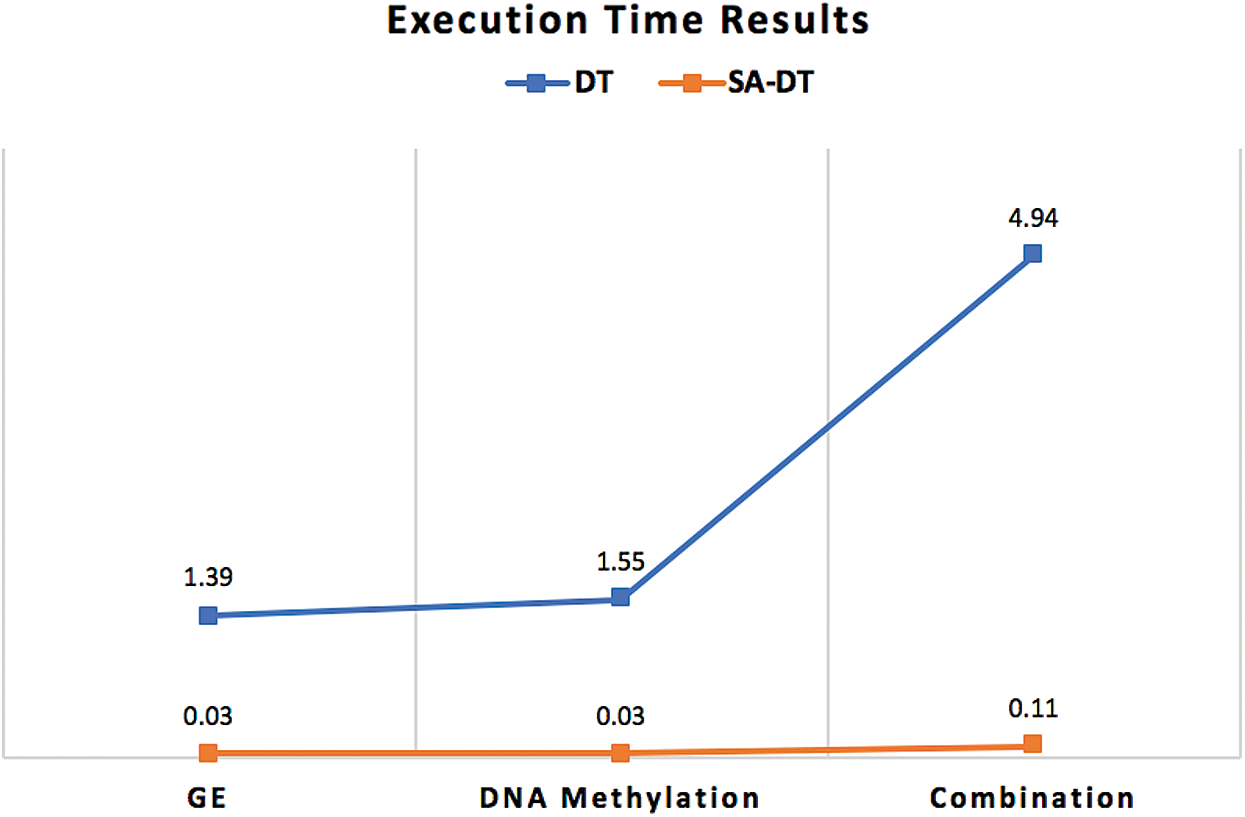
Figure 6: Execution time comparison between SA-DT classifier and the traditional DT
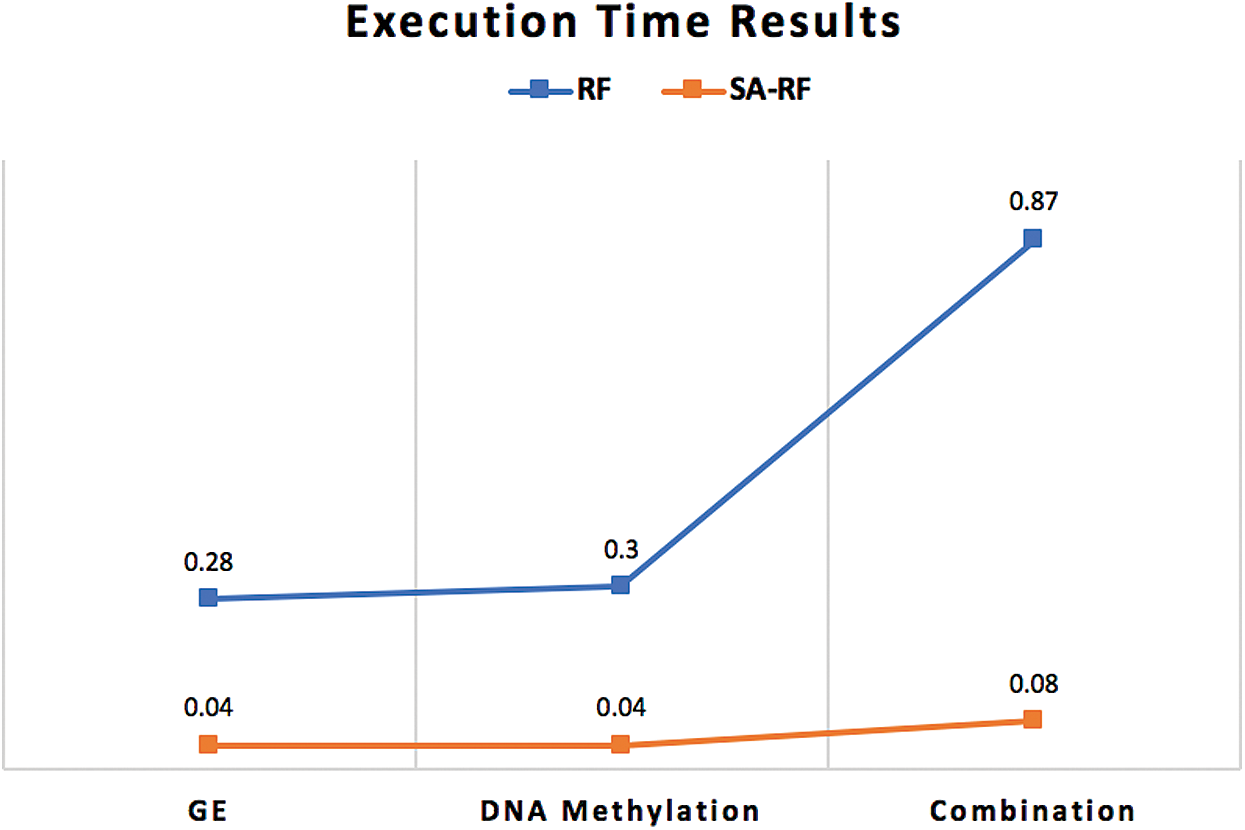
Figure 7: Execution time comparison between SA-RF classifier and the traditional RF
In the case of AUC, Tab. 4 and Figs. 8–10 indicate that it has been slightly enhanced in most cases in this experiment. The SA-SVM classifier reached better AUC value of (100%) on the GE and the DNA methylation datasets compared to the combination dataset (99.98%). In addition, the AUC results of SA-DT and SA-RF classifiers on the GE (95.9%, 100%) respectively, and on the DNA methylation (95.25%, 99.98%) respectively were better than the combination dataset (93.12%, 99.90%).
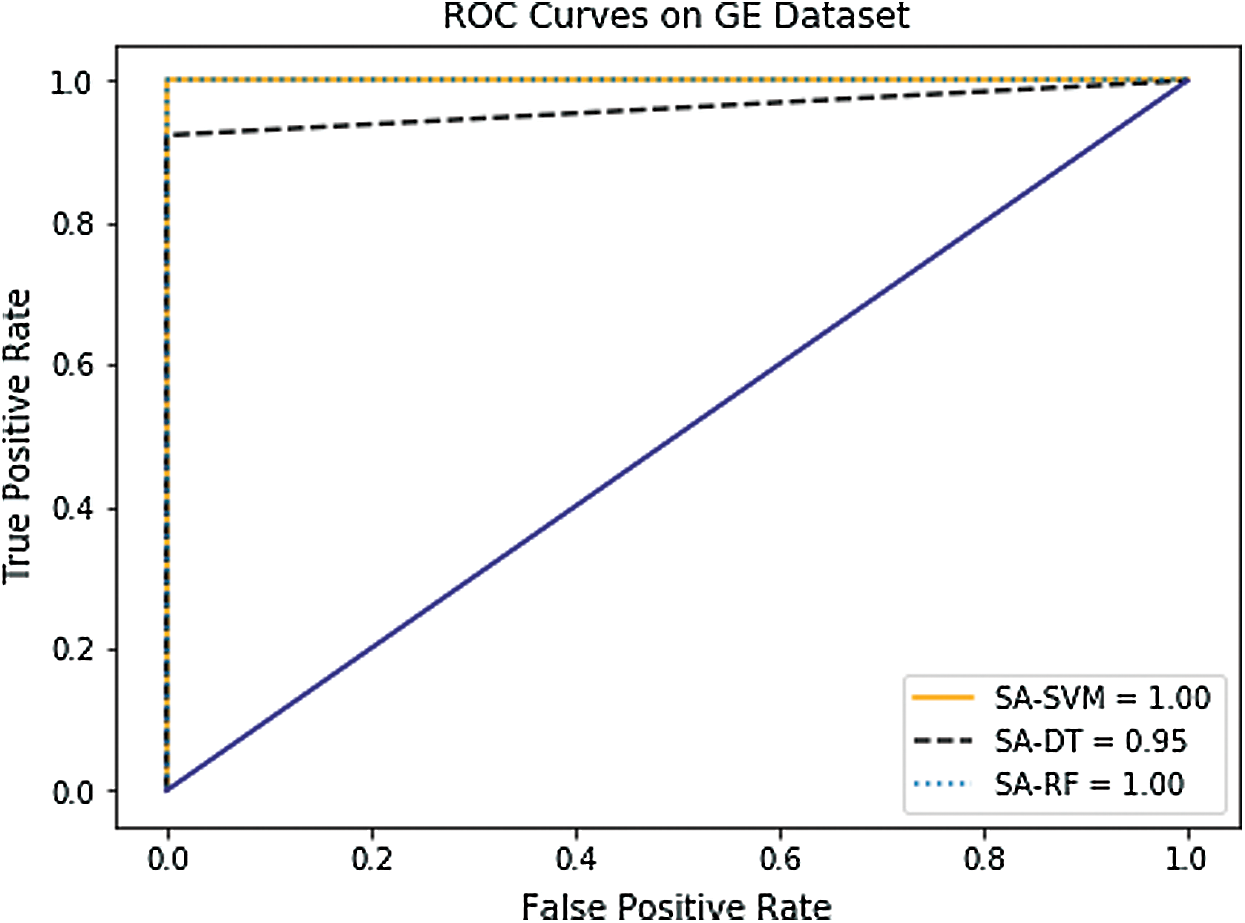
Figure 8: Receiver operating characteristic (ROC) curves of GE dataset
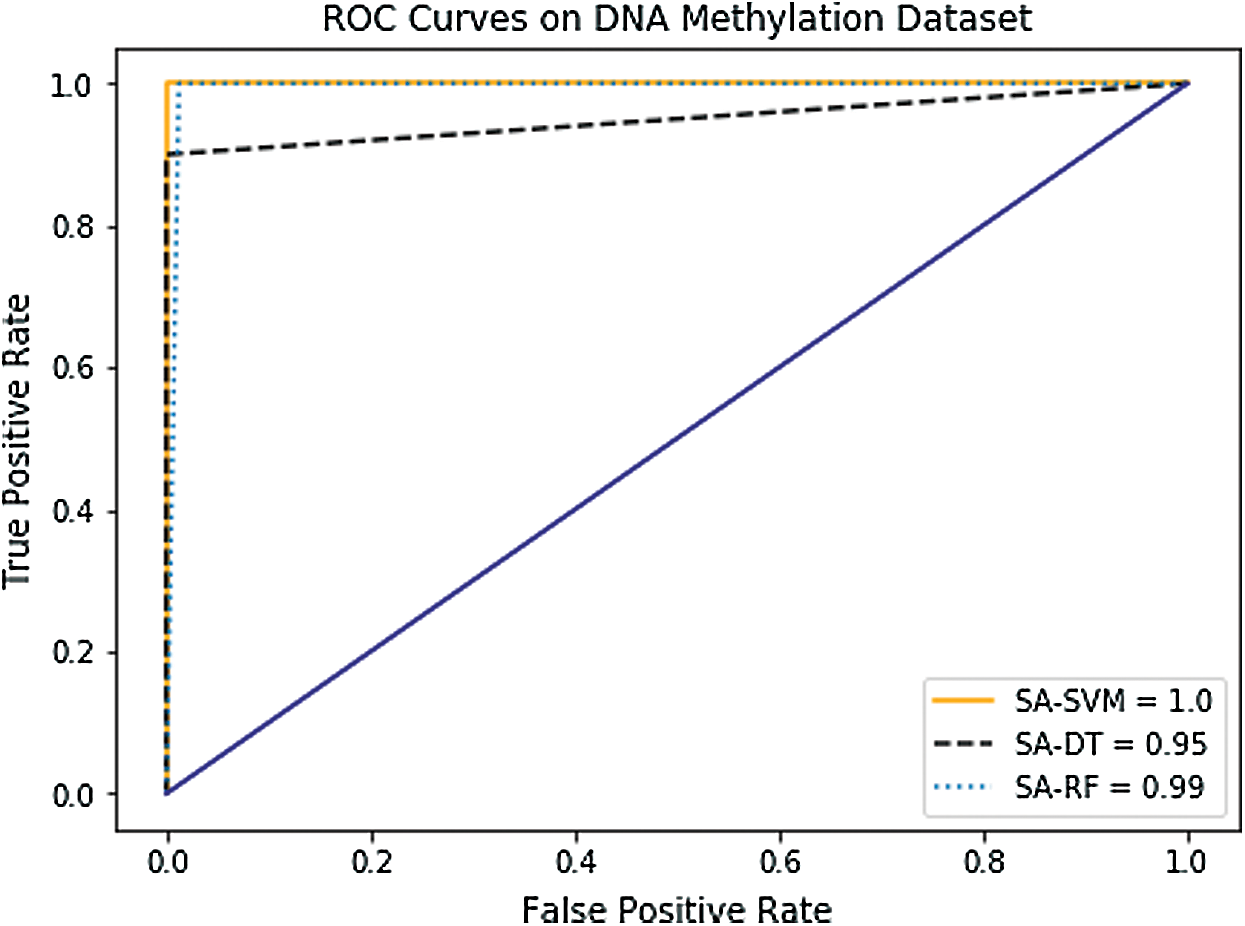
Figure 9: Receiver Operating Characteristic (ROC) curves of (DNA) methylation dataset
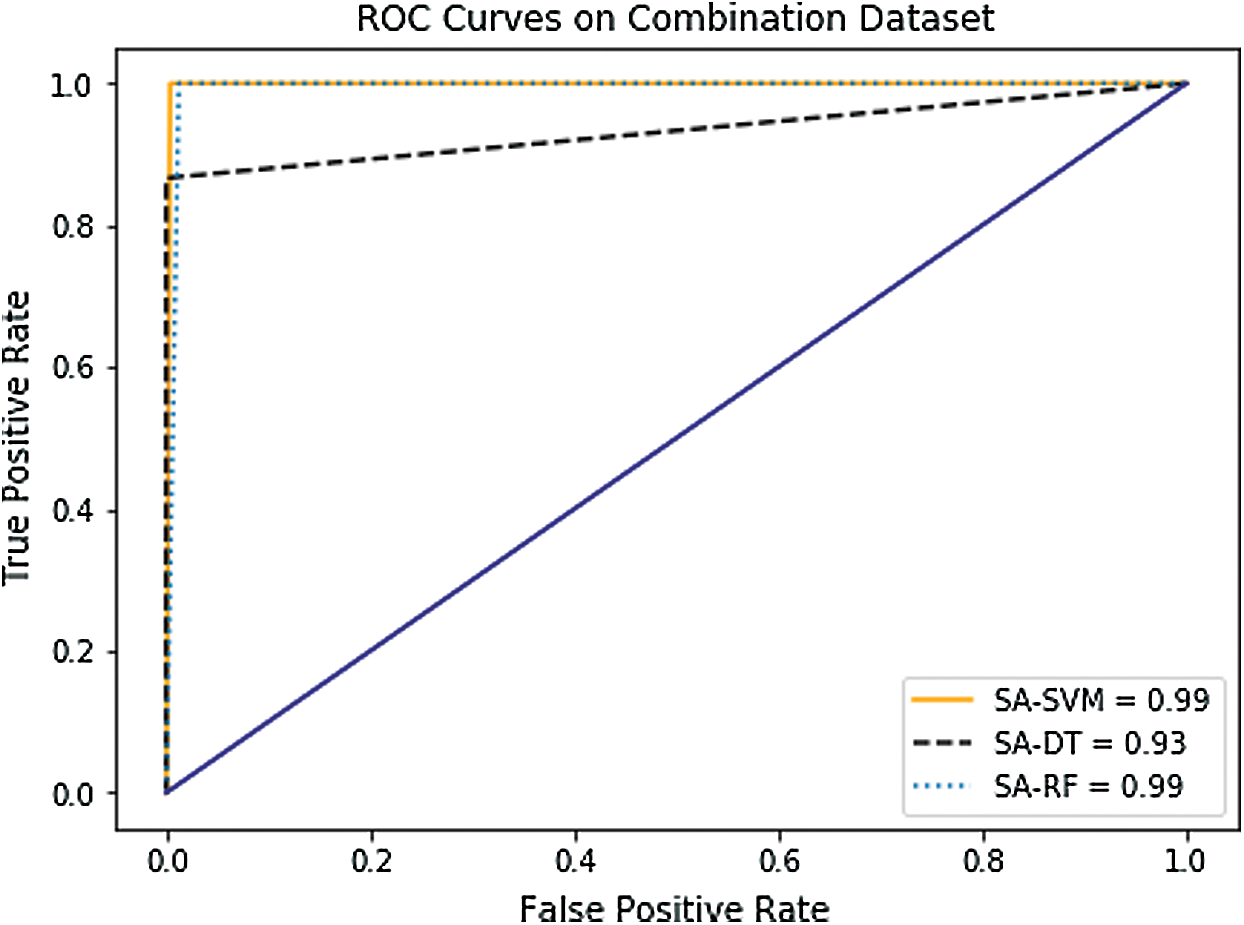
Figure 10: Receiver operating characteristic (ROC) curves of combined dataset
As for precision and specificity, the SA-RF classifier attained the best result of 100 on the GE dataset. The SA-SVM classifier achieved high results on the combination dataset with precision value of 99.08 and specificity value of 99.08, while the SA-DT classifier obtained high results on the GE dataset with precision value of 94.63 and specificity value of 98.80. Moreover, the SA-SVM classifier gave the best recall result of 100 on the GE dataset followed by the SA-RF classifier with a value of 97.5 on the DNA methylation dataset, then the SA-DT classifier with a value of 93 on the GE dataset.
In conclusion, the experimental results showed the effectiveness of incorporating the SA based wrapper gene selection to the three predictive classifiers (SVM, DT, RF) in terms of enhancing the accuracy of breast cancer prediction, as well as reducing the computational cost of the classification process.
According to the results achieved by the two conducted experiments, it is evident that the prediction accuracy of breast cancer has been improved using the proposed optimized feature selection method, by which only the most informative genes features have been selected for the classification process rather than the total features. However, the size of the datasets used in this study is relatively small, which can reduce the classification accuracy and statistical power. Having large data is always a good idea for enhancing the classification and the generalizability of the predictive model.
Breast cancer is one of the world’s most common cancers among women, making it a major public health concern in today’s society. Early prediction of breast cancer can greatly boost the prognosis and likelihood of survival, as it can enable patients to obtain prompt clinical care. The proper diagnosis of breast cancer and the classification of patients into malignant or benign categories are therefore the focus of many studies.
Machine-learning models are currently being used extensively in healthcare, and in breast cancer in particular as they can provide methodologies that are ideally suited to the task of selecting essential features from complex and often high-dimensional breast cancer datasets. While various ML algorithms can be used to detect breast cancer, some are unnecessarily time-consuming and prone to human error. The challenge is to implement automatic, fast, and accurate algorithms for early breast cancer detection. In this study, we develop predictive ML models coupled with SA-based wrapper gene selection method to select the most informative gene features. These optimal genes are then fed into the models to improve their accuracy and efficiency. We adopted three different supervised ML models namely SVM, DT, and RF, and conducted two different experiments (total gene features and selected gene features) on GE, DNA mythelation, and combination datasets. The obtained results have demonstrated the effectiveness of the proposed classifiers in terms of the classification accuracy of the breast cancer within a relatively short execution time. Generally, the proposed classifiers produced the highest accuracy with the GE dataset. Among the three classifiers, SA-SVM obtained the highest accuracy with a value of (99.77%) on GE dataset and lowest execution time of 0.02 s. Notably, the combination dataset did not provide any additional benefit over the GE dataset.
The ML models proposed in this study can assist both health care practitioners and medical researchers in the early detection of breast cancer. In clinical practice, the proposed models can help doctors to recognize medical data patterns and breast cancer diagnosis from independent trained gene features. Compared to real-time clinical practices, the proposed models can help reduce the potential errors that can be made by fatigued or inexperienced health care workers and allow medical data to be examined in shorter time.
In the future, we are intending to validate the study outcomes using large breast cancer dataset. A relatively large dataset allows adequate partitioning into training and testing sets, thus leading to a better classification of the ML model. This will further allow us to measure the performance of a deep learning algorithm in breast cancer prediction after obtaining more patient samples. Moreover, Hybrid gene selection methods may also be regarded as a future approach, as it combines the advantages of both filter and wrapper algorithms. For further enhancement of the proposed classifiers’ performance, ensemble methods using SVM, DT, RF, NB, KNN and other classification algorithms could be employed. The main objective of the ensemble approach is that the efficiency of combining the classifiers is commonly superior to that of each individual classifier.
Acknowledgement: The authors would like to acknowledge the Researchers Supporting Project Number (RSP-2020/287), King Saud University, Riyadh, Saudi Arabia for their support in this work.
Funding Statement: The authors received no specific funding for this study.
Conflicts of Interest: The authors declare that they have no conflicts of interest to report regarding the present study.
1. E. Niederhuber, J. O. Armitage, J. H. Doroshow, M. B. Kastan and J. E. Tepper. (2019). Abeloff’s Clinical Oncology, 5th ed., Netherlands: Elsevier Health Sciences, . [Online]. Available: https://ebooks.elsevier.com/ebooks/. [Google Scholar]
2. R. Sheikhpour, M. A. Sarram and R. Sheikhpour. (2016). “Particle swarm optimization for bandwidth determination and feature selection of kernel density estimation based classifiers in diagnosis of breast cancer,” Applied Soft Computing, vol. 40, pp. 113–131. [Google Scholar]
3. M. A. Mohammed, B. Al-Khateeb, A. N. Rashid, D. A. Ibrahim, M. K. Abd Ghani et al. (2018). , “Neural network and multi-fractal dimension features for breast cancer classification from ultrasound images,” Computers & Electrical Engineering, vol. 70, pp. 871–882. [Google Scholar]
4. M. K. Abd Ghani, M. A. Mohammed, N. Arunkumar, S. A. Mostafa, D. A. Ibrahim et al. (2020). , “Decision-level fusion scheme for nasopharyngeal carcinoma identification using machine learning techniques,” Neural Computing and Applications, vol. 32, no. 3, pp. 625–638. [Google Scholar]
5. V. Bolón-Canedo, N. Sánchez-Maroño and A. Alonso-Betanzos. (2016). “Feature selection for high-dimensional data,” Progress in Artificial Intelligence, vol. 5, no. 2, pp. 65–75. [Google Scholar]
6. N. Liu, E. S. Qi, M. Xu, B. Gao and G. Q. Liu. (2019). “A novel intelligent classification model for breast cancer diagnosis,” Information Processing & Management, vol. 56, no. 3, pp. 609–623. [Google Scholar]
7. S. B. Sakri, N. B. A. Rashid and Z. M. Zain. (2018). “Particle swarm optimization feature selection for breast cancer recurrence prediction,” IEEE Access, vol. 6, pp. 29637–29647. [Google Scholar]
8. B. Sahu and D. Mishra. (2012). “A Novel feature selection algorithm using particle swarm optimization for cancer microarray data,” Procedia Engineering, vol. 38, pp. 27–31. [Google Scholar]
9. I. Jain, V. K. Jain and R. Jain. (2018). “Correlation feature selection based improved-binary particle swarm optimization for gene selection and cancer classification,” Applied Soft Computing, vol. 62, pp. 203–215. [Google Scholar]
10. A. Addeh, H. Demirel and P. Zarbakhsh. (2017). “Early detection of breast cancer using optimized ANFIS and features selection,” in 2017 9th Int. Conf. on Computational Intelligence and Communication Networks, Cyprus, IEEE, pp. 39–42. [Google Scholar]
11. F. Ahmad, N. A. M. Isa, Z. Hussain, M. K. Osman and S. N. Sulaiman. (2015). “A GA-based feature selection and parameter optimization of an ANN in diagnosing breast cancer,” Pattern Analysis and Applications, vol. 18, no. 4, pp. 861–870. [Google Scholar]
12. E. Aličković and A. Subasi. (2017). “Breast cancer diagnosis using GA feature selection and rotation forest,” Neural Computing and Applications, vol. 28, no. 4, pp. 753–763. [Google Scholar]
13. I. Sangaiah and A. V. A. Kumar. (2019). “Improving medical diagnosis performance using hybrid feature selection via relieff and entropy based genetic search (RF-EGA) approach: Application to breast cancer prediction,” Cluster Computing, vol. 22, no. 3, pp. 6899–6906. [Google Scholar]
14. A. Alzubaidi, G. Cosma, D. Brown and A. G. Pockley. (2016). “Breast cancer diagnosis using a hybrid genetic algorithm for feature selection based on mutual information,” in 2016 Int. Conf. on Interactive Technologies and Games, Egypt, IEEE, pp. 70–76. [Google Scholar]
15. O. A. Alomari, A. T. Khader, M. A. Al-Betar and Z. A. A. Alyasseri. (2018). “A hybrid filter-wrapper gene selection method for cancer classification,” in 2nd Int. Conf. on BioSignal Analysis, Processing and Systems, Malaysia, IEEE, pp. 113–118. [Google Scholar]
16. H. Bhardwaj, A. Sakalle, A. Bhardwaj, A. Tiwari and M. Verma. (2018). “Breast cancer diagnosis using simultaneous feature selection and classification: A genetic programming approach,” in 2018 IEEE Sym. Series on Computational Intelligence, India, IEEE, pp. 2186–2192. [Google Scholar]
17. A. Urmaliya and J. Singhai. (2013). “Sequential minimal optimization for support vector machine with feature selection in breast cancer diagnosis,” in 2013 IEEE Second Int. Conf. on Image Information Processing, Australia, IEEE, pp. 481–486. [Google Scholar]
18. A. I. Pritom, M. A. R. Munshi, S. A. Sabab and S. Shihab. (2016). “Predicting breast cancer recurrence using effective classification and feature selection technique,” in 19th Int. Conf. on Computer and Information Technology, Bangladesh, IEEE, pp. 310–314. [Google Scholar]
19. M. M. Mufassirin and R. G. Ragel. (2018). “A novel filter-wrapper based feature selection approach for cancer data classification,” in 2018 IEEE Int. Conf. on Information and Automation for Sustainability, Sri Lanka, IEEE, pp. 1–6. [Google Scholar]
20. R. Alyami, J. Alhajjaj, B. Alnajrani, I. Elaalami, A. Alqahtani et al. (2017). , “Investigating the effect of correlation based feature selection on breast cancer diagnosis using artificial neural network and support vector machines,” in 2017 Int. Conf. on Informatics, Health & Technology, Saudi Arabia, IEEE, pp. 1–7. [Google Scholar]
21. Y. Khourdifi and M. Bahaj. (2018). “Feature selection with fast correlation-based filter for breast cancer prediction and classification using machine learning algorithms,” in Int. Sym. on Advanced Electrical and Communication Technologies, Morocco, IEEE, pp. 1–6. [Google Scholar]
22. R. Shen, Y. Yang and F. Shao. (2014). “Intelligent breast cancer prediction model using data mining techniques,” in 2014 Sixth Int. Conf. on Intelligent Human-Machine Systems and Cybernetics, China, IEEE, pp. 384–387. [Google Scholar]
23. S. Turgut, M. Dağtekin and T. Ensari. (2018). “Microarray breast cancer data classification using machine learning methods,” 2018 Electric Electronics, Computer Science, Biomedical Engineerings’ Meeting (EBBTTurkey, IEEE, pp. 1–3. [Google Scholar]
24. T. M. Mohamed. (2015). “Efficient breast cancer detection using sequential feature selection techniques,” in 2015 IEEE Seventh Int. Conf. on Intelligent Computing and Information Systems, USA, IEEE, pp. 458–464. [Google Scholar]
25. K. Khasburrahman, A. Wibowo, I. Waspada, H. B. Hashim and W. Jatmiko. (2017). “Comparison of diagnostics set and feature selection for breast cancer classification based on microRNA expression,” in 1st Int. Conf. on Informatics and Computational Sciences, Indonesia, IEEE, pp. 165–170. [Google Scholar]
26. S. Alghunaim and H. H. Al-Baity. (2019). “On the scalability of machine-earning algorithms for breast cancer prediction in big data context,” IEEE Access, vol. 7, pp. 91535– 91546. [Google Scholar]
27. X. S. Yang. (2020). Nature-Inspired Optimization Algorithms, Cambridge, MA: Academic Press. [Google Scholar]
28. N. Siddique and H. Adeli. (2016). “Simulated annealing, its variants and engineering applications,” International Journal on Artificial Intelligence Tools, vol. 25, no. 6, pp. 1630001. [Google Scholar]
29. Z. Benmounah. (2017). “Big data clustering of multi-level omics data sets,” Ph.D. dissertation, University of Constantine 2, Algeria. [Google Scholar]
30. The Cancer Genome Atlas, (accessed: 27 January 2020). Available: https://portal.gdc.cancer.gov/. [Google Scholar]
31. J. Han, J. Pei and M. Kamber. (2011). Data Mining: Concepts and Techniques. Amsterdam: Elsevier. [Google Scholar]
32. L. I. Muñoz and S. S. Mesquida. (2017). Introduction to data science: A python approach to concepts, techniques and applications. New York: Springer. [Google Scholar]
 | This work is licensed under a Creative Commons Attribution 4.0 International License, which permits unrestricted use, distribution, and reproduction in any medium, provided the original work is properly cited. |