DOI:10.32604/cmc.2021.015048
| Computers, Materials & Continua DOI:10.32604/cmc.2021.015048 | |
| Article |
Predicting Drying Performance of Osmotically Treated Heat Sensitive Products Using Artificial Intelligence
1Department of Sustainable and Renewable Energy Engineering, University of Sharjah, Sharjah, UAE
2College of Engineering at Wadi Addawaser, Prince Sattam Bin Abdulaziz University, 11911, Al-Kharj, Saudi Arabia
3Electrical Engineering Department, Faculty of Engineering, Minia University, 61517, Minia, Egypt
4Chemical Engineering Department, Faculty of Engineering, Minia University, 61517, Minia, Egypt
5Department of Biomedical Engineering, Military Institute of Science and Technology, Dhaka, Bangladesh
6Department of Mechanical Engineering, Military Institute of Science and Technology, Dhaka, Bangladesh
7Department of Infrastructure Engineering, Melbourne School of Engineering, The University of Melbourne, Australia
8Computers and Automatic Control Engineering Department, Faculty of Engineering, Tanta University, Egypt
*Corresponding Author: S. M. Atiqure Rahman. Email: srahman@sharjah.ac.ae
Received: 04 November 2020; Accepted: 05 December 2020
Abstract: The main goal of this research is to develop and apply a robust Artificial Neural Networks (ANNs) model for predicting the characteristics of the osmotically drying treated potato and apple samples as a model heat-sensitive product in vacuum contact dryer. Concentrated salt and sugar solutions were used as the osmotic solutions at 27 C. Series of experiments were performed at various temperatures of 35
 C, 40
C, 40 C, and 55
 C for conduction heat input under vacuum ( −760 mm Hg) condition. Some experiments were also performed in a pure vacuum without heat addition. Dimensionless moisture content (DMC), effective moisture diffusivity, and mass flux were considered as the performance parameters in this study. Results revealed that the osmotic dehydration using a concentrated sugar solution shows a higher reduction in the initial moisture loss of 19.87% compared to 5.3% in the salt solution. Furthermore, a significant enhancement of drying performance of about 27% in DMC was observed for both samples at vacuum and 40
 C compared to pure vacuum drying conditions. Using the experimental data, a robust artificial neural network (ANN) was proposed to describe the osmotic dehydration’s behavior on the drying process. The ANN model outputs are the dimensionless moisture contents (DMC), the diffusivity, and the mass flux. Whereas the ANN inputs were the drying time, the percent of sugar solution, and the percent of salt solution. For the ANN apple’s model, the minimum root mean square error (RMSE) values were 0.0261, 0.0349 and 0.0406, for DMC, diffusivity, and mass flux, respectively. Whereas the best correlation coefficients of the above three parameters’ determination values were 0.9909, 0.9867 and 0.9744, respectively. For the ANN potato’s model, the minimum RMSE values were 0.0124, 0.0140 and 0.0333, for DMC, diffusivity, and mass flux, respectively. And the best correlation coefficients of the parameters’ values were found 0.9969, 0.9968 and 0.9736, respectively. Accordingly, the ANN model’s prediction has a perfect agreement with the experimental dataset, which confirmed the ANN model’s accuracy.
Keywords: Artificial neural network; prediction; modeling; osmotic; drying kinetics
Securing food, water, and energy are the top priorities for the surviving of human beings. Due to the severe environmental impact of fossil fuels [1–3], recently, there is a rapid growth in the usage of the different renewable energy sources [4,5] in several sectors, such as securing freshwater [6,7] and transportation [8,9]. On the other hand, with the increase of the world’s population, the food storage technique having a longer storage period while preserving flavor, color, and eradicating microbial damage is getting more attention from the research community. Among various techniques developed to date, the osmotic dehydration (OD) technique has proved its excellence in storing food, especially for fruits and vegetables, by reducing water activity (aw) inside the product [10]. Additionally, due to the reduced energy consumption, osmotic dehydration of fruits has gained a great popularity as an alternative intermediate step in the fruit preservation process [11–14]. In the OD process, the product comes into contact with a hypertonic solution of either salt or sugar. During this contact, at least two opposite directional flows start to occur simultaneously due to the concentration gradient. One of the flow is the motion of solvent (water) from the food to the hypertonic solution, and the other is the motion of solute toward the food [15]. As the process works under diffusion, this drying process can be employed at low temperatures and thus consumes less energy compared to the convective drying process [16–18]. In addition to reduced energy consumption, this method reduces the browning of food products caused by the enzymes and also enhances the color and the flavor retention [19,20] with reduced water activity [21]. OD’s mechanism is represented in terms of water loss, weight loss, and solids gain [22,23]. The system kinetics depends on the raw material characteristics and the operating conditions like solution’s temperature, exposure time, and pressure [24–27]. By manipulating the aforementioned parameters, the drying time as well as the process’s cost can be significantly reduced [28–31].
Several studies investigated the effect of different operating conditions on the OD process’s performance for fruits and vegetable storage process [24–26]. The results showed that the OD process has several benefits over the other processes, but it has one crucial limitation. A solid film of solute is produced beneath the surface during the osmotic diffusion of solute from the solution and therefore reduces the osmotic pressure. Hence the dehydration rate is reduced in the subsequent OD and drying processes. A suitable drying process with OD pretreatment is gaining more demand in the food processing industry to mitigate this limitation.
Compared to the natural or convective air-drying, vacuum drying has distinctive features such as suitability for drying heat-sensitive agricultural products. The vacuum increases the evaporation of liquid by increasing the drying driving forces for both heat and mass transfer, even at a lower temperature [32]. However, it is a slow dehydration process. Therefore, the supply of the required amount of energy for vaporizing the moisture to provide optimal drying kinetics and maintain the dried product’s quality through conduction heat transfer under vacuum can be a suitable alternative to overcome the above limitations [23,33]. Several investigators have carried out various works on the vacuum contact drying of carrot [34], vegetables [35]. All these investigations reported that the vacuum drying with conduction heat input enhances the drying rate and the product quality. Therefore, osmotically pretreated heat sensitive products followed by vacuum drying couple with conduction heat input are promising drying approaches to improve the dehydration rate without compromising the quality of the products for the osmotically pretreated heat sensitive products.
System’s modeling is a method to build a new model from the available input-output dataset. In the engineering field, this technique is called system identification. Especially, this technique has been applied in many engineering applications [36,37]. One of the modeling process’s main benefits is to be able to predict outputs at certain input conditions other than those in the experimental dataset [38,39]. The artificial neural network (ANN) model has gained wide popularity in different disciplines due to its capability to solve nonlinear problems. The main merit of using ANN models is its ability to handle multi-input multi-output systems that is missed in other artificial intelligence (AI) or statistical modeling algorithms such as Adaptive network-based Fuzzy Inference System (ANFIS) [40,41], Regression Support Vector Machine (RSVM), or Analysis of Variance (ANOVA). Another advantage of ANN over other AI methods is the transparency of identifying the relationship between the outputs and the inputs, as it can directly provide the mathematical formula that describes this relationship. ANN can also build a model from the input-output data regardless of whether this data has a linear or non-linear nature. This can be obtained by assigning nonlinear activation functions for the hidden layer neurons to transform the neurons’ inputs’ linear weighted summation to be non-linear at the neurons’ outputs. This feature is missing in the ANOVA modeling scheme, also ANOVA assumes linear relationships between the inputs and the output which is not true in all cases. Despite all the above merits of ANN, some obstacles might be encountered during ANN modeling. During the modeling phase, ANN might be exposed to over-fitting and/or increasing the computational cost [36]. Fortunately, selecting the appropriate network architecture in terms of the number of hidden layers, the number of neurons per layer, and the type of nonlinear activation function, could solve such problems.
Many researchers applied the ANNs model to explain the drying performance of many agricultural products. Rodrıguez et al. [42], used ANNs for predicting the moisture content (MC) of thyme during the convective drying process. Kaveh and Chayjan [43] also applied ANNs for predicting the Moisture ratio (MR), Drying rate (DR), specific energy consumption (SEC), and effective Diffusivity (Deff) for a fluidized bed dryer. The obtained R2 were 0.9965, 0.9730, 0.9855, 0.9932 and 0.9917 for MR, DR, SEC, and Deff, respectively. Due to the OD process’s convolution nature, the use of the ANN model to model the mass transfer kinetics that occurs in an OD process is recommended by several researchers [38,44–46]. However, there is minimal work done in applying ANN to model the OD process.
The authors found no study in the literature survey where the ANN model is applied to predict the drying performance of apple and potato samples with OD process using concentrated salt and sugar agent and vacuum contact drying with conduction heat transfer. Therefore, a combined approach involving the OD process coupled with vacuum contact drying and mathematical modeling is presented in this research. An artificial neural network is used in the modeling process for two products, i.e., apples and potatoes. This study will also contribute as a breeze of lack of knowledge between the experiment and modeling of osmotically dehydrated vacuum contact drying. Three outputs are considered in this study; Dimensionless Moisture Contents (DMC), Diffusivity (m2/s), and Mass Flux (gm/m2.s). Three inputs are considered; Drying time (minutes); Sugar solution (%), and Salt solution (%).
Fresh potatoes and apples were selected for this study. Firstly, the potatoes and apples were cut manually into cubes with a size of one cm3 each and were weighted using an electronic balance (Fisher Scientific Analytical balance, Model B-320C, Explorer OHAUS, USA, accuracy  0.01 gm). The cubes were dried for 24 hours at 105
 C, and then their weights were measured at the dried state. The initial moisture contents were 5.7 kg/kg and 4.9 kg/kg for apples and potatoes, respectively.
The osmotic solutions for this study were prepared by dissolving saturated salt and sugar solutions in distilled water.
The experimental setup consisted of a horizontal acrylic sheet drum (length 300 mm, diameter 200 mm, and thickness 5 mm), an aluminum tray ( ), a conduction heater, and a PID controller, vacuum pump, water bath, and a condenser coil. The complete setup is shown in Fig. 1. To minimize the drum’s heat loss, it was insulted carefully using Armoflex (Northeast refrigeration parts pte, Ubi cresent, Singapore). The cubic samples were placed on the tray while a conduction heater was mounted at the tray’s bottom. The PID controller (Model HT-400, Fuzhou Canwell, Fujian, China) was used for temperature control and hence controlling the heat flux from the heater to the samples through the aluminum tray. A vacuum pressure condition up to −760 mmHg inside the drum was created by using a vacuum pump (Model D-76227, Haake, Kansas city, Germany). To ensure proper sealing, two different diameters ‘O’-ring were used along with a flange at both sides of the heating chamber. The air coming out from the chamber is circulated through a condenser where the coolant was circulated from a water bath (Model D-76227, Galileotp, Scandicci city, Italy) to maintain a preset 3
 C temperature. Ethylene Glycol was used as the coolant.
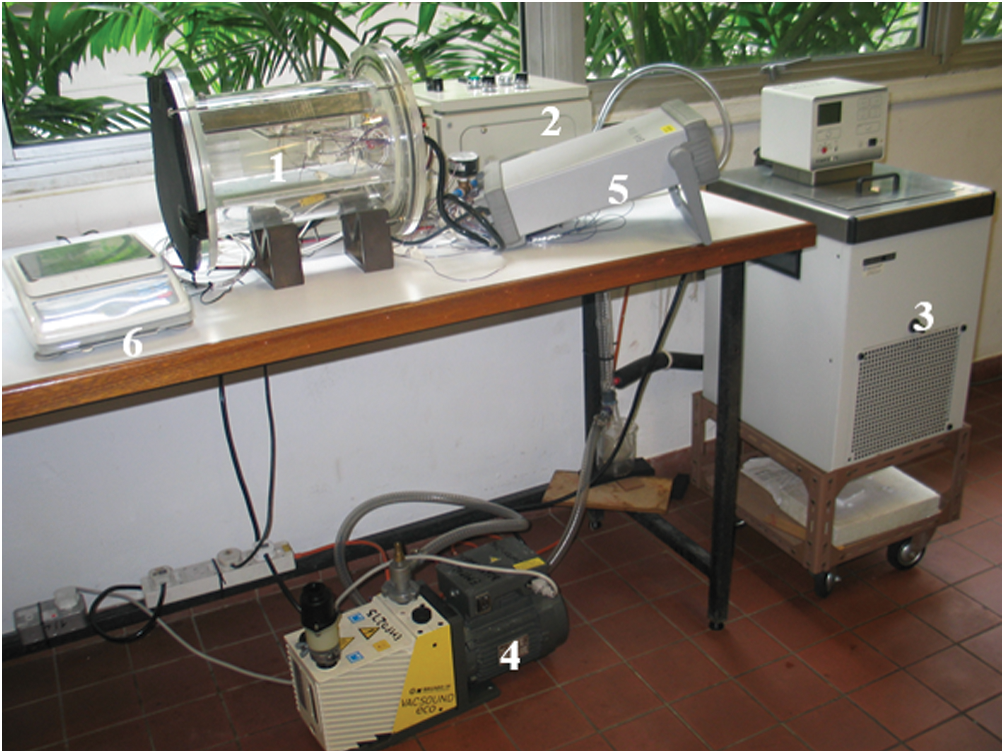
Figure 1: Vibrating bed with multimode heat input vacuum dryer and associate units, (1) Drying chamber, (2) Pid controller (3) Ethylene glycol bath, (4) Vacuum pump, (5) Hp data logger, (6) Weighing scale
A series of experiments were performed with the previously prepared potato and apple samples under various drying conditions. To avoid enzymatic browning, samples were soaked separately in a 5% sodium bicarbonate solution for 1 minute. After that, the osmotic dehydration (OD) process was carried out. The OD process was conducted in a beaker filled with osmotic solutions of fully concentrated glucose and sucrose agent at a solution temperature of about 27 C. Samples were soaked for one hour in both concentrated salt and sugar solutions. The samples were then weighted to measure the amount of moisture removed by the osmotic process. Then, the samples were bone dried by keeping them inside the oven for 24 hours. The dryer was prepared to the required drying condition before conducting each experiment. After that, the chamber was sealed, and the pressure was reduced to −760 mmHg (gauge pressure) with the help of the vacuum pump. The uncertainty for experimental moisture content was found to be within
  0.25%. The reproducibility of the experiments was within
  5%. During the first hour of each experiment, at every 10 minutes interval, the sample was taken out and weighted. In the second hour, the interval was increased to 20 minutes and then to 30 minutes for the rest of the experiments.
2.5 Water Content Determination
The oven method was used to determine the water content of the samples. The samples were taken out at a regular interval and dried in the oven (Model D-91126, Memmert, Germany) for 24 hours at 105 C until a constant weight was reached.
For osmotic dehydration, water loss (WL)was calculated as follows:

where Mo: Initial mass of the material (g); Md: Initial bone-dry mass of the sample material (g); Mt: Mass of the sample at t time (g); Mtd: Bone-dry mass of the sample at time t (g) during the osmotic dehydration process.
Dry basis moisture content is obtained relative to bone dry mass using Eq. (2) (Kuitche et al. 2007):

3.2.1 Moisture Ratio/Dimensionless Moisture Content
During the drying process, the change of the sample’s moisture contents is expressed by the moisture ratio which is calculated by Eq. (3) (Therdthai and Zhou 2009).

where the Mt, Mo, and Me represent spontaneous, initial, and equilibrium moisture content, respectively.
3.2.2 Effective Moisture Diffusivity
For a spherical sample, the diffusion of moisture is described by Eq. (4) as given below (Geroge and Maroulis 2001):

The first term of Eq. (4) was used in this case and yielded Eq. (5):


where K is the slope in the semi-log plot.
Therefore, effective moisture diffusivity, Deff, can be defined from the slope K, using Eq. (7):

4 Modelling Based on Artificial Neural Network (ANN)
The human brain contains billions of neural cells, namely neurons. Each of these neurons represents a single as well as a simple arithmetical unit. The neural cell receives input from the preceding unit and produces an output to the next unit through the cell’s dendrite and synapse, respectively. The neuron usually receives input signals from many neurons and produces an output signal to many others interconnected neurons as well. Each input signal has its associated weight based on the synaptic strength between the two neurons. The cell provides an output as long as the weighted inputs accumulate through an activation function. This function saturates its output as long as its input reaches a certain threshold. In 1943, McCulloch and Pitts’ natural neuron has been mathematically modeled to form the primary artificial neuron as shown in Fig. 2a [47]. This model is well known as Perceptron and its output is formulated as in Eqs. (8) and (9):


where, uk: The accumulated weighted inputs; yk: The output of the kth neuron;  : The jth synaptic weight of the kth neuron; xj: The jth input; bk: The constant bias of the kth neuron;
  : The activation function.

Figure 2: (a) Nonlinear model of a neuron, labeled k, (b) Architectural graph of a multilayer perceptron with two hidden layers
“Divide and Conquer” is a method to divide a big and complex system into many but small subsystems which are easy to handle and simple to solve. With the same analogy but with a reverse viewpoint, many simple processing units can be grouped together to formulate and model a big and complex model. Based on this idea, the perceptron can be structured in a network form to be able to model complex and nonlinear systems. This network produces a multi-layer perceptron artificial neural network (MLPANN) or simply ANN. The most popular ANN architecture is the feed-forward type as shown in Fig. 2b [48]. Usually, the network shows a layered form with the first and last layers assigned for the inputs and outputs. The hidden layers are located between the first and last layers. Despite the number of hidden layers and the number of neurons per hidden layer plays vital roles in the ANN model’s performance, neither this nor that could be specified in a deterministic way. Based on the “no-free-lunch” principle, the best numbers are often identified by a trial and error method as they are problem-dependent. The training of the feed-forward ANN is usually done through a supervised learning process. The learning phase aims to find the best (optimal) values of the synaptic weights that minimize the mean-squared-errors (MSE) between the real output and ANN response. The back-propagation algorithm is the popular ANN’s training method. It starts by passing the inputs with an initial weights’ vector from the input layer up to the output layer through all the hidden layers in a feed-forward pass. Then, it calculates the MSE between the actual and predicted outputs. It updated the inputs’ weights to the output layer based on minimizing the MSE of this layer. Afterward, the hidden layers are updated consequently in a backward way with the same strategy and so on until it updates the input layer weights. This process is repeated accordingly for a certain number of epochs until the error is minimized.
5.1 Optimum Drying Condition for Vacuum Contact Drying
The variation of moisture content vs time for various drying conditions is plotted in Fig. 3. The moisture content after 240 minutes of drying and without vacuum was found 0.44 while with vacuum and conduction heating at 35 C, 40
C, 40 C 55
C 55 C were found 0.25, 0.16, and 0.17, respectively. The conduction heating has apparently improved the drying rate. Fig. 3 also demonstrates that there is a small difference between the drying rate during conduction heating at 40
 C and 55
 C under vacuum. It can be considered that the optimum condition for drying is achieved at 40
 C, and the energy supplied at this condition is almost equal to the energy needed for the optimal evaporation of the moisture. At a higher temperature (55
 C), a part of the supplied energy is used for drying while the rest is lost. Hence, the conduction at 40
 C under vacuum was considered as the optimum drying condition for the subsequent performance analysis.

Figure 3: Dimensionless moisture content with time for different drying condition of untreated potato slices (vacuum: −760 mm hg)
5.2 Osmotic Pretreatment and Dehydration
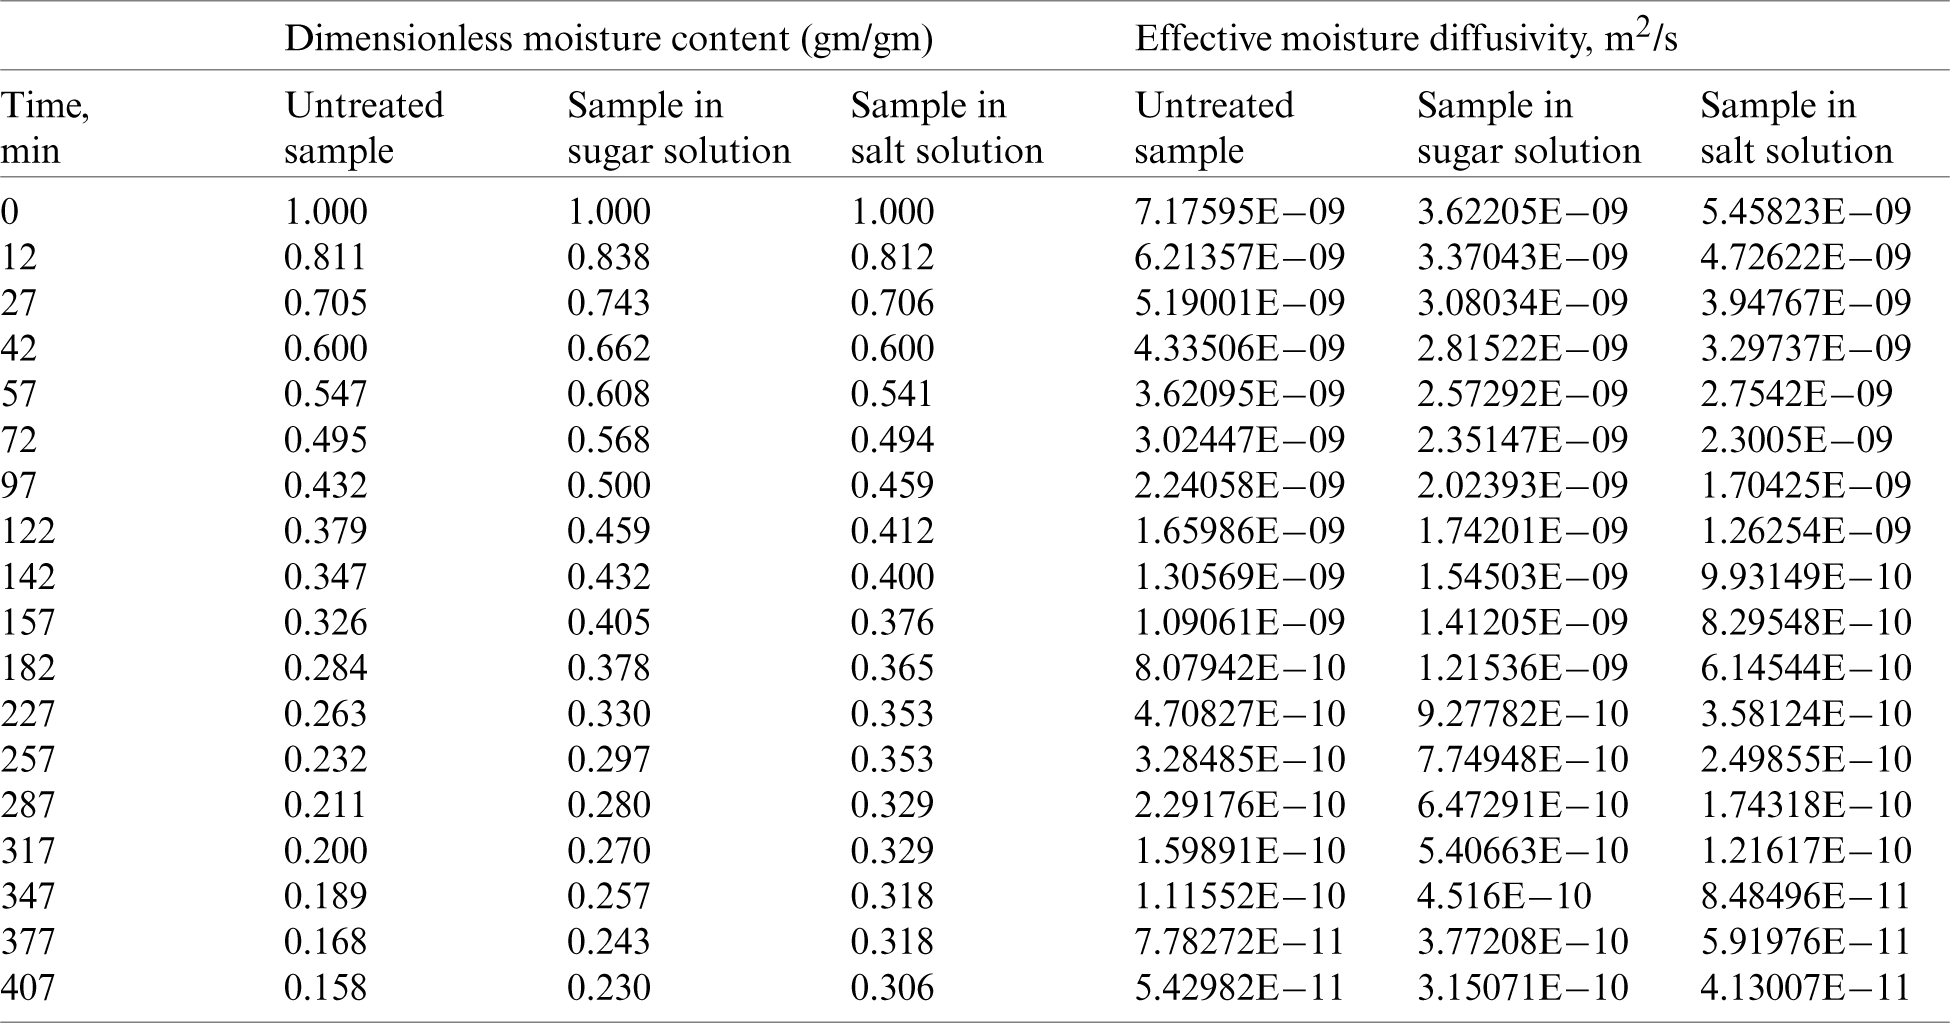
Tab. 1. shows the effect of osmotic pretreatment (using concentrated sugar and salt separately) of apple sample on its drying rate under vacuum and heat conduction when they are applied simultaneously. Results show that the apple cube’s higher drying rate is pretreated with sugar solution than the salt solution. After 410 minutes of vacuum drying, the dimensionless moisture contents of the untreated, pretreated with sugar solution and pretreated with salt solution samples were found to be 0.027, 0.129, and 0.152, respectively, from the same initial dimensionless moisture content of 1. The reason for obtaining higher moisture contents for the sugar and salt pretreated samples than those untreated samples could be related to the inhibition of water molecule diffusion by the sugar and salt precipitation inside the product. This can be more clearly understood from the results of moisture diffusivity in Tab. 1. The moisture diffusivity decreased to 6.04561E −11, 6.36548E −11 and 4.20129E −11 for the untreated, pretreated in sugar and pretreated in salt solutions, respectively, after 410 minutes of vacuum drying. Similar results are obtained for the potato samples as presented in Tab. 2.
Table 1: Effect of osmotic pretreatment of apple sample on dimensionless moisture content and moisture diffusivity with time for potato sample at −760 mmHg and conduction 40 C
C
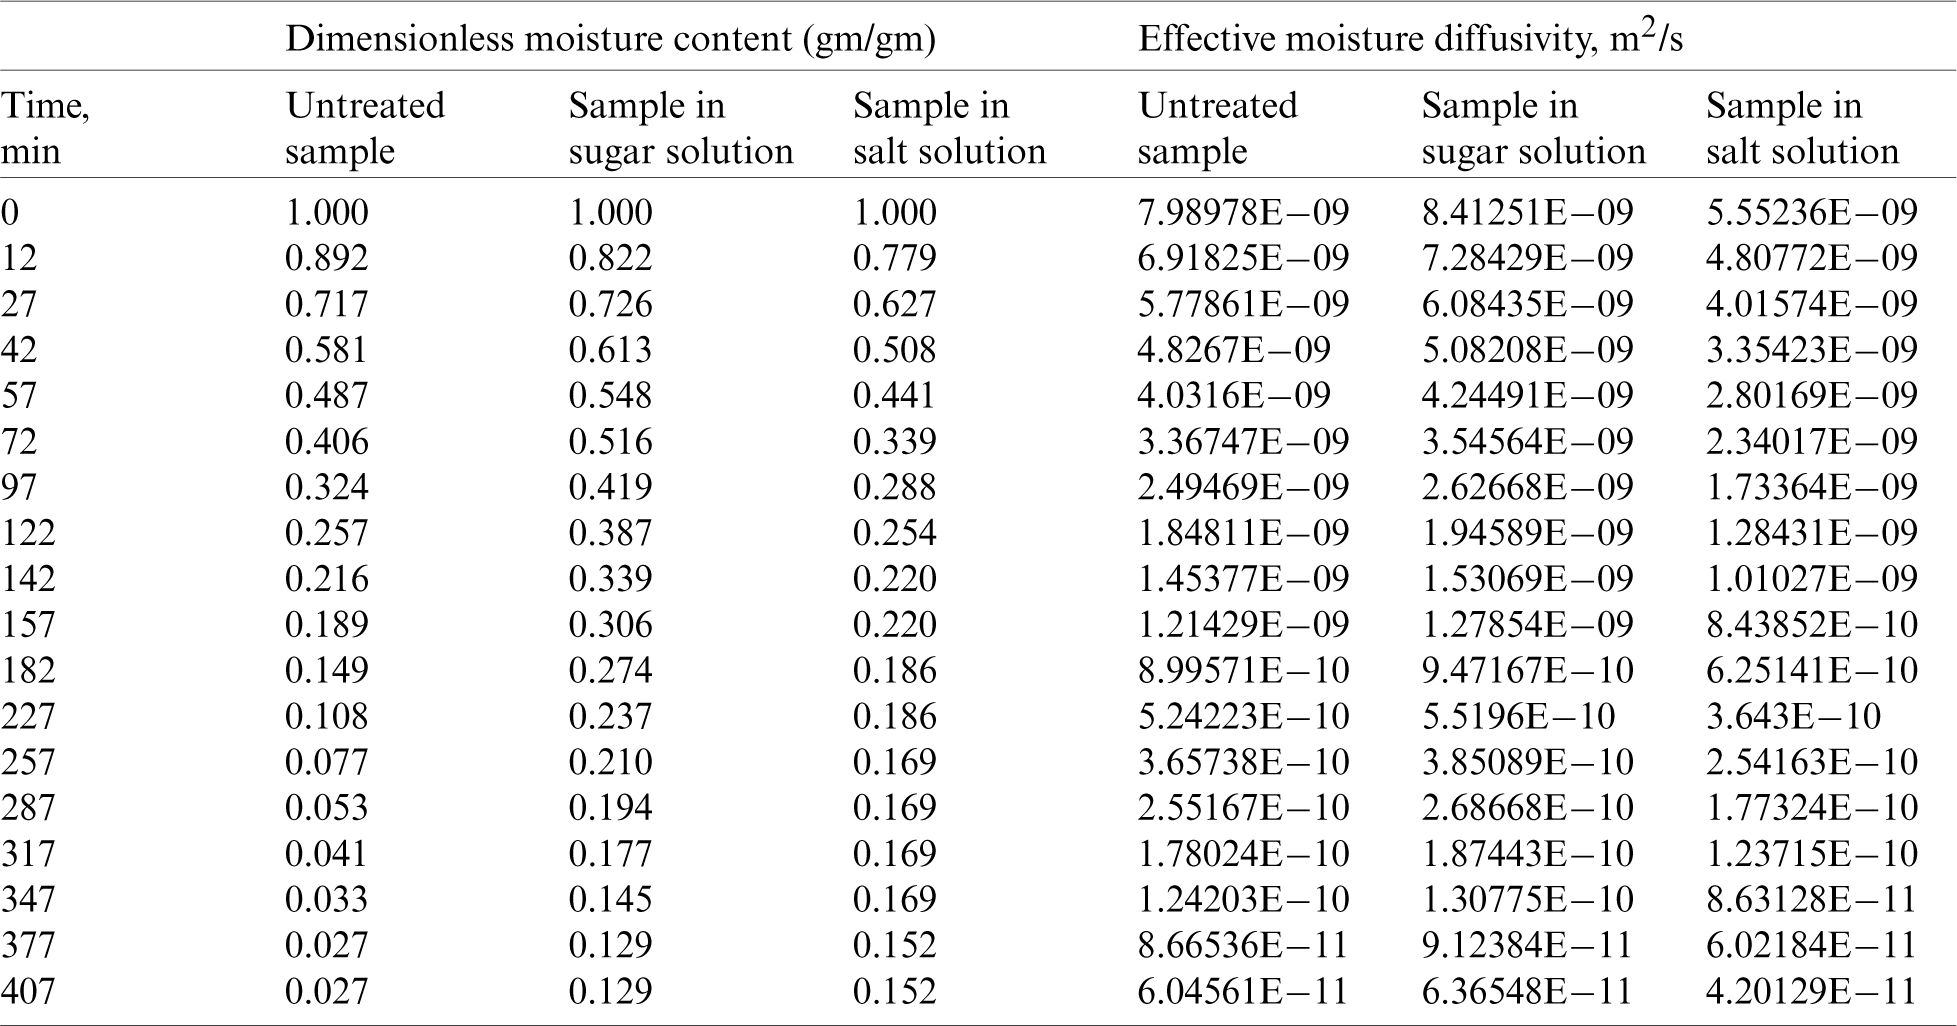
Table 2: Effect of osmotic pretreatment of potato sample on dimensionless moisture content and moisture diffusivity with time for potato sample at −760 mmHg and conduction  C
C
The mass flux variation plots with time for the apple and potato samples that were treated with different osmotic agents at −760 mmHg and 40 C (conduction temperature) are shown in Fig. 4. Initially, a sharp decrease in the mass flux was observed for all samples of both apple and potato. Generally, higher values of mass flux were observed in all test samples up to the corresponding drying time of about 72 mins. This could be due to the lowering of the boiling point by the vacuum inside the chamber. At a lower boiling point, relatively lower conduction heat is sufficient to transfer the cube temperature to the boiling point, and thus increasing the evaporation rate. No constant rate period was observed even in the early drying stages.

Figure 4: (a) Variation of mass flux with time for different osmotic agent treatments for apple sample at −760 mmHg and conduction 40 C; (b) Variation of mass flux with time for different osmotic agent treatments for potato sample at −760 mmHg and conduction 40
 C
C
This indicates that there is either no or negligible moisture content on the surface. The mass flux values of the untreated and treated samples with salt and sugar solutions were found to be of 0.00013 gm/m2-sec, 0.00012 gm/m2-sec and 0.0005 gm/m2-sec, respectively, at a drying time of 72 mins. These results illustrate that the sample treated with sugar solution shows higher mass flux than the untreated one or even the one treated with the salt solution. This matches with the previous findings.
Based on the experimental data set, an ANN model has been created for each product. Two products; the apple and potato are considered. The number of experimental samples is 18 for each product. The model contains three outputs: Dimensionless moisture contents, diffusivity, and mass flux. Whereas the number of inputs is three; drying time; sugar solution, and salt solution. The experiential data samples have been utilized to build two models: one model for each product. Each model has a feed-forward structure with activation functions of ‘tansig’ and ‘linear’ for the hidden and the output layers, respectively. In modeling using ANN, there are many challenging factors influencing the model’s performance. These factors include the training to testing data ratio, the number of hidden layers and the number of neurons per layer; the last two factors define network architecture. Until now and up to the knowledge of the authors, there is no rule of thumb to determine these numbers in the last two factors. However, these numbers should be as minimum as possible to minimize the computational cost. But at the same time, it’s a compromise between this cost and the model’s performance. On the other hand, the number of testing samples should be as maximum as possible to trust the model’s response. The network has been trained with a random set that contains 70% of the data samples. Then, to overcome the problem of training over-fitting, the model is tested with the remaining 30% samples. Therefore, twelve samples are selected randomly for training and the rest six samples are used for testing. The model’s learning process is continued until a minimum Mean-Squared Error is reached. The ANN structure has been studied at different numbers of hidden layers as well as at different numbers of neurons per layer. It is found that one hidden layer is not able to reach acceptable performance. Therefore, after many trials, the best network architecture of both models is found to follow the sequence [3 5 5 3]. This vector shows that it is a 3-input 3-output network and contains 2 hidden layers with 5 neurons in each layer. The network is trained using the back-propagation learning algorithm for 100 epochs. All training and testing phases are implemented using Matlab R2019b codes and functions. The performances of the two models are evaluated using a set of statistical metrics such as the MSE, Root MSE (RMSE), and R2. The values of the resulting statistical indices for the apple and potato models are presented in Tabs. 3 and 4, respectively. For the apple’s model, the minimum RMSE values are 0.0261, 0.0349 and 0.0406 respectively for DMC, diffusivity, and mass flux. Whereas the best coefficients of correlation values are 0.9909, 0.9867 and 0.9744, respectively for DMC, diffusivity and mass flux as shown in Tab. 3.
Table 3: The performance marker values of the apple model
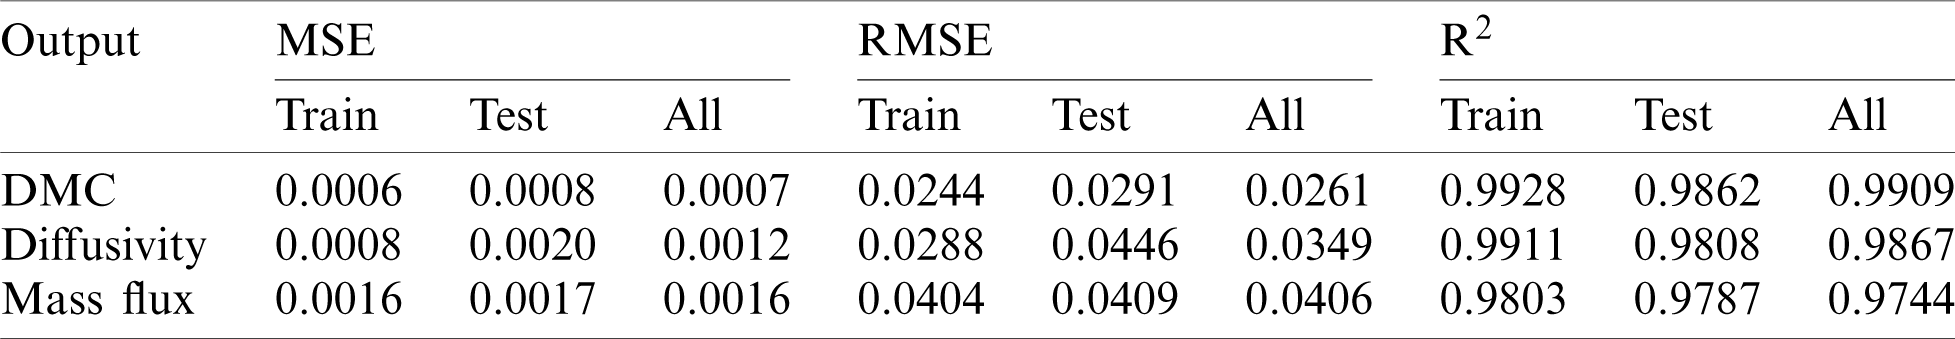
Table 4: The performance marker values of the potato model
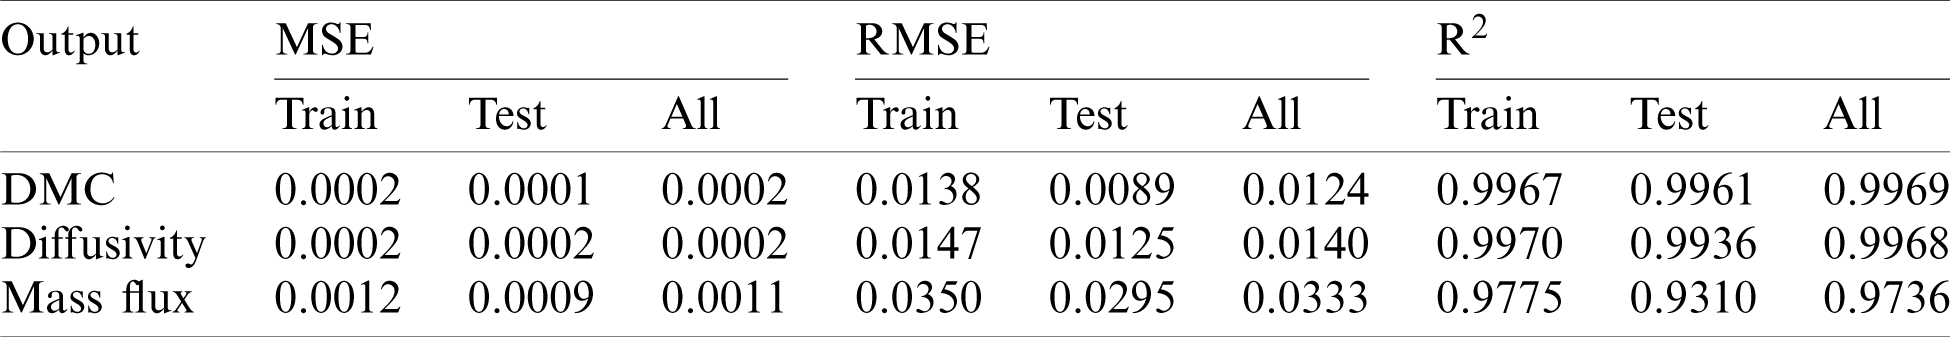
As presented in Tab. 4, the minimum RMSE values are found to be 0.0124, 0.0140 and 0.0333, respectively for DMC, diffusivity, and mass flux for the potato model. Whereas the best coefficients of correlation values are observed to be of 0.9969, 0.9968, and 0.9736, respectively, for DMC, diffusivity, and mass flux.
The small values of MSE and the high values of R2 for both models for the training samples prove that the models are trained well. Furthermore, these markers attain the same status for the testing samples, which implies that the models did not fall into the over-fitting problem.
The performance curves that illustrate the model’s behavior during the training phase are also plotted. Figs. 5 and 6 show these curves for the apple and potato models, respectively. For both models, the training phase is terminated at an epoch number, which is less than 100. From the figures, it can be noticed that the regression curves are very close to the experimental data. This will reinforce the models’ prediction accuracy for future or unseen data.

Figure 5: The training performance curves of the apple ANN model (a) validation performance (b) regression curve of DMC (c) regression curve of diffusivity (d) regression curve of mass flux
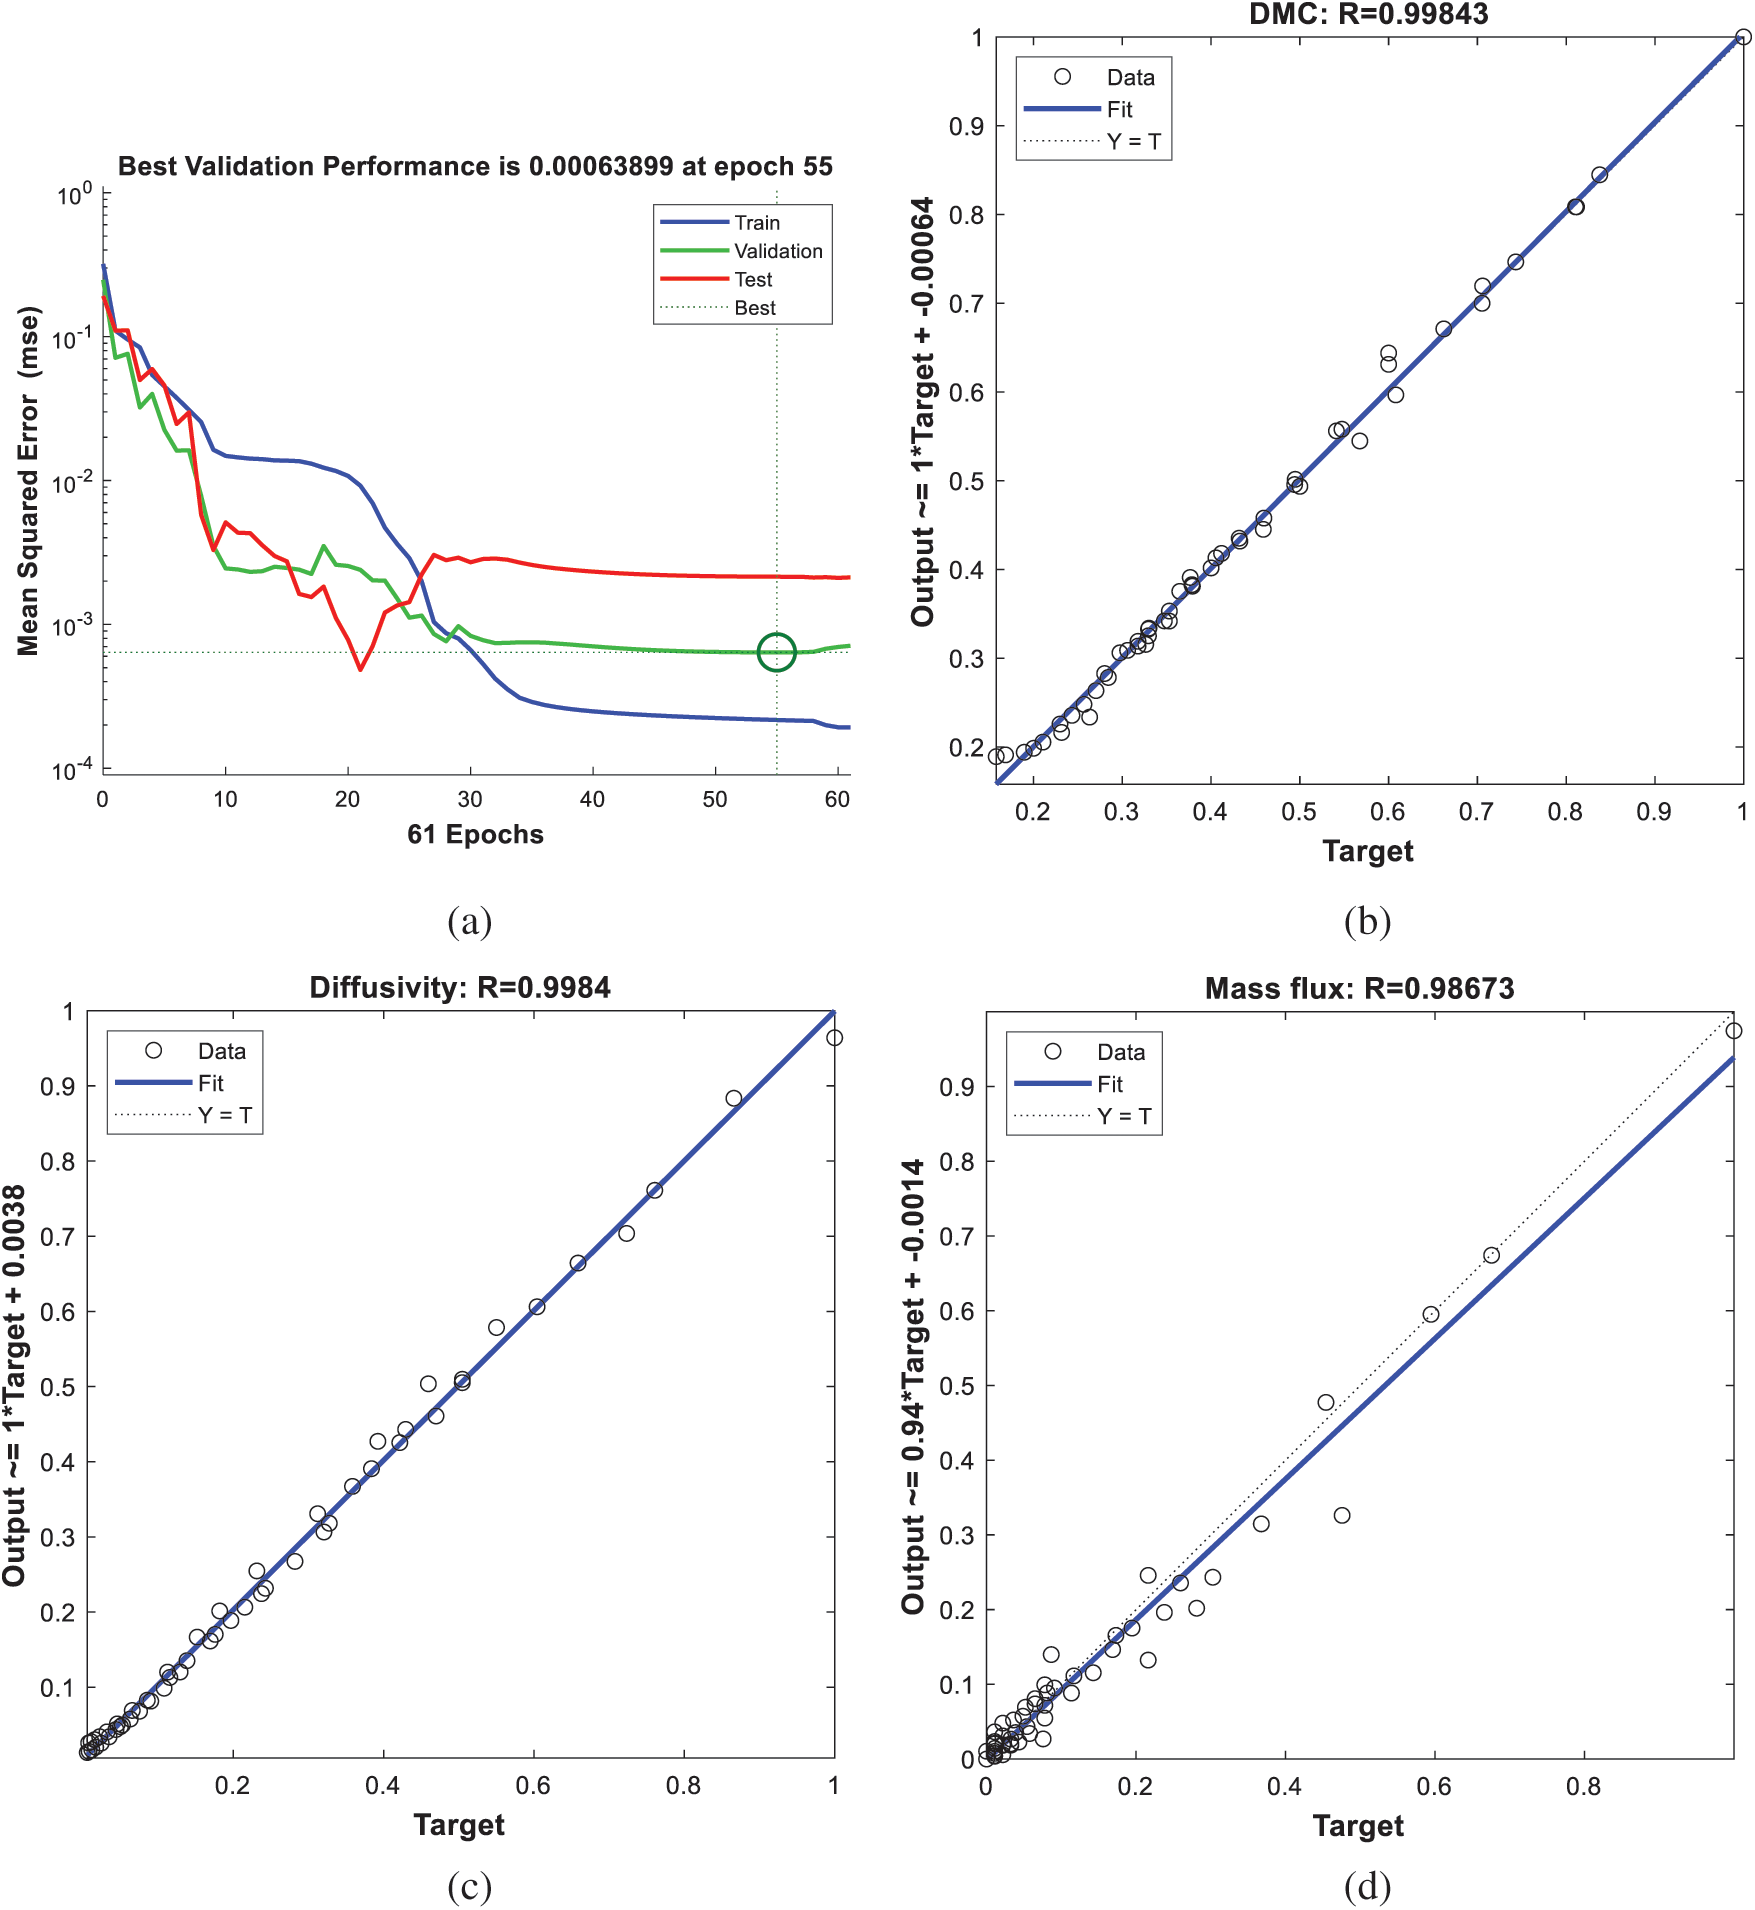
Figure 6: The training performance curves of the potato ANN model (a) validation performance (b) regression curve of DMC (c) regression curve of diffusivity (d) regression curve of mass flux
After confirming that both the ANN models of the apple and potato have been well built, the predictions for the training, testing, and whole data are then plotted. Figs. 7 and 8 shows the ANN models’ performance vs. the experimental data for potato and apple. The plots support the models’ prediction accuracy for all subsets where the model tracks the experimental data with minimum error and good agreement. Therefore, the resulting ANN models can be considered general models to predict the DMC, diffusivity, and mass flux subject to the drying time and the sugar and salt solution percentages are available.

Figure 7: The training, testing and whole data predictions of the ANN models vs. the experimental data for Apple
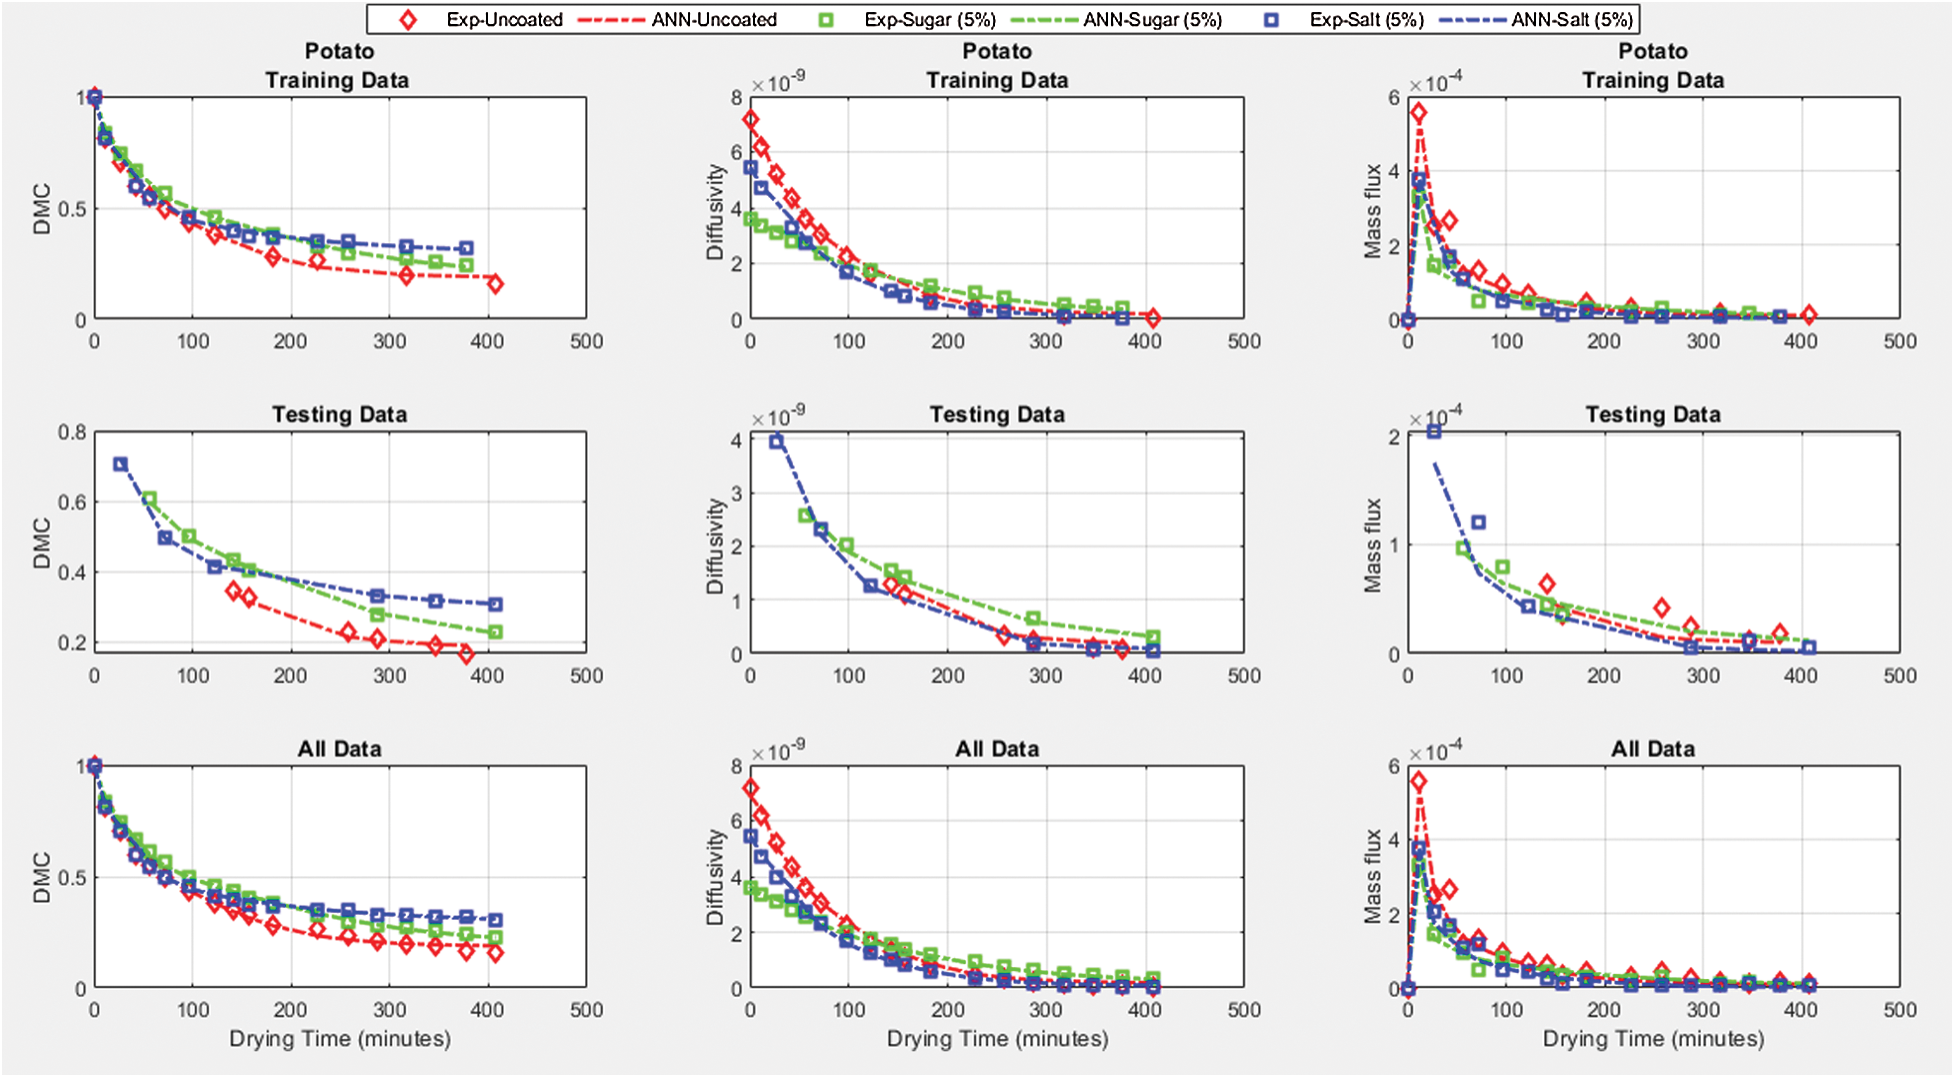
Figure 8: The training, testing, and whole data predictions of the ANN models vs. the experimental data for Potato
In this study, modeling dehydration characteristics of osmotically treated heat-sensitive potato and apple products in vacuum contact dryers using an efficient Artificial Intelligent tool such as the Artificial Neural Networks (ANN) was carried out. Drying experiments were conducted on the untreated sample under a vacuum couple with different conduction heat input. Conduction heat input at 40 C under vacuum demonstrated the optimum drying condition. For osmotic rehydration, samples were treated using concentrated salt and sugar solution before drying. Three different operating parameters were considered that dominate the drying performance such as dimensionless moisture content (DMC), effective moisture diffusivity, and mass flux. The osmotic dehydration process found that sugar solution is more effective than the salt solution to remove initial moisture content for both potato and apple samples. Results on the drying characteristics determined that the samples treated with sugar solution also showed the higher drying performance in terms of all three parameters. Furthermore, the apple sample exhibited a faster moisture removal rate than the potato sample under the same operating conditions and treatment process. In this study, the ANN modeling strategy was deployed to evaluate the performance of osmotic dehydration during vacuum contact drying. Using the experimental dataset, a robust artificial neural network (ANN) model was constructed for each product. Dimensionless moisture contents (DMC), diffusivity, and mass flux were the outputs of the ANN model while the drying time, and the percentages of sugar and salt solutions were examined as the inputs. From both the ANN model’s learning and testing processes, the average MSE and RMSE between the predicted and experimental values were reasonably low, and the average R2 values were relatively high. For the ANN apple model, the best-predicted correlation coefficient (R2) for DMC, diffusivity, and mass flux values were obtained as 0.9909, 0.9867, and 0.9744, respectively. Whereas, for the ANN potato model, the highest-predicted coefficient (R2) for DMC, diffusivity, and mass flux values were found to be 0.9969, 0.9968, and 0.9736, respectively. Accordingly, there is a good agreement between the experimental dataset and the proposed models. In conclusion, the developed ANN model appears to be suitable and efficient for predicting the drying performance during the OD process under vacuum contact drying.
Funding Statement: The authors received no specific funding for this study.
Conflicts of Interest: The authors declare that they have no conflicts of interest to report regarding the present study.
1. K. Elsaid, M. Kamil, E. T. Sayed, M. A. Abdelkareem, T. Wilberforce et al. (2020). , “Environmental impact of desalination technologies: A review,” Science of the Total Environment, vol. 748, pp. 141528. [Google Scholar]
2. K. Elsaid, E. T. Sayed, M. A. Abdelkareem, A. Baroutaji and A. G. Olabi. (2020). “Environmental impact of desalination processes: Mitigation and control strategies,” Science of the Total Environment, vol. 740, pp. 140125. [Google Scholar]
3. T. Wilberforce, A. G. Olabi, E. T. Sayed, K. Elsaid and M. A. Abdelkareem. (2020). “Progress in carbon capture technologies,” in Science of the Total Environment, pp. 143203. [Google Scholar]
4. T. Salameh, M. A. Abdelkareem, A. G. Olabi, E. T. Sayed and M. Al-Chaderchi. (2020). “Integrated standalone hybrid solar PV, fuel cell and diesel generator power system for battery or supercapacitor storage systems in Khorfakkan, United Arab Emirates,” International Journal of Hydrogen Energy, in press. [Google Scholar]
5. A. G. Olabi, T. Wilberforce, E. T. Sayed, K. Elsaid, H. Rezk et al. (2020). , “Recent progress of graphene based nanomaterials in bioelectrochemical systems,” Science of the Total Environment, vol. 749, pp. 141225. [Google Scholar]
6. M. A. Abdelkareem, M. El Haj Assad, E. T. Sayed and B. Soudan. (2018). “Recent progress in the use of renewable energy sources to power water desalination plants,” Desalination, vol. 435, pp. 97–113. [Google Scholar]
7. E. T. Sayed, N. Shehata, M. A. Abdelkareem and M. A. Atieh. (2020). “Recent progress in environmentally friendly bio-electrochemical devices for simultaneous water desalination and wastewater treatment,” Science of the Total Environment, vol. 748, pp. 141046. [Google Scholar]
8. M. A. Ershov, E. V. Grigorieva, T. M. Abdellatief, V. M. Kapustin, M. A. Abdelkareem et al. (2020). , “Hybrid low-carbon high-octane oxygenated gasoline based on low-octane hydrocarbon fractions,” Science of the Total Environment, vol. 756, pp. 142715. [Google Scholar]
9. A. G. Olabi, T. Wilberforce and M. A. Abdelkareem. (2021). “Fuel cell application in the automotive industry and future perspective,” Energy, vol. 214, pp. 118955. [Google Scholar]
10. N. Nimmanpipug, N. Therdthai and P. Dhamvithee. (2013). “Characterisation of osmotically dehydrated papaya with further hot air drying and microwave vacuum drying,” International Journal of Food Science & Technology, vol. 48, no. 6, pp. 1193–1200. [Google Scholar]
11. J. Alakali, C. Ariahu and N. Nkpa. (2006). “Kinetics of osmotic dehydration of mango,” Journal of Food Processing and Preservation, vol. 30, no. 5, pp. 597–607. [Google Scholar]
12. D. G. Alves, J. L. Barbosa Jr, G. C. Antonio and F. E. X. Murr. (2005). “Osmotic dehydration of acerola fruit (Malpighia punicifolia L.),” Journal of Food Engineering, vol. 68, no. 1, pp. 99–103. [Google Scholar]
13. H. Mujica-Paz, A. Valdez-Fragoso, A. López-Malo, E. Palou and J. Welti-Chanes. (2003). “Impregnation and osmotic dehydration of some fruits: Effect of the vacuum pressure and syrup concentration,” Journal of Food Engineering, vol. 57, no. 4, pp. 305–314. [Google Scholar]
14. G. Sacchetti, A. Gianotti and M. Dalla Rosa. (2001). “Sucrose-salt combined effects on mass transfer kinetics and product acceptability. Study on apple osmotic treatments,” Journal of Food Engineering, vol. 49, no. 2–3, pp. 163–173. [Google Scholar]
15. P. M. Azoubel and F. E. X. Murr. (2004). “Mass transfer kinetics of osmotic dehydration of cherry tomato,” Journal of Food Engineering, vol. 61, no. 3, pp. 291–295. [Google Scholar]
16. I. Ahmed, I. M. Qazi and S. Jamal. (2016). “Developments in osmotic dehydration technique for the preservation of fruits and vegetables,” Innovative Food Science & Emerging Technologies, vol. 34, pp. 29–43. [Google Scholar]
17. S. Bakalis and V. T. Karathanos. (2005). “Study of rehydration of osmotically pretreated dried fruit samples,” Drying technology, vol. 23, no. 3, pp. 533–549. [Google Scholar]
18. M. B. Uddin, P. Ainsworth and Ş. İbanoğlu. (2004). “Evaluation of mass exchange during osmotic dehydration of carrots using response surface methodology,” Journal of Food Engineering, vol. 65, no. 4, pp. 473–477. [Google Scholar]
19. S. Md Atiqure Rahman, M. Enamul Hoque, S. Rahman and M. Mahbubur Rahman. (2017). “A Novel Vortex Tube-Assisted Atmospheric Freeze-Drying System: Effect of Osmotic Pretreatment on Biological Products,” Journal of Food Process Engineering, vol. 40, no. 3, pp. e12449. [Google Scholar]
20. E. I. Salazar-López, M. Jiménez, R. Salazar and E. Azuara. (2015). “Incorporation of microcapsules in pineapple intercellular tissue using osmotic dehydration and microencapsulation method,” Food and Bioprocess Technology, vol. 8, no. 8, pp. 1699–1706. [Google Scholar]
21. J. L. Corrêa, L. M. Pereira, G. S. Vieira and M. D. Hubinger. (2010). “Mass transfer kinetics of pulsed vacuum osmotic dehydration of guavas,” Journal of Food Engineering, vol. 96, no. 4, pp. 498–504. [Google Scholar]
22. K. O. Falade, J. C. Igbeka and F. A. Ayanwuyi. (2007). “Kinetics of mass transfer, and colour changes during osmotic dehydration of watermelon,” Journal of Food Engineering, vol. 80, no. 3, pp. 979–985. [Google Scholar]
23. Q. G. Hu, M. Zhang, A. S. Mujumdar, G. N. Xiao and S. Jin-cai. (2006). “Drying of edamames by hot air and vacuum microwave combination,” Journal of Food Engineering, vol. 77, no. 4, pp. 977–982. [Google Scholar]
24. I. Mandala, E. Anagnostaras and C. Oikonomou. (2005). “Influence of osmotic dehydration conditions on apple air-drying kinetics and their quality characteristics,” Journal of Food Engineering, vol. 69, no. 3, pp. 307–316. [Google Scholar]
25. P. P. Lewicki and R. Porzecka-Pawlak. (2005). “Effect of osmotic dewatering on apple tissue structure,” Journal of Food Engineering, vol. 66, no. 1, pp. 43–50. [Google Scholar]
26. L. Segui, P. Fito, A. Albors and P. Fito. (2006). “Mass transfer phenomena during the osmotic dehydration of apple isolated protoplasts (Malus domestica var Fuji),” Journal of Food Engineering, vol. 77, no. 1, pp. 179–187. [Google Scholar]
27. S. Kanagaratnam, M. E. Hoque, M. M. Sahri and A. Spowage. (2013). “Investigating the effect of deforming temperature on the oil-binding capacity of palm oil based shortening,” Journal of Food Engineering, vol. 118, no. 1, pp. 90–99. [Google Scholar]
28. Y. Deng and Y. Zhao. (2008). “Effect of pulsed vacuum and ultrasound osmopretreatments on glass transition temperature, texture, microstructure and calcium penetration of dried apples (Fuji),” LWT-Food Science and Technology, vol. 41, no. 9, pp. 1575–1585. [Google Scholar]
29. J. Garcia-Noguera, F. I. Oliveira, M. I. Gallão, C. L. Weller, S. Rodrigues et al. (2010). , “Ultrasound-assisted osmotic dehydration of strawberries: Effect of pretreatment time and ultrasonic frequency,” Drying Technology, vol. 28, no. 2, pp. 294–303. [Google Scholar]
30. S. Kek, N. Chin and Y. Yusof. (2013). “Direct and indirect power ultrasound assisted pre-osmotic treatments in convective drying of guava slices,” Food and Bioproducts Processing, vol. 91, no. 4, pp. 495–506. [Google Scholar]
31. S. Kowalski and D. Mierzwa. (2013). “Influence of osmotic pretreatment on kinetics of convective drying and quality of apples,” Drying technology, vol. 31, no. 15, pp. 1849–1855. [Google Scholar]
32. S. S. Grossel. (2005). “A review of: Guide to industrial drying: principles, equipment and new developments (2004),” Drying Technology, vol. 23, no. 5, pp. 1151–1152. [Google Scholar]
33. K. V. T. Land. (2002). Advanced Drying Technologies, New York: Marcel Dekker, pp. 258, ; T. Kudra and A. S. Mujumdar, Organic Process Research and Development, vol. 7, pp. 438, 2003. [Google Scholar]
34. Z. W. Cui, S. Y. Xu, D. W. Sun and W. Chen. (2005). “Temperature changes during microwave-vacuum drying of sliced carrots,” Drying Technology, vol. 23, no. 5, pp. 1057–1074. [Google Scholar]
35. P. Yaghmaee and T. Durance. (2007). “Efficacy of vacuum microwave drying in microbial decontamination of dried vegetables,” Drying Technology, vol. 25, no. 6, pp. 1099–1104. [Google Scholar]
36. A. M. Nassef, A. M. Fathy, E. T. Sayed, M. A. Abdelkareem, H. Rezk et al. (2019). , “Maximizing SOFC performance through optimal parameters identification by modern optimization algorithms,” Renewable Energy, vol. 138, pp. 458–464. [Google Scholar]
37. M. B. Özdemir, M. Aktaş, S. Şevik and A. Khanlari. (2017). “Modeling of a convective-infrared kiwifruit drying process,” International Journal of Hydrogen Energy, vol. 42, no. 28, pp. 18005–18013. [Google Scholar]
38. S. Rahman, A. M. Nassef, M. Al-Dhaifallah, M. A. Abdelkareem and H. Rezk. (2020). “The Effect of a New Coating on the Drying Performance of Fruit and Vegetables Products: Experimental Investigation and Artificial Neural Network Modeling,” Foods, vol. 9, no. 3, pp. 308. [Google Scholar]
39. A. M. Nassef, S. M. A. Rahman, H. Rezk and Z. Said. (2020). “ANFIS-Based Modelling and Optimal Operating Parameter Determination to Enhance Cocoa Beans Drying-Rate,” IEEE Access, vol. 8, pp. 45964–45973. [Google Scholar]
40. A. M. Nassef, H. Rezk, M. A. Abdelkareem, A. Alaswad and A. Olabi. (2019). “Application of fuzzy modelling and Particle Swarm Optimization to enhance lipid extraction from microalgae,” Sustainable Energy Technologies and Assessments, vol. 35, pp. 73–79. [Google Scholar]
41. B. A. A. Yousef, H. Rezk, M. A. Abdelkareem, A. G. Olabi and A. M. Nassef. (2020). “Fuzzy modeling and particle swarm optimization for determining the optimal operating parameters to enhance the bio-methanol production from sugar cane bagasse,” International Journal of Energy Research, vol. 44, no. 11, pp. 8964–8973. [Google Scholar]
42. J. Rodríguez, G. Clemente, N. Sanjuán and J. Bon. (2014). “Modelling drying kinetics of thyme (Thymus vulgaris L.Theoretical and empirical models, and neural networks,” Food science and technology international, vol. 20, no. 1, pp. 13–22. [Google Scholar]
43. M. Kaveh and R. A. Chayjan. (2015). “Mathematical and neural network modelling of terebinth fruit under fluidized bed drying,” Research in Agricultural Engineering, vol. 61, no. 2, pp. 55–65. [Google Scholar]
44. M. Azadbakht, M. V. Torshizi, F. Noshad and A. Rokhbin. (2018). “Application of artificial neural network method for prediction of osmotic pretreatment based on the energy and exergy analyses in microwave drying of orange slices,” Energy, vol. 165, pp. 836–845. [Google Scholar]
45. J. P. Maran, V. Sivakumar, K. Thirugnanasambandham and R. Sridhar. (2013). “Artificial neural network and response surface methodology modeling in mass transfer parameters predictions during osmotic dehydration of Carica papaya L,” Alexandria Engineering Journal, vol. 52, no. 3, pp. 507–516. [Google Scholar]
46. S. Lertworasirikul and S. Saetan. (2010). “Artificial neural network modeling of mass transfer during osmotic dehydration of kaffir lime peel,” Journal of Food Engineering, vol. 98, no. 2, pp. 214–223. [Google Scholar]
47. S. Herculano-Houzel. (2009). “The human brain in numbers: A linearly scaled-up primate brain,” Frontiers in human neuroscience, vol. 3, pp. 31. [Google Scholar]
48. S. S. Haykin. (2009). Neural networks and learning machines/Simon Haykin. New York: Prentice Hall. [Google Scholar]
 | This work is licensed under a Creative Commons Attribution 4.0 International License, which permits unrestricted use, distribution, and reproduction in any medium, provided the original work is properly cited. |