DOI:10.32604/cmc.2021.014922
| Computers, Materials & Continua DOI:10.32604/cmc.2021.014922 | |
| Article |
Computing the User Experience via Big Data Analysis: A Case of Uber Services
1Department of Interaction Science/Department of Human-Artificial Intelligence Interaction, Sungkyunkwan University, Seoul, 03063, Korea
2Department of Applied Artificial Intelligence/Department of Human-Artificial Intelligence Interaction, Sungkyunkwan University, Seoul, 03063, Korea
*Corresponding Author: Dongyan Nan. Email: ndyzxy0926@skku.edu
Received: 27 October 2020; Accepted: 01 January 2021
Abstract: As of 2020, the issue of user satisfaction has generated a significant amount of interest. Therefore, we employ a big data approach for exploring user satisfaction among Uber users. We develop a research model of user satisfaction by expanding the list of user experience (UX) elements (i.e., pragmatic, expectation confirmation, hedonic, and burden) by including more elements, namely: risk, cost, promotion, anxiety, sadness, and anger. Subsequently, we collect 125,768 comments from online reviews of Uber services and perform a sentiment analysis to extract the UX elements. The results of a regression analysis reveal the following: hedonic, promotion, and pragmatic significantly and positively affect user satisfaction, while burden, cost, and risk have a substantial negative influence. However, the influence of expectation confirmation on user satisfaction is not supported. Moreover, sadness, anxiety, and anger are positively related to the perceived risk of users. Compared with sadness and anxiety, anger has a more important role in increasing the perceived burden of users. Based on these findings, we also provide some theoretical implications for future UX literature and some core suggestions related to establishing strategies for Uber and similar services. The proposed big data approach may be utilized in other UX studies in the future.
Keywords: User satisfaction; user experience; big data; sentiment analysis; Uber
Founded in 2009, Uber Technologies, Inc. aimed to improve the efficiency of taxi services in major cities in the United States [1]. Suggesting the “sharing economy” model as a solution, the company has quickly emerged as a major innovative disruptor of the traditional transportation market [2]. However, Uber is no longer a maverick of the market. Operating in 700 cities across 84 countries [3], the estimated value of the company has surpassed 70 billion dollars, thus far the highest value for a privately owned technology company in the world [1]. Furthermore, the sharing economy model has now become a new norm [1].
Following Uber, similar business models were introduced in different parts of the world, such as DiDi in China, Grab in South East Asia, and Ola in India [1]. Although these services are also growing, owing to their strength in the local context, Uber continues to reign as the global market leader. Moreover, along with its rapid growth in size and value, Uber is further developing its business model. The company is now expanding to new domains such as delivery services. Additionally, Uber is investing in innovative technologies such as autonomous vehicles [1].
As a technology company, Uber has made several attempts to advance its service using data science and machine learning approaches. However, these have mostly focused on the technical aspects of the service, such as estimating the consumer surplus [4], while only limited efforts have been made to understand the user experience (UX) of Uber services. From the perspective of a service provider, analyzing the UX elements and enhancing user satisfaction are vital for providing a successful service [5–7]. Therefore, UX elements can be useful for establishing business strategies and operations.
An effective way of examining UX is the analysis of online reviews made by users. According to Jang et al. [8], analyzing user-oriented datasets can serve as the basis for improving certain services or products. Among the different kinds of user-oriented datasets, online reviews are easily accessible and reveal various perceptions and feelings toward a service or product [7,8]. Consequently, we attempt to compute user satisfaction from UX elements using large-scale online review datasets of Uber.
2.1 Prior Research on Uber and Similar Services
As of 2020, several researchers have attempted to explore the contribution of UX or user perceptions toward the diffusion of Uber and similar services. Min et al. [9] proposed a model for Uber by integrating the technology acceptance model and innovation diffusion theory. They collected data from 336 Uber users and demonstrated that relative advantage and compatibility notably influenced the intentions of people to use Uber via usefulness and ease of use. Lee et al. [10] examined survey data from 295 participants by using structural equal modeling and indicated that perceived benefit, risk, trust, and platform quality considerably affected the intentions of individuals to adopt Uber. By computing validated data from 443 responses, Ma et al. [11] revealed that perceived physical risk and trust in the driver notably affected the intention of an individual to discontinue the use of DiDi. Guo et al. [12] examined data from 307 samples and concluded that the intention to use DiDi could be determined based on institutional and calculative-based trusts.
Most of the studies based on Uber and similar services have explored UX by analyzing a limited (fewer than 1,000) number of samples. Thus, in the context of Uber services, we attempt to use a big data approach to explore user satisfaction, which may be strongly related to the continuance intention and loyalty of an individual [13–16]. The proposed big data approach aims to address the limitations of the prior studies on Uber and similar services.
2.2 Satisfaction and UX Elements
We interpret the term “satisfaction” as the post-assessment by an individual of the overall experience of using Uber services [8,13]. Jang et al. [8] reported that individual satisfaction was influenced by several UX elements (i.e., pragmatic, hedonic, burden, and expectation confirmation). Consequently, we attempt to utilize UX elements for predicting the user satisfaction with Uber services.
We conceptualize “pragmatic” as the evaluation by a user regarding the level of usefulness and ease of use of Uber services [8]. Some studies have demonstrated that pragmatic is notably related to user satisfaction with specific products and services [7,8]. That is, satisfaction among users will increase if they feel that utilizing certain services is beneficial and does not require considerable effort [13,17,18]. Hence, we hypothesize the following relation:
H1: Pragmatic is significantly related to satisfaction with Uber services.
2.2.2 Expectation Confirmation
We interpret “expectation confirmation” as the degree to which the performance of the Uber service meets user expectations [8,19]. Several researchers have noted a connection between expectation confirmation and user satisfaction in various domains [7,8]. As implied by the expectation–confirmation theory, users are satisfied with services when they feel that the experience of using the services meets their expectations [13]. Thus, we hypothesize the following:
H2: Expectation confirmation is notably related to satisfaction with Uber services.
We define “hedonic” as the degree of pleasantness of using Uber services [8]. Several scholars have indicated that perceived hedonic is critical for determining the satisfaction of an individual when using certain products and services [8,20]. Therefore, we hypothesize the following:
H3: Hedonic is notably related to satisfaction with Uber services.
We define “burden” as the degree to which users think that using Uber services can lead to negative emotions [8,21]. Several user-oriented studies have reported that user satisfaction is negatively influenced by the perceived burden [7,8]. Previous studies [8,22,23] found that anxiety, anger, and sadness were dimensions of the perceived burden. Thus, negative emotions, such as anxiety, anger, and sadness, among users may notably influence the perceived burden. Accordingly, with respect to Uber services, we hypothesize the following:
H4: Burden is significantly related to satisfaction with Uber services.
H4-1: Anxiety is significantly related to burden.
H4-2: Anger is significantly related to burden.
H4-3: Sadness is significantly related to burden.
2.3 Extending UX Elements to Risk, Cost, and Promotion
To understand user satisfaction more comprehensively, we introduced additional predictors (i.e., risk, cost, and promotion), which were considered important to the research models used in earlier studies on UX [24–26].
We interpret “risk” as the degree to which users feel apprehensive of the negative consequences of using Uber services [27]. Several scholars have suggested that the perception of risk be addressed when exploring the UX of services or systems [10,24]. If individuals feel that utilizing specific services will induce negative outcomes, they may develop a negative perspective of using the services. Accordingly, a relationship between risk and user satisfaction has been validated in previous studies [28,29]. Moreover, several researchers have reported that negative emotions (and the consequent feelings) among users toward using a particular service would result in a high perceived risk [30,31]. This is because individuals who experience negative emotions (e.g., anxiety) tend to perceive an ambiguous stimulus as a threat or risk [30,32]. In the same vein, Lin [31] confirmed a link between negative emotions (e.g., anger and sadness) and risk, using results from 1,000 questionnaires. Consequently, we hypothesize the following:
H5: Risk is significantly related to satisfaction with Uber services.
H5-1: Anxiety is significantly related to risk.
H5-2: Anger is significantly related to risk.
H5-3: Sadness is significantly related to risk.
Park [25] suggested that economic concerns be considered when exploring UX, because a user tends to compare products or services in terms of their potential benefits and costs. We define “cost” as the concern associated with the economic costs of utilizing Uber services [33,34].
The notable effect of cost on user satisfaction was verified in several user-oriented studies. Park [35] analyzed survey data from South Korea and concluded that perceived cost had a negative influence on user satisfaction with airline services. Based on data from 288 Taobao users, Zhu et al. [36] demonstrated that perceived cost was crucial in influencing user satisfaction. Therefore, we hypothesize the following:
H6: Cost is notably related to satisfaction with Uber services.
Buil et al. [26] identified “promotion” as an important element that could increase brand awareness and accelerate the diffusion of certain products and services. In other words, companies can attract public attention by launching promotional offers such as coupons, discounts, and free gifts. We conceptualize “promotion” as the degree to which individuals think they can obtain rewards by using the Uber service [37].
Several researchers have demonstrated a significant impact of promotion on the satisfaction of an individual with various services [37,38]. For instance, with respect to mobile catering applications, Wang et al. [37] reported, based on 196 responses, that perceived promotions have an influence on the level of satisfaction of an individual. Accordingly, we hypothesize the following relation:
H7: Promotion is notably related to satisfaction with Uber services.
Based on the abovementioned hypotheses, a model for examining user satisfaction with Uber services was constructed (Fig. 1).
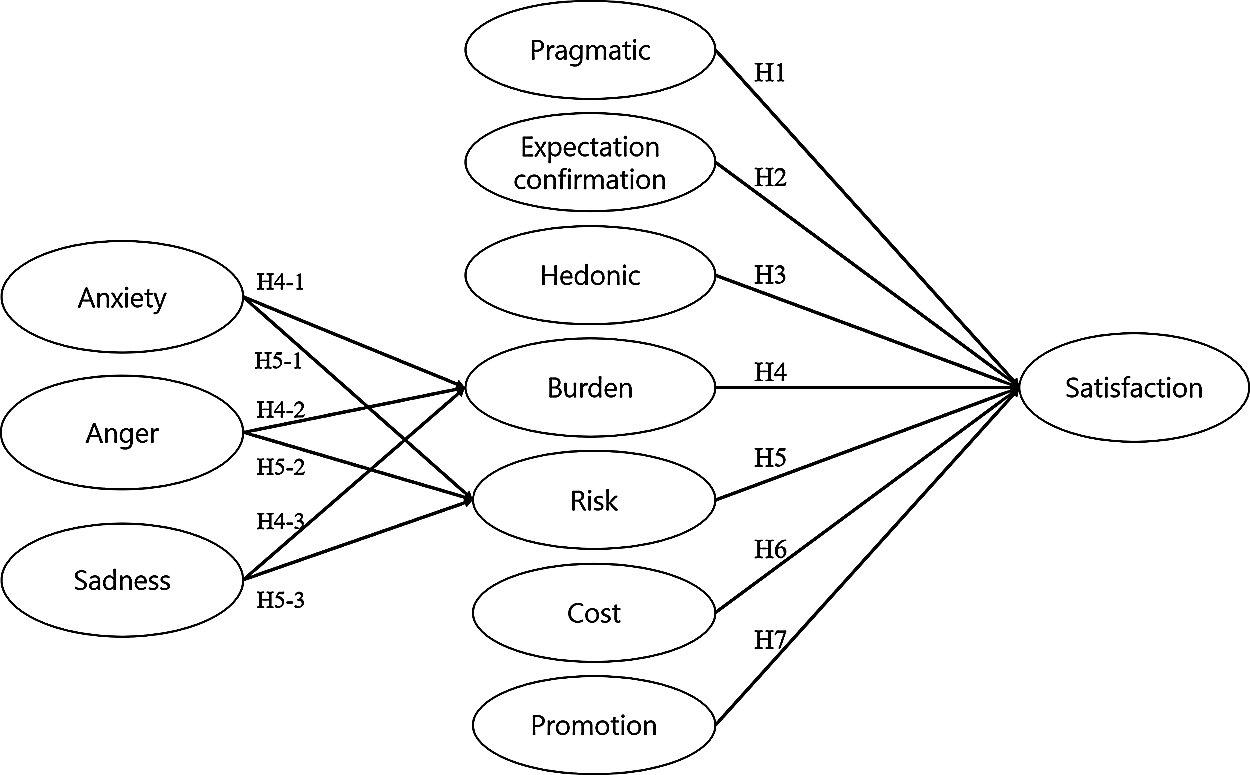
Figure 1: Proposed model
We collected 125,768 comments from online textual reviews on Google Play Store (reviews that contained only numerical ratings without text were excluded) on the “Uber-Request a ride” application over the two-year period from September 12, 2018 to September 24, 2020.
Before data analysis, we preprocessed all the collected review data. In the linguistic inquiry and word count (LIWC) program, which was employed in this study, reviews including stopwords and punctuation were used. Therefore, we focused on the tokenization and accurate lemmatization of words. First, we split the sentences to obtain accurate results via part-of-speech (POS) tagging, which helped in achieving highly accurate lemmatization. Subsequently, all the tokens were lemmatized with the drawn POS tags.
Based on earlier studies [8,39–42], we propose that employing sentiment analysis can be an effective way to investigate user perspectives on Uber services. This is because the hedonic and pragmatic dimensions of UX on certain services or products can be computed using online user reviews by performing sentiment analysis with the LIWC program [7,8,40,43].
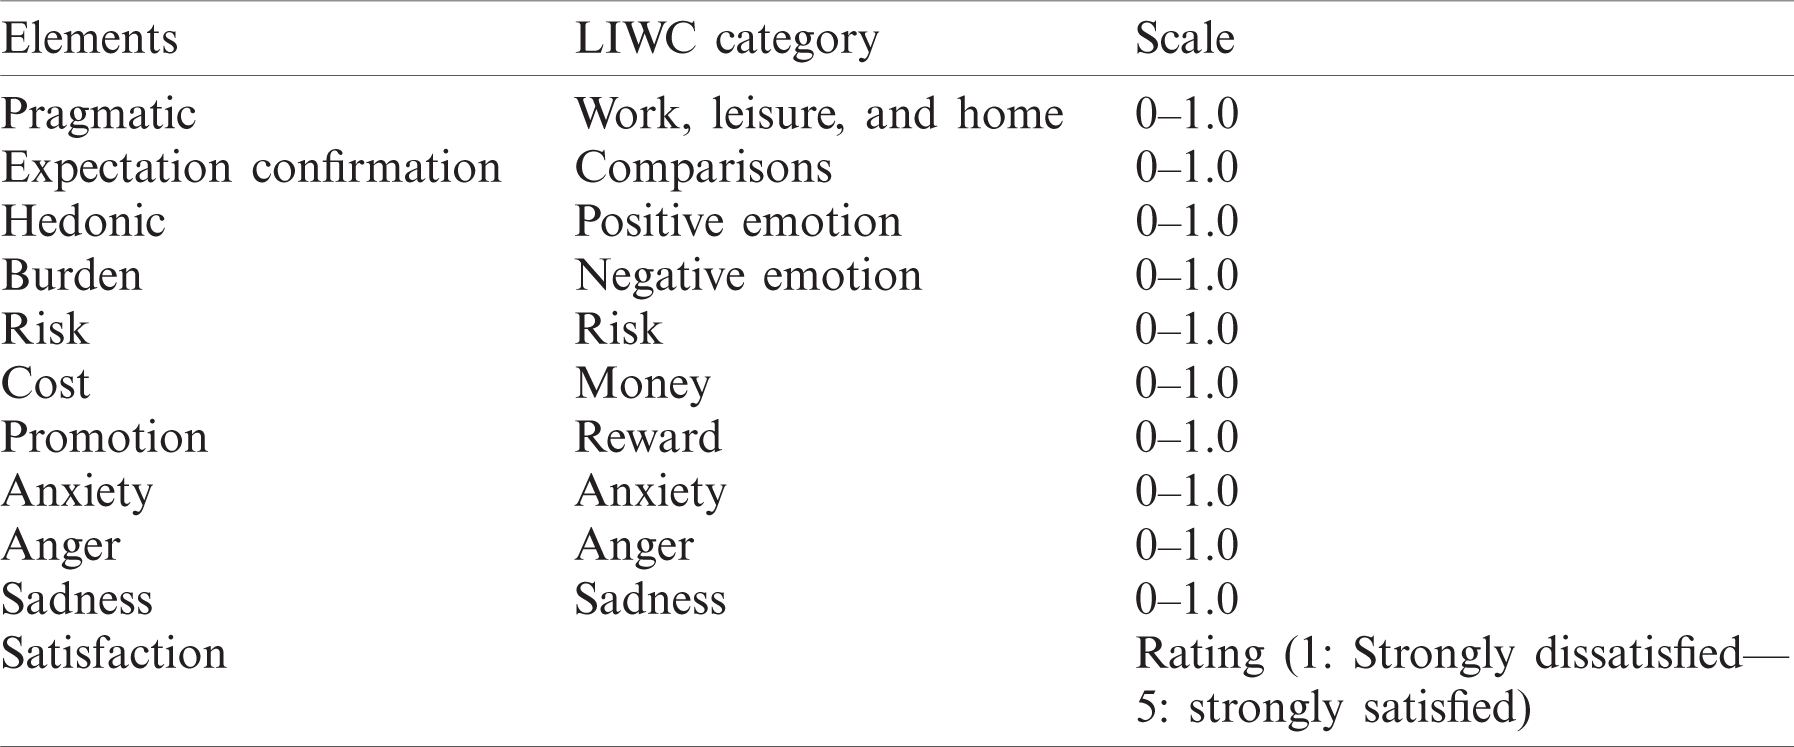
Thus, to enumerate cognition-related statements and words, we utilized the LIWC program to perform sentiment analysis on the preprocessed online reviews [22,23,44]. Subsequently, the results of the sentiment analysis were categorized based on the classification guidelines of UX elements from prior studies [7,8]. Accordingly, we used LIWC categories to measure pragmatic, hedonic, burden, expectation confirmation, risk, cost, promotion, anxiety, anger, and sadness. Assuming that the rating score represents the degree of user satisfaction with specific products or services, the user satisfaction with Uber services was measured by the rating score from the reviews [8,45]. The measurement details are presented in Tab. 1.
Table 1: Outline of the measurements
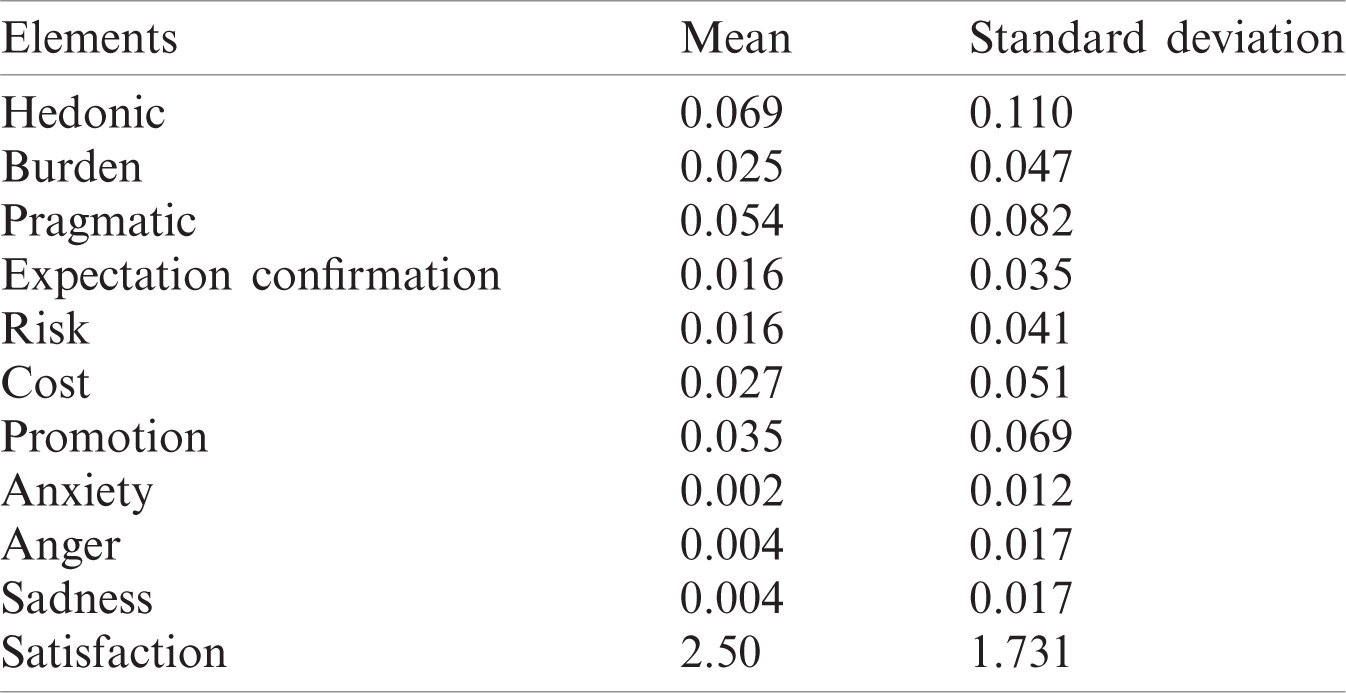
The results of the descriptive analysis are presented in Tab. 2.
Table 2: Descriptive information of the elements
We performed a regression analysis to test our hypotheses. To detect multicollinearity in the research model, variance inflation factor (VIF) values were computed. As all the VIF values were considerably less than 10, we confirmed that any multicollinearity is minimal [46], thereby validating the research model.
We found that user satisfaction was notably influenced by pragmatic (H1,  ,
,  ,
,  ,
,  ), hedonic (H3,
  ,
,  ,
,  ,
,  ), burden (H4,
  ,
,  ,
,  ,
,  ), risk (H5,
  ,
,  ,
,  ,
,  ), cost (H6,
  ,
,  ,
,  ,
,  ), and promotion (H7,
  ,
,  ,
,  ,
,  ). However, a connection between expectation confirmation and satisfaction was not observed (H2,
  ,
,  ,
,  ,
,  ).
).
Furthermore, burden was significantly influenced by anxiety (H4-1,  ,
,  ,
,  ,
,  ), anger (H4-2,
  ,
,  ,
,  ,
,  ), and sadness (H4-3,
  ,
,  ,
,  ,
,  ). Also, risk was significantly affected by anxiety (H5-1,
  ,
,  ,
,  ,
,  ), anger (H5-2,
  ,
,  ,
,  ,
,  ), and sadness (H5-3,
  ,
,  ,
,  ,
,  ). The hypothesis testing results are summarized in Fig. 2.
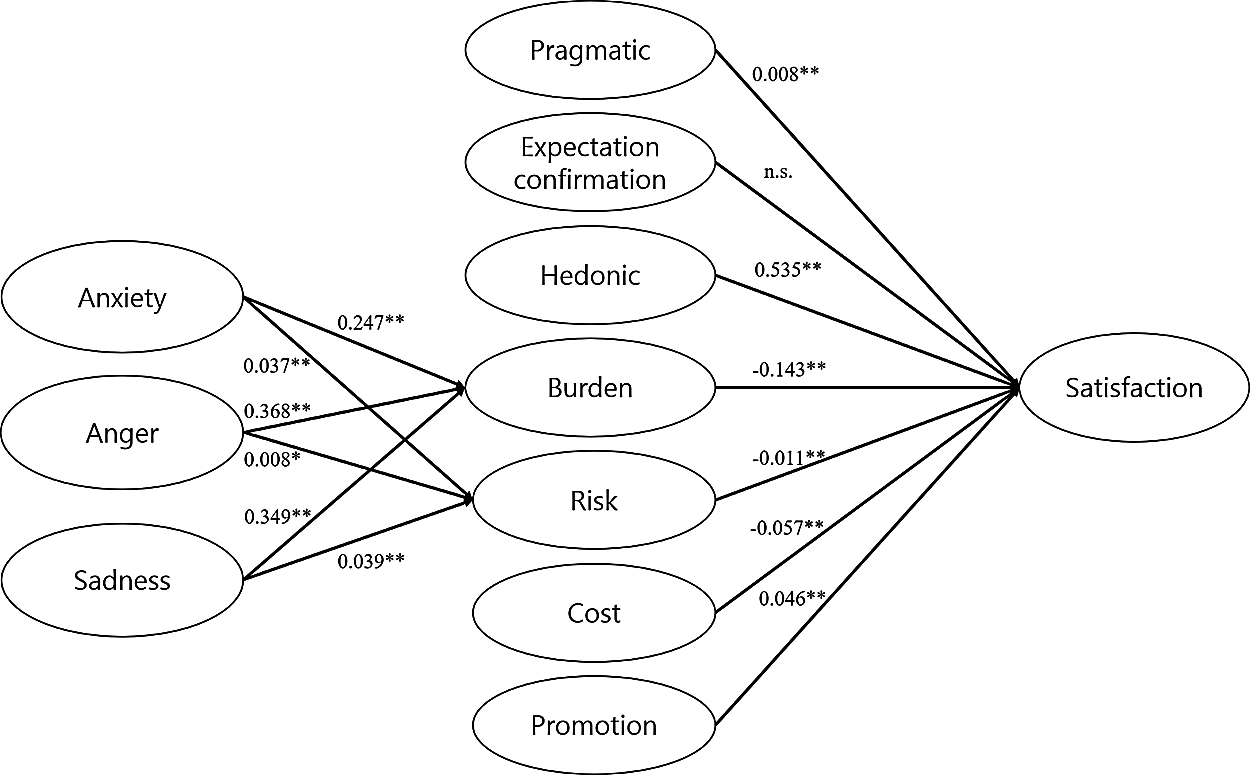
Figure 2: Testing of the hypotheses. * *: p < 0.001, *: p < 0.01
This study is one of the first attempts to investigate user satisfaction with Uber services via a big data approach. Considering that the previous studies [7,8] that used big data approaches to examine UX elements did not consider the factors of risk, cost, promotion, anxiety, sadness, and anger, the contributions of this study become highly meaningful and useful. The extended UX element framework and methodologies used in this study may be applied to explore user satisfaction with other services or products. Furthermore, the proposed approach addresses the problem of a limited number of samples or participants of most previous studies on UX [9,10,20]. We also provided several theoretical and managerial implications.
5.1 Theoretical and Practical Implications
The results of the regression analysis showed hedonic to be the most significant predictor of user satisfaction. This means that users will be satisfied when they enjoy using a service. Burden also strongly affects user satisfaction: if users feel burdened while using a service, their satisfaction will decrease. Overall, these results indicate that the positive/negative emotions of users can strongly influence their levels of satisfaction.
Both pragmatic and promotion significantly and positively influence user satisfaction. Hence, when users realize the pragmatic value of a service and receive coupons or free gifts upon using the service, their satisfaction will be enhanced.
Cost was found to exert a negative influence on user satisfaction. This indicates that if the monetary cost of using a service becomes extremely high or exceeds the expected range, the degree of satisfaction with the service may be reduced.
Risk was revealed to have a negative influence on user satisfaction, meaning that users may be dissatisfied if they perceive that using a service will induce negative outcomes.
Expectation confirmation did not considerably affect user satisfaction. However, some studies [13,25] stated that expectation confirmation tended to indirectly influence user satisfaction. Consequently, had the indirect influence of expectation confirmation been considered, the results of our study might have been different.
Burden is strongly affected by anxiety, sadness, and anger. Interestingly, anger plays a crucial role in increasing the perceived burden of users toward the service. This means that users are more likely to feel burdened and dissatisfied when they feel angry while using a service compared with times when they feel sad or anxious.
Risk can be increased by negative emotions such as anxiety, sadness, and anger. However, the impact of anger on risk is relatively small compared with that of anxiety and sadness. This means that in comparison with times when users feel angry, they are more likely to experience uncertainty about the negative outcomes of using a service when they feel anxious or sad.
In terms of practical implications, our findings can serve as guidelines for the stakeholders involved in services similar to Uber. Companies should focus on methods to increase the perceived hedonic of users and decrease the perceived burden of users. Other UX elements (e.g., pragmatic, risk, cost, and promotion) have a weak influence on user satisfaction. Thus, in the case of limited human and financial resources [20], from the perspective of UX, companies should prioritize enhancing the hedonic value of their services.
5.2 Limitations and Suggestions
This study has the following limitations, which should be addressed in further research.
First, this study did not consider other significant variables that may be related to UX. For instance, the demographic characteristics of users can notably affect their satisfaction with specific services or systems. Second, this study was conducted using review comments (data) written in the English language, and thus it can only be applied to the English-speaking users of Uber. The same research conducted in different languages may lead to different results. Hence, performing further studies on Uber users speaking different languages is suggested. Moreover, future studies could also include different car sharing services in other countries, such as DiDi, Grab, and Ola.
Funding Statement: This work was supported by a National Research Foundation of Korea (NRF) (http://nrf.re.kr/eng/index) grant funded by the Korean government (NRF-2020R1A2C1014957).
Conflicts of Interest: The authors declare that they have no conflicts of interest to report regarding the present study.
1. G. Dudley, D. Banister and T. Schwanen. (2017). “The rise of Uber and regulating the disruptive innovator,” Political Quarterly, vol. 88, no. 3, pp. 492–499. [Google Scholar]
2. S. Jiang, L. Chen, A. Mislove and C. Wilson. (2018). “On ridesharing competition and accessibility: Evidence from Uber, Lyft, and Taxi,” in Proc. of the 2018 World Wide Web Conf., Republic and Canton of Geneva, CHE, pp. 863–872. [Google Scholar]
3. K. Thelen. (2018). “Regulating Uber: The politics of the platform economy in Europe and the United States,” Perspectives on Politics, vol. 16, no. 4, pp. 938–953. [Google Scholar]
4. J. D. Hall, C. Palsson and J. Price. (2018). “Is Uber a substitute or complement for public transit?,” Journal of Urban Economics, vol. 108, pp. 36–50. [Google Scholar]
5. Z. Deng, Y. Lu, K. K. Wei and J. Zhang. (2010). “Understanding customer satisfaction and loyalty: An empirical study of mobile instant messages in China,” International Journal of Information Management, vol. 30, no. 4, pp. 289–300. [Google Scholar]
6. E. Goodman, M. Kuniavsky and A. Moed. (2013). “Observing the user experience: A practitioner’s guide to user research,” IEEE Transactions on Professional Communication, vol. 56, no. 3, pp. 260–261. [Google Scholar]
7. E. Park. (2019). “Motivations for customer revisit behavior in online review comments: Analyzing the role of user experience using big data approaches,” Journal of Retailing and Consumer Services, vol. 51, pp. 14–18. [Google Scholar]
8. J. Jang and M. Y. Yi. (2017). “Modeling user satisfaction from the extraction of user experience elements in online product reviews,” in Proc. of the 2017 CHI Conf. Extended Abstracts on Human Factors in Computing Systems, New York, NY, USA, pp. 1718–1725. [Google Scholar]
9. S. Min, K. K. F. So and M. Jeong. (2019). “Consumer adoption of the Uber mobile application: Insights from diffusion of innovation theory and technology acceptance model,” Journal of Travel & Tourism Marketing, vol. 36, no. 7, pp. 770–783. [Google Scholar]
10. Z. W. Lee, T. K. Chan, M. S. Balaji and A. Y. L. Chong. (2018). “Why people participate in the sharing economy: An empirical investigation of Uber,” Internet Research, vol. 28, no. 3, pp. 829–850. [Google Scholar]
11. L. Ma, X. Zhang, X. Ding and G. Wang. (2019). “Risk perception and intention to discontinue use of ride-hailing services in China: Taking the example of DiDi Chuxing,” Transportation Research Part F: Traffic Psychology and Behaviour, vol. 66, pp. 459–470. [Google Scholar]
12. J. Guo, J. Lin and L. Li. (2020). “Building users’ intention to participate in a sharing economy with institutional and calculative mechanisms: An empirical investigation of DiDi in China,” Information Technology for Development, pp. 1–25, . https://doi.org/10.1080/02681102.2020.1807894. [Google Scholar]
13. A. Bhattacherjee. (2001). “Understanding information systems continuance: An expectation-confirmation model,” MIS Quarterly, vol. 25, no. 3, pp. 351–370. [Google Scholar]
14. S. Y. Lam, V. Shankar, M. K. Erramilli and B. Murthy. (2004). “Customer value, satisfaction, loyalty, and switching costs: An illustration from a business-to-business service context,” Journal of the Academy of Marketing Science, vol. 32, no. 3, pp. 293–311. [Google Scholar]
15. C. H. Kwon, D. H. Jo and H. G. Mariano. (2020). “Exploring the determinants of relationship quality in retail banking services,” KSII Transactions on Internet and Information Systems, vol. 14, no. 8, pp. 3457–3472. [Google Scholar]
16. N. On, G. M. Ryu, M. J. Koh, J. R. Lee and N. G. Kim. (2020). “An empirical study on the intention to reuse computational science and engineering platforms: A case study of EDISON,” KSII Transactions on Internet and Information Systems, vol. 14, no. 8, pp. 3437–3456. [Google Scholar]
17. F. D. Davis. (1989). “Perceived usefulness, perceived ease of use, and user acceptance of information technology,” MIS Quarterly, vol. 13, no. 3, pp. 319–340. [Google Scholar]
18. Y. J. Joo, H. J. So and N. H. Kim. (2018). “Examination of relationships among students’ self-determination, technology acceptance, satisfaction, and continuance intention to use K-MOOCs,” Computers & Education, vol. 122, pp. 260–272. [Google Scholar]
19. C. L. Hsu and J. C. C. Lin. (2015). “What drives purchase intention for paid mobile apps?—An expectation confirmation model with perceived value,” Electronic Commerce Research and Applications, vol. 14, no. 1, pp. 46–57. [Google Scholar]
20. D. Nan, Y. Kim, M. H. Park and J. H. Kim. (2020). “What motivates users to keep using social mobile payments?,” Sustainability, vol. 12, no. 17, pp. 678. [Google Scholar]
21. H. Suh, N. Shahriaree, E. B. Hekler and J. A. Kientz. (2016). “Developing and validating the user burden scale: A tool for assessing user burden in computing systems,” in Proc. of the 2016 CHI Conf. on Human Factors in Computing Systems, New York, NY, USA, pp. 3988–3999. [Google Scholar]
22. Y. R. Tausczik and J. W. Pennebaker. (2010). “The psychological meaning of words: LIWC and computerized text analysis methods,” Journal of Language and Social Psychology, vol. 29, no. 1, pp. 24–54. [Google Scholar]
23. J. W. Pennebaker, R. L. Boyd, K. Jordan and K. Blackburn. (2015). “The development and psychometric properties of LIWC2015,” . [Online]. Available: http://hdl.handle.net/2152/31333. [Google Scholar]
24. J. Yi, G. Yuan and C. Yoo. (2020). “The effect of the perceived risk on the adoption of the sharing economy in the tourism industry: The case of Airbnb,” Information Processing & Management, vol. 57, no. 1, pp. 102108. [Google Scholar]
25. E. Park. (2020). “User acceptance of smart wearable devices: An expectation-confirmation model approach,” Telematics and Informatics, vol. 47, pp. 101318. [Google Scholar]
26. I. Buil, L. De Chernatony and E. Martínez. (2013). “Examining the role of advertising and sales promotions in brand equity creation,” Journal of Business Research, vol. 66, no. 1, pp. 115–122. [Google Scholar]
27. C. Phonthanukitithaworn, C. Sellitto and M. W. L. Fong. (2015). “User intentions to adopt mobile payment services: A study of early adopters in Thailand,” Journal of Internet Banking and Commerce, vol. 20, no. 1, pp. 1–29. [Google Scholar]
28. A. K. Kar. (2020). “What affects usage satisfaction in mobile payments? modelling user generated content to develop the “digital service usage satisfaction model,” Information Systems Frontiers, pp. 1–21, . https://doi.org/10.1007/s10796-020-10045-0. [Google Scholar]
29. Y. Chen, X. Yan, W. Fan and M. Gordon. (2015). “The joint moderating role of trust propensity and gender on consumers’ online shopping behavior,” Computers in Human Behavior, vol. 43, pp. 272–283. [Google Scholar]
30. H. Sang and J. Cheng. (2020). “Effects of perceived risk and patient anxiety on intention to use community healthcare services in a big modern city,” SAGE Open, vol. 10, no. 2, pp. 2158244020933604. [Google Scholar]
31. W. B. Lin. (2008). “Investigation on the model of consumers’ perceived risk—Integrated viewpoint,” Expert Systems with Applications, vol. 34, no. 2, pp. 977–988. [Google Scholar]
32. N. Derakshan and M. W. Eysenck. (1997). “Interpretive biases for one’s own behavior and physiology in high-trait-anxious individuals and repressors,” Journal of Personality and Social Psychology, vol. 73, no. 4, pp. 816–825. [Google Scholar]
33. T. T. T. Pham and J. C. Ho. (2015). “The effects of product-related, personal-related factors and attractiveness of alternatives on consumer adoption of NFC-based mobile payments,” Technology in Society, vol. 43, pp. 159–172. [Google Scholar]
34. D. H. Shin. (2009). “Determinants of customer acceptance of multi-service network: An implication for IP-based technologies,” Information & Management, vol. 46, no. 1, pp. 16–22. [Google Scholar]
35. E. Park. (2019). “The role of satisfaction on customer reuse to airline services: An application of big data approaches,” Journal of Retailing and Consumer Services, vol. 47, pp. 370–374. [Google Scholar]
36. D. H. Zhu, Y. P. Chang and A. Chang. (2015). “Effects of free gifts with purchase on online purchase satisfaction,” Internet Research, vol. 25, no. 5, pp. 690–706. [Google Scholar]
37. Y. S. Wang, T. H. Tseng, W. T. Wang, Y. W. Shih and P. Y. Chan. (2019). “Developing and validating a mobile catering app success model,” International Journal of Hospitality Management, vol. 77, pp. 19–30. [Google Scholar]
38. W. H. Kim, J. L. Cho and K. S. Kim. (2019). “The relationships of wine promotion, customer satisfaction, and behavioral intention: The moderating roles of customers’ gender and age,” Journal of Hospitality and Tourism Management, vol. 39, pp. 212–218. [Google Scholar]
39. J. Jung, P. Petkanic, D. Nan and J. H. Kim. (2020). “When a girl awakened the world: A user and social message analysis of Greta Thunberg,” Sustainability, vol. 12, no. 7, pp. 2707. [Google Scholar]
40. Y. Wang, F. Subhan, S. Shamshirband, M. Z. Asghar, I. Ullah et al. (2020). , “Fuzzy-based sentiment analysis system for analyzing student feedback and satisfaction,” Computers, Materials & Continua, vol. 62, no. 2, pp. 631–655. [Google Scholar]
41. J. Kim and N. Moon. (2019). “Rating and comments mining using TF-IDF and SO-PMI for improved priority ratings,” KSII Transactions on Internet and Information Systems, vol. 13, no. 11, pp. 5321–5334. [Google Scholar]
42. Y. Zhang, J. Cheng, Y. Yang, H. Li, X. Zheng et al. (2020). , “Covid-19 public opinion and emotion monitoring system based on time series thermal new word mining,” Computers, Materials & Continua, vol. 64, no. 3, pp. 1415–1434. [Google Scholar]
43. J. Kim, K. Bae, E. Park and A. P. Del Pobil. (2019). “Who will subscribe to my streaming channel? The case of Twitch,” in Conf. Companion Publication of the 2019 on Computer Supported Cooperative Work and Social Computing, New York, NY, USA, pp. 247–251. [Google Scholar]
44. A. N. Tuch, R. Trusell and K. Hornbæk. (2013). “Analyzing users’ narratives to understand experience with interactive products,” in Proc. of the SIGCHI Conf. on Human Factors in Computing Systems, New York, NY, USA, pp. 2079–2088. [Google Scholar]
45. E. O. Park, B. K. Chae, J. Kwon and W. H. Kim. (2020). “The effects of green restaurant attributes on customer satisfaction using the structural topic model on online customer reviews,” Sustainability, vol. 12, no. 7, pp. 2843. [Google Scholar]
46. R. M. O’brien. (2007). “A caution regarding rules of thumb for variance inflation factors,” Quality & Quantity, vol. 41, no. 5, pp. 673–690. [Google Scholar]
 | This work is licensed under a Creative Commons Attribution 4.0 International License, which permits unrestricted use, distribution, and reproduction in any medium, provided the original work is properly cited. |