DOI:10.32604/cmc.2021.014812
| Computers, Materials & Continua DOI:10.32604/cmc.2021.014812 | |
| Article |
Smart Dynamic Traffic Monitoring and Enforcement System
1Transportation Research Institute (IMOB), Universiteit Hasselt, Hasselt, 3590, Belgium
2College of Technological Innovation, Zayed University, Dubai, 19282, UAE
3Department of Civil Engineering, Middle East College (MEC), Muscat, 124, Oman
4College of Computer and Information Sciences, King Saud University, Riyadh, 12372, Saudi Arabia
5The University of Lahore (Islamabad Campus), Islamabad, 44000, Pakistan
*Corresponding Author: Fatma Outay. Email: fatma.outay@zu.ac.ae
Received: 19 October 2020; Accepted: 24 December 2020
Abstract: Enforcement of traffic rules and regulations involves a wide range of complex tasks, many of which demand the use of modern technologies. variable speed limits (VSL) control is to change the current speed limit according to the current traffic situation based on the observed traffic conditions. The aim of this study is to provide a simulation-based methodological framework to evaluate (VSL) as an effective Intelligent Transportation System (ITS) enforcement system. The focus of the study is on measuring the effectiveness of the dynamic traffic control strategy on traffic performance and safety considering various performance indicators such as total travel time, average delay, and average number of stops. United Arab Emirates (UAE) was selected as a case study to evaluate the effectiveness of this strategy. A micro simulation software package VISSIM with add-on module VisVAP is used to evaluate the impacts of VSL. It has been observed that VSL control strategy reduced the average delay time per vehicle to around 7%, travel time by 3.2%, and number of stops by 48.5%. Dynamic traffic control strategies also alleviated congestion by increasing the capacity of the bottleneck section and improving safety. Results of this study would act as a guidance for engineers and decision makers to new traffic control system implementation.
Keywords: ITS; safety; variable speed limits; ITS; VISSIM
Various control strategies have been proposed in past to solve the problem of continually increasing traffic congestion. These strategies include diverting traffic from congested areas, imposing constraint flow, reducing speed limits, and adding additional lanes where expanding the road network is feasible [1–3]. Recently, significant emphasis is being put on the application communication technologies and advanced information on the basis of the intelligent transportation systems (ITS). The main idea of ITS technologies is to improve the efficiency, safety and environment of transportation system without the need of changing existing highway infrastructure [4,5]. A wide range of ITS has been implemented in vehicles such as Advanced Travelers Information System (ATIS), or combined into the highway infrastructure such as Motorway Control System, (MCS) [6]. Since the previous decade, connected vehicle (CV) systems have become common and are acknowledged as a vital component of ITS [4–7].
The term “connected vehicle” refers to the vehicles that can communicate and share their information such as location and speed with high accuracy [8,9]. CV technologies enable infrastructure and vehicles to share aggregated information about traffic and individual vehicles in real time [4,5]. Various vehicle automation and communication systems have been introduced that can be utilized for the development of new control strategies, such as variable message sign, route guidance, and ramp metering [7]. VSL control is one of the most popular and recommended CV application that uses vehicle motion behavior transmitted into vehicles to allow for optimization of traffic operations [10].
Although ITS technologies have shown significant potential in improving the effectiveness of traffic enforcement, still there is a wide range of issues that need to be addressed before their implementation in the field. Some of them are related to the infrastructure’s improvement and installation, database development, and support agencies [4]. Other problems are related to road user acceptance and finally, the enforcement technologies require wide range of testing to ensure road users’ safety.
The objective of this paper is to investigate the performance of VSL as one of the dynamic traffic control strategies that can be used as an alternative traffic congestion management tool. A micro simulation software package VISSIM with add-on module VisVAP is used to evaluate the impacts of VSL. A 25 km road section of Mohammed Bin Zaid and Shaikh Zaid Road, United Arab Emirates (UAE) was selected as the study area. Using various other software programs such as Google Earth etc., this road section was created in the VISSIM program. Real world data was obtained from VITRONIC Machine Vision Middle East LLC. Using this data, analysis was done using built-in VISSIM functions. Results of this study would act as a guidance for engineers and decision makers to new traffic control system implementation in UAE.
The rest of this paper is organized as follows: In Section 2, a brief background on VSL control systems and the model’s predictive controls is provided. In Section 3, introduction to the simulation study is provided along with its study area, data, and simulation procedures. The simulation results are mentioned in Section 4, and the discussion and conclusions are provided in Section 5.
Variable speed limit (VSL) control systems are based on estimated traffic conditions such as traffic speed and traffic flow collected in real time by sensors through vehicle—infrastructure communication [11]. These data are used as the basis for traffic information provided to road users through dynamic variable message signs [11–14]. Road users then adjust their behaviour i.e., speed and lane positioning in response to the provided information.
Recent studies have shown the benefits of VSL control systems such as releasing highway congestion, improving safety, and reducing greenhouse gas emission, and fuel consumption in multiple situations. Several studies have investigated the impacts of VSLs on safety and traffic flow. Much of the focus of VSL evaluation has been on safety [9,12,14–18]. For example, Lower speeds ensure that vehicles travel at more consistent speeds, reduce lane changes, which leads to fewer traffic conflicts, and reduce noise and pollution [1,12,14]. According to another study, VSL systems on freeways are beneficial in suppressing shockwaves at both non-recurrent and recurrent bottlenecks and relieving adverse weather impacts [15]. VSL control can also be used to reduce the chance of secondary accidents by displaying lower speed limits when there has been an accident on the freeway [9,12,14–18]. Due to these benefits, use of VSL controls have been encouraged in various countries such as the Netherlands, Sweden, England, Japan, and Turkey [19–22]. VSLs can also help drivers to adapt their speed to match traffic, environmental, or weather conditions [23].
There are few studies that focused on the potential impact of VSL control system in improving traffic flow efficiency. Such as Sadat and Celikoglu, 2017 who studied the impact of Variable Speed Limit (VSL) system to improve mobility on congested freeway in Istanbul, turkey. They found that driver generally the VSL improve traffic flow and the obedience to VSLs is an important factor for better results [24]. They found that speed reduction between 80 to 70 km/h and 80 to 60 km/h can easy solve traffic congestion. Also, Farrag et al. [27], 2020 used VSL control system to resolve the problem of nonrecurrent traffic congestion they found that using VSL control system improve traffic mobility through increase traffic flow during incident by 7.8% and 11% during AM and PM respectively, and reduce fuel consumption by percentage varies between 3.5% and 46.5%.
Variable Speed Limit (VSL) systems comprise of a series of VSL signs and connected detectors to measure the traffic conditions to change the current speed limit according to the current traffic situation. The suitable speed limit is decided by the VSL algorithm. Previous studies have categorized the traffic control algorithms to major four types that are: rule based, fuzzy-logic based, analytical and control-theory based [10].
Different researches compared these algorithms, their impact, condition of their using, etc. they found that the limitations of rule-based strategies can be mainly attributed to the its reactive attribute while the other strategies are considered as a proactive, preventing meaning dynamically preventing a problem before it actually happens [10].
This research evaluates and quantifies the effectiveness of VSL as an innovative strategy for enhancing the performance of traffic control systems. Field operational assessments of new technology is expensive, time consuming, and in some cases unpractical and dangerous. The use of microscopic simulation has been given importance as an alternative tool to evaluate the performance of dynamic traffic controls. Several microscopic simulation software packages such as VISSIM, CORSIM, and SUMO are being widely used in the field of transportation for traffic modelling and simulation [8]. Among these softwares VISSIM was found to be the most suitable and cost-effective tool [26].
In this study, the traffic microsimulation package VISSIM [22] is used to investigate the potential impact of VSL as an alternative traffic control strategy. A microscopic base is established using VISSIM and added in the module VisVAP. The proposed VSL systems implement rule-based control algorithm which contains a set of predefined thresholds and speed limits. Once the predefined thresholds are reached, the desired speed limits are applied. The logic of VSL control is the bottleneck throughput is less than the bottleneck capacity ( ) [26,27]. Consequently, the VSL system checks the volume in the congested area and compares this with the bottleneck’s critical volume. If the volume of the mainline exceeds the bottleneck capacity, it decreases the speed of approaching vehicles upstream of the discharge area [26,28].
To simulate the VSL in VISSIM, the external signal state generator (VisVAP) is used. This is an optional add-on module of VISSIM for the simulation of programmable, phase- or stage-based, traffic-actuated signal controls loop detectors cannot communicate directly with the routing decision [22,26,28]. This module is programmed with a simple descriptive language. It receives detector variables, interprets control logics, and creates signal commands on a discrete time-step basis [22,26,28].
The goal of VSL control system is to change speed limits with respect to the prevailing traffic conditions at that moment so that the road users are timely informed through variable message signs (VMS). In most cases, to increase road user’s compliance, the VSL values are mandatory (legally equivalent to fixed speed limits) [10,12]. In this study, it is assumed that all traffic vehicles obey the VSL values. To this end, we follow the sequence of our research approach illustrated in Fig. 1.
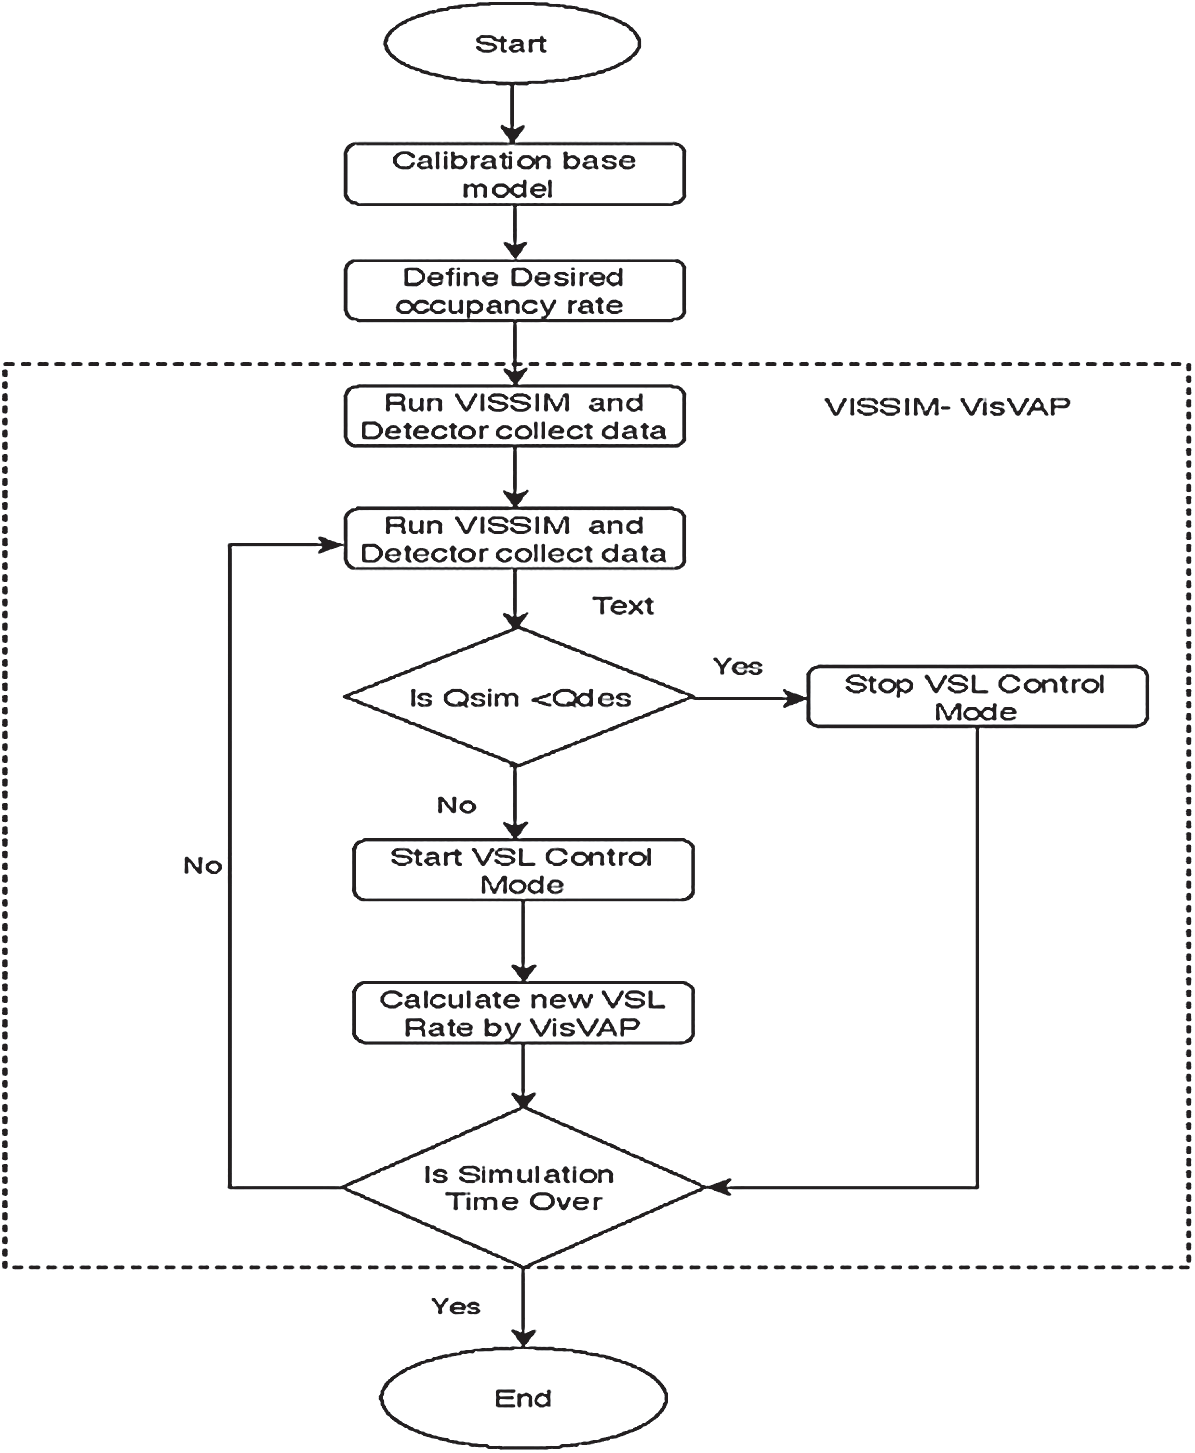
Figure 1: The sequence of the research approach
3.1 Study Area and Data Collection
A 25 km long road section was selected on Sheikh Zaid and Mohammed Bin Zaid Road were selected as the road sections under study. The sections selected have the road-side sensors data available. Each section of both roads has twelve lanes, six in each direction. The average lane width is 3.65 m, and the shoulder width is 2 m. Fig. 2 shows the field site.
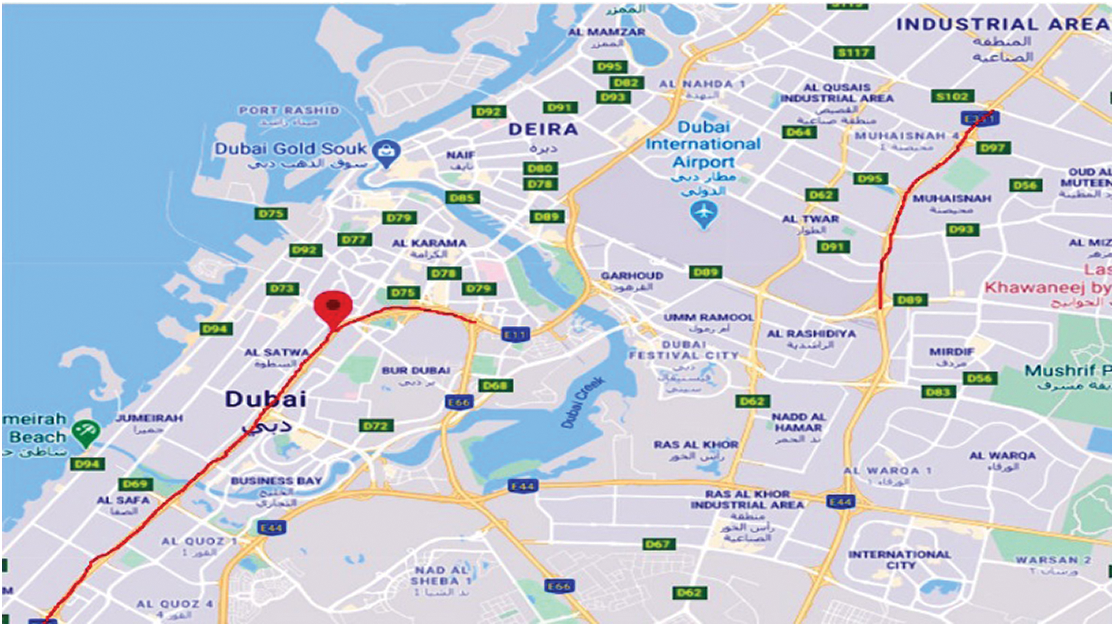
Figure 2: The study area and selected highways
The traffic data were collected by VITRONIC Machine Vision Middle East LLC between 23 February (Sunday) and 27 February (Thursday) of 2020. This span included regular days and normal weather conditions during morning and evening peak hours. Heavy vehicles constituted 2% of the traffic flow. The traffic volume varied between 4,600 and 10,500 vehicles per hour during the morning and evening peak hours [29]. The posted speed limit was between 100 and 110 km/h for passenger cars and 80 km/h for heavy trucks and buses, while the average speed varied from 54 to 101 km/h [29]. The collected data were verified for allowable error (coefficient of variation c.v. and percentage error  %) at T-95 [30,31].
3.2 Calibration and Verification
To develop the micro-simulation model, base model is created by developing the geometric design and layout of the study area in VISSIM utilizing Google Earth for the roadways, merging and diverging sections.
The model is generated by tracing the image background using VISSIM links and connectors. Traffic volume, vehicle composition, desired traffic speed, and a set of static vehicle routes are then added using the VISSIM-COM interface. The base model was then manually calibrated and validated on the basis of local driving behavior parameters belonging to the Wiedemann 74 and 99 car-following models [3]. This ensures that the base represents actual case conditions by using the average traffic volume and average speed for calibration and the average travel time for validation [30,31].
Average travel speed and average travel time were obtained by using a moving car technique for six runs per link in the study area (Muscat Municipality, NTS2017). Data were collected during normal working days in daylight hours when the weather was clear and the pavement was (WSDOT).
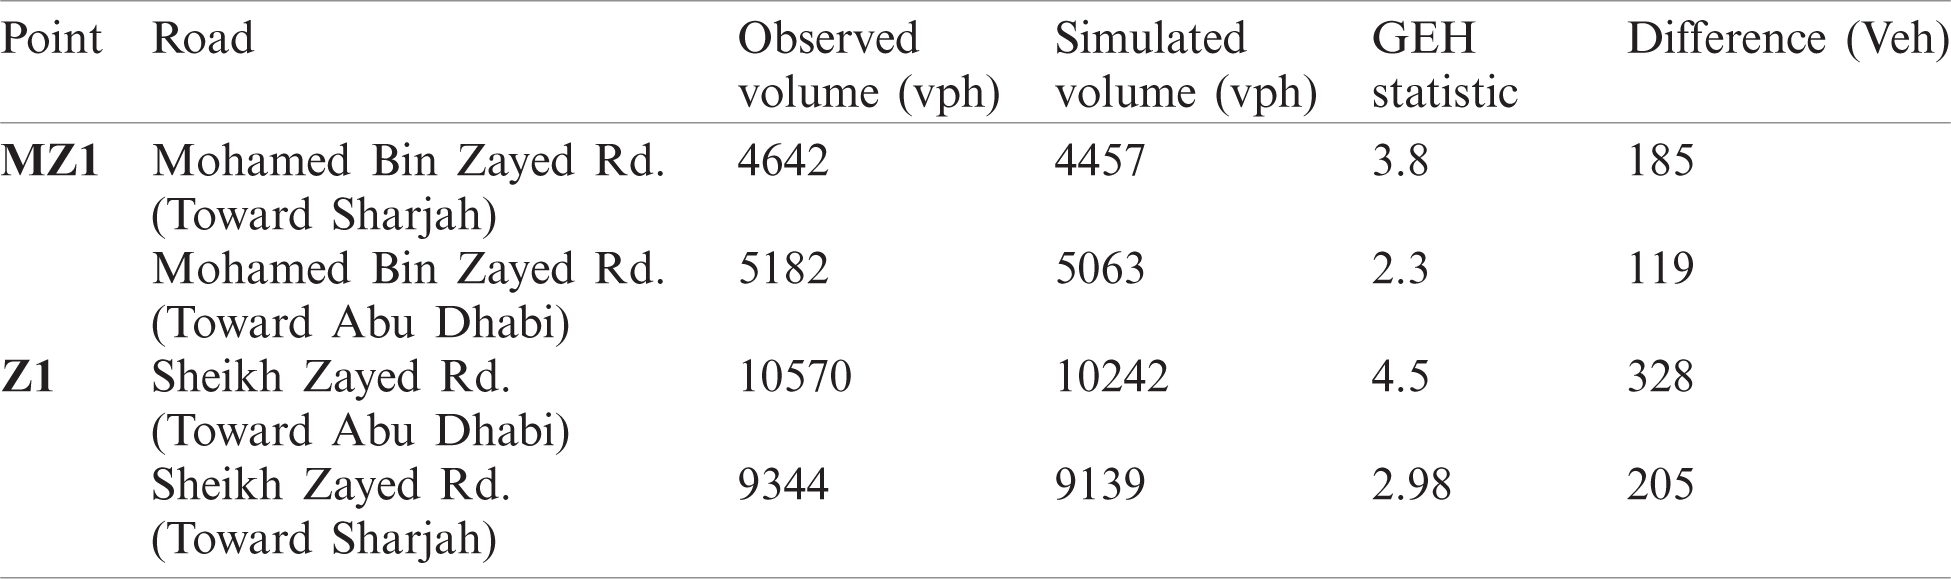
To evaluate the calibration results, Geoffrey E. Havers (GEH) statistical procedure was used [30,31]. The base model was found to be significant when calibrated, and the value varied between 2.3 and 4.5 GEH during the peak hours. Tab. 1 shows the calibrated model.
Table 1: Summary of calibration results
The calibrated model was then validated using average speed. Two statistical analyses (goodness-of-fit measurement) were conducted to validate the calibrated model: the root mean square error (RMSE) and the mean absolute normalized error (MANE). All goodness-of-fit measurements were within an acceptable range of 3% to 7% [28,29]. Moreover, to determine whether the difference between simulation output and field measured data statistical is significant, hypothesis tests student t-tests was used as shown in Fig. 3 and it found that R2 = 0.9997. To minimize the impact of the stochastic nature of the VISSIM model, our simulations models were run seven times for 5,400 sec, including warm-up and cool-down periods, which are around 900 sec [30,31]. These calibrated base models were used to evaluate VSL strategy applied in both streets in this study.
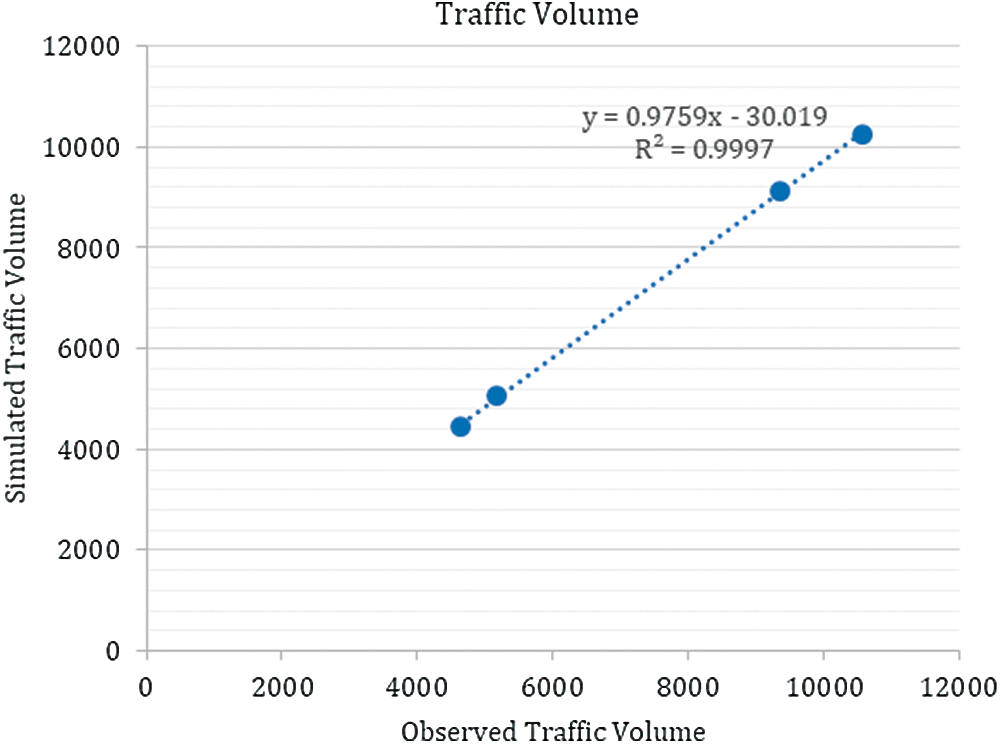
Figure 3: T-test of similarity comparison of validation results
3.3 Implementation of Proposed Strategy
To estimate traffic states in VISSIM, detectors are modeled as network objects on links [22]. In this study, one detector was defined per lane per vehicle class (lightweight or heavy) [22,26]. One signal controller was added to receive detector data, infer control logics, and create signal commands each time-step. A message impulse is then transmitted to the signal controller as soon as the front of a vehicle reaches the detector. Another impulse is transmitted as soon as the tail of the vehicle leaves the detector.
These impulses are interpreted by the signal control logic and converted into appropriate switching signals [22,26]. To create this VSL control logic, a component object model (VISSIM-COM) interface was used to write the user-defined VSL logic in VBA. VISSIM-COM enables one to deploy the characteristics of most of the internal objects dynamically. Fig. 4 shows the components of the VisVAP module.
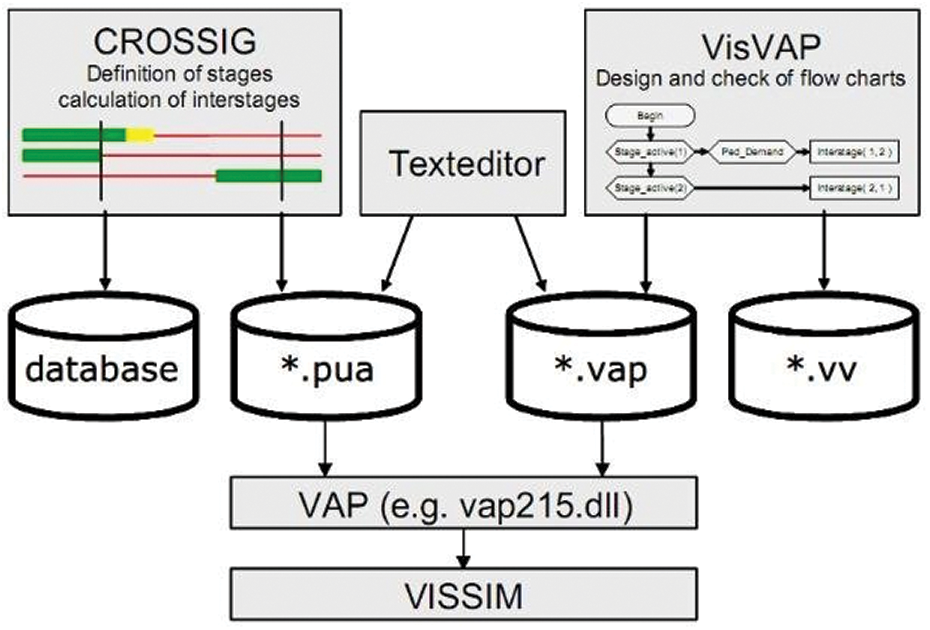
Figure 4: VisVAP module components [22]
In our study one detector was defined per lane per vehicle class and we assumed that the driver was notified “on the fly” via variable message sign (VMS). Fig. 5 shows the implementation strategy of the VISSIM interface.
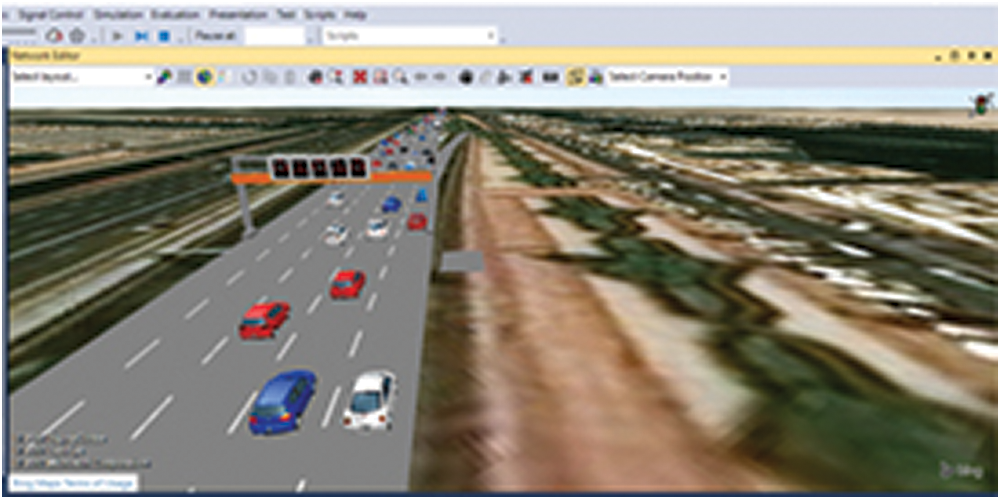
Figure 5: Example of the traffic control strategy from VISSIM interface
In this section, the VSL control strategy is evaluated and compared with the case where VSL is absent and there is an impact during an accident. To evaluate the effectiveness of VSL enforcement control strategy, different Measures of Effectiveness (MoEs) were chosen. Those include total travel time, number of stops, and stopped delay. Total travel time is the sum of the travel times of vehicles traveling within the link or that have already left the Link.
The number of stops represent the stop-and-go shockwaves in the network. Stopped delay is the time during which a vehicle is stopped in queue while waiting to pass through the bottleneck area [26–31]. Reducing the value of these measure of effectiveness reflects a significant increase in efficiency of traffic flow and safety along the road [26–31]. Results obtained from implementation of VSL on the road sections under consideration in this study are presented in Tab. 2. Data collection points were set at various points on the road section to collect data for variables i.e., number of vehicles, average speed, travel time, stop delay, and number of stops. Built-in evaluation functions of VISSIM were used to collect data for these variables. VISSIM computes a vehicle stop when a vehicle when it comes to a halt (speed becomes zero).
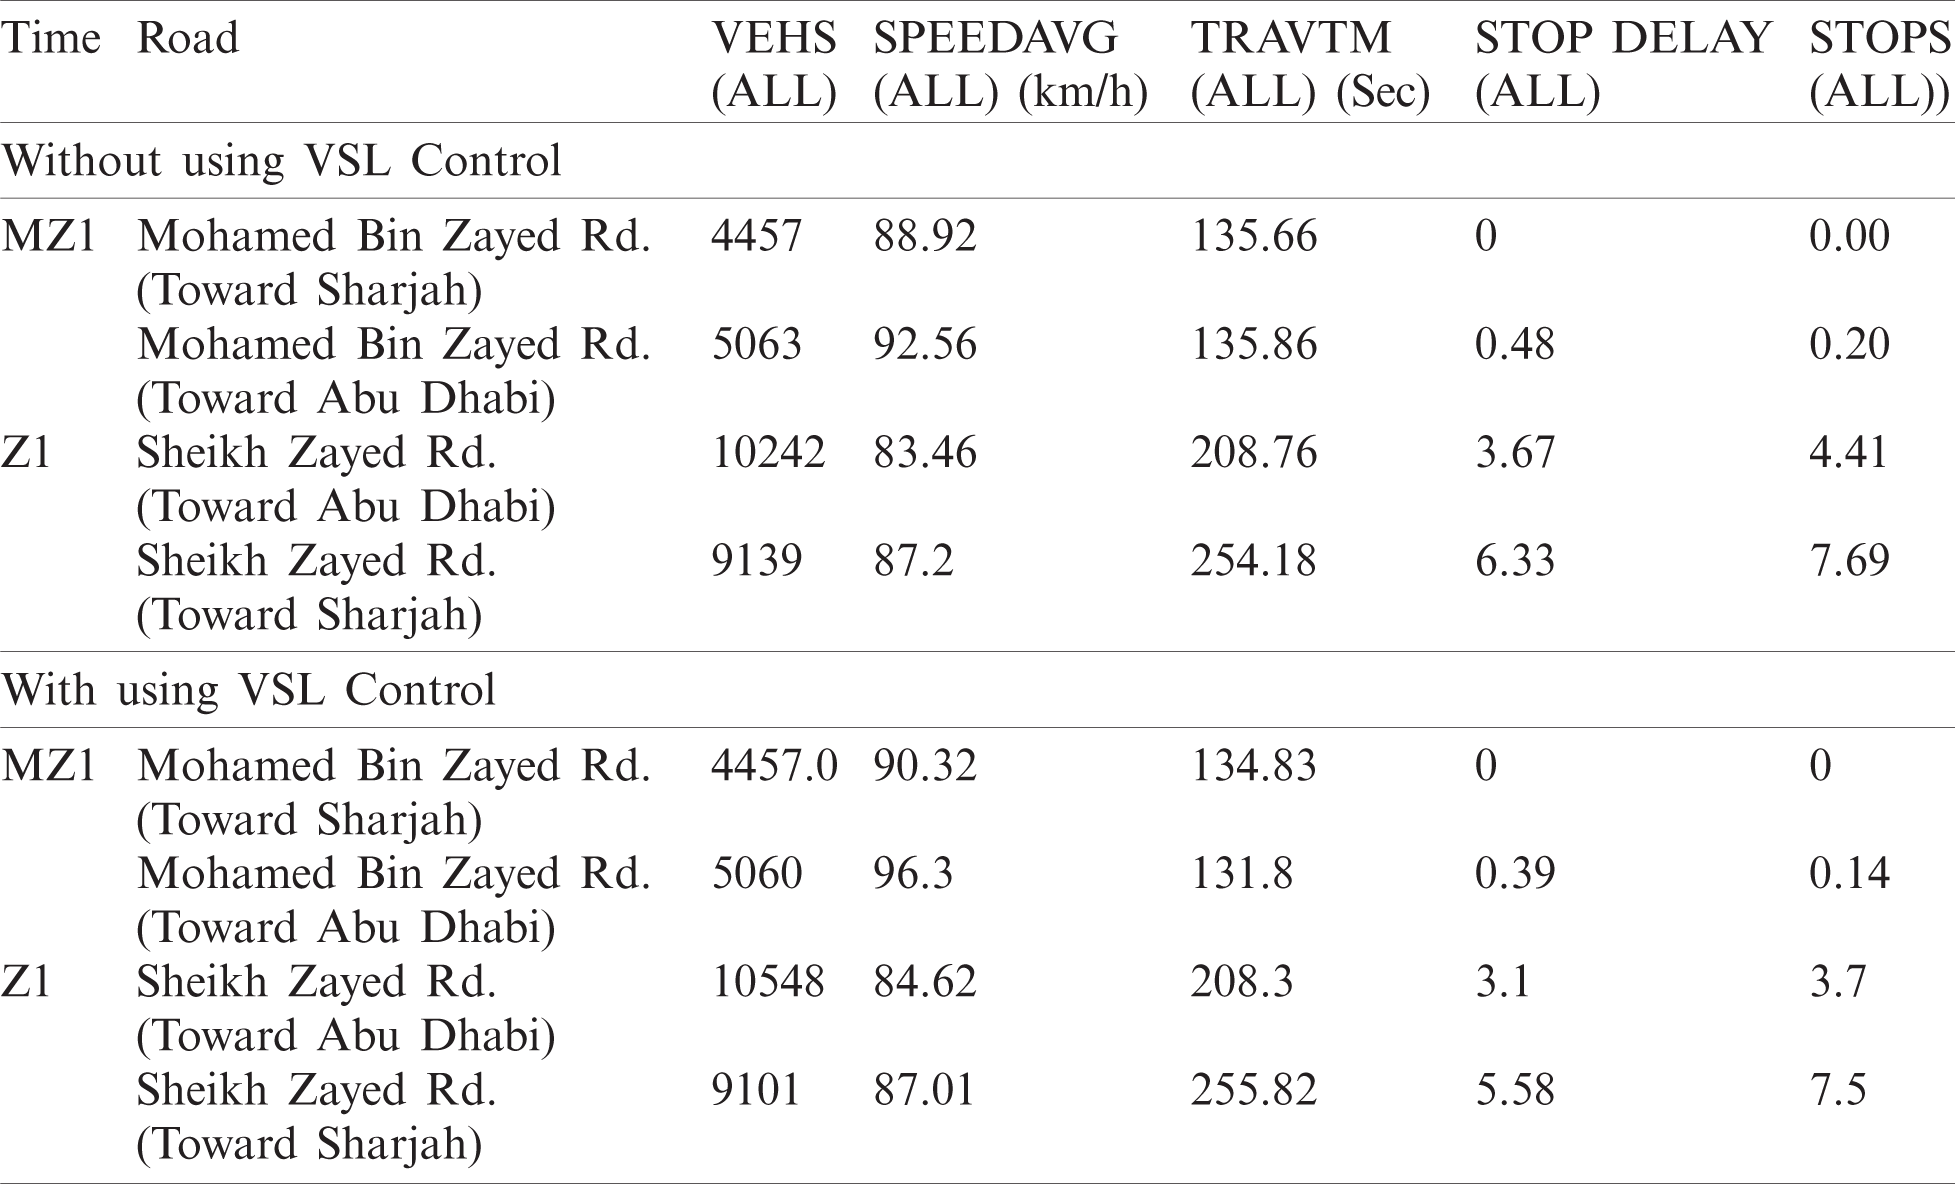
The simulation results from VISSIM showed that the dynamic speed limit control strategy improved mobility by increasing the average speed of vehicles by 6.8%, reducing travel time by 3.2%, and reducing average stopped delay per vehicle by 46%. The most significant impact was in improving safety by reducing the number of stops by 48.5%. Finally, the significance of the strategy depends on the capacity of the highway: the strategy shows a high impact on safety and mobility when the traffic volume is less than the capacity of the highway.
The main objective of this study is to improve the performance of traffic management systems through dynamic traffic control strategies. The study focused on using ITS techniques on a section of Mohammed Bin Zaid and Shaikh Zaid Road (United Arab Emirates) and assessed our strategy in terms of road safety and mobility. To achieve this, several MoEs were used, namely the total number of vehicles that pass-through data collection points, average vehicle delay, average travel time, average stopped delay, and vehicle stops all.
And experimental analysis-based traffic simulation was conducted, and the simulations were run multiple times to check for the consistency of the random seeds, as proposed in the PTV VISSIM manual [22]. The results indicated that the use of VSL improved the safety in particular by reducing the number of stops by 48.5%. The best results were obtained for safety and mobility in links whose traffic volume was below the design capacity (MZ1). The success of the VSL control strategy depends mostly on drivers’ understanding of and adherence to the method applied. Therefore, our future work will be to study drivers’ responses to the use of such technology and the effect of using autonomous vehicles.
Acknowledgement: The authors acknowledge the research support provided by IMOB Hasselt University Belgium and VITRONIC Machine Vision Middle East LLC for their provision and providing the data that makes this research viable and effective. The authors also acknowledge the research support given by Zayed University, UAE. This work would not have possible without their help.
Funding Statement: The authors received no specific funding for this study.
Conflicts of Interest: The authors declare that they have no conflicts of interest to report regarding the present study.
1. R. C. Carlson, I. Papamichail, M. Papageorgiou and A. Messmer. (2010). “Optimal motorway traffic flow control involving variable speed limits and ramp metering,” Transportation Science, vol. 44, no. 2, pp. 238–253. [Google Scholar]
2. Y. Chung and K. Choi. (2010). “Dynamic toll concept to assess feasibility of high-occupancy vehicle lane on Kyungbu Freeway, South Korea,” Transportation Research Board, vol. 2178, no. 12, pp. 162–169. [Google Scholar]
3. S. G. Farrag, F. Outay, A. U. H. Yasar, D. Janssens, B. Kochan et al. (2020). , “Toward the improvement of traffic incident management systems using Car2X technologies,” Personal and Ubiquitous Computer, Online. [Google Scholar]
4. D. Tian, W. Li, G. Wu and M. J. Barth. (2017). “Examining the safety, mobility and environmental sustainability co-benefits and tradeoffs of intelligent transportation systems,” UC Davis: National Center for Sustainable Transportation, pp. 35, . [Online]. Available: https://escholarship.org/uc/item/0m49j95r. [Google Scholar]
5. H. Leung, N. E. El Faouzi and A. Kurian. (2011). “Intelligent transportation system (ITS),” Information Fusion, vol. 12, no. 1, pp. 2–3. [Google Scholar]
6. K. Singh and B. Li. (2012). “Estimation of traffic densities for multilane roadways using a MARKOV model approach,” IEEE Transactions on Industrial Electronics, vol. 59, no. 11, pp. 4369–4376. [Google Scholar]
7. M. Fountoulakis, N. Bekiaris-Liberis, C. Roncoli, I. Papamichail and M. Papageorgiou. (2017). “Highway traffic state estimation with mixed connected and conventional vehicles: Microscopic simulation-based testing,” Transportation Research Part C: Emerging Technologies, vol. 78, no. 11, pp. 13–33. [Google Scholar]
8. W. Fan and M. Yu. (2019). “Optimal variable speed limit control for mixed traffic flows in a connected and autonomous vehicle environment,” Journal of Transportation Engineering, Part A: Systems, vol. 145, no. 4, pp. 85–91. [Google Scholar]
9. B. Khondaker and L. Kattan. (2015). “Variable speed limit: An overview,” Transportation Letters, vol. 7, no. 5, pp. 264–278. [Google Scholar]
10. E. F. Grumert and A. Tapani. (2017). “Using connected vehicles in a variable speed limit system,” Transportation Research Procedia, vol. 27, pp. 85–92. [Google Scholar]
11. W. W. Wang, X. M. Zhao, X. Li and D. F. Xie. (2013). “Empirical study and modeling of variable message signs on route choice behavior,” Journal of Transportation Systems Engineering and Information, vol. 13, no. 3, pp. 60–64. [Google Scholar]
12. D. Chen, S. Ahn and A. Hegyi. (2014). “Variable speed limit control for steady and oscillatory queues at fixed freeway bottlenecks,” Transportation Research Part B: Methodological, vol. 70, pp. 340–358. [Google Scholar]
13. Y. Han, D. Chen and S. Ahn. (2017). “Variable speed limit control at fixed freeway bottlenecks using connected vehicles,” Transportation Research Part B: Methodological, vol. 98, pp. 113–134.
14. M. Papageorgiou, E. Kosmatopoulos and I. Papamichail. (2008). “Effects of variable speed limits on motorway traffic flow,” Transportation Research Record: SAGE Journals, vol. 2047, no. 2047, pp. 37–48. [Google Scholar]
15. B. Katz, J. Ma, H. Rigdon, K. Sykes, Z. Huang et al. (2017). , “Synthesis of variable speed limit signs,” Fhwa-Hop-17-003, pp. 100, . [Online]. Available: https://ops.fhwa.dot.gov/publications/fhwahop17003/fhwahop17003.pdf. [Google Scholar]
16. B. G. Heydecker and J. D. Addison. (2011). “Analysis and modelling of traffic flow under variable speed limits,” Transportation Research Part C: Emerging Technologies, vol. 19, no. 2, pp. 206–217.
17. D. L. Duo and P. A. Ranjitkar. (2011). “A fuzzy logic-based variable speed limit controller,” Journal of Advanced Transportation, vol. 47, no. 4, pp. 512–525.
18. X. Yang, Y. Lu and Y. Lin. (2016). “Optimal variable speed limit control system for freeway work zone operations,” Journal of Computing in Civil Engineering, vol. 31, no. 1, pp. 1–9. [Google Scholar]
19. S. Hoogendoorn, W. Daamen, R. Hoogendoorn and J. Goemans. (2013). “Assessment of dynamic speed limits on freeway a20 near Rotterdam, Netherlands,” Transportation Research Record, vol. 32, no. 2380, pp. 61–71. [Google Scholar]
20. A. Nissan. (2014). “Evaluation of recommended variable speed limits for motorway traffic control: Case of E4 in Stockholm, Sweden,” . https://trid.trb.org/view/1240701. [Google Scholar]
21. B. Harbord, J. White, K. McCabe, A. Riley and S. Tarry. (2006). “A flexible approach to motorway control,” in Proc. of the 13th Its World Congress, London, pp. 8–12. [Google Scholar]
22. PTV. (2016). [Online]. Available: http://www.ptvamerica.com/vissim.html [Accessed 02 August 2020]. [Google Scholar]
23. P. Rämä. (2001). “Effects of weather-controlled variable message signing on driver behavior,” VTT Publications, vol. 447, no. 447, pp. 2–55. [Google Scholar]
24. S. Park, J. Kim, S. Lee and K. Hwang. (2017). “Experimental analysis on control constraints for connected vehicles using VISSIM,” Transportation Research Procedia, vol. 21, pp. 269–280. [Google Scholar]
25. M. Sadat and H. B. Celikoglu. (2017). “Simulation-based variable speed limit systems modelling: An overview and a case study on Istanbul freeways,” Transportation Research Procedia, vol. 22, pp. 607–614. [Google Scholar]
26. A. Nissan and H. N. Koutsopoulosb. (2011). “Evaluation of the impact of advisory variable speed limits on motorway capacity and level of service,” Procedia Social and Behavioral Sciences, vol. 16, pp. 100–109. [Google Scholar]
27. S. Farrag, M. Y. El-Hansali, A. Yasar and E. M. Shakshuki. (2020). “Simulation-based evaluation of using variable speed limit in traffic incidents,” in Procedia Computer Science. The 15th Int. Conf. on Future Networks and Communications, Leuven, Belgium, vol. 175, pp. 340–348. [Google Scholar]
28. M. F. Tafti. (2018). “A study on the merits for coordinated use of ramp metering and variable speed limit traffic control systems,” Open Transportation Journal, vol. 12, no. 1. [Google Scholar]
29. Vitronic. (2020). “VITRONIC machine vision middle east LLC office no: 211 Umm Al Sheif, Sheikh Zayed Road—Dubai,” . www.vitronic.com. [Google Scholar]
30. R. Dowling, A. Skabardonis and V. Alexiadis. (2004). “Traffic analysis toolbox, volume III: Guidelines for applying traffic microsimulation modeling software,” FHWA-HRT-04-040. [Google Scholar]
31. WSDOT. (2015). “Protocol for VISSIM simulation,” Washington State Department of Transportation, . [Online]. Available: http://www.oregon.gov/ODOT/TD/TP/APM/AddC.pdf. [Google Scholar]
 | This work is licensed under a Creative Commons Attribution 4.0 International License, which permits unrestricted use, distribution, and reproduction in any medium, provided the original work is properly cited. |