DOI:10.32604/cmc.2021.014738
| Computers, Materials & Continua DOI:10.32604/cmc.2021.014738 | |
| Article |
Web Application Commercial Design for Financial Entities Based on Business Intelligence
1COMBA I + D Research Group of Universidad Santiago de Cali, Valle del Cauca, Colombia
2Closemobile R&D Telecommunications LS, Fuenlabrada, España
3Al–Nahrain Nanorenewable Energy Research Center in Al-Nahrain University, Bagdad, Iraq
4COMBA I + D Research Group of Universidad Santiago de Cali, Valle del Cauca, Colombia
*Corresponding Author: Carlos Andrés Tavera Romero. Email: carlos.tavera00@usc.edu.co
Received: 13 October 2020; Accepted: 04 January 2021
Abstract: Multiple customer data management has become a focus of attention in big organizations. Although much information is available, it does not translate into significant profitable value-added services. We present a design of a commercial web application based on business intelligence that generates information on social and financial behavior of clients in an organization; with the purpose of obtain additional information that allows to get more profits. This app will provide a broader perspective for making strategic decisions to increase profits and reduce internal investment costs. A case in point is the financial sector, a group of financial entities were used to make measurements and test them. A design to build a web application aimed at achieving a large and ambitious goal by means of defined tools reflecting clients’ business needs is proposed. In this research, different techniques and technologies are explored, such as diagrams, frameworks, design, architecture, model entity-relationship, tables, equations, mental maps and development tools. Through the Personal Software Process methodology and with the help of information extraction, consolidation, and visualization, the implementation can be carried out. This article provides the importance of implementing business intelligence in an organization and expands on the steps needed for the implementation of this valuable technology.
Keywords: Business intelligence; banking application; web application; trend analysis; decision making
In most companies’ core business, information has become a vital asset for their growth. In the case of the financial sector, large companies handle large amounts of information about their customers. The more they know about the services their clients need, the higher is the possibility customers will choose a service from the offered catalog. Most organizations generate enormous data, but its use is not systematized in order to learn from it and obtain usable knowledge. Therefore, proper handling of data could help understand customers based on targeted information.
It is clear that customer information plays a crucial role in business. In addition, improvements in technology, whether through the invention of new techniques or through the adoption of better technologies, are fundamental to the process of growth and development. Therefore, a technique such as business intelligence (BI), based on the collection of data for the generation of information and aiding decision making, is essential. An application that reports the products most purchased by certain clients will strengthen commercial and marketing strategies for the organization and expand its database of buyers.
In recent years, technological applications and computer systems have grown exponentially and rapidly in all areas and especially in BI. According to [1], it is considered that BI has one of the most significant uses in information technology. In [2], the authors mentioned that data analysis can provide ideas for better business and operational decisions.
BI is a broad category of applications and technologies for collecting, storing, analyzing, and providing information to help business users make better business decisions. It is a necessity for companies that want to understand their customers better aside from the many other ways of approaching customers in the current era.
In Fig. 1, it is possible to perceive the key aspects for the management and transformation of big data and how important business intelligence is in that environment.
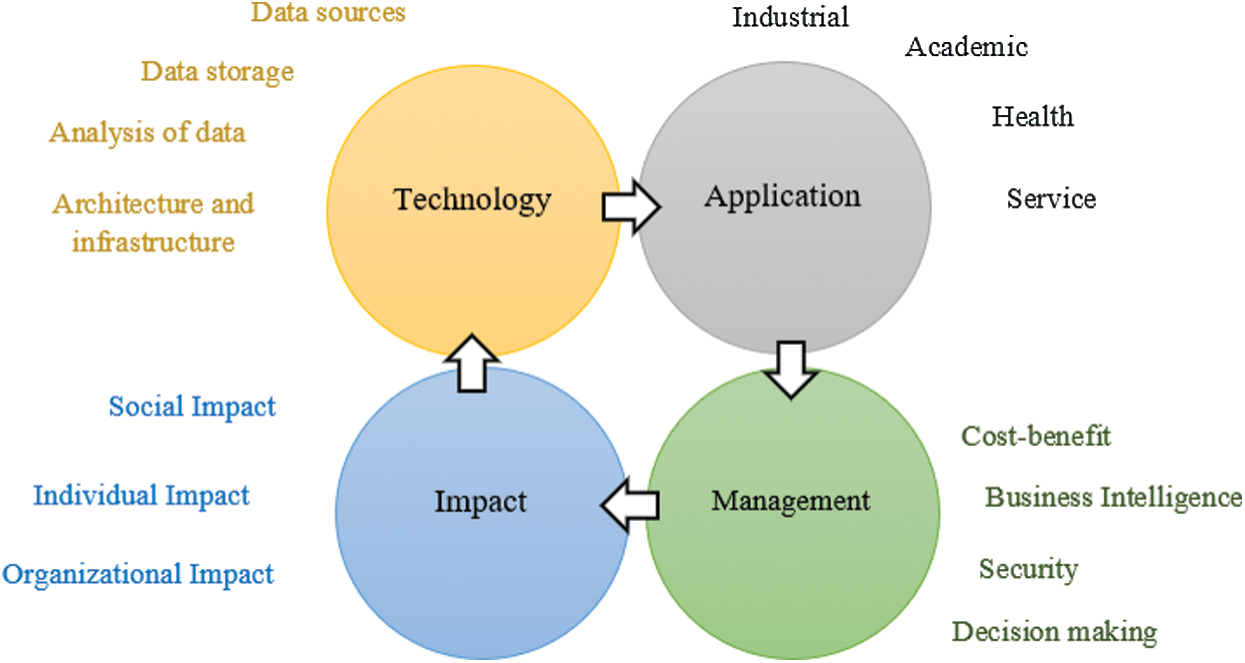
Figure 1: Big data and BI framework
This can be rectified [3], considering BI is the process of transforming raw data into useful information for a strategic vision. It can benefit operations and support more effective decision making, thus leading to real value and profits. Additionally, [4] indicated that BI systems are advanced solutions for gathering business data and analyzing it with different tools. This use of BI systems should have a considerable proportion in the investment budget of different organizations in order to reach the objective of understanding and classifying their customers.
Business intelligence has become a necessity owing to the increase in the amount of data accumulated in organizations. This has led to the introduction of new and more complex and efficient analysis tools [5].
The systems of BI are often required to cater to wide audiences, including knowledge workers, the management, and the shareholders [6]. For this reason, they must perform fast analysis of different scenarios and effectively communicate the methodology and the results.
Moreover, organizations use BI predictions to improve their general productivity [7], and it was analyzed that strategic marketing is required to monitor the options of specific products from the clients. Together with the joint subscription networks, which codify the behavior of the clients and the multiple purchases they make, organizations can monitor the most important needs and aspects related to their customers. Based on this, the authors developed a Bayesian hierarchical model, which groups the agencies according to the common options of single-product clients and co-subscription networks. This approach provides key information on multiple product customer options and purchase behaviors within each group, thus informing targeted cross-selling strategies.
In a prevailing example of BI implementation in the United States, BI helps identify customer behavior regarding multiple purchases, thus helping to develop cross-selling strategies aimed at single-product customers. This case will probably be implemented by an Italian insurance company [8].
Organizations are increasingly using business process prediction technologies to improve their overall productivity. In particular, organizations need to predict the process and event flows, recognize their patterns, and forecast the total time it would take to complete a process to comply with the service level agreements signed with customers [9].
One of the many problems that exist is the dispersion of data. There is excessive information across different data sources, and the analysis of this data is limited. So, the current situation cannot achieve what the organizations are seeking with respect to the use of all their data.
Based on [10], two ways of extracting data from the data sources were identified according to the most widely used systems. The sources were ETL (Extract, Transform, and Load) and ELTA (Extract, Load, Transform, and Analyze). Tab. 1 shows their differences.
Table 1: Differences between ETL and ELTA [11]

In 1993, E. F. Codd suggested online analytical processing (OLAP) technology for the first time. It is specially designed to analyze operations for the benefit of top management. The client will expect fast, flexible, and complex analyses and processing of a large amount of data. The application of OLAP in marketing management systems enables the management and analysis of multidimensional data [12].
Over the past five years, OLAP has become one of the essential information processing technologies. This technology has been used successfully in different areas, such as retail, financial services, telecommunications, and medical care [13]. Due to security issues, data stored in data warehouses is an active area of debate and research, especially in the matter of data privacy.
OLAP is used to develop multidimensional operations that allow queries and visualization for BI. Most OLAP systems come with a tightly integrated user interface for querying and visualization of data without central OLAP operations exposed as an API [14]. Advanced BI applications can be developed and deployed to create complex workflows if OLAP operations are available as an API. In addition, an API based on web services would allow applications to use service-oriented architecture for big data analytics. It can be easily deployed in a cloud.
During the ongoing wave of privacy protection awareness, the personal cloud paradigm has emerged. It offers a variety of solutions to users, so they can assemble and manage their entire digital life [15]. This opens the way for new value-added services that result from multiple data sources of a specific person or the data of several people are analyzed together. However, this paradigm shift toward user empowerment raises fundamental questions regarding the suitability of functionalities and data management and protection techniques offered by the existing solutions. These techniques and models were discussed in a study on the comparison and evaluation of cloud processing models in cloud-based networks, and the advantages and disadvantages of this digital life were identified [16].
The management of data in the cloud has become a research trend in recent years. A data management technique to consider is the blockchain, which establishes a fair and transparent data exchange environment where unauthorized modifications of the data can be audited and tracked. These features have a wide range of applications in different domains, and this technique allows implementation in a cloud environment with high security and performance. Blockchain implementations are present in the research and studies carried out by Khalaf [17], for example, a new algorithm for use in live video transmissions and telecommunications.
Another important domain is wireless sensor networks, which are intelligent systems that use different algorithms according to need and frequency. For implementations and investigations, refer to [18–22].
Another valuable technique for the security and privacy of information is the C5.0 algorithm [23] based on the preservation of privacy and safe mining modeling. It can optimize efficiency in terms of greater precision, minimum execution time, and lower general distribution expenses. This algorithm was implemented in [24].
Data mining can preserve privacy and conceal the sensitive identity of an individual without sacrificing the ease of use of the data. People have encountered intrusions in the privacy of their confidential data in recent years and therefore are very reluctant to share their information. The main area of concern is that even non-confidential data can disclose sensitive information, including personal information, facts, and patterns [25].
In Fig. 2, a framework for data mining with privacy is presented.
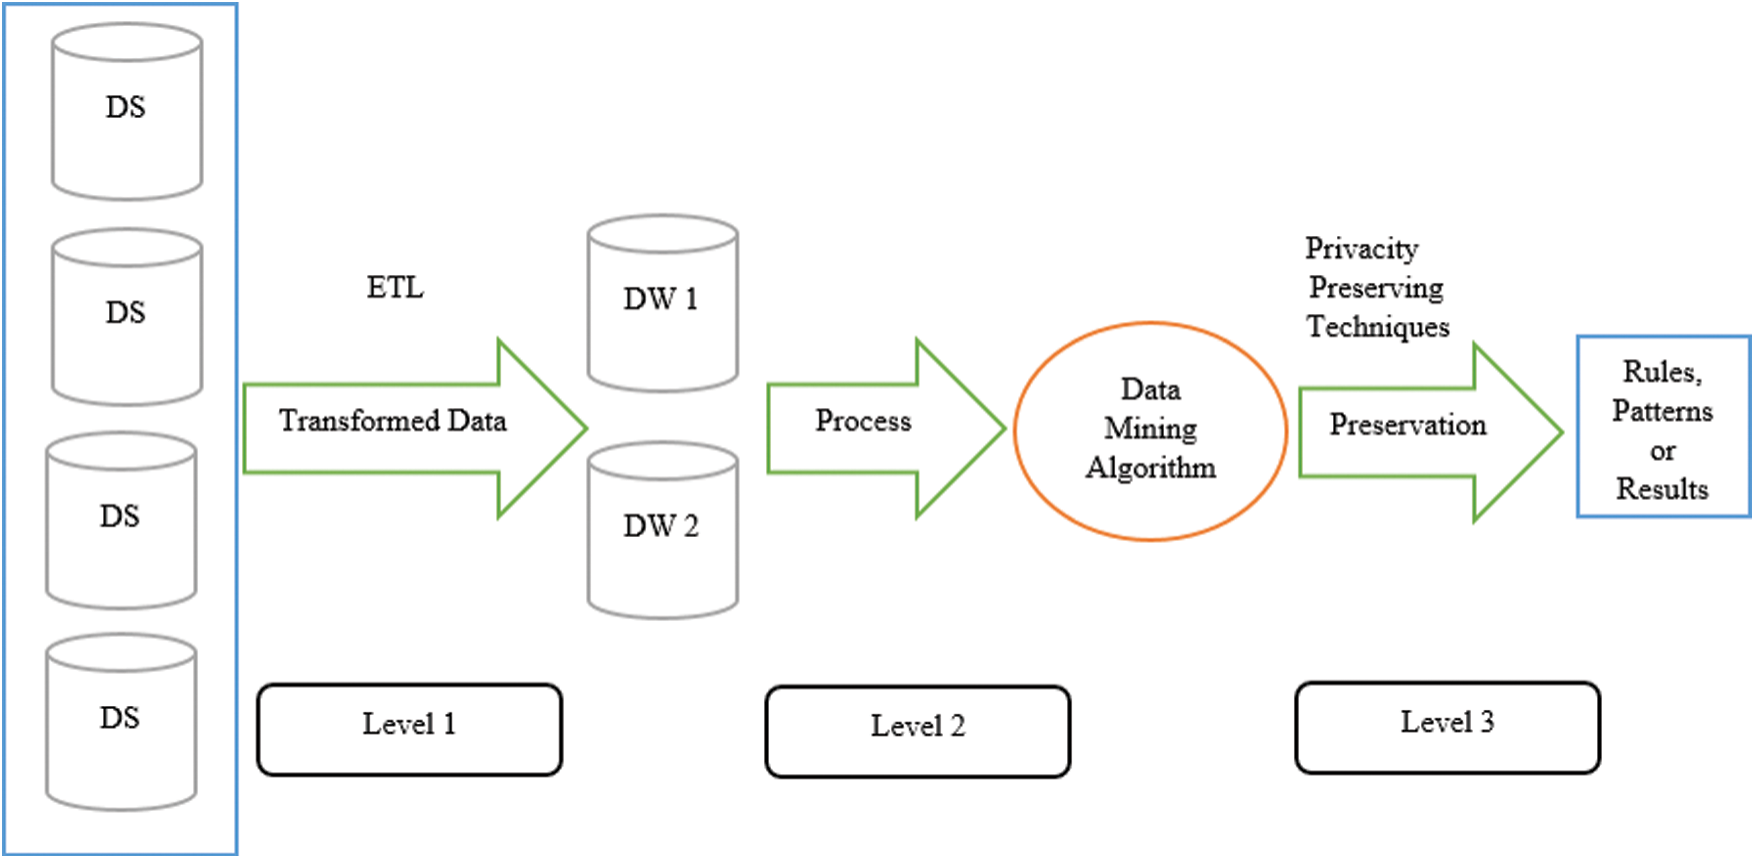
Figure 2: Privacy framework preserving data mining
OLAP can handle the information in this study, as it allows queries and visualization for BI. It can also be easily implemented in the cloud, and it has high privacy and security.
For the visualization of information through trend boards, some information representation tools are the Crystal Report [26], Birt Report (Business Intelligence and Reporting Tools) [27], and Jasper Report [28]. These tools accommodate information that is generated in different formats and languages, regardless of the data sources. Each of them has advantages in different situations.
According to the OLAP technique, the most appropriate user interface for this proposal is the Birt Report, an open-source software project that the BIRT technological platform provides to create data visualizations and reports that can be integrated into rich web and client applications, especially those based on Java and Java EE.
The BIRT technology platform is one of the most widely adopted data visualization and information technologies with more than 12 million downloads and more than 2.5 million developers in 157 countries.
In fact, some technology providers offer services of BI analytical platforms that adapt to the business of each company. To give an example, IBM offers a tool called IBM Cognos Business Intelligence [29], which is an integrated business intelligence suite that makes available a wide range of functions to help understand the data of an organization. Moreover, any person in the organization can use it to create and view business reports, analyze data, and monitor events and metrics to make effective business decisions.
There are other vendors that offer similar tools, but their cost is steep. For example, a business enterprise license costs approximately $125 per user per month. If it will be used by at least 150 users, an organization would need to invest an approximate total of $225,000 per year [30].
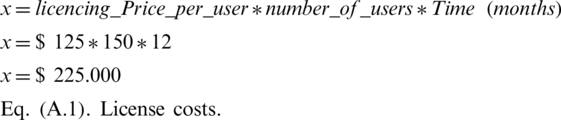
Investing toward internal development would have a lower cost than an external service.
As reported by [31], the estimated time for the development of a software project in a company is based on several domains according to the need: technology, users, processes, requirements, work teams, planning and control, and organization and development. Under these domains, the IBM estimate is compared to internal development of a software with the same characteristics, expressed in the following formula:
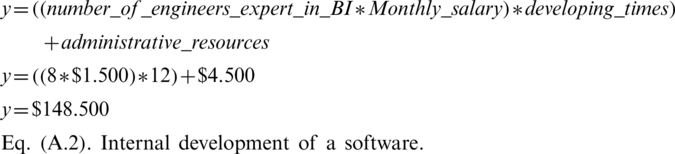
As stated in the comparison of estimated prices between what is offered by a supplier and internal development, the development investment would be lower by approximately 34%, which makes it more viable.
Other companies dedicated to customer service based on IT is PacifiTIC, a cluster of universities and companies in the Information and Communications Technologies. PacifiTIC are supporting institutions with local human talent who are convinced of the capabilities and entrepreneurial image. This cluster facilitate through a competitive and innovative platform, the development of main clients, industries and entities that use ICT intensively [32].
For a cluster of approximately 80 companies, the probabilistic sampling mechanism of simple random sampling was applied, and five companies were randomly selected for an experiment to validate the applicability of the proposed project, according to the needs of different companies. The correspondence between the outcomes of the project and various organizational needs would be reflected in the results of this study.
The methodology for the proposed project is PSP (Personal Software Process), which is a framework in which the team is committed to improving the quality of the software through a set of documented steps [33]. This framework is implemented in the following stages [34]:
Identify the structure of the data that will be taken from the databases, including the client’s information, its products, and the performance of its products over a period of five years.
Extract commercial data using the ELTA technique from heterogeneous data sources and load it into big data storage.
Consolidate the extraction of data from all sources in the stage. All the necessary information is evaluated in decision making, which supports the growth of large companies’ customers in the financial sector in this case.
Carry out necessary transformations to support the commercial report requirement that will provide the required strategic information.
Analyze the consolidated information in the storage, and apply the OLAP technique to generate relevant information.
Graphically represent the information obtained according to the filters and parameters selected through the BIRT Report tool.
The process of decision making and discovery of new patterns in the business through trend boards is supported.
The strategy of this methodology is to carry out the different processes of implementation of BI through an application that has appropriate tools and technology to solve the needs of financial institutions. The aforementioned steps are of vital importance for management while making decisions.
Fig. 3 shows the process diagram with the stages of the methodology.
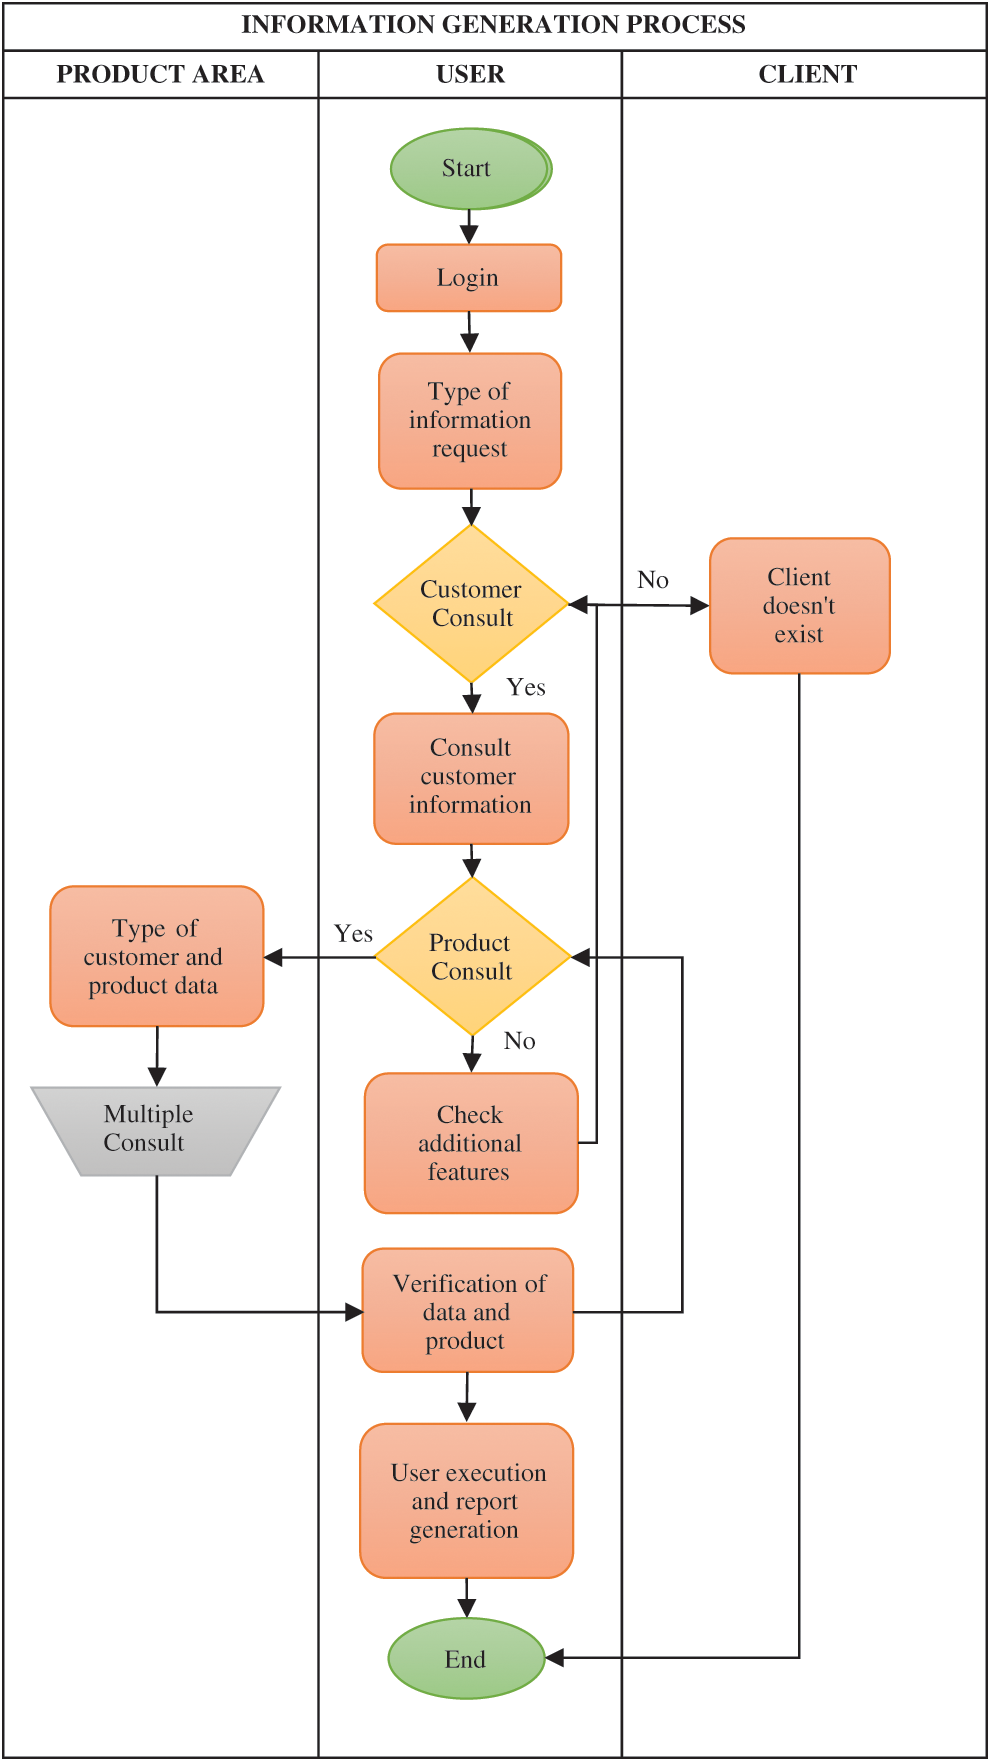
Figure 3: Process diagram
The design of the application is in a web environment because this provides greater availability, has high platform compatibility, enables immediate access, and reduces the consumption of resources compared to desktop applications.
The application is focused on users or commercial entrepreneurs, so the BI technique is implemented. There is abundant information on the clients associated with the organization. Fig. 4 shows the entity-relationship model of the database in which the information will be stored.
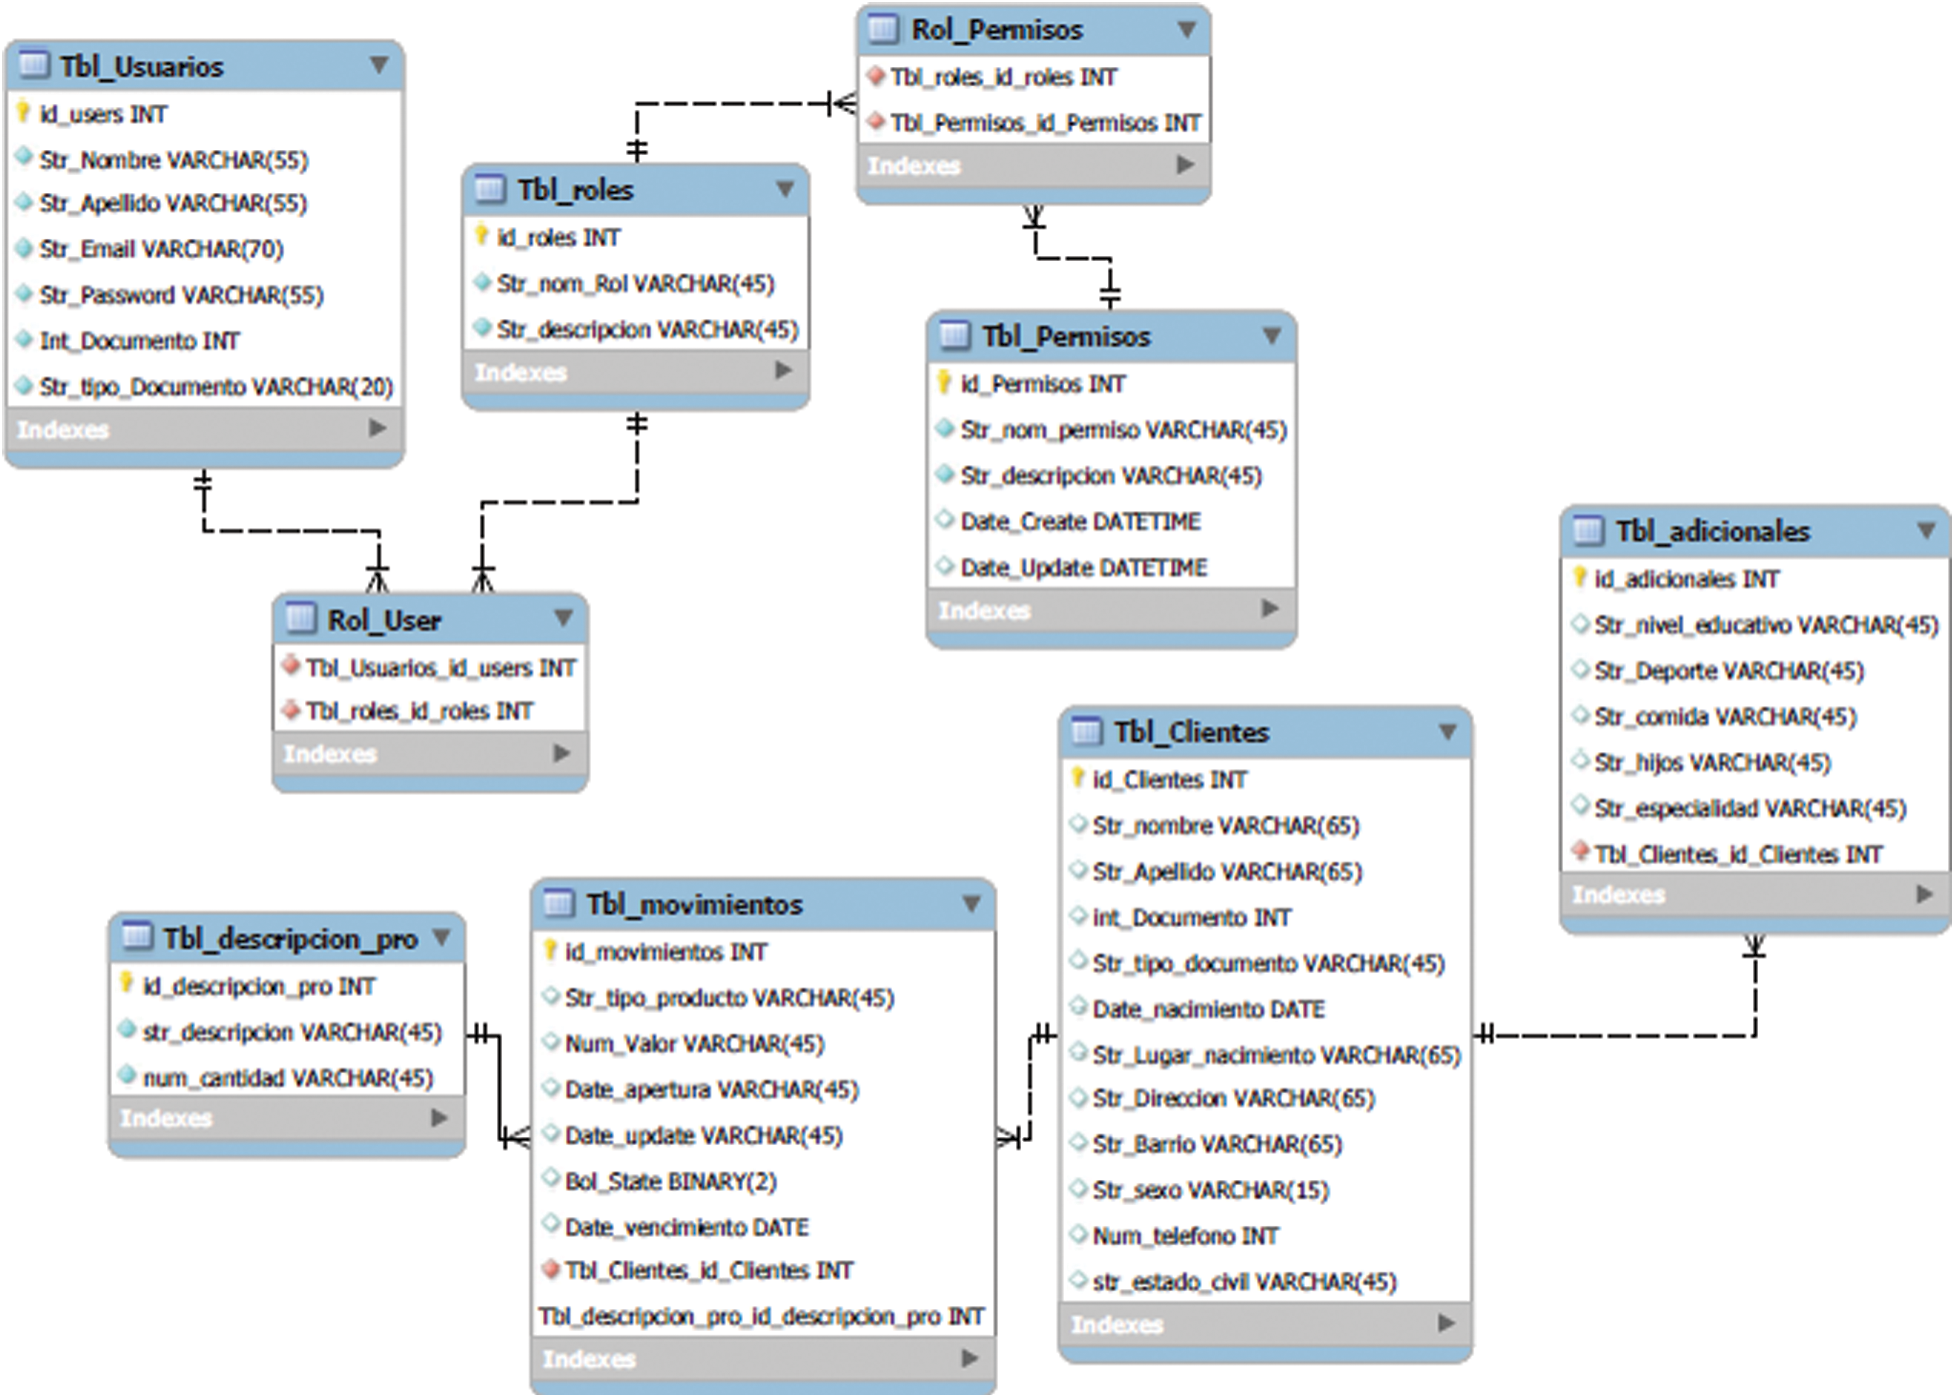
Figure 4: Model entity-relationship of the database
It is proposed to use four languages in parallel for the development of the project: PHP, HTML, CSS, and Javascript with a Laravel Framework. These multiplatform languages provide a strong structure and a model oriented to web environments. They are highly secure when the most appropriate configuration is used. Object-oriented MVC Modeling is proposed for the structure of the development (Model View Controller), as it supports a higher layer of security in order to meet the needs of the clients and saves the client’s information more efficiently while preserving scalability [35].
For the storage of information, the best choice of database is MySQL, as it is a free engine with high performance and speed for operations along with security and availability [36]. The database will be supported on a server in the cloud with security protocols for safeguarding the clients’ information.
Fig. 5 shows the proposed architecture for the design of the commercial web application based on business intelligence.
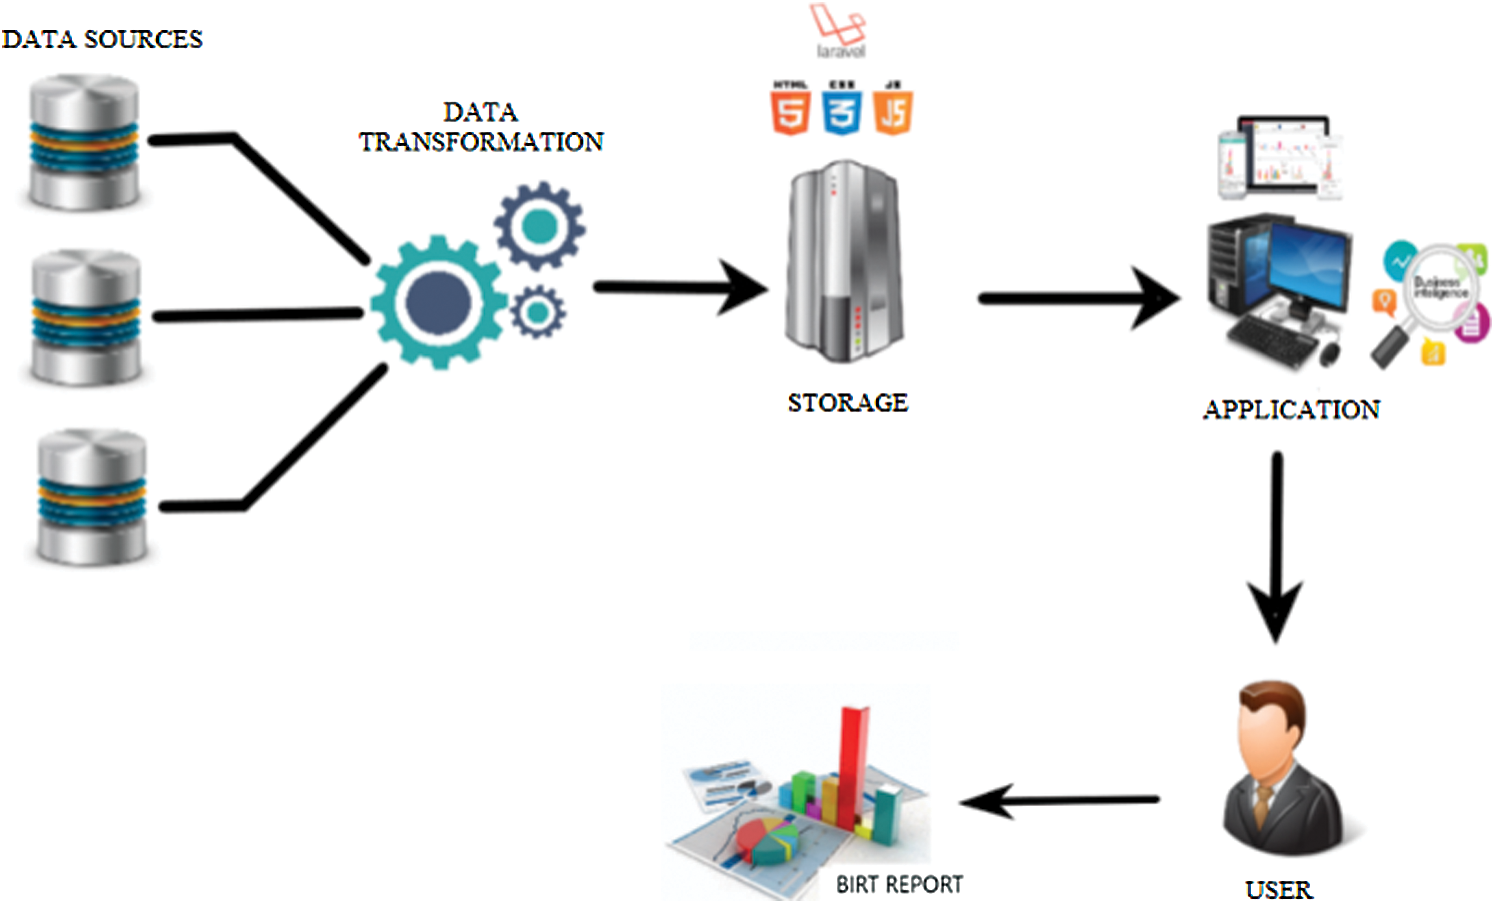
Figure 5: Architecture of the design proposed
According to the proposal, the design of the commercial web application provides daily and consolidated monthly information according to the required criteria. The application will be available 24/7, which will enable easy commercial campaigns to increase customer base.
Through this app, organizations can obtain data from all customers who in 2018 purchased the products at discount in order to encourage customers to keep using the same store, e.g., LA 14 (local supermarket chain). This is a way of implementing a strategy of promoting products that have discounts. This strategy is a win-win situation and therefore extremely important for organizations.
The use of the application will be by the top managers. The app will provide information to assist major decisions in management committees. It will include a perspective of the current profitability of the entity and the impact of customer behavior on it. The relationship will be perceived as behavior vs. products, which will provide a broad framework for reviewing market trends.
Due to the defined architecture, we will have clear and concise customer information. The transformation processes of ELTA guarantee real, current, and necessary data for the information reports in the application. The user will have reports at hand in a few seconds (thanks to OLAP) with which they will be able to define strategies that increase the profitability of the entity and meet the objectives of the company.
According to the process of the methodology detailed above, the results that will be obtained in each proposed step are as follows.
Data extraction, data cleansing, data integration, and efficient storage and maintenance of large amounts of data. For this characteristic, the ELTA technique will be used.
The main sources of customer data will be as follows.
Name, age, gender, stratum and address of residence, preferred aspects.
Services and products acquired with the organization in the last five years, including the movements made for each product.
Information queries, report generation, and data visualization functions.
Extraction of useful information (knowledge) from the rapidly growing volumes of digital data in the databases.
Through this paper, we are presenting the design of a commercial web application based on business intelligence oriented to the decision making by senior management in order to generate strategic information to increase the profits of an organization in the financial sector.
The design, process, and steps to achieve the implementation of a commercial web application based on BI and oriented to financial entities are detailed, and the technologies that should be used and the different tools that must be used are identified. The implementation will provide benefits according to the needs of each company.
The model of the application will provide critical information to increase the number of clients of the desired segment.
Future versions will seek to implement improvements in levels of security and automation of processes in order to provide cleaner and concise information according to the strategic changes that the organization is facing.
This application design was made with contributions from banking sector analysis, specific BI studies, and the information transformation criteria. The results of this research are useful for large companies in the financial sector that are interested in finding commercial strategies based on information and reducing investment in the internal development of their information systems. In addition, the proposed application increases customer satisfaction and manages to solve their needs. So, the number of customers who are interested in acquiring products from the company will grow.
Funding Statement: This research was supported by the General Research Direction of the Universidad Santiago de Cali, which financed a research project to the COMBA I+D research group. URL: https://www.usc.edu.co/
Conflicts of Interest: The authors declare that they have no conflicts of interest to report regarding the present study.
1. A. Marinheiro and J. Bernardino. (2015). “Experimental evaluation of open source business intelligence suites using OpenBRR,” IEEE Latin America Transactions, vol. 13, no. 3, pp. 810–817. [Google Scholar]
2. I. B. Corporation. (2018). “International Business Machines Corporation (IBM),” . [Online]. Available: www.ibm.com. [Google Scholar]
3. D. Durante, S. Paganin, B. Scarpa and D. B. Dunson. (2016). “Bayesian modeling of networks in complex business intelligence problems,” Journal of the Royal Statistical Society—Series C, Applied Statistics, vol. 12, no. 3, pp. 555–580. [Google Scholar]
4. L. Zhu, Y. Wu, K. Gai and K. Choo. (2018). “Controllable and trustworthy blockchain-based cloud data management,” Future Generation Computer Systems, vol. 91, no. 6, pp. 527–535. [Google Scholar]
5. B. Tüccaroğlu and N. Müesser. (2016). “The readiness of banks for the application of business intelligence solutions,” in Conf. HONET-ICT, Cyprus. [Google Scholar]
6. A. V. Gorlatykh and S. V. Zapechnikov. (2017). “Challenges of privacy-preserving olap techniques,” in IEEE Conf. of Russian Young Researchers in Electrical and Electronic Engineering, St. Petersburg, pp. 621–632. [Google Scholar]
7. I. Eclipse Foundation. (2018). “Eclipse—(The Eclipse Foundation),” . [Online]. Available: http://www.eclipse.org/birt/about/. [Google Scholar]
8. S. Bagheri and A. Shameli-Sendi. (2018). “Software project estimation using improved use case point,” in IEEE 16th Int. Conf. on Software Engineering Research, Management and Applications, USA, pp. 143–150. [Google Scholar]
9. T. P. Liang. (2018). “Research landscape of business intelligence and big data analytics: A bibliometrics study,” Expert Systems with Applications, vol. 111, no. 3, pp. 2–10. [Google Scholar]
10. A. D. Patil and N. Gangadhar. (2016). “Olaas: Olap as a service,” in IEEE Int. Conf. on Cloud Computing In Emerging Markets, Bangalore, pp. 556–720. [Google Scholar]
11. P. Marín-Ortega, V. Dmitriyev, M. Abilov and J. Gómez. (2014). “ELTA: New approach in designing business intelligence solutions in era of big data,” Procedia Technology, vol. 16, no. 7, pp. 667–674. [Google Scholar]
12. Y. Ping and J. Hu. (2017). “Olap application in enterprise marketing management system,” in 3rd Int. Conf. on Systems and Informatics, Shanghai, pp. 132–320. [Google Scholar]
13. W. Humphrey. (2005). “PSP (smA self-improvement process for software engineers,” In SEI Series in Software Engineering, 1st ed., vol. 6, no. 3, pp. 345–352. [Google Scholar]
14. A. Simon, M. Torres, L. García and R. Ravelo. (2017). “Comparing tabular and multidimentional model in a real bi solution,” IEEE Latin America Transactions, vol. 14, no. 7, pp. 3393–3399. [Google Scholar]
15. N. Anciaux, P. Bonnet, L. Bouganim, B. Nguyen, P. Pucheral et al. (2018). , “Personal data management systems: The security and functionality standpoint,” Information Systems, vol. 80, pp. 13–35. [Google Scholar]
16. G. M. Abdulsahib and O. I. Khalaf. (2018). “Comparison and evaluation of cloud processing models in cloud-based networks,” International Journal of Simulation-Systems, Science & Technology, vol. 19, no. 5, pp. 1123–1136. [Google Scholar]
17. O. I. Khalaf, G. M. Abdulsahib, H. D. Kasmaei and K. A. Ogudo. (2020). “A new algorithm on application of blockchain technology in live stream video transmissions and telecommunications,” International Journal of e-Collaboration, vol. 16, no. 1, pp. 16–32. [Google Scholar]
18. A. D. Salman, O. I. Khalaf and G. M. Abdulsahib. (2019). “An adaptive intelligent alarm system for wireless sensor network,” Indonesian Journal of Electrical Engineering and Computer Science, vol. 15, no. 1, pp. 142–147. [Google Scholar]
19. O. I. Khalaf, G. M. Abdulsahib, B. M. Sabbar. (2020). “Optimization of wireless sensor network coverage using the bee algorithm,” Journal Information Science Engineering, vol. 36, no. 2, pp. 377–386. [Google Scholar]
20. O. I. Khalaf and B. M. Sabbar. (2019). “An overview on wireless sensor networks and finding optimal location of nodes,” Periodicals of Engineering and Natural Sciences, vol. 7, no. 3, pp. 1096–1101. [Google Scholar]
21. O. I. Khalaf, I. O. and G. M. Abdulsahib. (2019). “Frequency estimation by the method of minimum mean squared error and P-value distributed in the wireless sensor network,” Journal of Information Science and Engineering, vol. 35, no. 5, pp. 1099–1112. [Google Scholar]
22. O. I. Khalaf. (2020). “Optimization of wireless sensor network coverage using the bee algorithm,” Journal of Information Science and Engineering, vol. 36, no. 2, pp. 377–386. [Google Scholar]
23. S. Taneja, S. Khanna and S. Tilwalia. (2014). “A review on privacy preserving data mining: Techniques and research challenges,” International Journal of Computer Science and Information Technologies, vol. 5, no. 2, pp. 2310–2315. [Google Scholar]
24. K. A. Ogudo, J. N. Muwawa, I. O. Khalaf and H. D. Kasmaei. (2019). “A device performance and data analytics concept for smartphones’ iot Services and machine-type communication in cellular networks,” Symmetry, vol. 11, no. 5, pp. 593–594. [Google Scholar]
25. O. I. Khalaf, G. M. Abdulsahib and M. Sadik. (2018). “A modified algorithm for improving lifetime wsn,” Journal of Engineering and Applied Sciences, vol. 13, no. 7, pp. 9277–9282. [Google Scholar]
26. S. SE. (2018). “Crystal report—(SAP SE),” . [Online]. Available: https://www.crystalreports.com/reports/. [Google Scholar]
27. D. Fisher, S. Drucker and M. Czerwinski. (2016). “Business intelligence analytics,” IEEE Computer Graphics and Applications, vol. 34, no. 5, pp. 22–24. [Google Scholar]
28. Jaspersoft Community. (2018). “TIBCO Software Inc,” . [Online]. Available: https://community.jaspersoft.com/. [Google Scholar]
29. PacifiTIC. (2019). “PacifiTIC, El Cluster TIC del Pacífico Colombiano,” . [Online]. Available: https://pacifitic.org/. [Google Scholar]
30. IBM. (2019). “IBM,” . [Online]. Available: https://www.ibm.com/. [Google Scholar]
31. L. Chiang, B. Lu and I. Castillo. (2017). “Advances in big data analytics at the dow chemical company,” in Control of Industrial Processes, Taiwan, pp. 1122–156. [Google Scholar]
32. K. Rajasekharaiah, C. S. Dule and P. Srimani. (2016). “Crsa cryptosystem based secure data mining model for business intelligence applications,” in Int. Conf. on Electrical, Electronics, and Optimization Techniques, Chennai, pp. 1567–1589. [Google Scholar]
33. IBM. (2016). “IBM,” . [Online]. Available: https://www.ibm.com/. [Google Scholar]
34. S. Pandey, S. Nepal and S. Chen. (2011). “A test-bed for the evaluation of business process prediction techniques,” Networking Applications and Worksharing, vol. 1, no. 3, pp. 189–215. [Google Scholar]
35. O. Corporation. (2018). “MySQL (Oracle Corporation y/o Sus Afiliados),” . [Online]. Available: https://www.mysql.com/. [Google Scholar]
36. L. Duan and L. Da Xu. (2013). “Business intelligence for enterprise systems: a survey,” IEEE Transactions on Industrial Informatics, vol. 8, no. 3, pp. 679–687. [Google Scholar]
 | This work is licensed under a Creative Commons Attribution 4.0 International License, which permits unrestricted use, distribution, and reproduction in any medium, provided the original work is properly cited. |