DOI:10.32604/cmc.2021.014628
| Computers, Materials & Continua DOI:10.32604/cmc.2021.014628 | |
| Article |
Epidemic Spreading–Information Dissemination Coupling Mechanism in Heterogeneous Areas
School of Economics and Management, China University of Geosciences (Beijing), Beijing, 100083, China
*Corresponding Author: Haiyan Liu. Email: liuhy@cugb.edu.cn
Received: 04 October 2020; Accepted: 07 January 2021
Abstract: With COVID-19 continuing to rage around the world, there is a spread of epidemic-related information on social networking platforms. This phenomenon may inhibit or promote the scale of epidemic transmission. This study constructed a double-layer epidemic spreading–information dissemination network based on the movements of individuals across regions to analyze the dynamic evolution and coupling mechanism of information dissemination and epidemic transmission. We also proposed measures to control the spread of the epidemic by analyzing the factors affecting dynamic transmission. We constructed a state probability equation based on Markov chain theory and performed Monte Carlo simulations to demonstrate the interaction between information dissemination and epidemic transmission. The simulation results showed that the higher the information dissemination rate, the larger the scale of information dissemination and the smaller the scale of epidemic transmission. In addition, the higher the recovery rate of the epidemic or the lower the infection rate of the epidemic, the smaller the scale of information dissemination and the smaller the scale of epidemic transmission. Moreover, the greater the probability of individuals moving across regions, the larger the spread of the epidemic and information. Finally, the higher the probability of an individual taking preventive behavior, the smaller the spread of the epidemic and information. Therefore, it is possible to suppress epidemic spread by increasing the information dissemination rate, epidemic recovery rate, and probability of individuals taking preventive behavior, while also reducing the infection rate of the epidemic and appropriately implementing regional blockades.
Keywords: Coupling mechanism; moving and regional individuals; heterogenous areas; double-layer coupling network
In the year 2020, a new type of coronavirus pneumonia (COVID-19) swept through the world. As of July 20, 2020, COVID-19 was responsible for more than 16 million infections and 600,000 deaths in more than 200 countries and regions. The number of infections has continued to increase, seriously threatening human life and health. It has also had a significant impact on global economic development. In the information age, when an infectious disease spreads in a society, information about that disease will spread quickly through social platforms, such as Weibo, WeChat, Twitter, and Facebook. The spread of such information can cause changes in human behavior, which can affect the spread of the disease [1,2]. For instance, the outbreak of an epidemic may lead to an increase in people’s awareness of the epidemic and thus cause them to take protective measures, which would inhibit the spread of the epidemic [3]. Because information dissemination and epidemic transmission influence each other, exploring their interaction mechanism holds great significance for understanding and controlling the spread of epidemic [4]. Different countries and regions have taken different measures to deal with the COVID-19 pandemic. Therefore, there is an urgent need to explore the factors affecting the spread of epidemic in the context of epidemic information coupling and to propose measures that can control the spread of COVID-19.
Early studies on epidemic transmission were based on using differential equations to construct infectious epidemic models [5–9], including the susceptible-infected (SI), susceptible-infected-susceptible (SIS), and susceptible-infected-recovered (SIR) models. The main shortcoming of these models is that they do not consider the heterogeneity of individual contact. Network theory can provide a new perspective for solving this problem [10–12]. In some studies [13–16], the spread of epidemic was simulated and analyzed by establishing infectious epidemic models based on complex networks. For the most part, only one dynamic process of epidemic transmission was studied. Taking into consideration the impact of information dissemination on epidemic transmission, some scholars have proposed a series of models to explore the interaction between multiple dynamic processes. Funk et al. [17] linked the information dissemination model with the SIR model to investigate how the spread of awareness of the epidemic affected the spread of the epidemic itself. The authors considered that susceptible individuals who had information about the disease were less likely to be infected when they came into contact with infected individuals. Ruan et al. [18] studied how the spread of individual crisis awareness affected the spread of epidemic. By using the information-driven vaccination SIR model based on the homogeneous Erdös–Rényi network and the heterogeneous scale-free network, they found that the greater the information creation rate and information sensitivity, the clearer the effect of suppressing the spread of epidemic. However, these studies mainly used a single-layer network model to explore the interaction between information dissemination and epidemic transmission. They did not consider clear structural differences between the information dissemination network and the disease transmission network. To address this shortcoming, some scholars explored the coupling effect of epidemic transmission and information dissemination using a multilayer network. Granell et al. [19] proposed an unaware-aware-unaware + susceptible-infected-susceptible (UAU+SIS) model based on multiplex networks to describe the coevolution of awareness of diffusion and the spread of the epidemic. Through Monte Carlo simulation, they found that the coupled dynamic process changed the outbreak threshold of the epidemic. However, in this study they assumed that the infected individuals were immediately conscious of their state and that these conscious individuals could be immune to the disease. To explore epidemic information dissemination in general, Granell et al. [20] added mass media to the UAU+SIS model to disseminate information on a large scale. They found that the degree of immunity of informed individuals and the mass media changed the metacritical point of the epidemic’s spread. The multilayer network structures used in these studies were static, whereas the contact network between individuals changed dynamically over time.
Some scholars have considered the mobility of individuals and explored the interaction between information dissemination and epidemic transmission by constructing dynamic multilayer networks. For instance, Xia et al. [2] considered the epidemic spread–information dissemination coupling process in the case of individuals moving randomly. Mao [21] constructed a triple-diffusion model of infectious diseases, information, and preventive behaviors through a metropolitan social network on the premise that individuals move between workplaces, homes, service locations, and neighbors. They used an agent-based method to simulate the triple diffusion. Not only do individuals move, but the distribution of individuals is regional, and the characteristics of disease transmission in different regions and their overall impact may be different. Buscarino et al. [22] studied the local and global scales of epidemic transmission, taking into consideration that different areas had different infection levels. They found that the faster the individual moved, the greater the probability that individuals executed long-distance jumps, the greater the regional density, and the more likely a global outbreak was to occur. Tian et al. [23] studied the dynamic transmission process of infectious epidemic between heterogeneous individuals in a limited open area. They found that the average infection probability of individuals, population size of infected individuals in the region, and infectious ability of the epidemic had a great impact on the scale of the outbreak. However, these studies only paid attention to individual mobility or regionality, and they did not combine these two factors to explore their joint impact on epidemic and information dissemination.
To overcome these shortcomings, we studied the impact of both individual mobility and regionality on the dynamics of epidemic transmission and information dissemination. We constructed a double-layer epidemic spread–information dissemination network model to study the interaction between epidemic transmission and information dissemination when individuals move and when their distribution is regional. By analyzing the factors that affect the dynamic transmission, we propose measures to control the spread of the epidemic. In the coupled dynamics model, we used the Markov state transition equation to calculate the probability that an individual was in a certain state at different time steps. We also conducted Monte Carlo simulations to demonstrate the process of interaction between information dissemination and epidemic transmission. This research not only supplements previous dynamic network research, but it also provides suggestions for the formulation of infectious epidemic control measures.
The rest of this article is organized as follows. Section 2 introduces the constructed model. Section 3 presents the simulation results and results analysis. Section 4 offers the main conclusions and directions for future research.
This research mainly involves two models: (1) An epidemic spread–information dissemination network model that is used to describe the real-life social relationships between people and their physical contacts; and (2) an epidemic spread–information dissemination dynamics model that is used to describe the spread of information and the epidemic among the population and the process of individual state changes.
2.1 Epidemic Spread–Information Dissemination Coupling Network
We constructed an epidemic spread–information dissemination coupling network by modifying the double-layer network model based on moving individuals proposed by Xia et al. [2]. In this work, we considered both the mobility of individuals and the regionality of individuals’ activities. The proposed epidemic spread–information dissemination coupling network is shown in Fig. 1a. The model consists of two layers: The upper layer, which is the information layer, and the lower layer, which is the epidemic layer. The upper and lower layers represent the social network and physical contact network, respectively. In Fig. 1a, network nodes are represented as circles and the connections between the nodes of different layers are represented by dotted lines, indicating that these nodes are the same individual. We assumed that the network structure of the information layer was static in the short term because the social relationships between people are generally relatively stable in the short term. Conversely, the network structure of the epidemic layer changed dynamically because in real life, people commonly move because of different factors, such as work, life, and travel. They will meet different people at different times, which causes the structure of the physical contact network to change constantly.
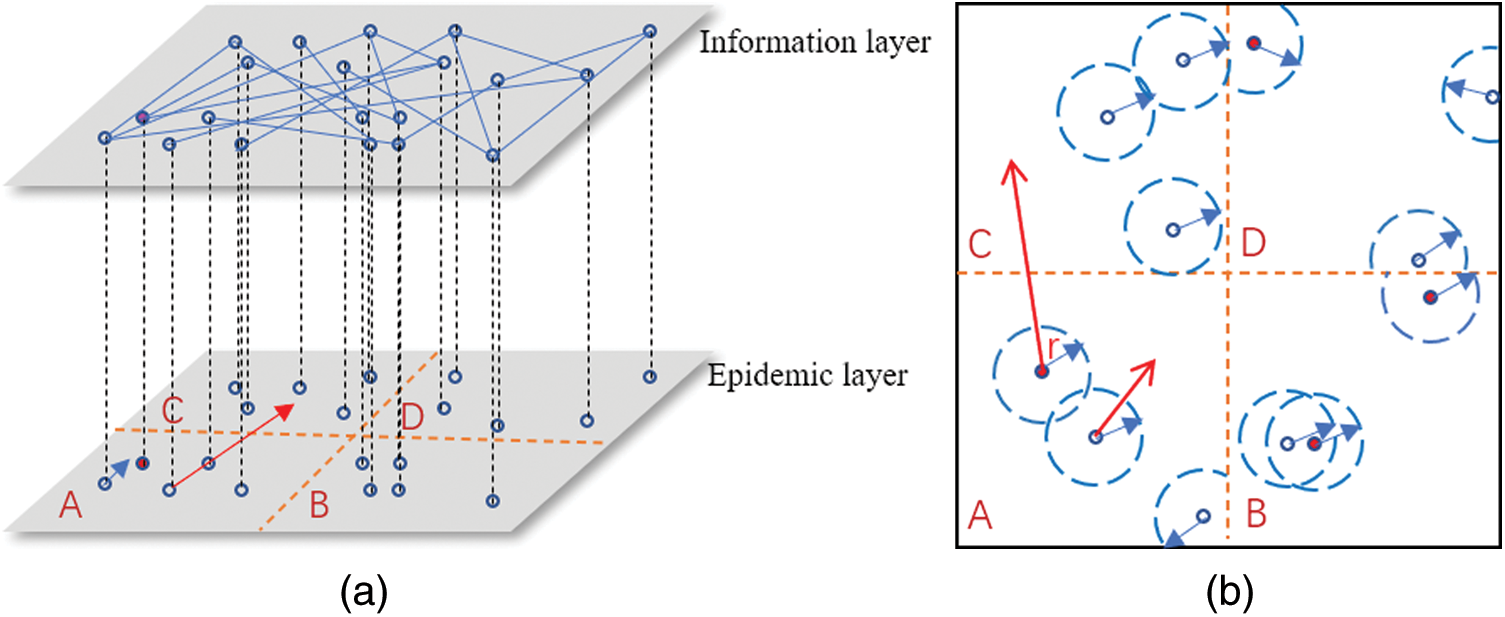
Figure 1: (a) Double-layer epidemic spread–information dissemination coupling network. (b) Physical contact network of the epidemic layer
The physical contact network of the epidemic layer is shown in Fig. 1b. Consider a square area with a side length L where N individuals are randomly distributed. The square area consists of four areas of the same size, which are denoted as area A, area B, area C, and area D. Assume that at a certain time t, when the distance between any two nodes is less than r, there is a physical contact relationship between the nodes. Then, a link is added between them to obtain the physical contact network at time t. Because of the mobility of individuals, it is assumed that at each moment, individuals choose to move across regions by a long-distance movement with the probability of  or within the region they belong to by a short-distance movement with the probability of
  . A movement is considered to be a long-range movement only when an individual moves between different regions; in all other cases, a movement is considered to be a short-range movement. The position of a node (an individual) that performs a short-range movement is determined by its position at the previous time step and the angle and speed of the movement. Assuming that individual i moves a short distance at time t, its position is Pi(t), and its moving speed and direction are expressed as
  and
and  , respectively. The moving speed of an individual at time t is
  , so the position and orientation of individual i at time (t + 1) can be expressed as follows:

where  denotes a random variable that obeys a uniform distribution in the interval of [
 ,
,  ], and
  represents the time interval (time step) of the individual’s movement. The moving distance of individual i in the horizontal direction in a time step is expressed as
  , and the moving distance in the vertical direction is expressed as
  . When individual i chooses to move a long distance across regions at time t, it will randomly choose a position in the other three regions as its spatial position at time (t + 1). When the probability
  of all of the nodes in a certain area is zero, it is assumed that the area is subjected to blockade measures, so points from other areas cannot jump to this area. When the spatial position of a node changes, the physical contact relationships between nodes also change. Thus, at time (t + 1), a new physical contact network is constructed. Finally, when the physical contact network containing N nodes is constructed, the corresponding social network can be constructed. Because social networks are generally scale-free networks, in the simulation process, a Barabási–Albert (BA) scale-free network with N nodes is used to generate social networks.
2.2 Epidemic Spread–Information Dissemination Dynamics
In this study, we assumed that the dynamics of information dissemination in social networks could be described by the SIR model. Based on this assumption, individuals in the information layer could be in one of three states: Susceptible state UI, infection state AI, or recovery state NI. State UI means that individuals have not received epidemic-related information. State AI represents that individuals have received epidemic-related information. State NI means that individuals have received epidemic-related information but do not pass that information to others. The subscript I indicates the information layer. The specific information dissemination dynamics are shown in Fig. 2a. When an individual in state UI is in contact with an individual in state AI, the individual in state UI can change its state to state AI with the probability of  . An individual in state AI can change its state to state NI with the probability of
  . Once an individual changes its state to state NI, it remains in this state; that is, its state cannot be further changed.
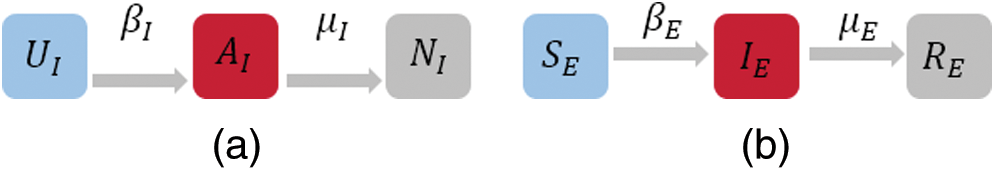
Figure 2: (a) Node state transition diagram of the information layer. (b) Node state transition diagram of the epidemic layer
The transmission dynamics of the epidemic can also be described by the SIR model, as shown in Fig. 2b. The states of individuals in the epidemic layer can be divided into three categories: Susceptible state SE, infection state IE, and recovery state RE. Individuals in state SE are not sick, yet they can be infected by sick contacts with a certain probability. Individuals in state IE are sick and can infect their neighbors. Individuals in state RE are no longer infected and cannot infect other individuals. The subscript E indicates the epidemic layer. We assume that the probability of a susceptible individual being infected after having contact with an infected individual is  . The probability of an infected individual entering a recovery state is
  .
.  denotes the infection rate of the epidemic.
  denotes the recovery rate of the epidemic. The spread of information can affect the spread of the epidemic. In this work, it is assumed that individuals who are not infected but receive information related to the epidemic will take preventive actions with the probability of
  . The protection rate of preventive behaviors is set to 60%; that is, when susceptible individuals who have taken preventive behaviors come into contact with infected individuals, the probability of being infected (
 ) will become 40% of the original probability.
The processes of information and epidemic transmissions are expressed by dynamic equations. Two vectors,  and
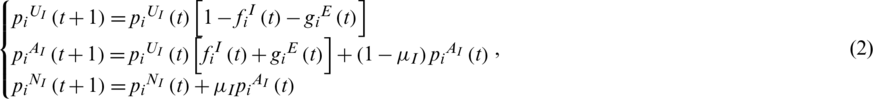
and  , are used to represent the probability that node i is in state AI, UI, or NI in the information layer at time t and the probability that the node is in state SE, IE, or RE in the epidemic layer, respectively. The transformation equations of each state of node i from time t to time t + 1 are as follows:

where,


 represents the probability that node i is informed by its informed neighbors in the information layer at time t.
  represents the probability that node i is infected by its infected neighbors in the epidemic layer at time t. Iij are the elements of the adjacency matrix of the social network. If there is a link between nodes i and j in the information layer, then Iij = 1; otherwise, Iij = 0. Eij(t) are the elements of the adjacency matrix of the physical contact network at time t. If there is a link between nodes i and j in the epidemic layer at time t, then
  ; otherwise,
  .
.
When calculating and simulating the model, at the initial moment, we randomly selected a certain percentage of individuals as infected people at the epidemic layer, and these individuals became infected at the information layer. The remaining individuals were susceptible both at the epidemic layer and the information layer. The states of individuals at different layers changed based on the information and epidemic transmission dynamics until there were no more infected people at the epidemic layer and the information layer.
3 Simulation Results and Analysis
In general, the population density of a region and the population density of an infected population were different. Therefore, we simulated the coupling and spread of information and the epidemic in a heterogeneous region. First, based on the BA model, we generated a social network with 1,000 nodes by introducing one node and three links into the network at each time step. To generate the corresponding physical contact network, we constructed a square area with a side length of  and divided it into four equal areas, denoted as A, B, C, and D. We used a random function to generate 1,000 nodes that met the coordinate interval of the corresponding area. When the distance between the nodes was within the radius of the interaction, we established links between them to obtain the physical contact network. The node density of the entire region was one. The node density was defined as the ratio of the total number of nodes in the region to the area of the region. In this work, we considered that there was no specific distribution form for the coordinate values of the randomly generated points. We also conducted simulations using random coordinate values that obeyed a uniform distribution, beta distribution, and normal distribution. These different distribution forms had influenced the accuracy of the simulation results but did not affect the regularity of the influence of the parameters on the results. To study more general cases, we selected coordinate values without specific distribution forms. After building the social network and physical contact network, we analyzed the impacts of the following factors on epidemic transmission and information dissemination: Different cross-regional jump probability, information dissemination rate, information recovery rate, epidemic transmission rate, epidemic recovery rate, and the probability of taking preventive behaviors. We obtained all of the simulation results based on the assumption that at the initial moment, 70, 130, 250, and 550 nodes were scattered in areas A, B, C, and D, respectively. The initial number of infected nodes in each area was five. All of the results presented in the following denote the averaged results of 20 experiments.
The simulation was first conducted using the following parameter values:  ,
,  ,
,  ,
,  , r = 1,
  , v = 0.03, and
  . The changes in the density of nodes in different states in the information and epidemic layers with time are presented in Fig. 3, which shows that the density of nodes in state UI gradually decreased and finally reached steady state. The density of nodes in state RI first gradually increased and then reached steady state. The density of nodes in the state of disseminating information increased sharply in a short period of time and then slowly decreased until it reached a value of zero. The peak density of nodes in the information layer in the state of disseminating information was 27%, and the scale of information dissemination was 87.9%. The density of nodes in the susceptible state in the epidemic layer gradually decreased with time until it reached steady state. The density of nodes in the recovery state gradually increased with time until it reached steady state. The density of infected nodes reached the peak value in a short period of time and then slowly decreased until it reached a value of zero. The highest density of infected nodes was 37%, and the scale of the epidemic spread was 63.8%. By combining the node densities corresponding to various states in each area given in Figs. 3c–3f, we concluded that the node density of an area had a significant influence on the spread of the epidemic. As mentioned earlier, the initial number of infected nodes was the same in the four areas, but the node densities were different. The node density increased from area A to area D. In area A, where the node density was very low, the peak and scale of the epidemic infection were very small. In addition, we did not observe any large-scale outbreaks in areas B and C. However, in area D, which had the highest node density, there was a large-scale outbreak. The peak density of infected people exceeded 60%, and the spread of the epidemic was close to 100%.
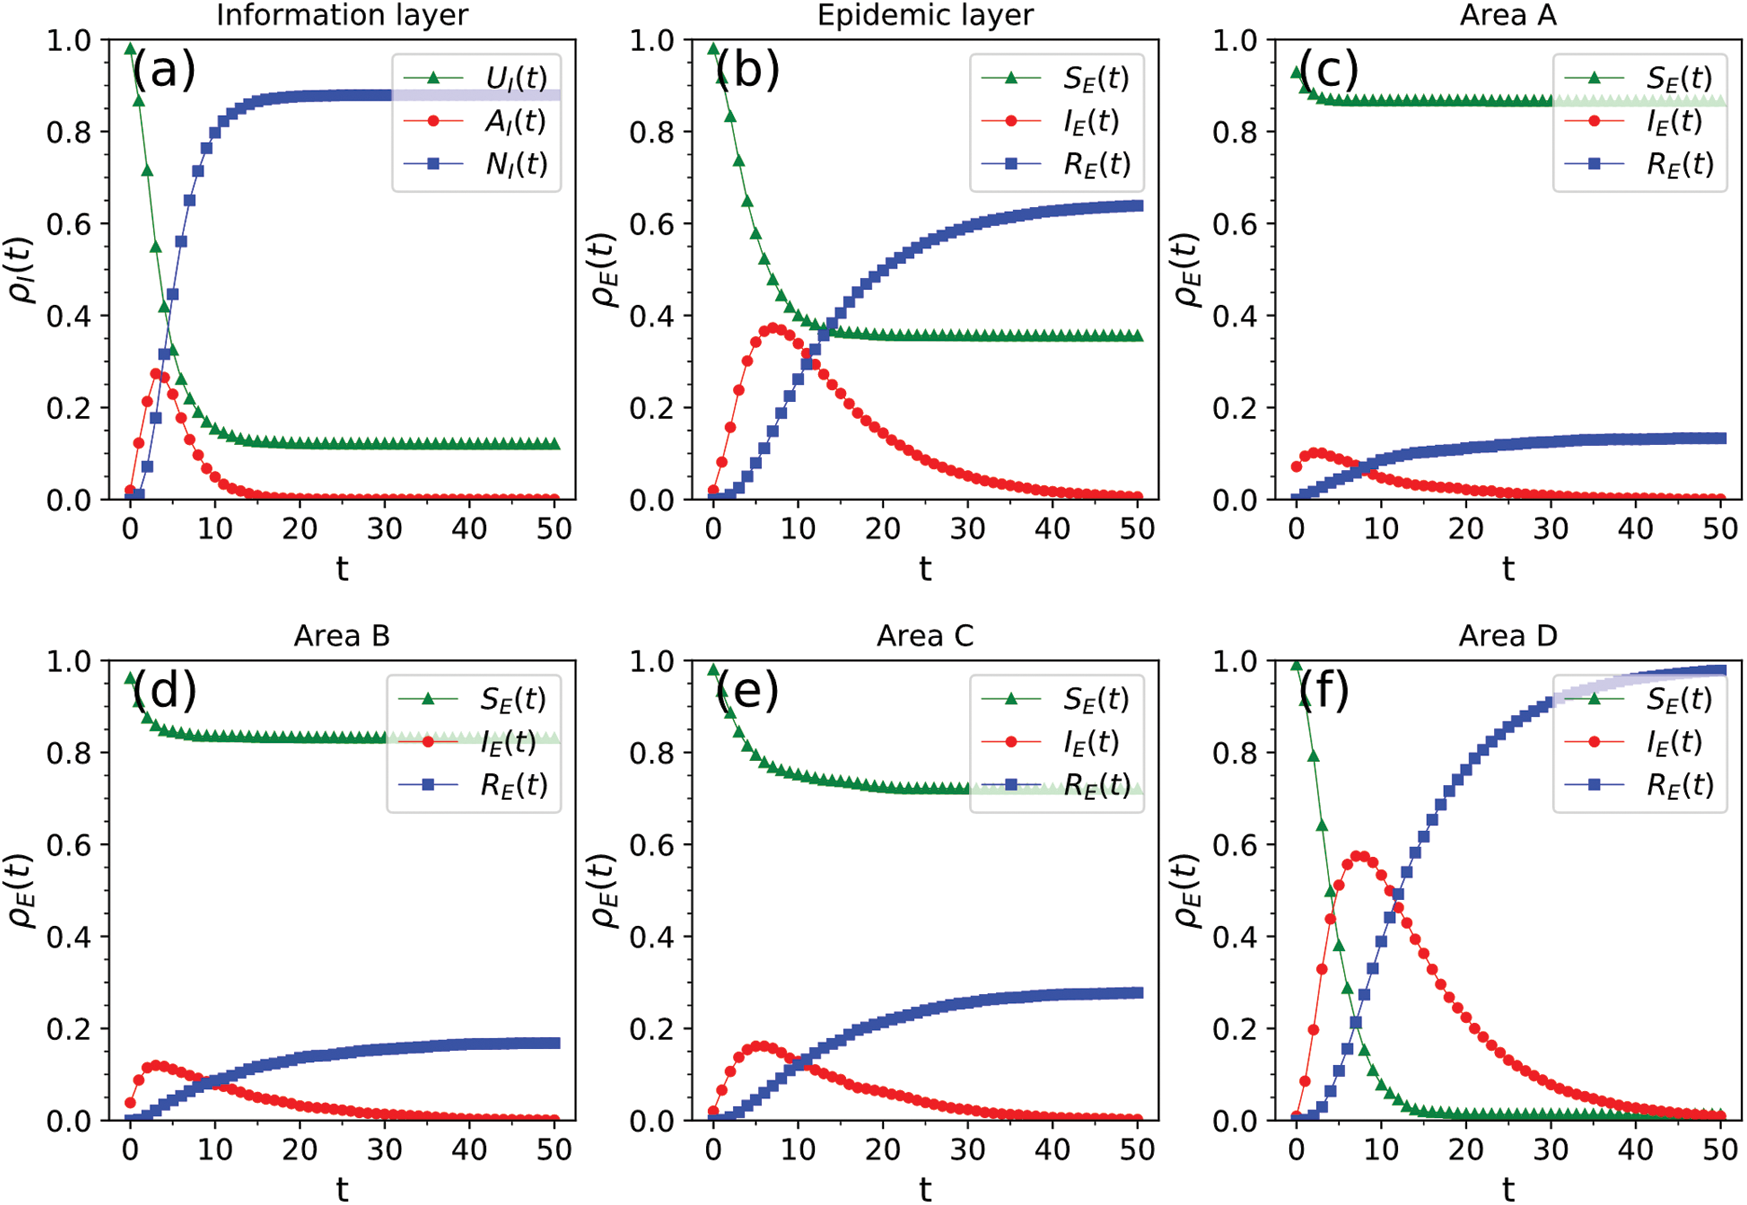
Figure 3: Information and epidemic transmission process. (a) Spread of information in the entire area. (b) Spread of the epidemic in the entire area. (c)–(f) Spread of the epidemic in areas A–D
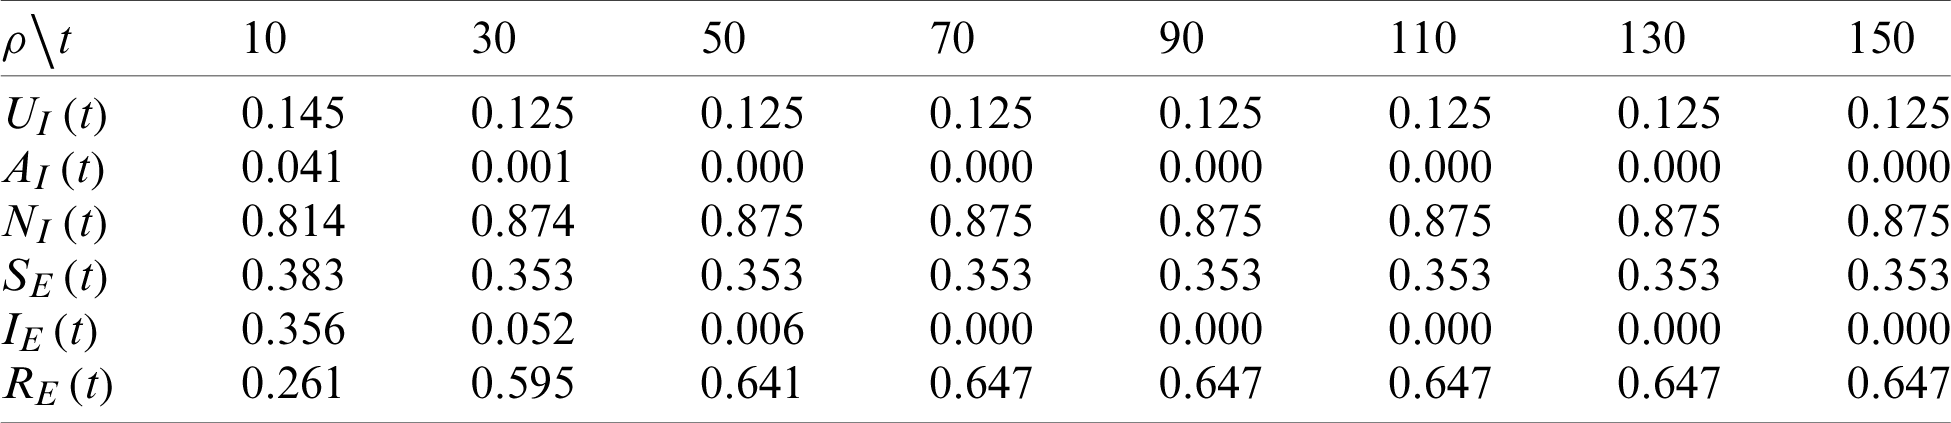
We also analyzed the convergence of the above model. We extracted the node density values of the information layer and the epidemic layer in each state at different time steps. If the density of nodes in each state eventually reaches a stable state over time, it indicates that the model is convergent. The convergence analysis results are presented in Tab. 1, which shows that for both the information layer and the epidemic layer, steady state was reached at 50 timesteps, and the node density of each state converged to a certain value. In Tab. 1,  ,
,  ,
,  ,
,  , IE(t), and RE(t) represent the node densities in the corresponding states at time t. Considering these results, we set the time step as 50 for all of the subsequent experiments.
Table 1: Convergence analysis results
(1) How does the probability of a node jumping across regions, i.e.,  , affect the spread of the epidemic and information?
First, we studied the dissemination of the epidemic and information for the case in which the cross-region jump probability of nodes in each region was the same. The values of the parameters were as follows:  ,
,  ,
,  ,
,  , r = 1,
  , v = 0.03, and
  . The results are shown in Fig. 4. By comparing the results in Fig. 4 with those presented in Fig. 3, we observed that the cross-regional jump of nodes increased the scale of information dissemination and epidemic spread and greatly increased the overall scale of epidemic infections. Based on the changes in the nodes in each region, the cross-region jumps of nodes increased the scale of epidemic infections in each region. In areas where the population density was very low, the epidemic spread was limited, and its spread was due to the cross-regional jumps of nodes. In this case, the peak density of nodes in state AI of the information layer was 29%, and the scale of information dissemination was 98.9%. The peak density of the infected nodes in the epidemic layer was 49.6%, and the scale of the epidemic spread was 95.7%.
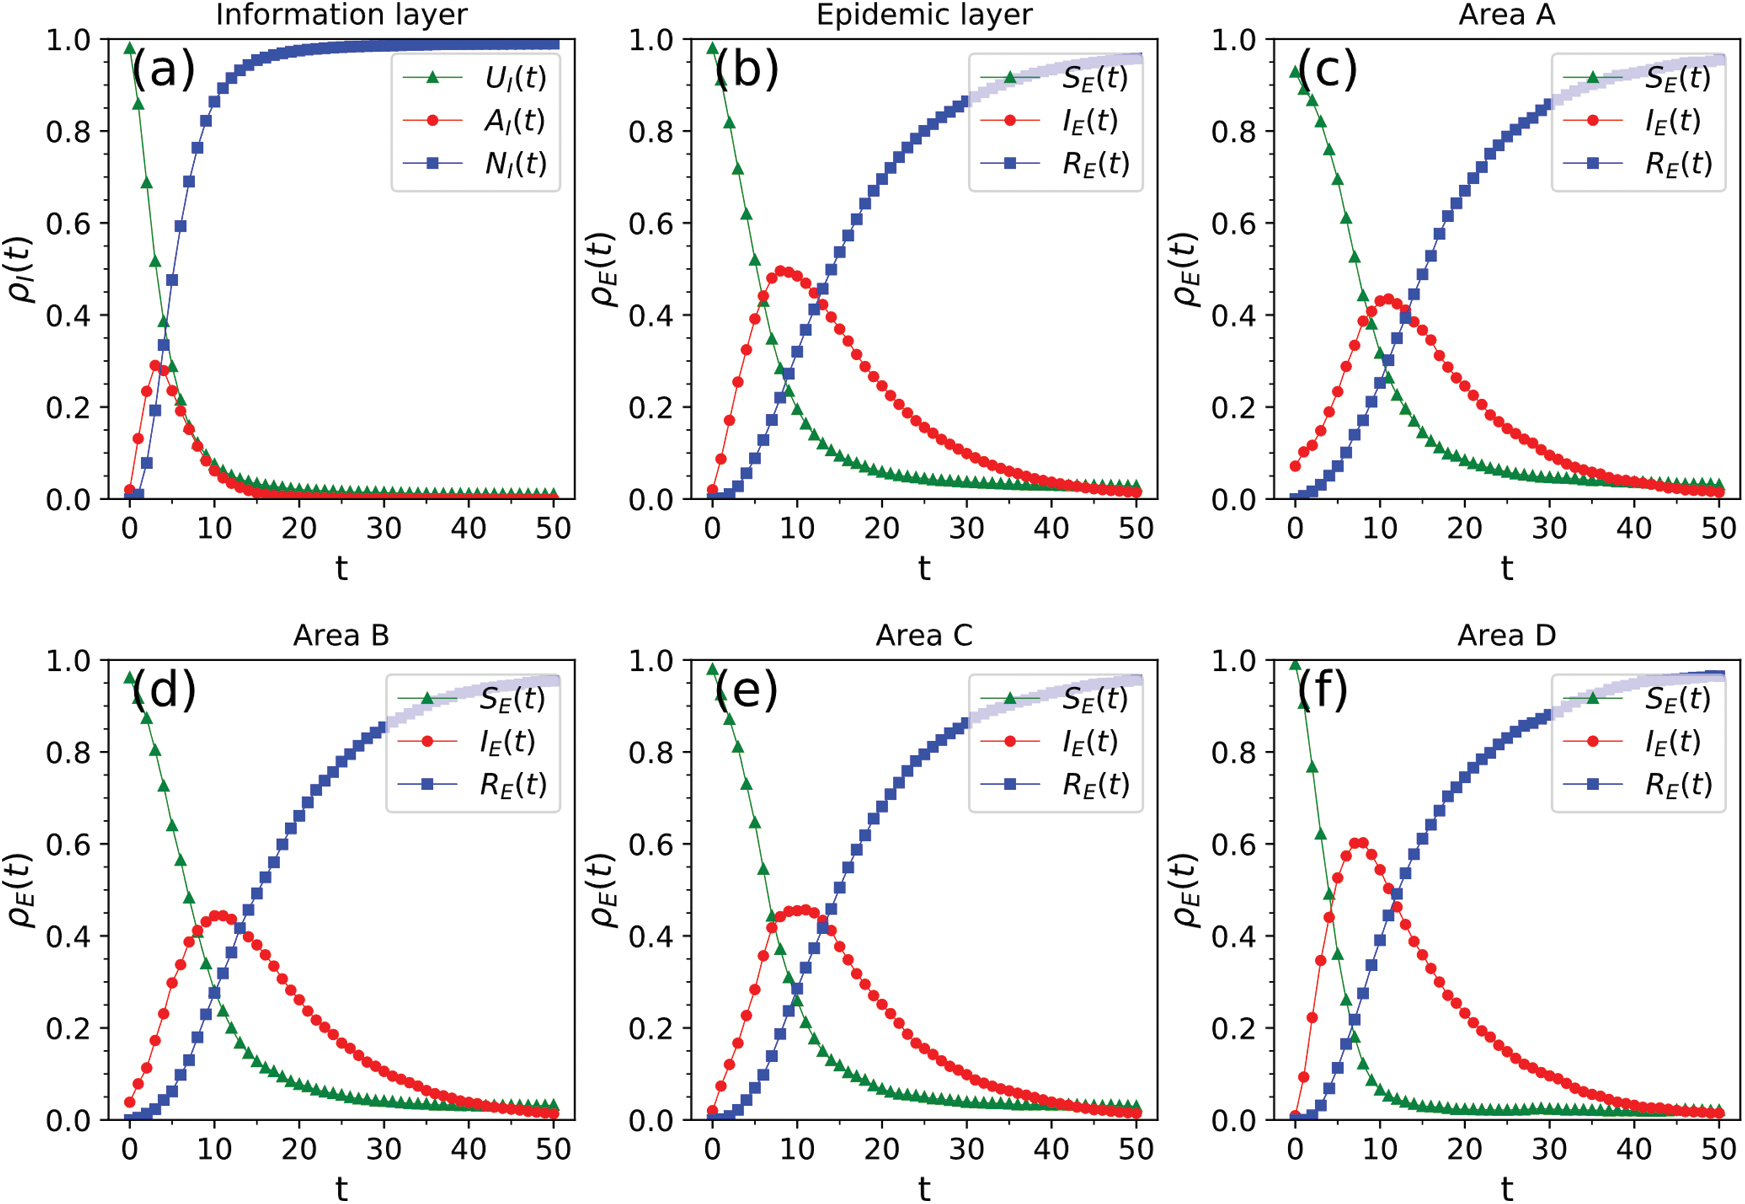
Figure 4: Spread of information and the epidemic at 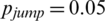 . (a) Spread of information in the entire area. (b) Spread of the epidemic in the entire area. (c)–(f) Spread of the epidemic in areas A–D
Next, we studied the dissemination of the epidemic and information when the cross-region jump probability of each regional node was different. The parameters were set as follows:  ,
,  ,
,  ,
,  , r = 1, v = 0.03, and
  . The probability of a node in areas A and B making a cross-area jump was 0.05, whereas that in areas C and D was zero. The results are shown in Fig. 5. When areas C and D, which had large infection scales, were blocked, the nodes inside them were not allowed to move across areas, and only areas A and B (with small infection scales) were open to each other. In this case, the peak density of nodes in state AI of the information layer was 30%, and the information dissemination scale was 90.7%. The peak density of infected nodes in the epidemic layer was 40.9%, and the epidemic spread was 71.5%. By comparing the results in Fig. 5 with those in Fig. 3, we concluded that the overall scale of the epidemic increased, but this increase was small. By comparing results in Fig. 5 with those in Fig. 4, we observed that blocking areas C and D greatly reduced the scale of epidemic infections.
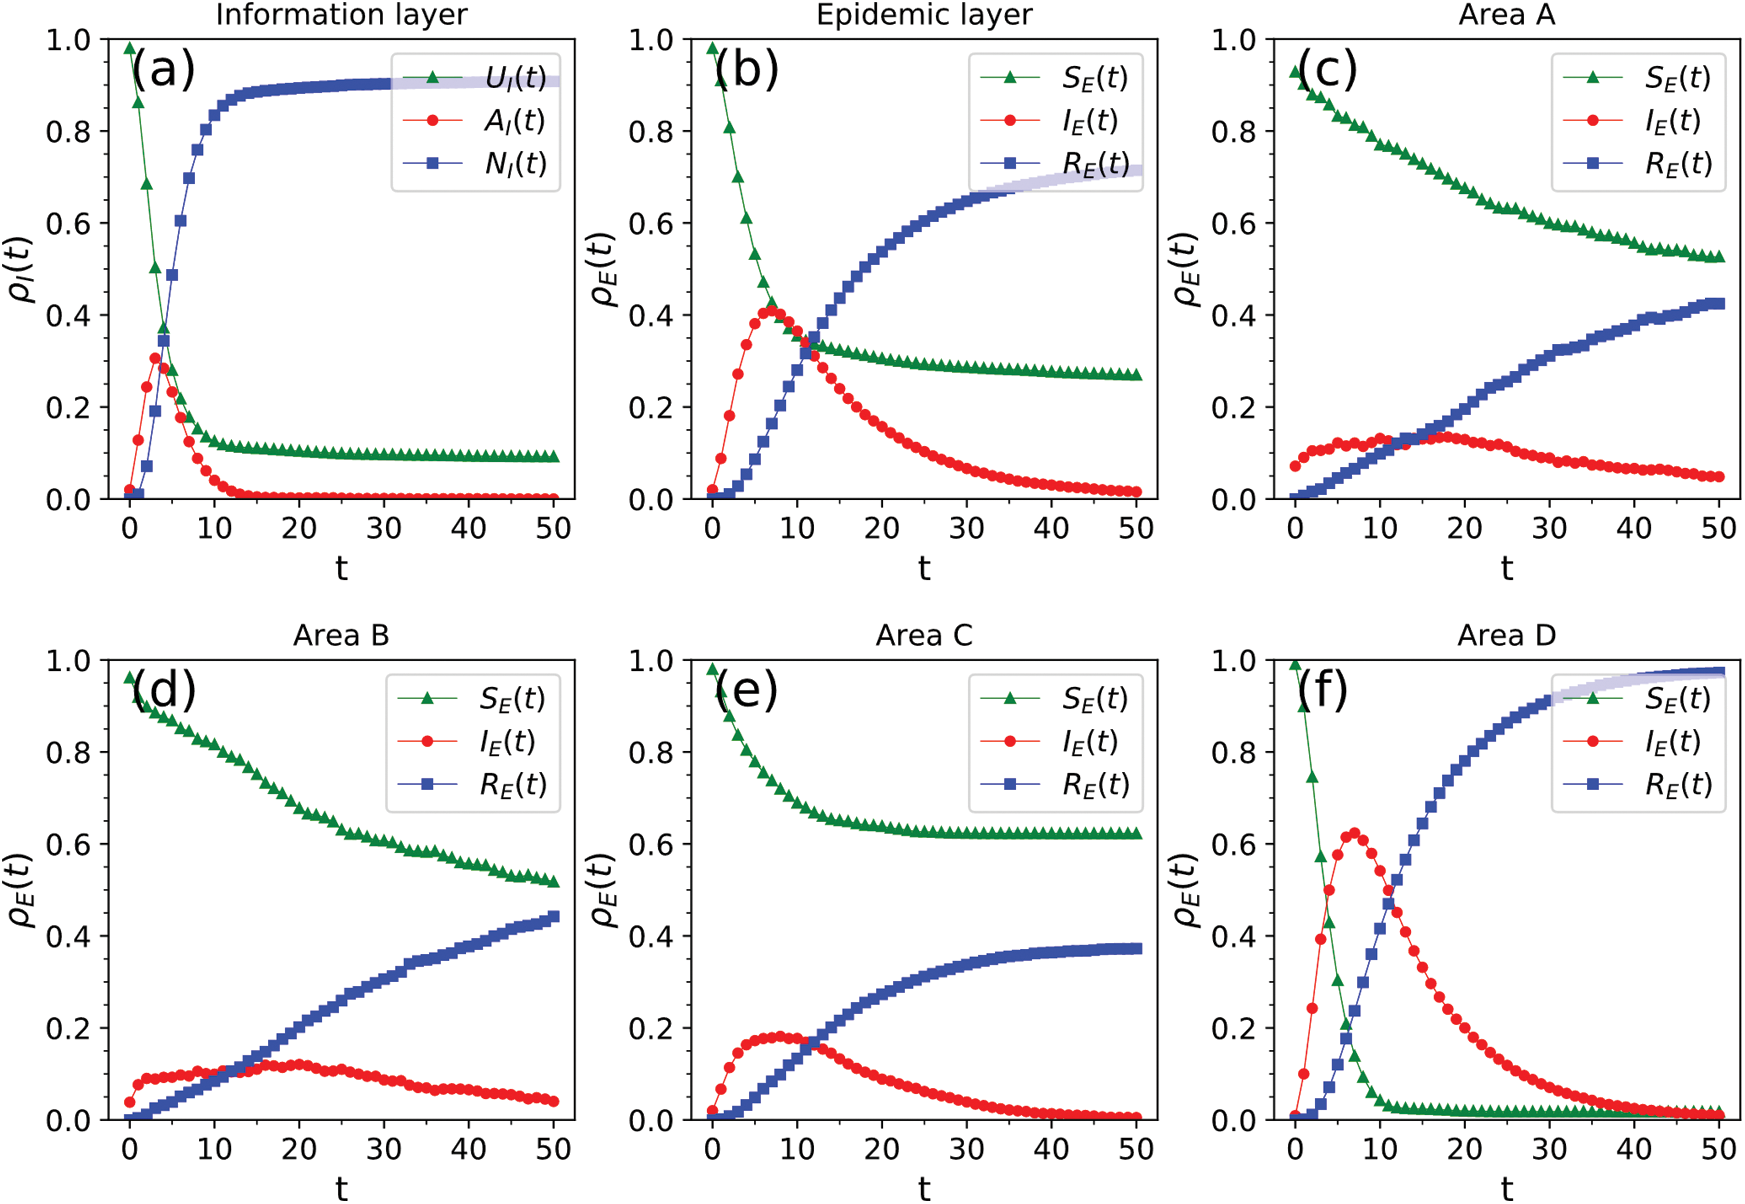
Figure 5: Spread of information and the epidemic at  in areas A and B. (a) Spread of information in the entire area. (b) Spread of the epidemic in the entire area. (c)–(f) Spread of the epidemic in areas A–D
(2) How do the information dissemination rate  and the information recovery rate
  affect the spread of information and the epidemic?
We repeated the simulation by changing the information dissemination rate  ; all the other parameters were constant. The fixed parameter values were
  ,
,  ,
,  , r = 1, v = 0.03,
  , and
, and  , and the values of
  were 0.1, 0.3, 0.5, and 0.7. The change in the infection density of the entire region and each area in the information and epidemic layers over time and the change in the infection scale with the four different values of
  are presented in Fig. 6. It was found that the information dissemination rate increased, the density of nodes in state AI also increased, and the density of nodes in state RI when the dissemination approached its end also increased. The information dissemination rate increased, the density of nodes in state SE decreased, and the density of nodes in state RE when the spread was approaching its end also decreased. The information dissemination rate increased from 0.1 to 0.7; the peak density of nodes in state AI of the information layer increased from 28.4% to 93.7%; and the information dissemination scale increased from 94% to 99%. The maximum density of nodes in the infected state within the epidemic layer decreased from 40.9% to 20.5%, and the scale of epidemic transmission decreased from 81.2% to 65.7%. Note that in the proposed model, individuals who were in state AI and SE at the same time would take preventive measures with a certain probability to reduce the probability of being infected, thereby reducing the scale of epidemic infections.
Figure 6: Impact of the information transmission rate  on information and epidemic transmission. (a) Infection density and scale of information in the entire area. (b) Infection density and scale of disease in the entire area. (c)–(f) Infection density of disease in areas A–D
Next, we conducted a simulation by changing the information recovery rate  ; the other parameters remained fixed. The fixed parameter values were
  ,
,  ,
,  , r = 1, v = 0.03,
  , and
, and  , and the values of
  were as follows: 0.3, 0.5, and 0.7. Fig. 7 presents the following: The change in the infection density of the entire region and each area in the information and epidemic layers over time and the change in the infection scale with the three different values of
  . As shown in Fig. 7, the smaller the information recovery rate, the larger the peak and the final scale of information dissemination in the information layer. However, the inhibitory effect on the entire epidemic layer and the spread of epidemic in each region was not clear. The dissemination of information had reached a certain scale, so even when the information recovery rate decreased, it could not significantly inhibit the spread of the epidemic.
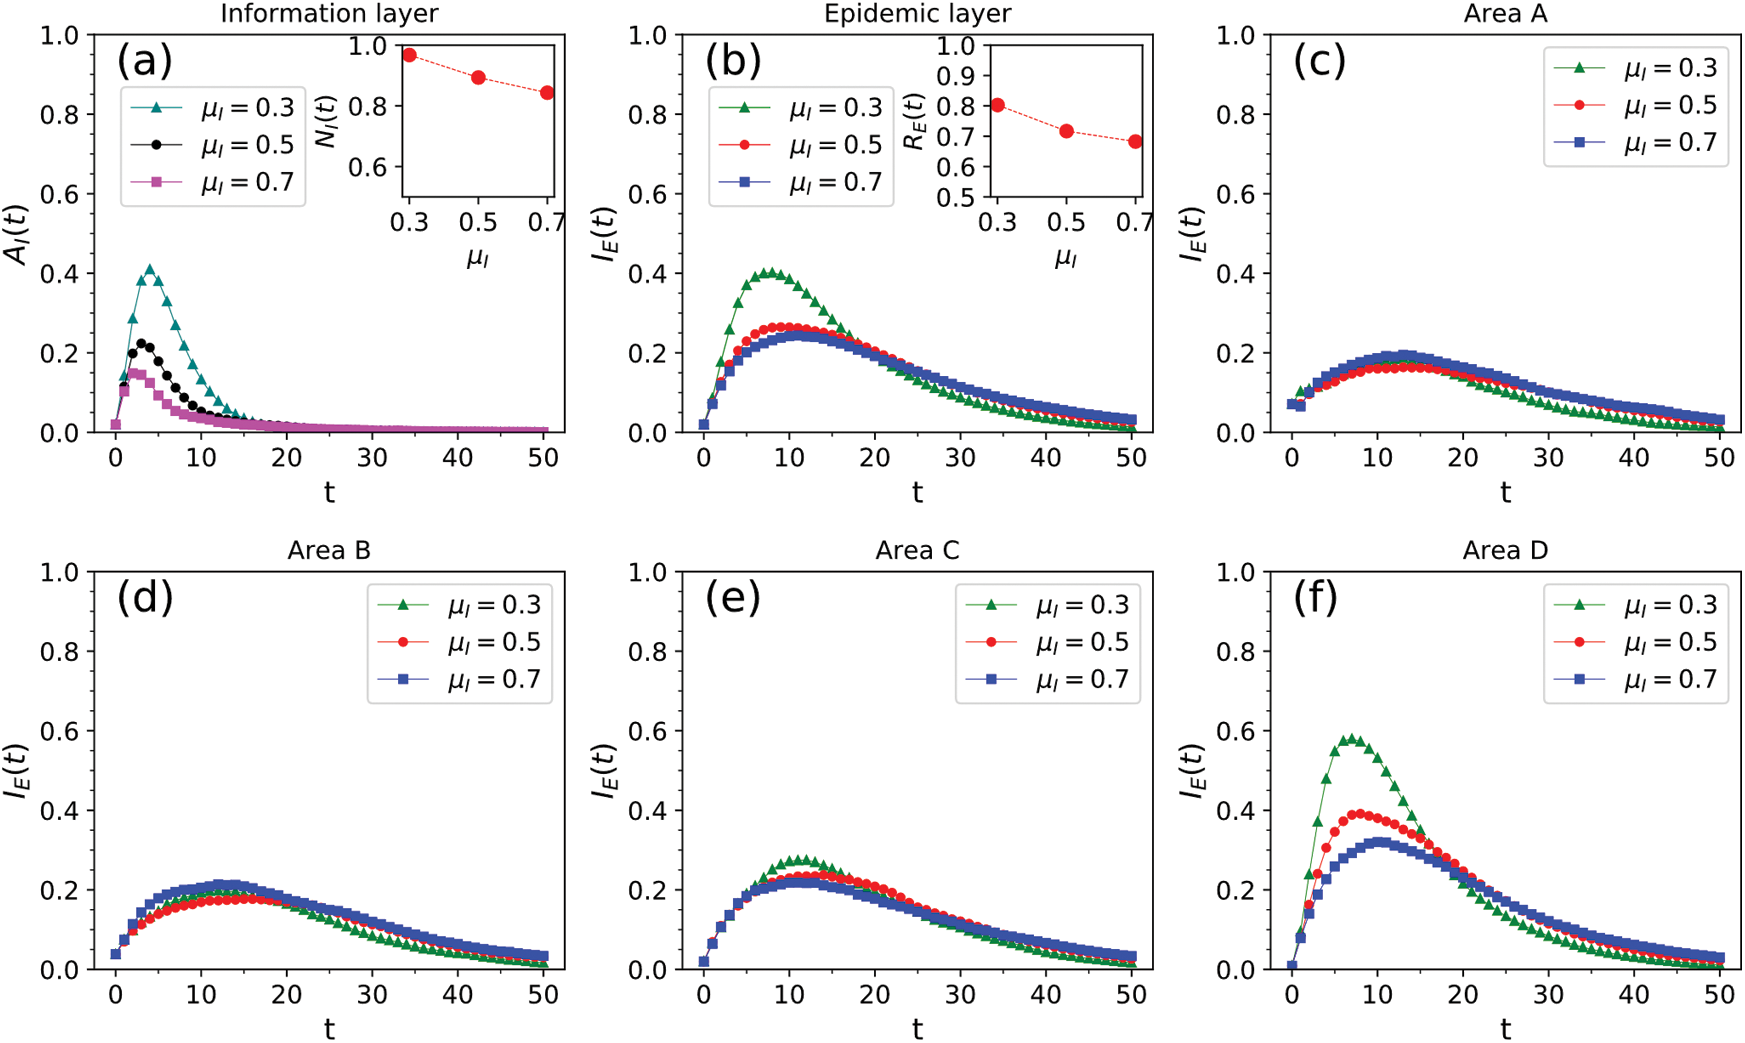
Figure 7: Impact of the information recovery rate  on information and epidemic transmission. (a) Infection density and scale of information in the entire area. (b) Infection density and scale of disease in the entire area. (c)–(f) Infection density of disease in areas A–D
(3) How do the epidemic transmission rate  and the epidemic recovery rate
  affect information and epidemic transmission?
We conducted this simulation by changing the epidemic transmission rate  and fixing the other parameters. The fixed parameter values were
  ,
,  ,
,  , r = 1, v = 0.03,
  , and
, and  , and the values of
  were 0.1, 0.3, and 0.5. In Fig. 8, we show the change in the infection density of the entire region and each area in the information and epidemic layers over time as well as the change in the infection scale with
  . The reduction in the disease transmission rate not only significantly reduced the peak density of infectious nodes and the scale of disease transmission but also reduced the peak density of nodes in state AI of the information layer and the scale of information dissemination. The epidemic transmission rate increased from 0.1 to 0.5, the highest node density of the information layer in state AI increased from 11.2% to 20%, and the information dissemination scale increased from 64% to 85.5%. The highest density of nodes in an infected state in the epidemic layer increased from 8% to 22%, and the scale of the epidemic spread increased from 28% to 64.5%. The change in the node state density in each area reflected the inhibitory effect of reducing the infection rate on the spread of the epidemic. These results showed that in all the areas, the peak density of infected nodes and the scale of the epidemic spread decreased with the decrease in the infection rate.
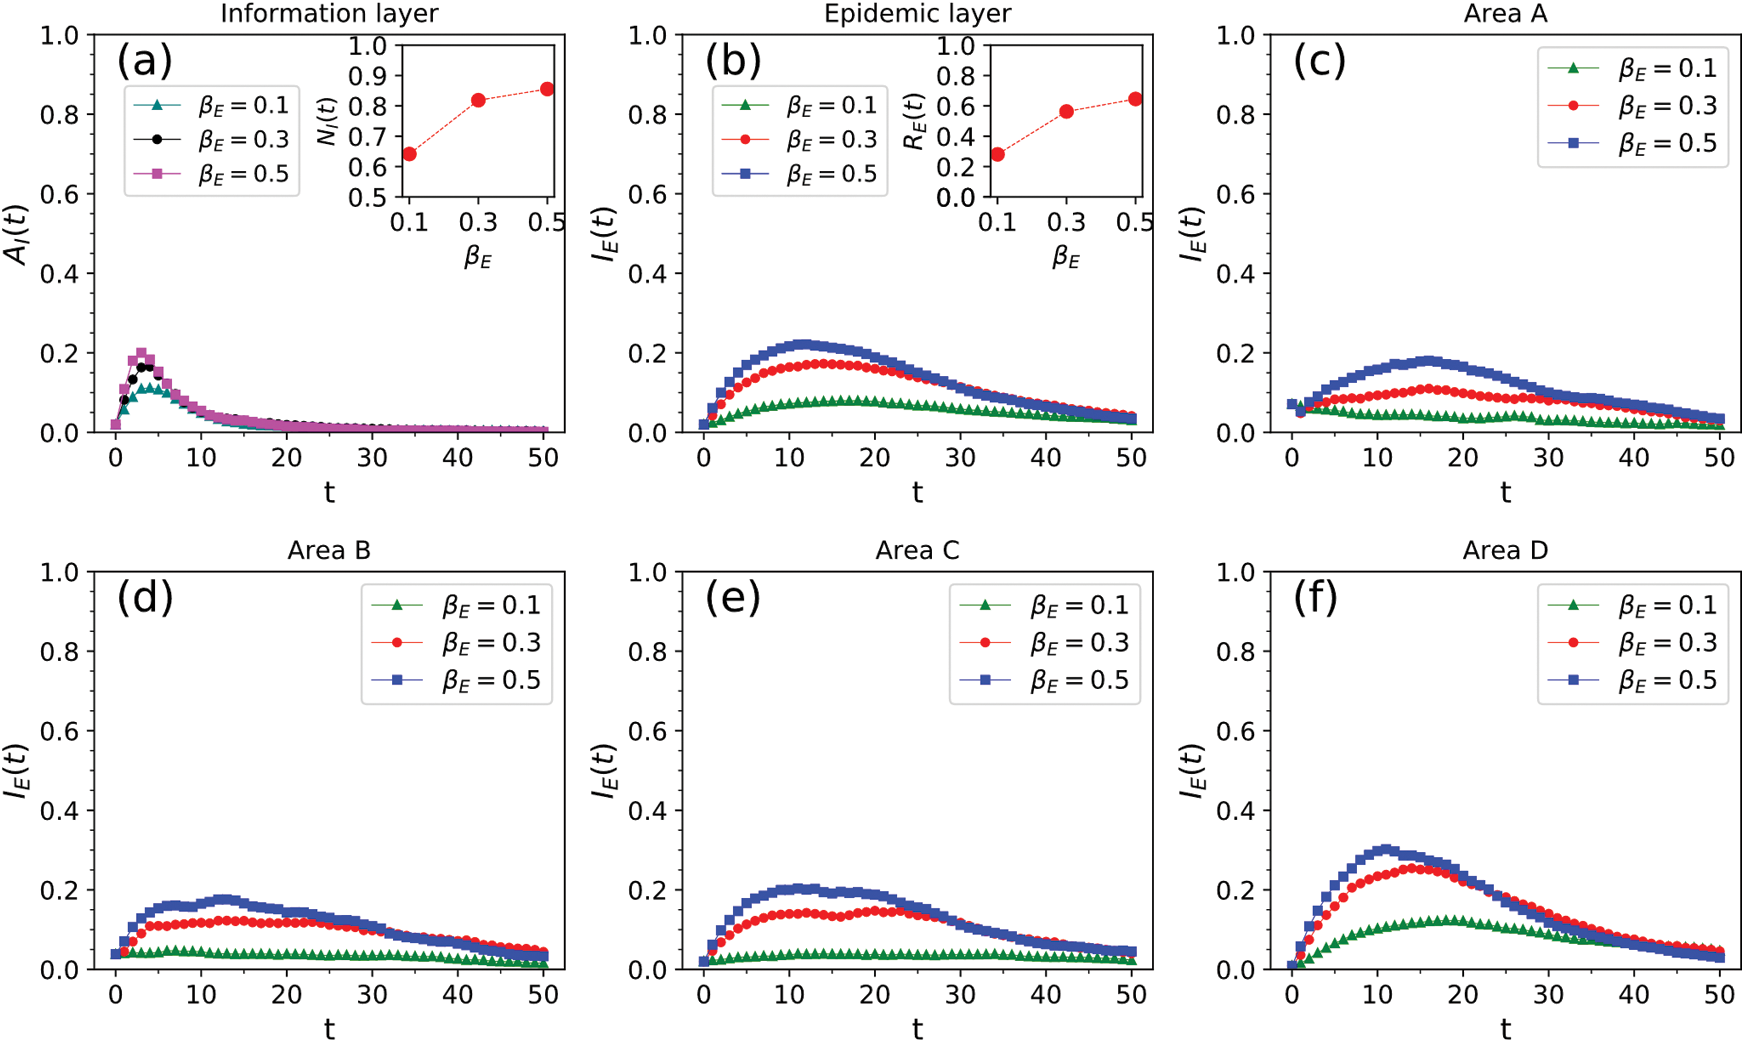
Figure 8: Impact of the epidemic transmission rate  on information and epidemic transmission. (a) Infection density and scale of information in the entire area. (b) Infection density and scale of disease in the entire area. (c)–(f) Infection density of disease in areas A–D
Next, we conducted a simulation by changing the epidemic recovery rate  while keeping all the other parameters fixed as follows:
  ,
,  ,
,  , r = 1, v = 0.03,
  , and
, and  . The values of
  were 0.1, 0.3, 0.5, and 0.7. The change in the infection density of the entire region and each area in the information and epidemic layers over time and the change in the infection scale with
  are presented in Fig. 9. The increase in the epidemic recovery rate not only reduced the peak density of information disseminators and the scale of information dissemination in the information layer, but it also reduced the peak density of infected people and the scale of the epidemic spread in the epidemic layer. The epidemic recovery rate increased from 0.1 to 0.7, the peak density of nodes in state AI of the information layer decreased from 28.4% to 14.6%, and the scale of information dissemination dropped from 93.9% to 46%. The peak density of infected nodes in the epidemic layer decreased from 41.5% to 3.3%, and the scale of the epidemic spread decreased from 80% to 10%. The change in the node state density in each area reflected the inhibitory effect of increasing the recovery rate on the spread of the epidemic. This finding was most prominent in area D, which had the highest population density.
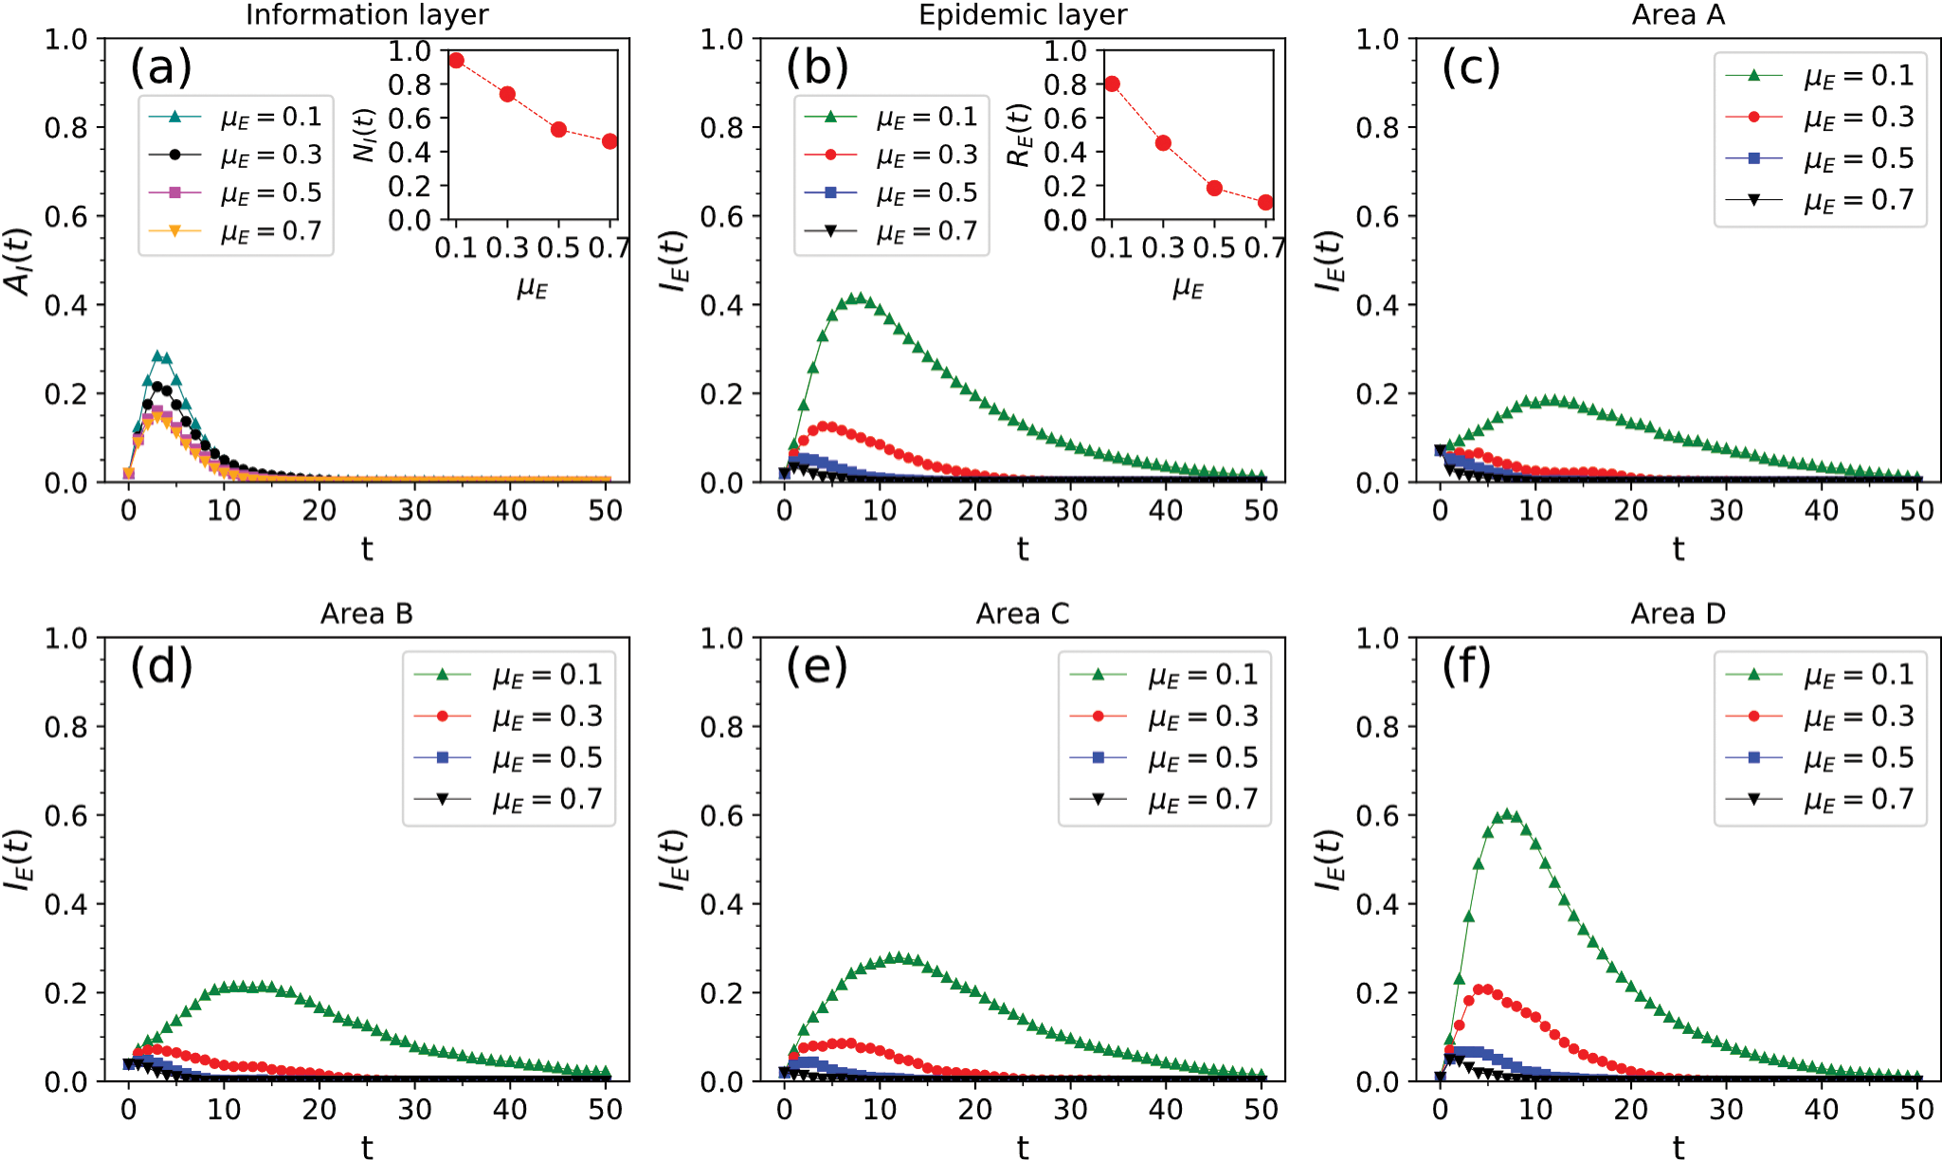
Figure 9: Impact of epidemic recovery rate  on information and epidemic transmission. (a) Infection density and scale of information in the entire area. (b) Infection density and scale of disease in the entire area. (c)–(f) Infection density of disease in areas A–D
(4) How does the probability of taking preventive actions  affect information and epidemic transmission?
Lastly, we conducted a simulation by changing the probability of taking preventive actions  ; the other parameters remained fixed. The fixed parameter values were
  ,
,  ,
,  ,
,  , r = 1, v = 0.03, and
  . The values of
  were 0.2, 0.6, and 1. The change in the infection density of the entire region and each area in the information and epidemic layers over time and the change in the infection scale with
  are presented in Fig. 10. According to the results in Figs. 10a and 10b, increasing the probability of taking preventive actions reduced the peak density of information and epidemic infections and the final scale of the spread of information and the epidemic. The probability of taking preventive actions increased from 0.2 to 1, the peak density of nodes in state AI of the information layer decreased from 27.6% to 20.7%, and the scale of information dissemination decreased from 94.2% to 83%. The peak density of infected nodes in the epidemic layer decreased from 40.7% to 19.7%, and the scale of epidemic transmission decreased from 80% to 58%. As shown in Figs. 10c–10f, the increase in the probability of taking preventive actions had no clear effect on areas A and B because the rate of infection in these areas was very low. In area C, the increase in the probability of taking preventive actions reduced the peak density of infected people and the scale of transmission. It also had the most significant effect on the peak density of infected people and on the reduction of the scale of infection in area D.
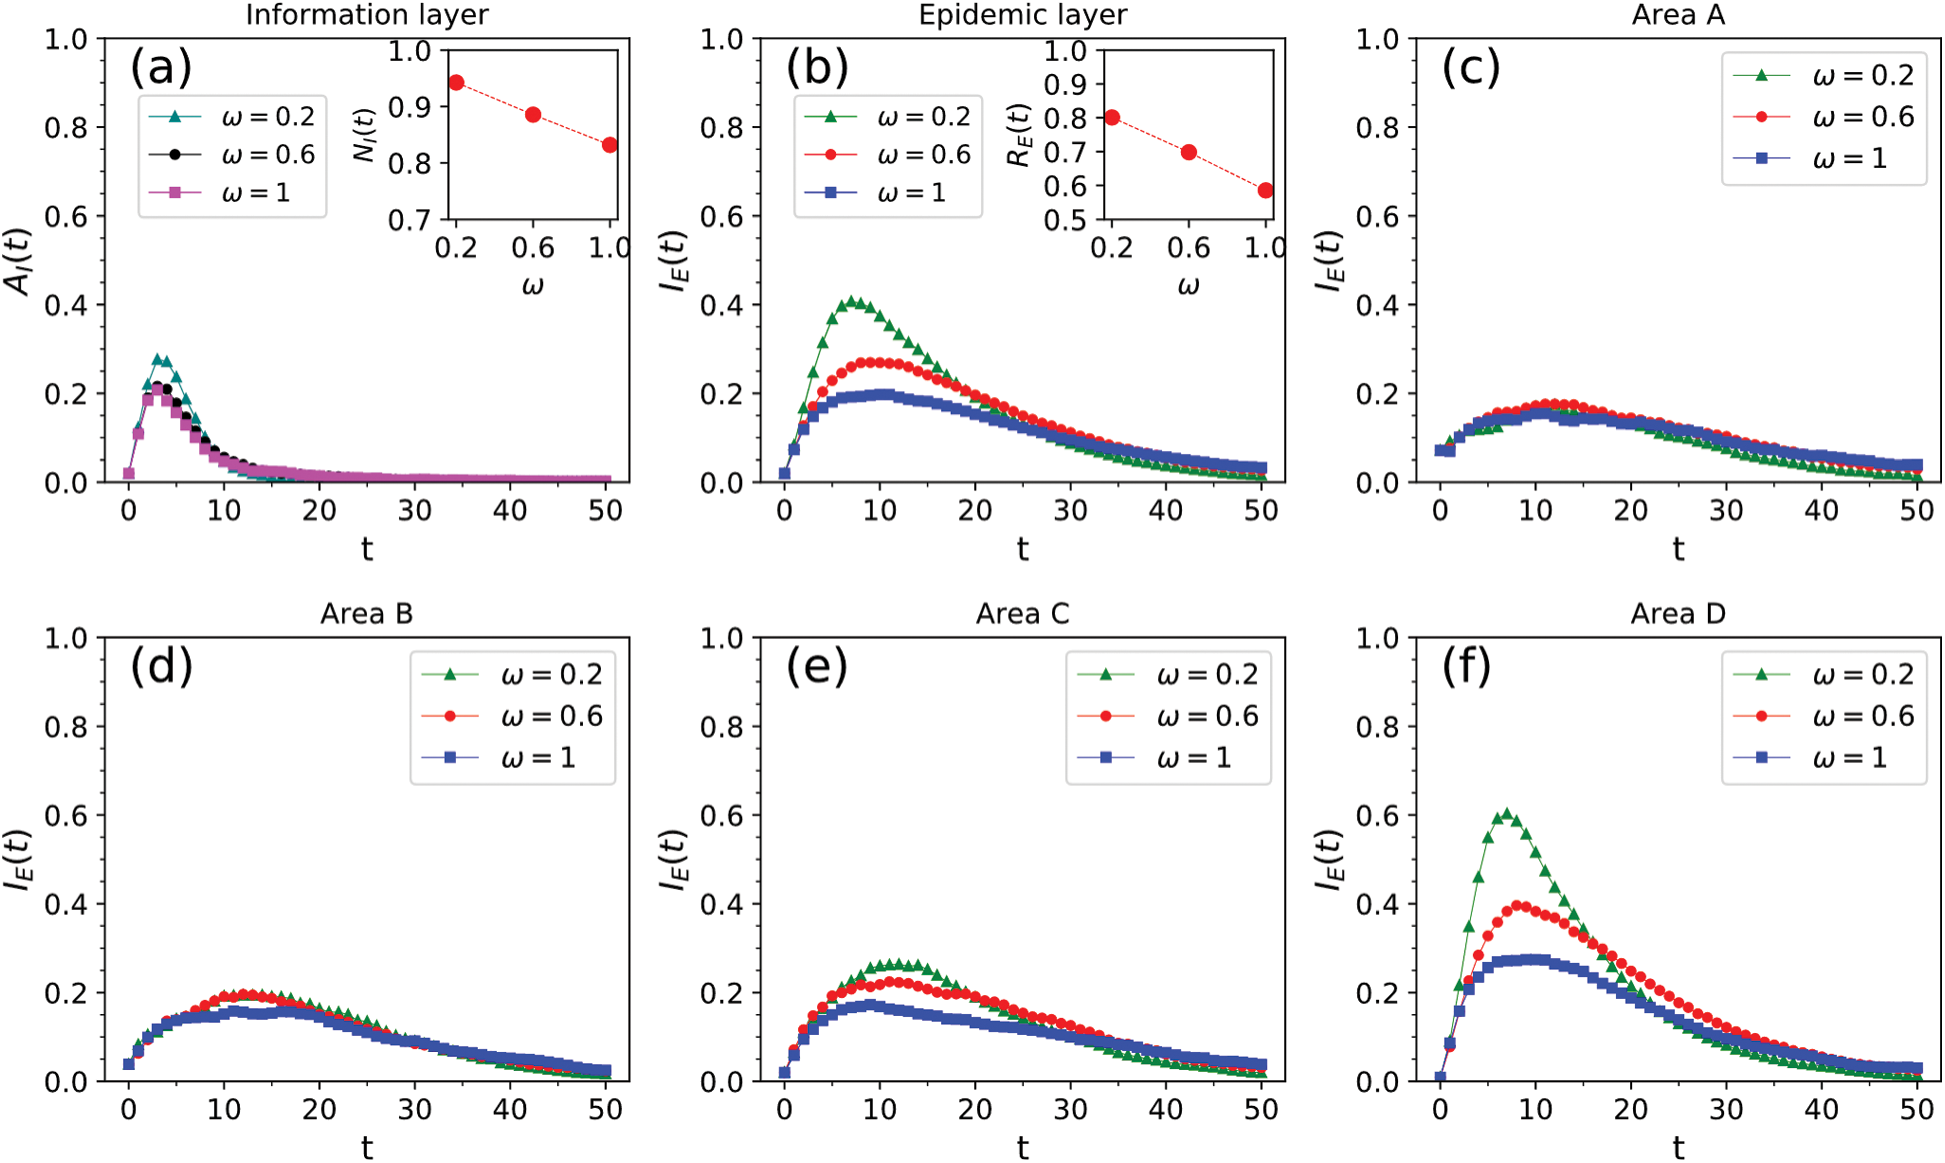
Figure 10: Impact of the probability of taking preventive actions  on information and epidemic transmission. (a) Infection density and scale of information in the entire area. (b) Infection density and scale of disease in the entire area. (c)–(f) Infection density of disease in areas A–D
Our analysis of the factors affecting epidemic transmission can provide a helpful scientific basis for epidemic prevention and control. This study considered the fact that people move around and tend to be active in fixed areas. We analyzed the dynamic evolution and coupling effect of information dissemination and epidemic transmission during the epidemic. We constructed a double-layer epidemic spread–information dissemination network in which the social network of the information layer was a static network. The network structure did not change over a short period of time. The physical contact network of the epidemic layer was a dynamic time-varying network that considered the mobility and regional activity of individuals. After constructing the double-layer network, we simulated the spread of information and the epidemic in the information and epidemic layers using the SIR model and studied the impact of several factors on epidemic transmission and information dissemination. The considered factors included different cross-regional jump probabilities, information dissemination rate, information recovery rate, epidemic transmission rate, epidemic recovery rate, and the probability of taking preventive actions.
Through these simulations, we found that increasing the rate of information dissemination could increase the peak density of information disseminators and the scale of information dissemination at the information layer, although this had an inhibitory effect on the spread of the epidemic. The inhibitory effect of the information layer on the epidemic layer was achieved primarily by enabling informed individuals to take preventive behaviors to reduce the probability of infection. The simulation results also showed that the higher the probability of taking preventive behavior, the more obvious the inhibitory effect on the epidemic. Therefore, in epidemic control, it is necessary to improve the dissemination of information and provide more people with information related to the epidemic. In addition, other measures are needed to increase the probability of individuals taking preventive behaviors, such as making the wearing of masks compulsory on certain occasions. The results also showed that the scale of the spread of information and epidemic was larger when people moved across regions over long distances than when they moved within their current region. Therefore, people should minimize cross-regional transit during an epidemic. Finally, with respect to lockdown measures, in areas with a high population density and high infection levels, the lockdown significantly helped to control the epidemic in our simulations. However, in areas with a small population density and relatively low infection levels, the blockade policy could be appropriately relaxed.
Although this study provides theoretical guidance for the prevention and control of the spread of epidemic, there is room for further improvements. In this work, we explored only the impact of a single influencing factor on the spread of information and the epidemic. The interactions between multiple influencing factors were not considered. In addition, we considered that an individual had only three states in the epidemic layer: Susceptible state, infected state, and recovery state. However, in real life, an individual can have other states, such as a latent state and an isolation state. Therefore, in future research, we will increase the number of individual states in the epidemic layer and study the impact of simultaneous changes in multiple influencing factors on the spread of information and the epidemic. In addition, deep learning has been shown to have excellent performance in solving complex problems [24,25] and may provide a new approach for our future research.
Funding Statement: This work is supported by National Natural Science Foundation of China (Grant No.71673256).
Conflicts of Interest: The authors declare that they have no conflicts of interest to report regarding the present study.
1. W. Wang, Q. H. Liu, J. Liang, Y. Hu and T. Zhou. (2019). “Coevolution spreading in complex networks,” Physics Reports, vol. 820, pp. 1–51. [Google Scholar]
2. L. Xia, B. Song, Z. Jing, Y. Song and L. Zhang. (2018). “Dynamical interaction between information and disease spreading in populations of moving agents,” Computers, Materials & Continua, vol. 57, no. 1, pp. 123–144. [Google Scholar]
3. Z. Wang, M. A. Andrews, Z. X. Wu, L. Wang and C. T. Bauch. (2015). “Coupled disease-behavior dynamics on complex networks: A review,” Physics of Life Reviews, vol. 15, pp. 1–29. [Google Scholar]
4. C. T. Bauch and A. P. Galvani. (2013). “Social factors in epidemiology,” Science, vol. 342, no. 6154, pp. 47–49. [Google Scholar]
5. R. M. Anderson and R. M. May. (1991). “The basic model: Dynamics,” in Infectious Diseases of Human, 1st ed., New York, NY, USA: Oxford University Press Inc., pp. 122–143. [Google Scholar]
6. H. Andersson and T. Britton. (2000). “Applications to epidemic models,” in Stochastic Epidemic Models and Their Statistical Analysis, 1st ed., vol. 151. New York, NY, USA: Springer-Verlag New York, pp. 46–47. [Google Scholar]
7. M. J. Keeling, P. Rohani and B. Pourbohloul. (2008). “Introduction to simple epidemic models,” in Modeling Infectious Diseases in Humans and Animals, 1st ed., Princeton, NJ, USA: Princeton University Press, pp. 15–52. [Google Scholar]
8. F. Brauer and C. Castillo-Chavez. (2012). “Disease transmission models,” in Mathematical Models in Population Biology and Epidemiology, 2nd ed., vol. 40. New York, NY, USA: Springer New York, pp. 343–464. [Google Scholar]
9. O. Diekmann, H. Heesterbeek and T. Britton. (2012). “The bare bones: Basic issues in thesimplest context,” in Mathematical Tools for Understanding Infectious Disease Dynamics, 1st ed., Princeton, NJ, USA: Princeton University Press, pp. 4–150. [Google Scholar]
10. M. E. J. Newman. (2002). “The spread of epidemic disease on networks,” Physical Review E Covering Statistical, Nonlinear, Biological, and Soft Matter Physics, vol. 66, no. 1, pp. 1–11. [Google Scholar]
11. M. E. J. Newman. (2010). “Network models,” in Networks: An Introduction, 1st ed., New York, NY, USA: Oxford University Press, pp. 395–588. [Google Scholar]
12. M. J. Keeling and K. T. D. Eames. (2005). “Networks and epidemic models,” Journal of the Royal Society Interface, vol. 2, no. 4, pp. 295–307. [Google Scholar]
13. C. Castellano, S. Fortunato and V. Loreto. (2009). “Statistical physics of social dynamics,” Reviews of Modern Physics, vol. 81, no. 2, pp. 591–646. [Google Scholar]
14. R. Pastor-Satorras, C. Castellano, P. V. Mieghem and A. Vespignani. (2015). “Epidemic processes in complex networks,” Reviews of Modern Physics, vol. 87, no. 3, pp. 13–15. [Google Scholar]
15. Z. K. Zhang, C. Liu, X. X. Zhan, X. Lu, C. X. Zhang et al. (2016). , “Dynamics of information diffusion and its applications on complex networks,” Physics Reports A Review Section of Physics Letters, vol. 651, pp. 1–34. [Google Scholar]
16. I. Z. Kiss, J. Miller and P. L. Simon. (2017). “Introduction to networks and diseases,” in Mathematics of Epidemics on Networks: From Exact to Approximate Models, 1st ed., vol. 46. New York, NY, USA: Springer International Publishing, pp. 1–26. [Google Scholar]
17. S. Funk, E. Gilad, C. Watkins and V. A. A. Jansen. (2009). “The spread of awareness and its impact on epidemic outbreaks,” Proc. of the National Academy of Sciences of the United States of America, vol. 106, no. 16, pp. 6872–6877. [Google Scholar]
18. Z. Ruan, M. Tang and Z. Liu. (2012). “Epidemic spreading with information-driven vaccination,” Physical Review E Covering Statistical, Nonlinear, Biological, and Soft Matter Physics, vol. 86, no. 3, pp. 2–7. [Google Scholar]
19. C. Granell, S. Gómez and A. Arenas. (2013). “Dynamical interplay between awareness and epidemic spreading in multiplex networks,” Physical Review Letters, vol. 111, no. 12, pp. 1–10. [Google Scholar]
20. C. Granell, S. Gómez and A. Arenas. (2014). “Competing spreading processes on multiplex networks: Awareness and epidemics,” Physical Review E Statistical Nonlinear & Soft Matter Physics, vol. 90, no. 1, pp. 1–7. [Google Scholar]
21. L. Mao. (2014). “Modeling triple-diffusions of infectious diseases, information, and preventive behaviors through a metropolitan social network-an agent-based simulation,” Applied Geography, vol. 50, pp. 31–39. [Google Scholar]
22. A. Buscarino, L. Fortuna, M. Frasca and A. Rizzo. (2014). “Local and global epidemic outbreaks in populations moving in inhomogeneous environments,” Physical Review E Covering Statistical, Nonlinear, Biological, and Soft Matter Physics, vol. 90, no. 4, pp. 1–7. [Google Scholar]
23. D. Tian, C. Liu, Z. Sheng, M. Chen and Y. Wang. (2017). “Analytical model of spread of epidemics in open finite regions,” IEEE Access, vol. 5, pp. 9673–9681. [Google Scholar]
24. H. W. Guo, X. Y. Zhuang and T. Rabczuk. (2019). “A deep collocation method for the bending analysis of kirchhoff plate,” Computers, Materials & Continua, vol. 59, no. 2, pp. 433–456. [Google Scholar]
25. C. Anitescu, E. Atroshchenko, N. Alajlan and T. Rabczuk. (2019). “Artificial neural network methods for the solution of second order boundary value problems,” Computers, Materials & Continua, vol. 59, no. 1, pp. 345–359. [Google Scholar]
 | This work is licensed under a Creative Commons Attribution 4.0 International License, which permits unrestricted use, distribution, and reproduction in any medium, provided the original work is properly cited. |