DOI:10.32604/cmc.2021.014006
| Computers, Materials & Continua DOI:10.32604/cmc.2021.014006 | |
| Article |
Epidemiological Analysis of the Coronavirus Disease Outbreak with Random Effects
1Department of Mathematics and Statistics, University of Lahore, Pakistan
2Department of Mathematics, Faculty of Art and Science, Siirt University, Siirt, 56100, Turkey
3Department of Mathematics, University of Education, Lahore, Pakistan
4Department of Economics and Business Administration, University of Education, Lahore, Pakistan
5Department of Mathematics, Cankaya University, Balgat, 06530, Turkey
6Institute of Space Sciences, Magurele-Bucharest, R76900, Romania
7Department of Medical Research, China Medical University, Taichung,40402, Taiwan
*Corresponding Author: Ali Akgül. Email: aliakgul00727@gmail.com
Received: 30 August 2020; Accepted: 07 January 2021
Abstract: Today, coronavirus appears as a serious challenge to the whole world. Epidemiological data of coronavirus is collected through media and web sources for the purpose of analysis. New data on COVID-19 are available daily, yet information about the biological aspects of SARS-CoV-2 and epidemiological characteristics of COVID-19 remains limited, and uncertainty remains around nearly all its parameters’ values. This research provides the scientific and public health communities better resources, knowledge, and tools to improve their ability to control the infectious diseases. Using the publicly available data on the ongoing pandemic, the present study investigates the incubation period and other time intervals that govern the epidemiological dynamics of the COVID-19 infections. Formulation of the testing hypotheses for different countries with a 95% level of confidence, and descriptive statistics have been calculated to analyze in which region will COVID-19 fall according to the tested hypothesized mean of different countries. The results will be helpful in decision making as well as in further mathematical analysis and control strategy. Statistical tools are used to investigate this pandemic, which will be useful for further research. The testing of the hypothesis is done for the differences in various effects including standard errors. Changes in states’ variables are observed over time. The rapid outbreak of coronavirus can be stopped by reducing its transmission. Susceptible should maintain safe distance and follow precautionary measures regarding COVID-19 transmission.
Keywords: Covid-19; infectious disease; statistical analysis; p-value; epidemiology hypothesis
Severe Acute Respiratory Syndrome (SARS) is also caused by a coronavirus and plays an important role for its investigation [1]. According to the group of investigators, SARS and coronavirus have many similar features [2]. RNA enveloped virus known as coronavirus is spreading particularly among humans, mammals and birds. Many respiratory, enteric, hepatic and neurological diseases are caused by coronavirus [3,4]. Human disease is caused by six different types of coronavirus [5]. The symptom of the common cold in immune-compromised individuals is caused by 229E, OC43, NL63 and HKU1 coronaviruses whereas other 2 coronavirus types are zoonotic in origin. These two are Severe Acute Respiratory Syndrome Coronavirus (SARS-CoV) and Middle East Respiratory Syndrome Coronavirus (MERS-CoV). SARS-CoV and MERS-CoV are fatal in their nature [6]. In 2002 and 2003, Guangdong (the province of China) faced major outbreaks of acute respiratory syndrome which has a caustic agent of SARS-CoV. The Middle East suffered from severe respiratory disease outbreaks which have a caustic agent of MERS-CoV in 2012. Given the high occurrence and wide dispersal of coronaviruses, the large inherent variety and frequent recombination of their genomes, which is increasing interface between human and animal activities, novel coronaviruses are likely to emerge periodically in humans owing to frequent cross-species infections and occasional spillover events [7,8].
In 2019, China faced a major outbreak of Coronavirus disease 2019 (COVID-19) and this outbreak had the potential to become a worldwide pandemic [9]. Interventions and real-time data are needed for the control on this outbreak of coronavirus [10]. In previous studies, the transfer of the virus from one person to another person, its severity and history of the pathogen in the first week of the outbreak has been explained with the help of real-time analysis [11]. In December 2019, a group of people in Wuhan admitted to the hospital that all were suffering from pneumonia and the cause of pneumonia was idiopathic. Most of the people linked the cause of pneumonia with the eating of wet markets and seafood. Investigation on etiology and epidemiology of disease was conducted on the 31st December 2019 by Chinese Center for Disease Control and Prevention (China CDC) with the help of Wuhan city health authorities [8]. Epidemical changings were measured by time-delay distributions including date of admission to hospital and death. According to the clinical study on the COVID-19, symptoms of coronavirus appear after 7 days of onset of illness [12]. The time from hospital admission to death is also critical to the avoidance of underestimation when calculating case fatality risk [13]. COVID-19 epidemiological data and incubation period were measured through public data on known cases [14]. More detail can be found in [15–20].
WHO is working closely with clinicians caring for patients with COVID-19, in China and across the globe. International experts on infectious disease can give better understanding, real-time data, the clinical presentation, natural history and treatment interventions for COVID-19. A majority of patients with COVID-19 are adults. Among 44672 patients in China with confirmed infection, 2.1% were of or under the age of 20. The most commonly reported symptoms included fever, dry cough, and shortness of breath, and most patients (80%) experienced mild illness. Approximately 14% experienced severe diseases and 5% were critically ill. Early reports suggested that illness severity is associated with age above sixty ( > 60 years old) and comorbidity [15]. The latest outbreak of coronavirus 2019 was noted on March 12, 2020 [16] when coronavirus cases were 126,369 with 4,633 deaths and a recovered population of 68,304. Active cases were 53428 out of those 89% were in mild condition and 11% were critical. In closed cases recovered were 94 % and deaths were 6%. Data used for analysis is given in Tabs. 1 and 2.
Table 1: Worldwide data of COVID-19 combined
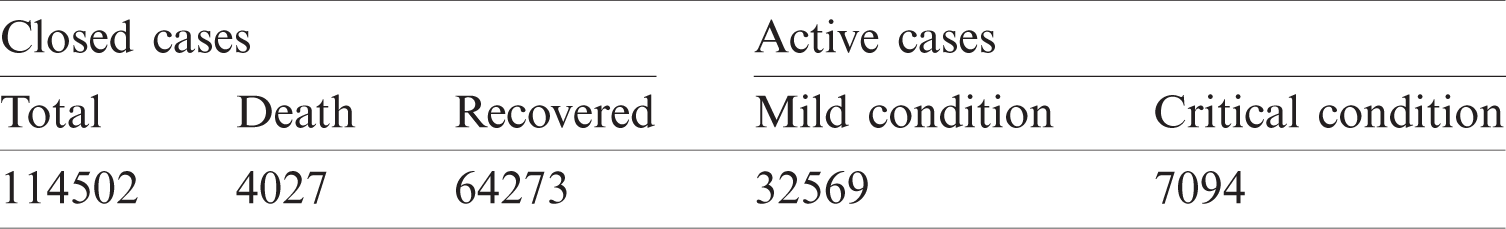
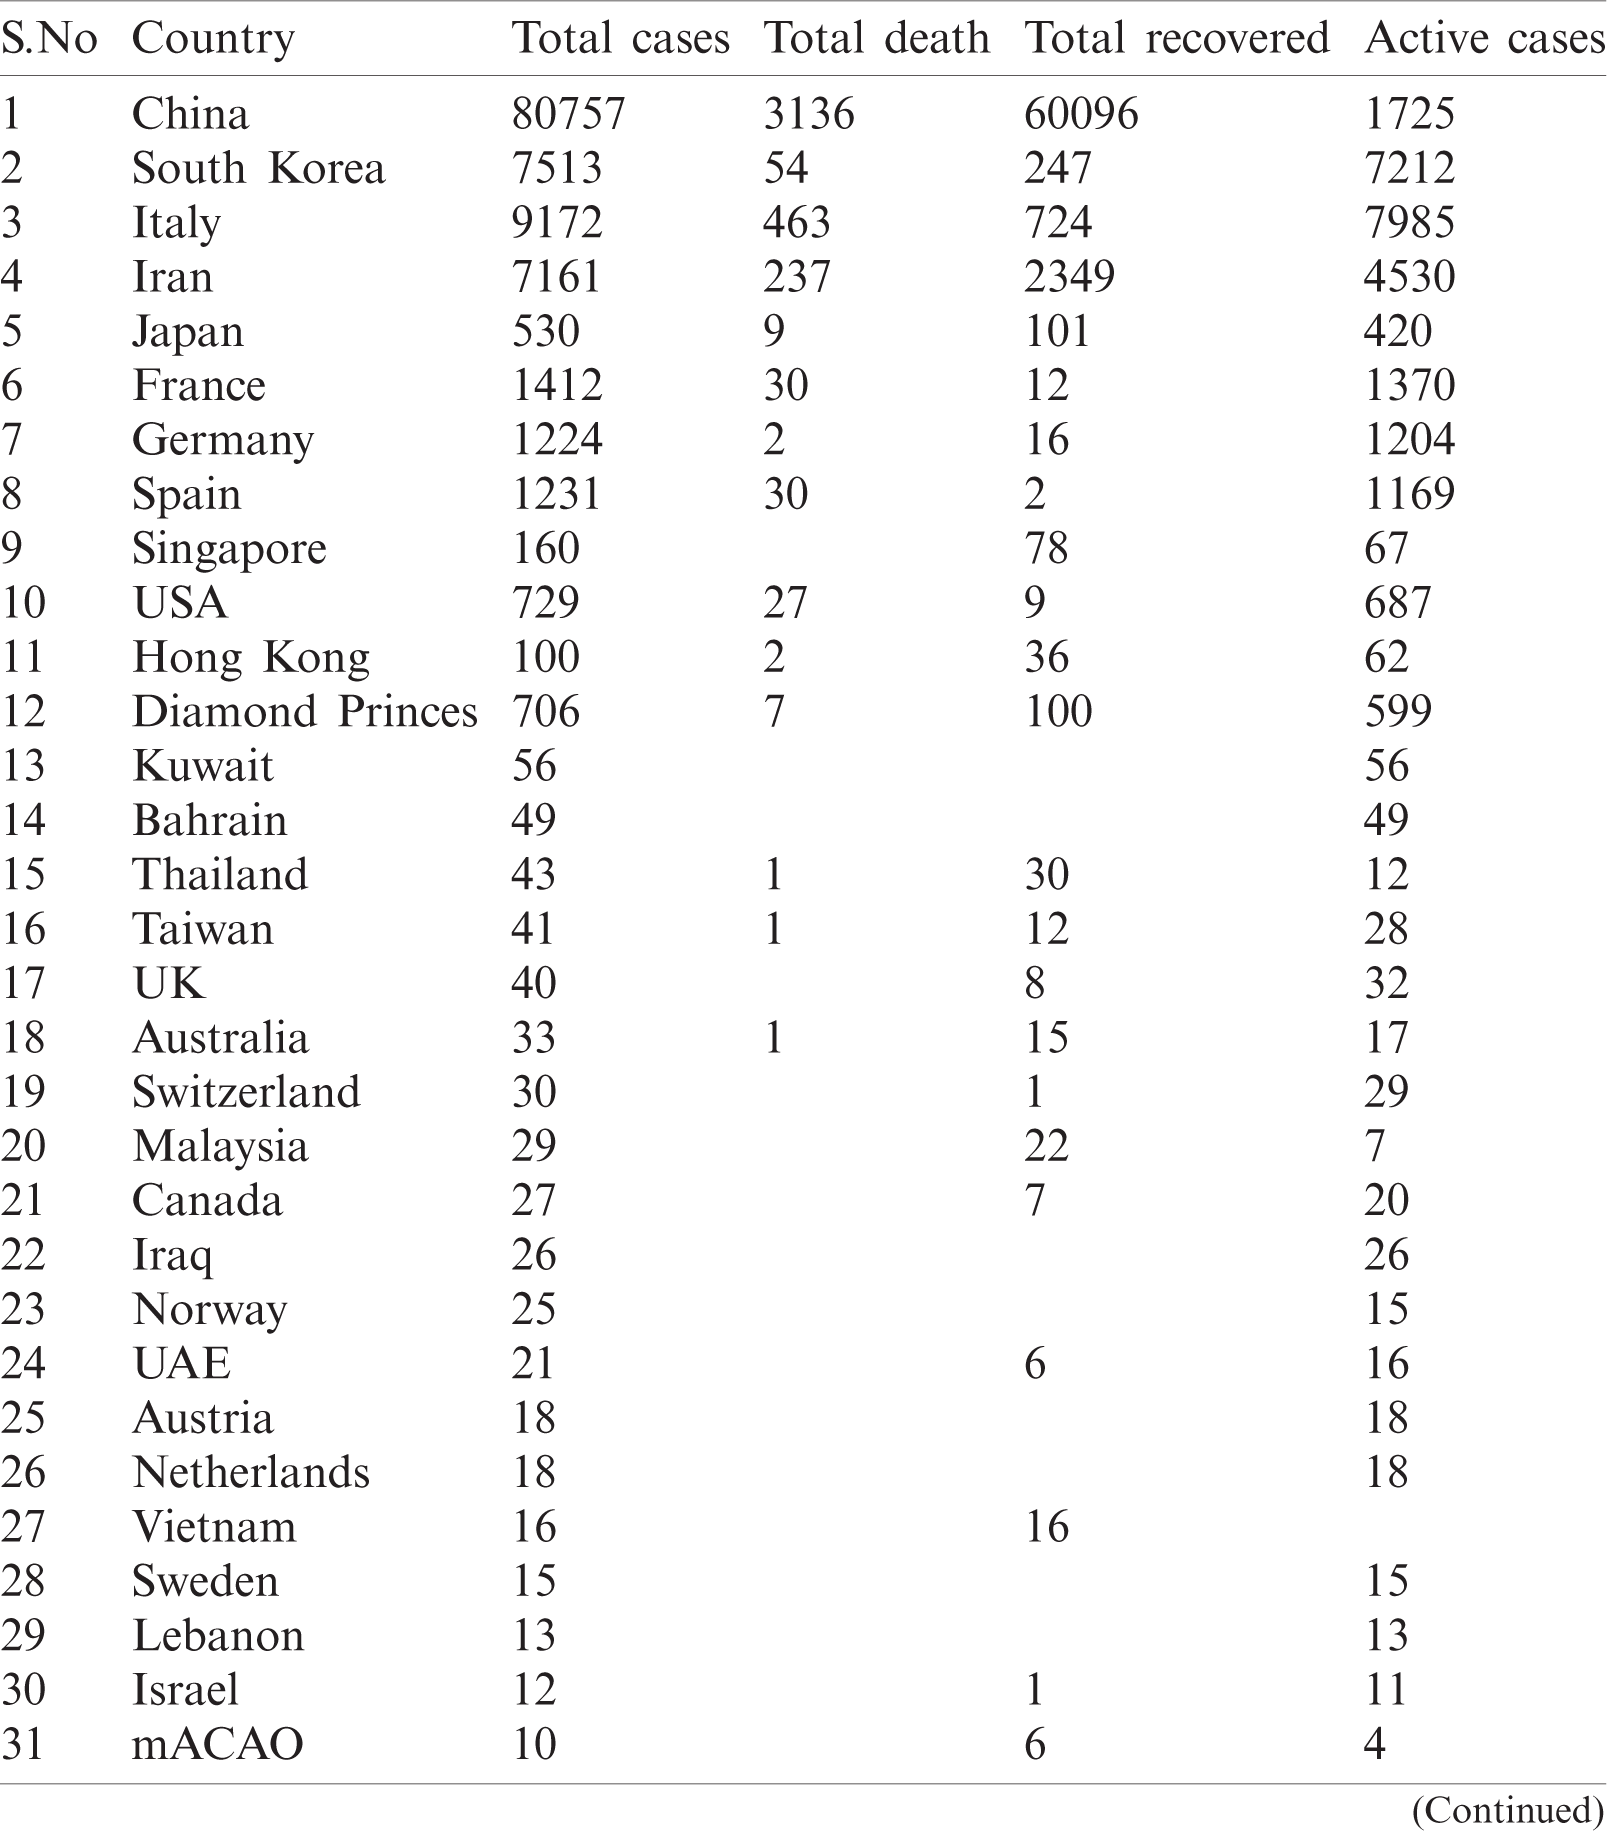
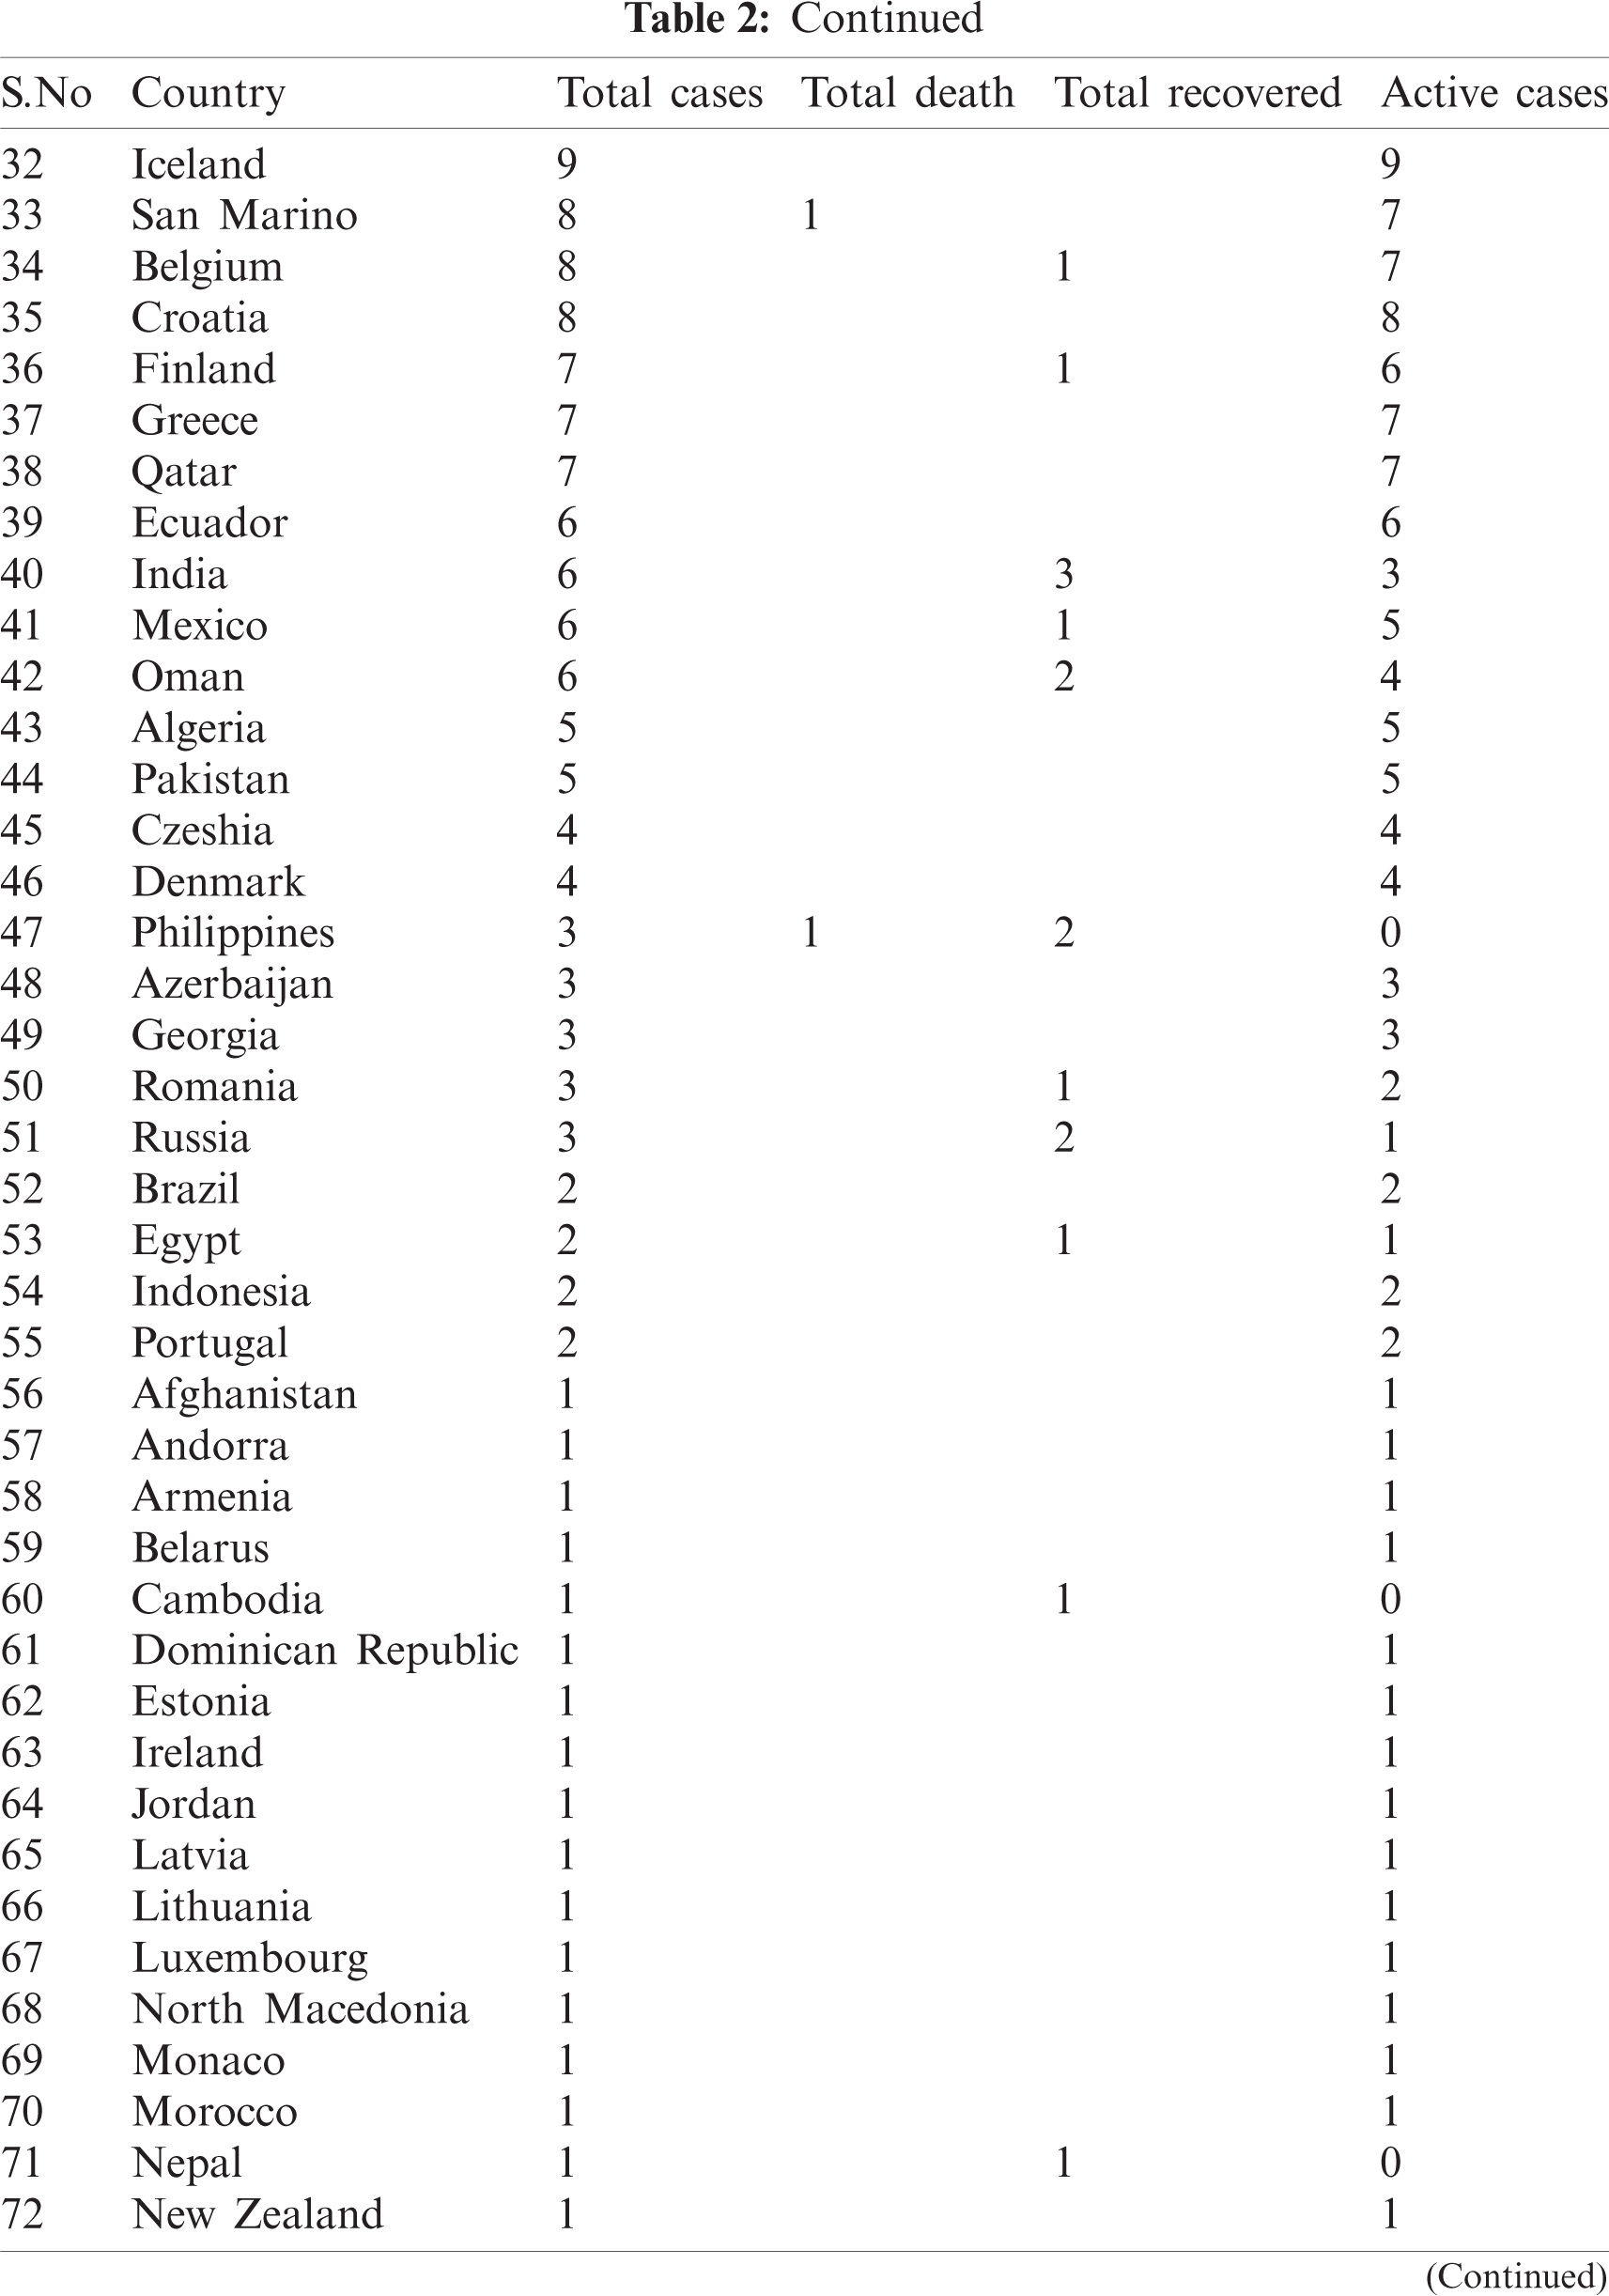
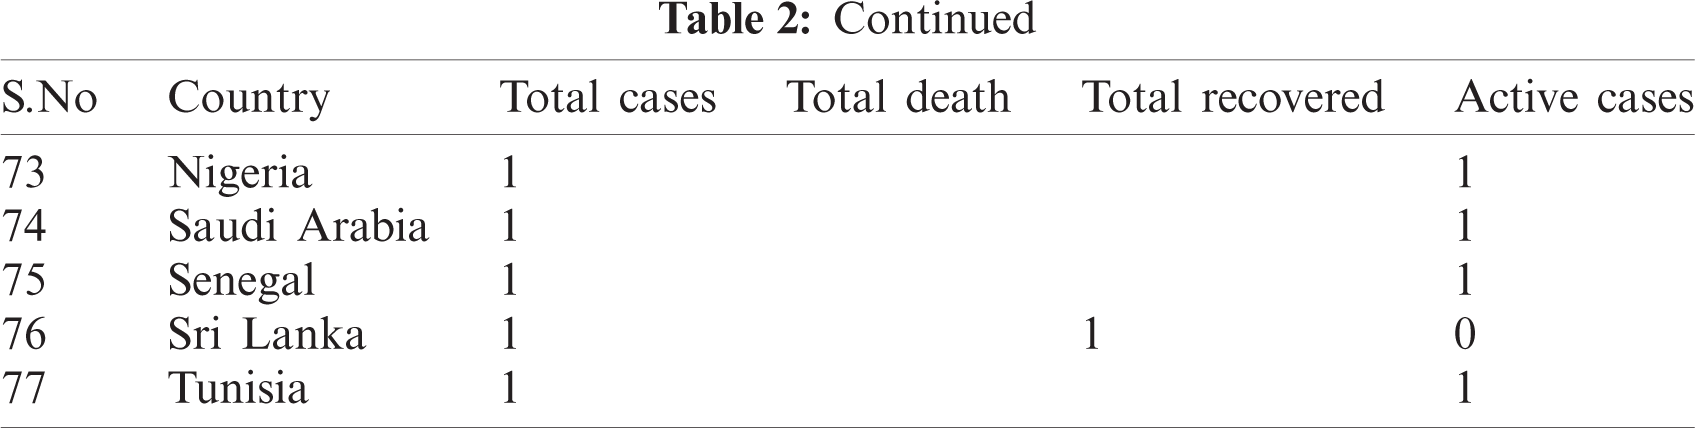
Table 2: Country-wise of COVID-19
3 Formulation for Data Analysis
Testing of hypothesis about mean of normal population when  is unknown and n < 30. Let
  be the observation in a small sample size n, taken from the normally distributed population. Let
  be the sample mean and s be the unbiased estimate of
  . So, the procedure of testing hypothesis is given as:
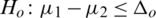
1. Formulate null and alternate hypothesis about  , three possibilities occur:
2.  and
and  (two tailed)
3.  and
and  (one sided)
 and
and  (one sided)
Decide upon the significance level  , as
, as
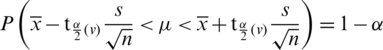
where v = n −1 degree of freedom.
Computing the t-value from the sample data by using the test statistics as follows

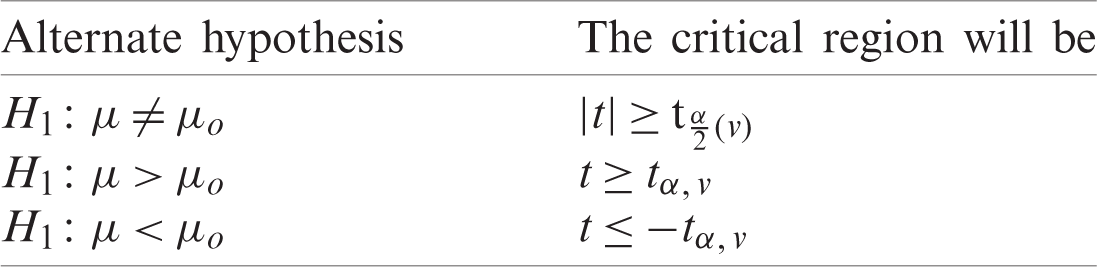
Determine the critical region for which Ho corresponding to different alternative hypothesis is given in Tab. 3.
Table 3: Alternate hypothesis for case I
Suppose that we have two small random sample  and
and  from two normally distributed population with a mean
  and
and  and standard deviation
  and
and  respectively. If
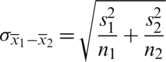
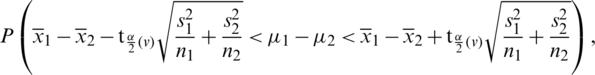
  , then we use their sample estimations s1 and s2 to compute the standard error of the difference between means as:
As there is no point in combining in  and
and  be obtained an estimate of the non-existing common population. Consequently, using to test the hypothesis that difference between mean has a specified value, so
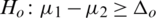
1. Formulate null and alternate hypothesis about  , three possibilities are presented as:
2.  and
and  (two tailed)
3.  and
and 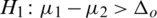 (one sided)
 and
and 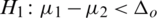 (one sided)
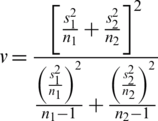
Decide upon the significance level  . Then, we obtain
where,
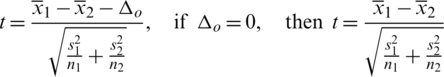
Computing the t-value from the sample data by using the test statistics gives:
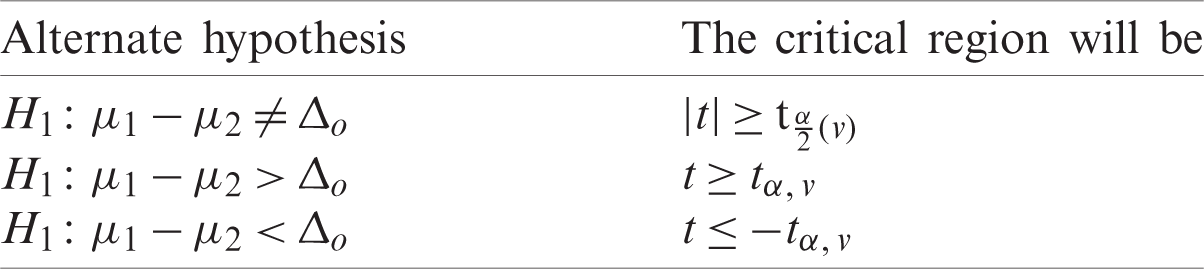
Determine the critical region for which Ho corresponding to different alternative hypothesis is given in Tab. 4.
Table 4: Alternate hypothesis for case II
The following Tabs. 5a and 5b are used for the analysis of total country-wise data with a different hypothesis and Tab. 6 is used to check the outbreak of the epidemic disease.
Table 5: Total data for statistical analysis
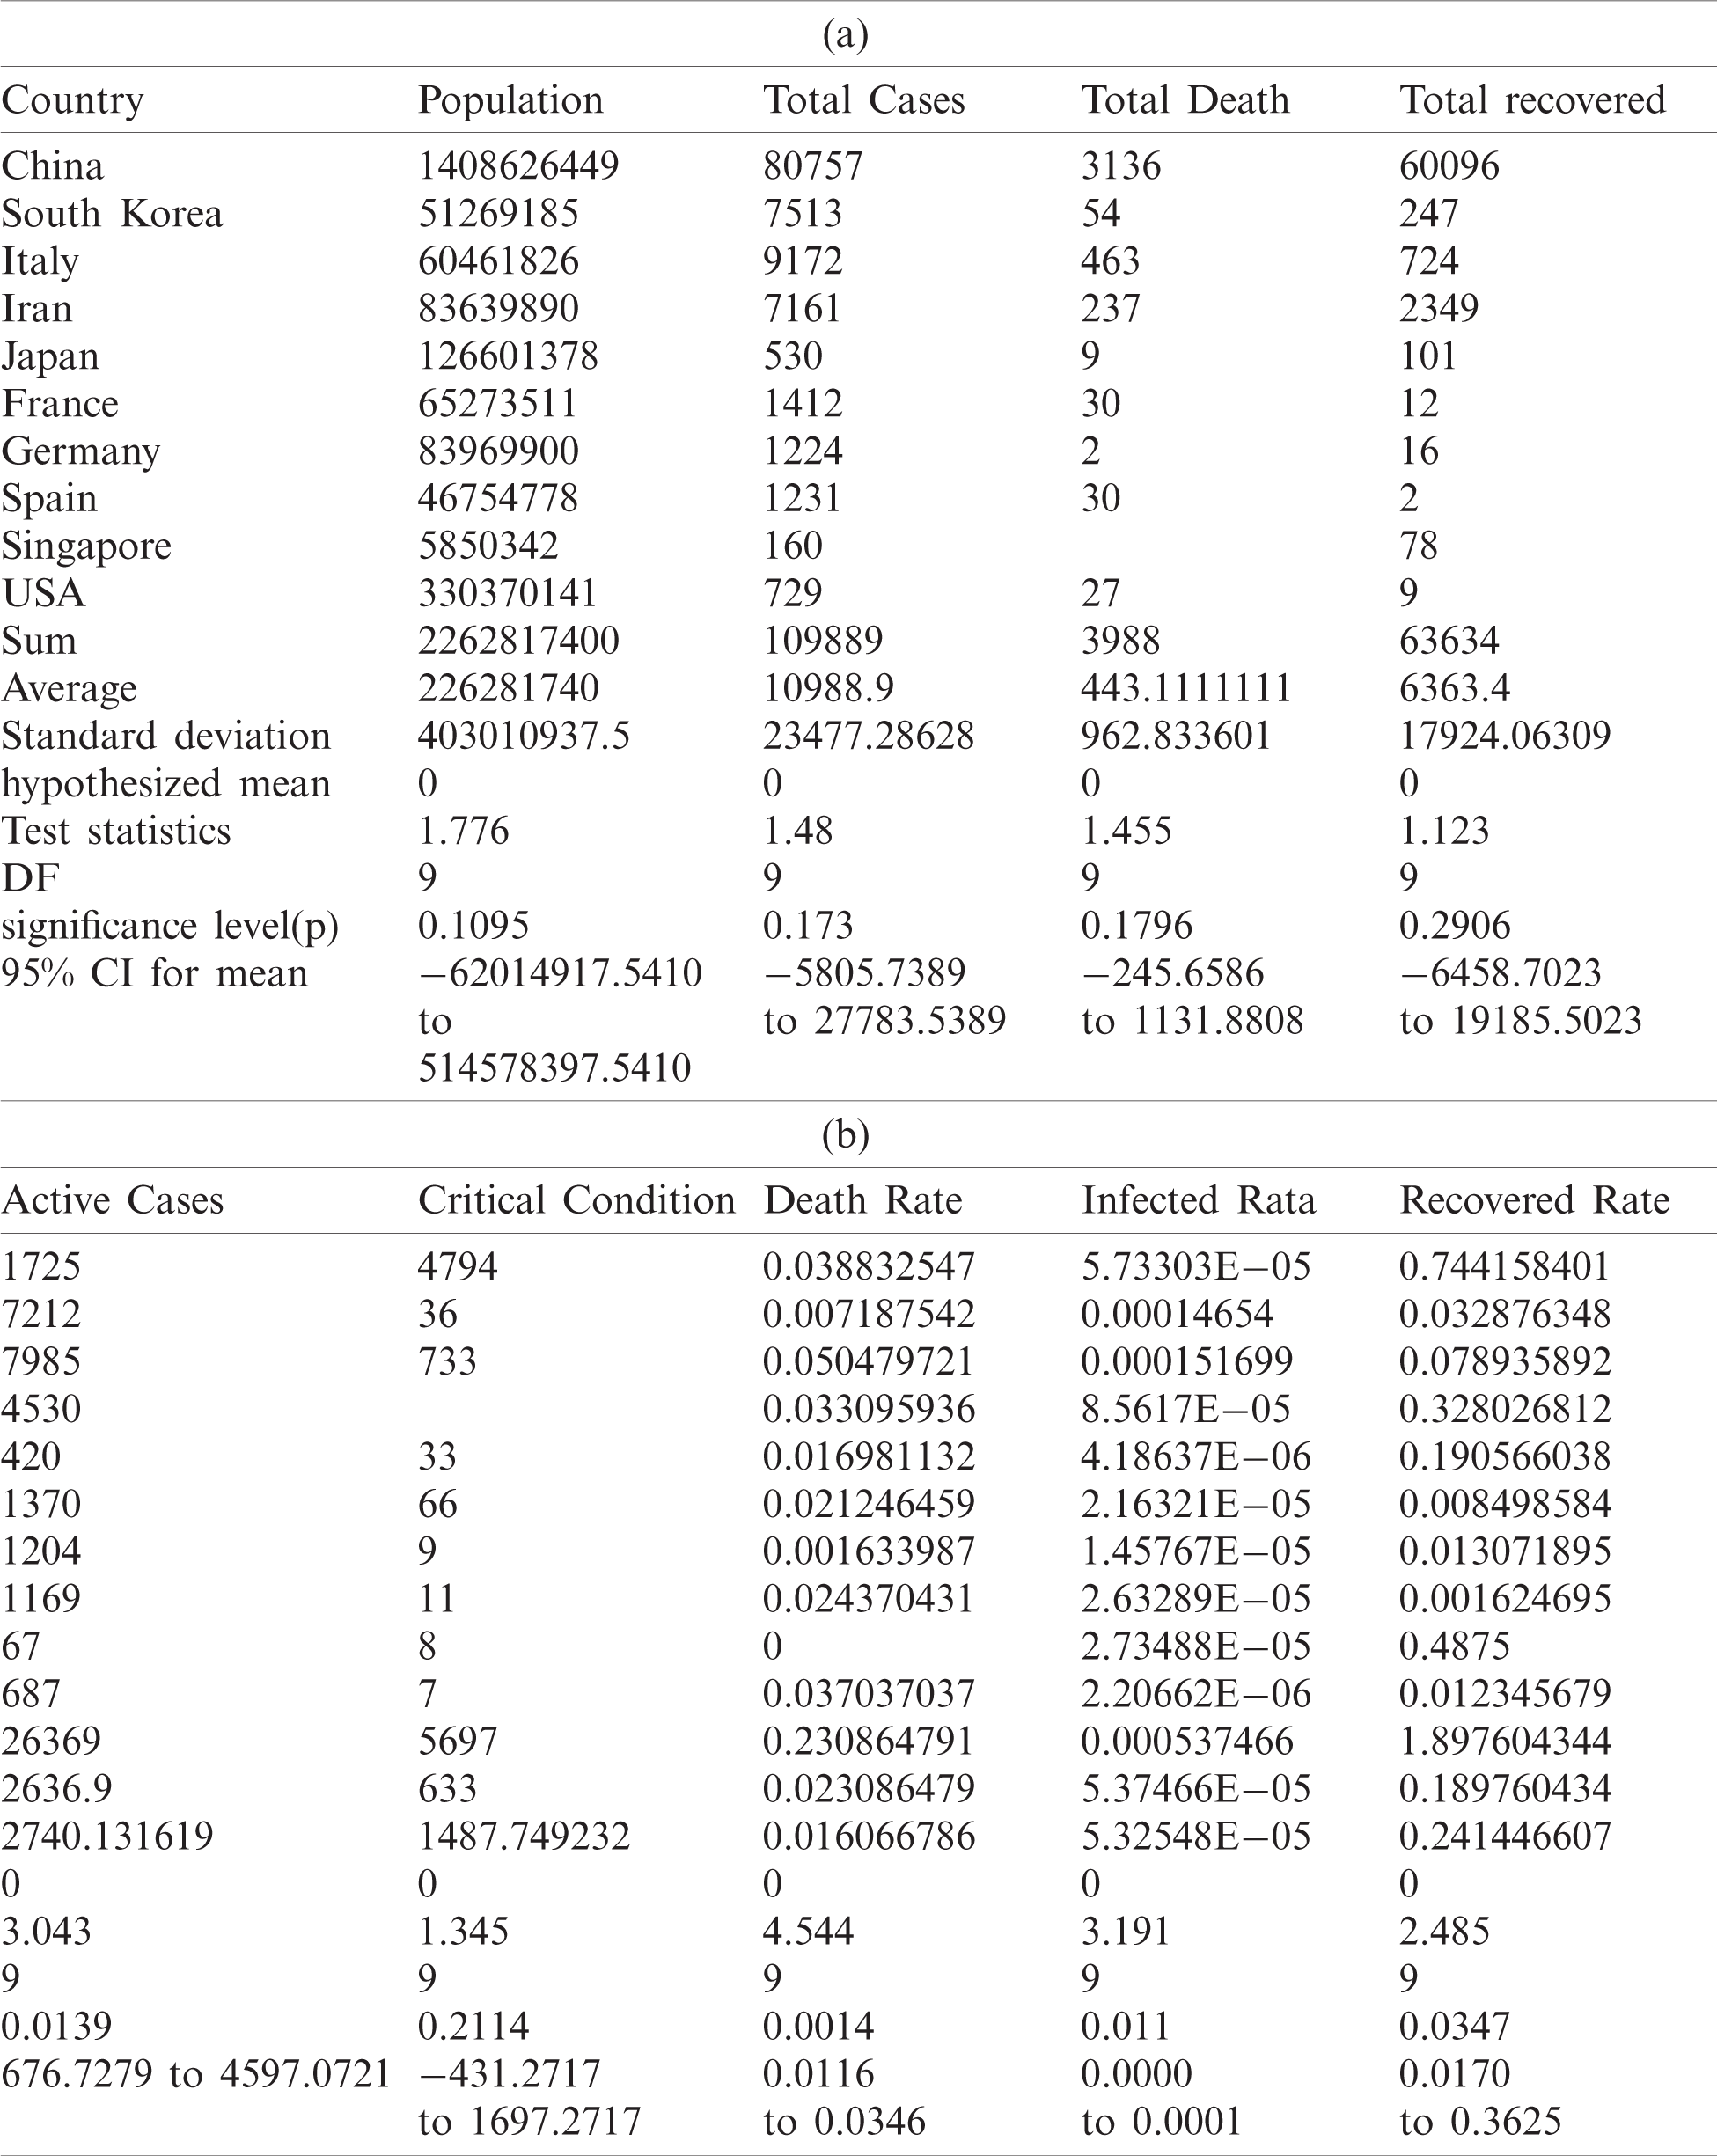
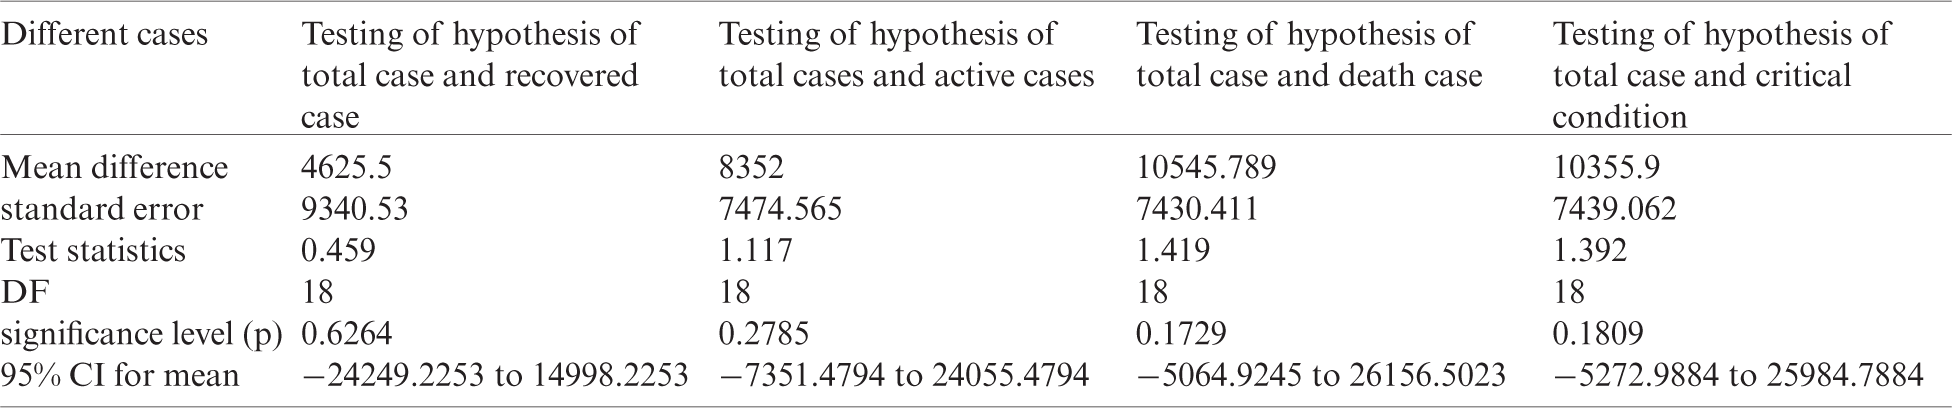
Table 6: Testing of hypothesis for differences of mean
The mean incubation period was 5.2 days (95% confidence interval, 4.1 to 7.0), with the 95th percentile of the distribution at 12.5 days. In its early stages, the epidemic doubled in size every 7.4 days. With a mean serial interval of 7.5 days (95% CI, 5.3 to 19), the basic reproductive number was estimated to be 2.2 (95% CI, 1.4 to 3.9) [17]. Across the analyzed period, the delay between symptom onset and seeking care at a hospital or clinic were longer in Hubei province than in other provinces in mainland China and internationally. In mainland China, these delays decreased from 5 days before January 18, 2020, to 2 days thereafter until January 31, 2020 ( ). Although our sample captures only 507 (
 %) of 9826 patients with COVID-19 reported by official sources during the analyzed period, our data align with an official report published by Chinese authorities on January 28, 2020 [11].
Figs. 1 and 2 represent the actual status of total cases, recovered cases, active cases, critical conditions and death cases of COVID-19 for the major affected countries till March 10, 2020. Fig. 3 represents the comparison of the worldwide effect of coronavirus with time delay which shows how coronavirus spread in a fast way during last week till 17-03-2020. Figs 4–8 represent the behavior of developed hypotheses with zero hypothesized mean of total cases, recovered, death and active cases including critical condition for the p-value respectively. Figs 9–12 represent the behavior of developed hypotheses of differences total cases with other compartments for the p value of zero hypothesized difference mean.
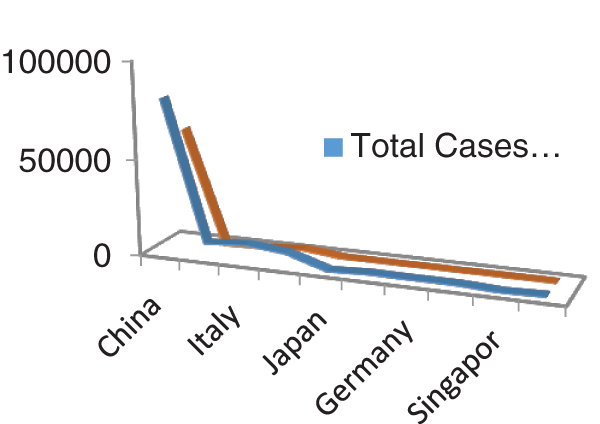
Figure 1: Outbreak of total cases and recovered cases of corona virus
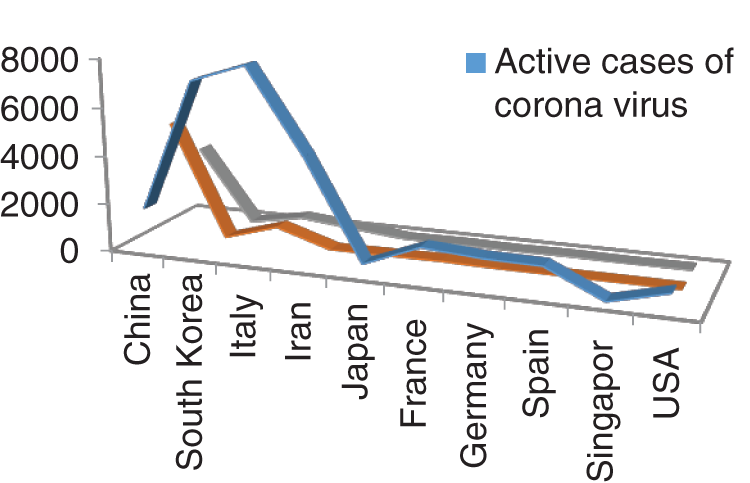
Figure 2: Outbreak of Active cases, Critical condition and death individual with corona virus
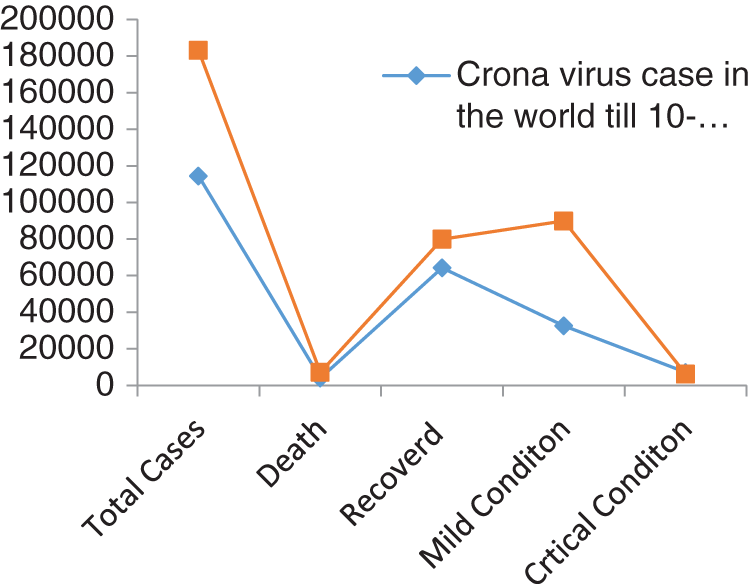
Figure 3: Comparison of coronavirus outbreak with time delay
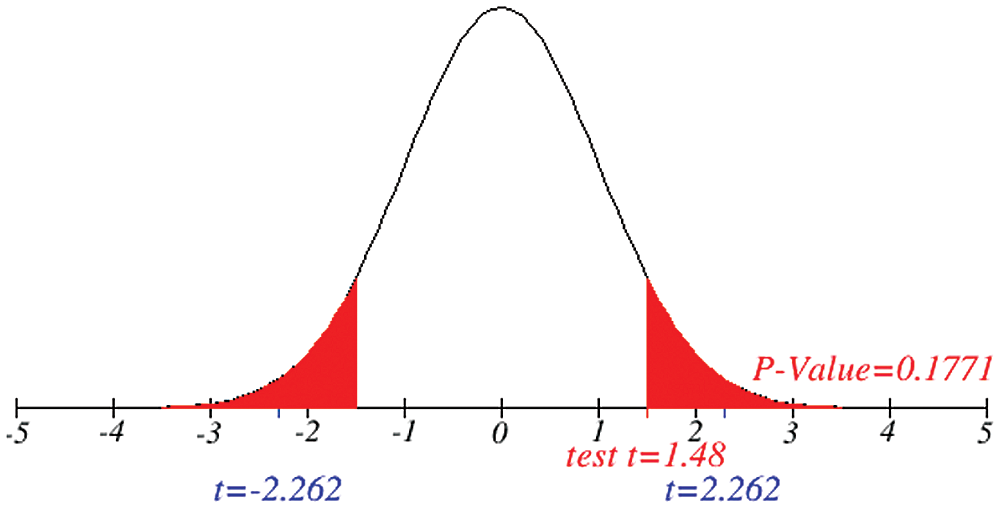
Figure 4: Testing of hypothesis for average coronavirus cases
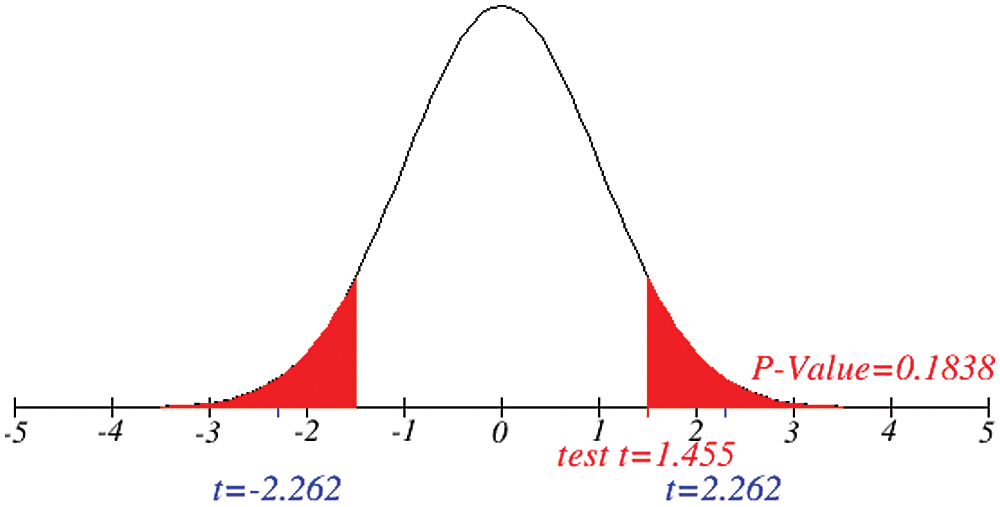
Figure 5: Testing of hypothesis for average death cases
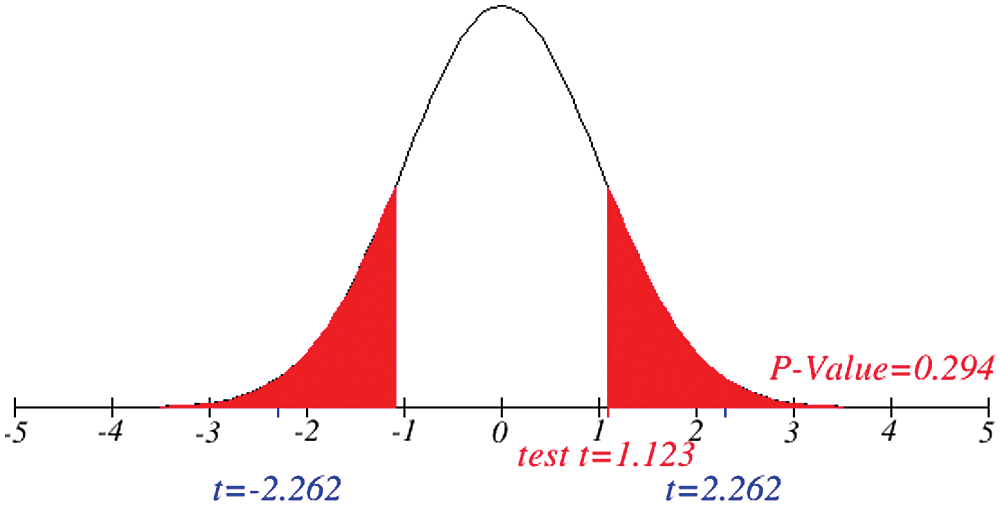
Figure 6: Testing of hypothesis for average recovered cases
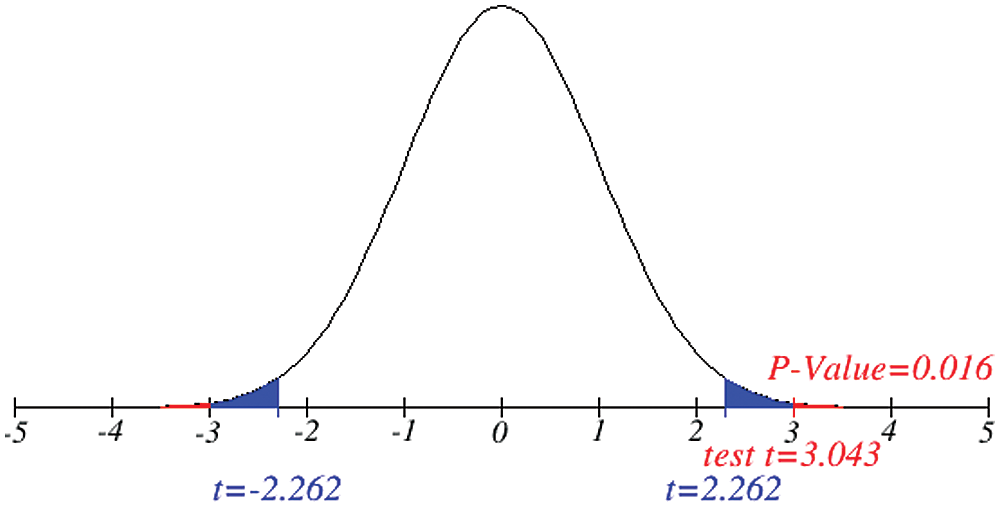
Figure 7: Testing of hypothesis for average active cases
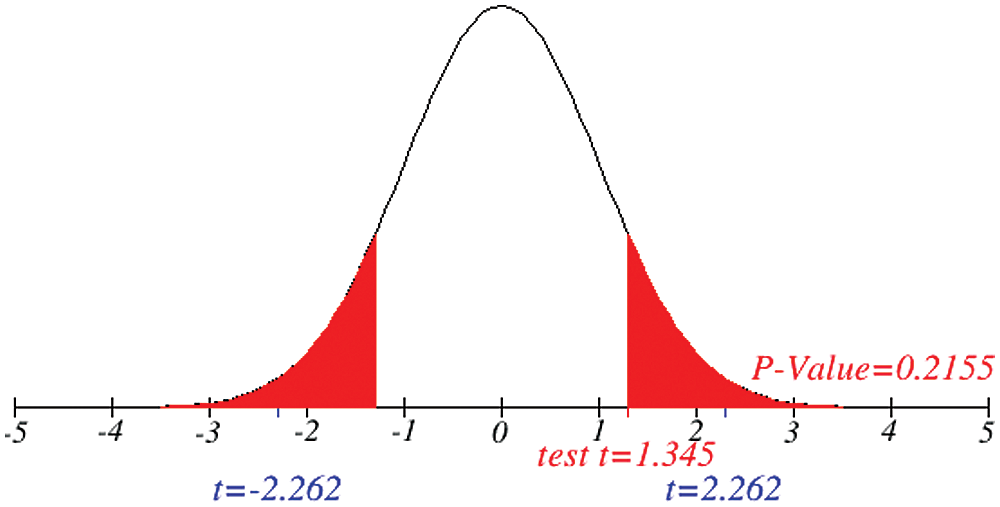
Figure 8: Testing of hypothesis for average critical cases
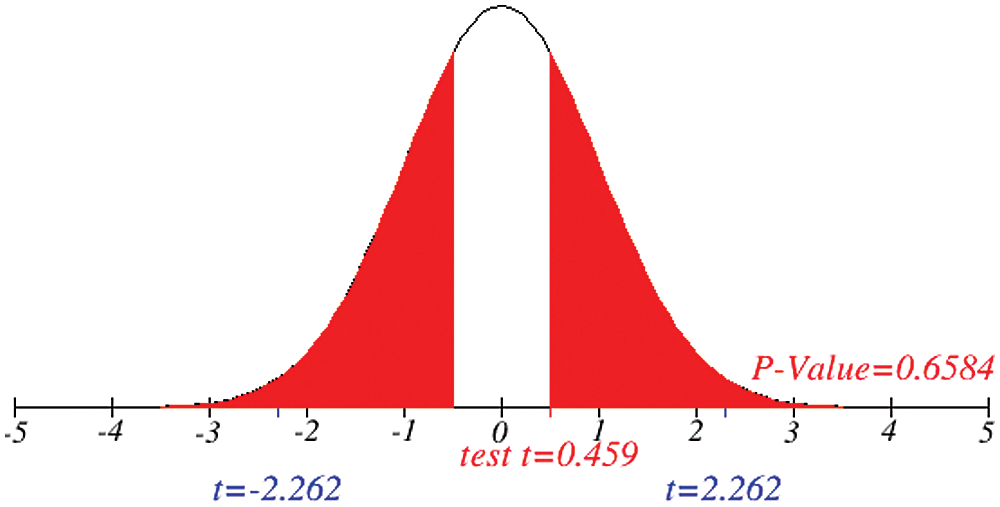
Figure 9: Testing of hypothesis for difference between total and recovered cases
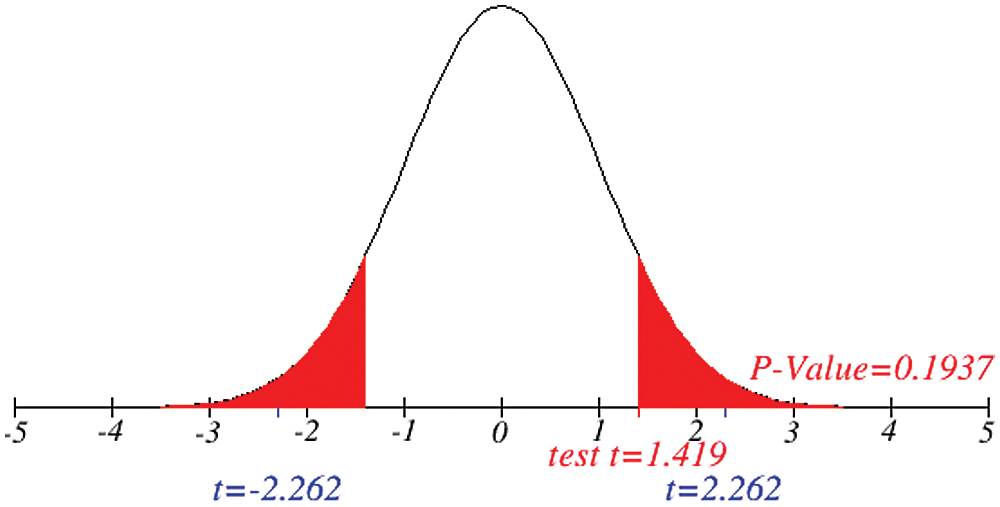
Figure 10: Testing of hypothesis for differences of total and death cases

Figure 11: Testing of hypothesis for differences of total and active cases
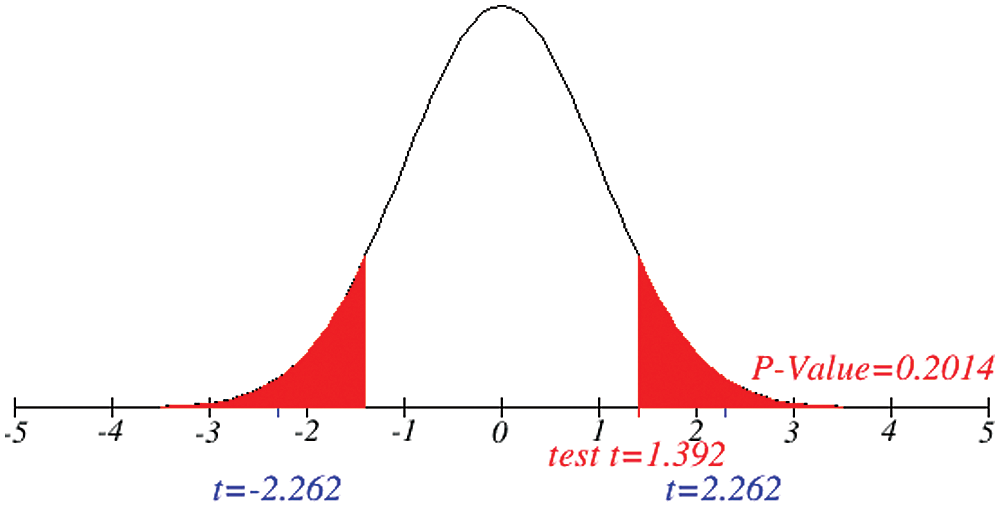
Figure 12: Testing of hypothesis for differences of total and critical condition
Investigation of developed hypotheses for different countries with 95% confidence and the average effects were calculated country-wise including p-value which shows how much significance is increased in COVID 19. Also, the hypothesis was developed for the differences of different effects with total cases including standard error with zero hypothesized difference mean. Ultimately a decision was made for the developed hypothesis to accept or reject our null hypothesis. Graphical representation of spread virus with developed hypotheses can be easily analyzed to show the actual behavior and effect of diseases. Comparison was made to check the increasing effects worldwide over the time.
Acknowledgement: We certify that the information that we have presented here is accurate and complete to the best of our knowledge.
Funding Statement: The authors received no specific funding for this study.
Conflicts of Interest: The authors declare that they have no conflicts of interest to report regarding the present study.
1. R. S. Baric, K. Fu, W. Chen and B. Yount. (1995). “High recombination and mutation rates in mouse hepatitis virus suggest that coronaviruses may be potentially important emerging viruses,” Advances in Experimental Medicine and Biology, vol. 380, pp. 571–576. [Google Scholar]
2. R. Mark and M. D. Denison. (2004). Coronavirus Research: Keys to Diagnosis, Treatment and Prevention of SARS. Bookshelf ID, NBK92477: ncbi, National Academy of Sciences. [Google Scholar]
3. S. R. Weiss and J. L. Leibowitz. (2011). “Coronavirus pathogenesis,” Advances in Virus Research, vol. 81, pp. 85–164. [Google Scholar]
4. P. S. Masters, S. Perlman and S. Coronaviridae. (2013). In: D. M. Knipe, P. M. Howley (Eds.Fields Virology, 6th ed., vol. 2. Philadelphia: Lippincott Williams & Wilkins, pp. 825–858. [Google Scholar]
5. S. Su, G. Wong, W. Shi, J. Lue, A. C. K. Lai et al. (2016). , “Epidemiology, genetic recombination, and pathogenesis of coronaviruses,” Trends Microbiology, vol. 24, no. 6, pp. 490–502. [Google Scholar]
6. N. S. Zhong, B. J. Zheng and Y. M. Li. (2003). “Epidemiology and cause of severe acute respiratory syndrome (SARS) in Guangdong,” Lancet, vol. 362, pp. 1353–1358. [Google Scholar]
7. G. Wong, W. Liu, Y. Liu, B. Zhou, Y. Bi et al. (2015). , “SARS, and Ebola: The role of super-spreaders in infectious disease,” Cell Host & Microbe, vol. 18, no. 4, pp. 398–401. [Google Scholar]
8. N. Zhu, D. Zhang and W. Wang. (2019). “A Novel Coronavirus from Patients with Pneumonia in China,” The new England journal of medicine, vol. 727, pp. 1–7. [Google Scholar]
9. WHO. (2005). “Statement on the second meeting of the International Health Regulations, Emergency Committee regarding the outbreak of novel coronavirus (2019-nCoV),” . https://www.who.int/news/item/. [Google Scholar]
10. C. Rivers, J. P. Chretien, S. Riley, J. A. Pavlin, A. Woodward et al. (2019). , “Using outbreak science to strengthen the use of models during epidemics,” Nature Communication, vol. 10, no. 1, pp. 3102. [Google Scholar]
11. K. Sun, J. Chen and C. Viboud. (2020). “Early epidemiological analysis of the coronavirus disease 2019 outbreak based on crowd sourced data: A population-level observational study,” Lancet Digital Health, vol. 7500, no. 20, pp. 30026–30021. [Google Scholar]
12. M. Natalie, T. Kobayashi Linton and Y. Yang. (2020). “Incubation period and other epidemiological characteristics of 2019 novel coronavirus infections with right truncation: A statistical analysis of publicly available case data,” Journal of Clinical Medicine, vol. 9, no. 2, pp. 538. [Google Scholar]
13. C. Huang, Y. Wang, X. Li, L. Ren and J. Zhaoet al. (2020). , “Clinical features of patients infected with 2019 novel coronavirus in Wuhan,” Lancet, vol. 395, pp. 497–506. [Google Scholar]
14. C. A. Donnelly, A. C. Ghani, G. M. Leung, A. J. Hedley, C. Farser et al. (2003). , “Epidemiological determinants of spread of causal agent of severe acute respiratory syndrome in Hong Kong,” Lancet, vol. 361, no. 9371, pp. 1761–1766. [Google Scholar]
15. World meter Caronavirus, https://www.worldometers.info/coronavirus/. [Google Scholar]
16. L. Qun, X. Guan and P. Wu. (2019). “A novel coronavirus from patients with pneumonia in china,” 2019 The New England Journal of Medicine, vol. 2001316, pp. 727–733. [Google Scholar]
17. M. Naveed, D. Baleanu, M. Rafiq, A. Raza, A. H. Soori et al. (2020). , “Dynamical behavior and sensitivity analysis of a delayed coronavirus epidemic model,” Computers Materials & Continua, vol. 65, no. 1, pp. 225–241. [Google Scholar]
18. D. Baleanu, H. Mohammadi and S. Rezapour. (2020). “A fractional differential equation model for the COVID-19 transmission by using the Caputo-Fabrizio derivative,” Advances in Difference Equations, vol. 20, no. 1, pp. 299. [Google Scholar]
19. A. Raza, M. Farman, A. Akgül, M. S. Iqbal, A. Ahmad et al. (2020). , “Simulation and numerical solution of fractional order Ebola virus model with novel technique,” AIMS Bioengineering, vol. 7, no. 4, pp. 194–207. [Google Scholar]
20. A. Ahmed, B. Salam, M. Mohammad, A. Akgül and S. H. A. Khoshnaw. (2020). “Analysis coronavirus disease (COVID-19) model using numerical approaches and logistic model,” AIMS Bioengineering, vol. 7, no. 3, pp. 130–146. [Google Scholar]
 | This work is licensed under a Creative Commons Attribution 4.0 International License, which permits unrestricted use, distribution, and reproduction in any medium, provided the original work is properly cited. |