DOI:10.32604/cmc.2021.015469
| Computers, Materials & Continua DOI:10.32604/cmc.2021.015469 | |
| Article |
Industrial Food Quality Analysis Using New k-Nearest-Neighbour methods
1Laboratory of Statistics and Stochastic Processes, University of Djillali Liabes, Sidi Bel Abbes, 22000, Algeria.
2Department of Mathematics, College of Science, King Khalid University, Abha, 62529, Saudi Arabia
3Statistical Research and Studies Support Unit, King Khalid University, Abha, 62529, Saudi Arabia
4Faculté des sciences de Tunis, Laboratoire des Réseaux Intelligents et Nanotechnologie, Tunis, Tunisia
*Corresponding Author: Mohammed Kadi Attouch. Email: attou_kadi@yahoo.fr
Received: 23 November 2020; Accepted: 01 January 2021
Abstract: The problem of predicting continuous scalar outcomes from functional predictors has received high levels of interest in recent years in many fields, especially in the food industry. The k-nearest neighbor (k-NN) method of Near-Infrared Reflectance (NIR) analysis is practical, relatively easy to implement, and becoming one of the most popular methods for conducting food quality based on NIR data. The k-NN is often named k nearest neighbor classifier when it is used for classifying categorical variables, while it is called k-nearest neighbor regression when it is applied for predicting noncategorical variables. The objective of this paper is to use the functional Near-Infrared Reflectance (NIR) spectroscopy approach to predict some chemical components with some modern statistical models based on the kernel and k-Nearest Neighbour procedures. In this paper, three NIR spectroscopy datasets are used as examples, namely Cookie dough, sugar, and tecator data. Specifically, we propose three models for this kind of data which are Functional Nonparametric Regression, Functional Robust Regression, and Functional Relative Error Regression, with both kernel and k-NN approaches to compare between them. The experimental result shows the higher efficiency of k-NN predictor over the kernel predictor. The predictive power of the k-NN method was compared with that of the kernel method, and several real data sets were used to determine the predictive power of both methods.
Keywords: Functional data analysis; classical regression; robust regression; relative error regression; kernel method; k-NN method; near-infrared spectroscopy
Near-infrared spectroscopy (NIRS) is a technique for measuring and analyzing reflection spectra in a class of wavelengths. Fig. 1 illustrates the basic components of the NIR spectroscopy technique; this measurement technique is analytical, fast, and non-destructive is often used to measure some parameters in terms of spectrum absorbance. For example, in the pharmaceutical industry, it is used in the manufacturing process of a drug to control the active ingredient’s exact amount. In the food industry, the spectrum can be used to test the forage quality [1]. In medical science, fluorescence spectroscopy can be used for cancer screening. Finally, in the food industry, for example, a method of classifying flour products based on resistance spectra of dough in bakeries.

Figure 1: Schematic representation of the near-infrared NIR spectroscopy-based setup, the basic
Although the NIR has given excellent results when used in various other fields such environment and the petrochemical industries, it remains relatively new for its use in virology. This method has also been used with great success for the identification of HIV-1 and the influenza virus. The advantage of using this method is that it does not require reagents or test kits that take a considerable time to perform these tests. For example, we mention the PCR (Polymerase chain reaction) or RT-PCR (reverse transcription-polymerase chain reaction) test that gives results in most cases for more than 2 h.
Usually, the NIR spectrometry is combined with some multivariate statistical models, such as the principal component regression or the partial least regression. To increase the accuracy of this procedure, we use the recent development in data science. Precisely, we combine the NIR spectrometry technology with big-data techniques modeling. The statistical modeling of big-data is an emerging topic of applied statistics. It has received considerable attention during the last decade. The development of the current technology provides a way to measure different types of instruments and the informatics tools that motivate this subject’s work. Besides, this advancement allows the researchers to recover big data being recorded over time.
One of the most advantages of this thematic is the fact that the statistical data can be treated as curves. Our main goal in this project is to develop a new software code induced from some recent statistical models adapted for NIR spectrometry data viewed as curves. The proposed models include the functional version of the PCR regression (principal component regression), and the PLS regression (partial least squares regression), etc. It is worth noting that the originality of the nonparametric analysis of functional statistics is that it links the probability structure to the topological structure to explore the most pertinent information about the data. An alternative to the preceding methods, we propose a new smoothing method constructed by the combination of the nonparametric functional regression methods and the kernel nearest-neighbor scheme. This new smoothing method keeps the robustness of the weighting functions.
Functional data analysis (FDA) arises mainly to resolve problems relating to time-like curves. In chemometric, it is usual to measure specific parameters in terms of a set of spectrometric curves that are observed in a finite set of points (functional data). In the past decades, spectroscopy has steadily gained importance as a rapid and non-destructive analytical technique in the domains of medicine, chemistry and pharmaceutical, environmental, agricultural, and food sciences.
Near-infrared spectrometry (NIR) provides benchmark examples coming from chemometrics. It is an analytical chemometric technology quick technique that involves subjecting a sample to infrared radiation to measure certain parameters of interest in terms of the absorbance spectrum; see, among others [2,3]. Absorption spectroscopy is used as an analytical chemistry tool to determine the presence of a particular substance in a sample and, in many cases, to quantify the amount of the substance present. The utility of absorption spectroscopy in chemical analysis is because of its specificity and its quantitative nature. In spectroscopy, the measured spectra are typically plotted as a function of the wavelength or wave-number but analyzed with functional data analysis (FDA) techniques. Traditionally, spectral data are analyzed through multivariate statistical methods such as multiple linear regression (MLR), principal components regression (PCR), and partial least squares regression (PLS) [4,5], which consider the spectrum as a set of m different variables (curves).
There are many applications of the FDA in spectrometry. For example, these NIR spectra have been used in [6] to predict the oil content of the corn samples (multivariate calibration). In [7], the goal is to predict the composition (fat, sugar, and water content) of biscuit dough pieces using predictors of the NIR reflectance spectrum of dough pieces at 256 equally spaced wavelengths. In the food industry, the spectrum can be used to predict the fatness of a piece of meat (see [8]). NIR spectra are also used to study the forage quality assessment (see [9–12] for recent advances).
More precisely, this paper aims to use the functional Near-Infrared Reflectance spectroscopy approach to predict some chemical components with some modern statistical models based on the kernel and k-NN procedures. In this article, three NIR spectroscopy datasets are used as examples: Cookie dough, sugar, and tecator data. Specifically, we propose three models for this kind of data: Functional Nonparametric Regression, Functional Robust Regression, and Functional Relative Error Regression, with both kernel and k-NN approaches.
The paper is organized as follows. Section 2 describes the prediction problems and the data used. We discuss our results in Section 3. The conclusion is presented in Section 4.
Grid of measurements Near-infrared spectrometry provides benchmark examples coming from chemometrics. This is a non-destructive technology able to measure numerous chemical compounds in a wide variety of products (food industry, petroleum industry, wood industry, etc.); see among others [2,13–16]. For instance, let us consider a sample of 72 cookie dough samples. Each sample is illuminated by a light beam at 700 equally spaced wavelengths 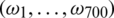 in the near-infrared range 1100 −2498 nm. For each wavelength
  and each cookie sample i, the absorption
  of radiation is measured. The ith discretized spectrometric curve is given by
 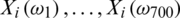 , and Fig. 2 displays the 72 spectrometric curves.
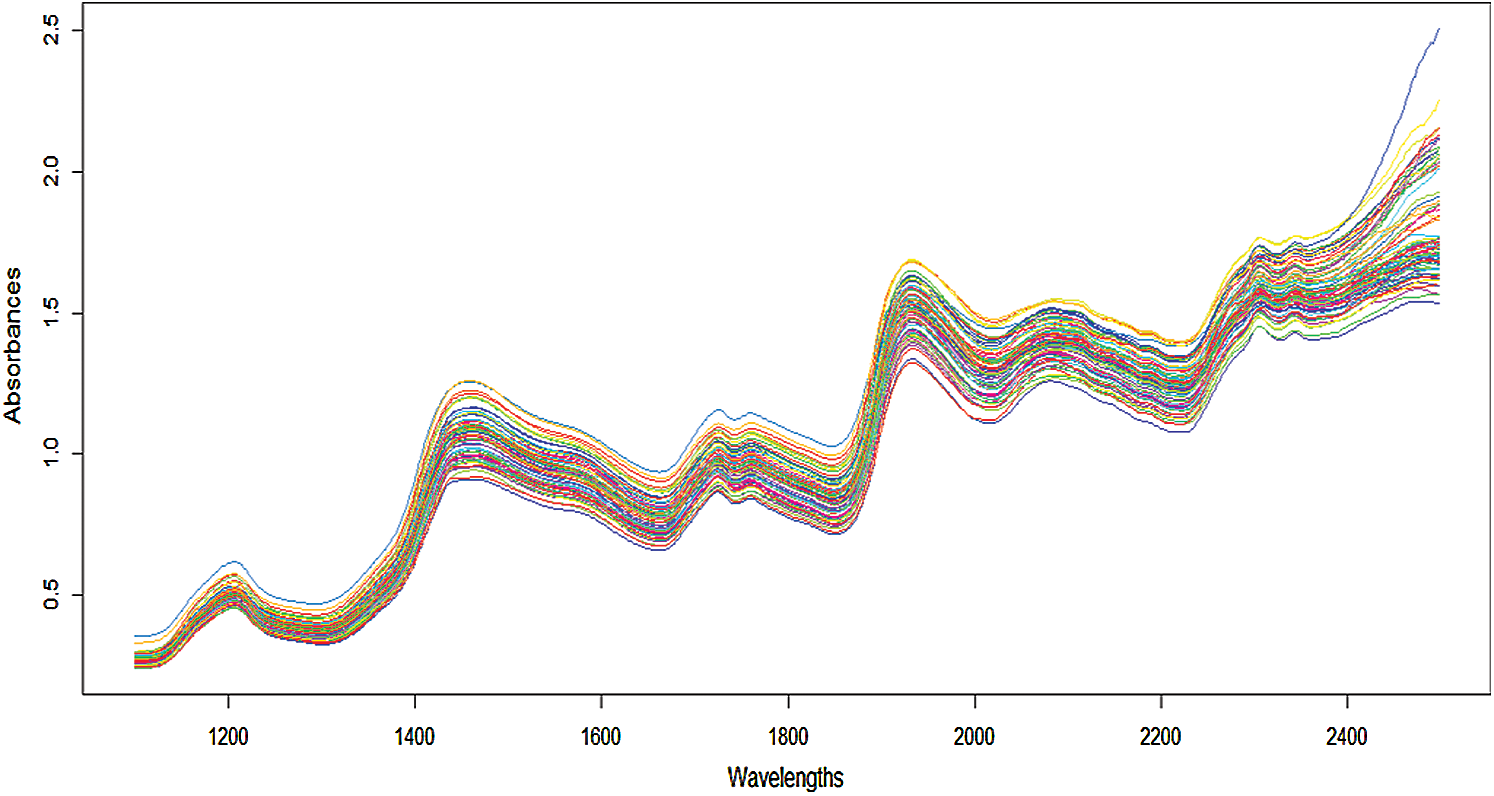
Figure 2: Cookie dough 72 samples of near-infrared spectra
All these curves involve some continuum in their structure, even if they are observed at discrete points. The terminology of functional data refers to this continuous feature. Figs. 3 and 4 give a benchmark example of such data for the food industry introduced in [17]: 268 samples of sugar were dissolved, and the solution was measured spectrofluorometrically. For every sample, the emission spectra from 275 to 560 nm were measured in 0.5 nm intervals (i.e., at 571 wavelengths  ) the ith discretized spectrometric curve is given by
  . We mention [18], who studied 215 finely chopped pieces of meat (tecator data). For the ith piece of meat, one observes a spectrum of absorption
  sampled at 100 equally spaced wavelengths
  from 850 to 1050 nm.
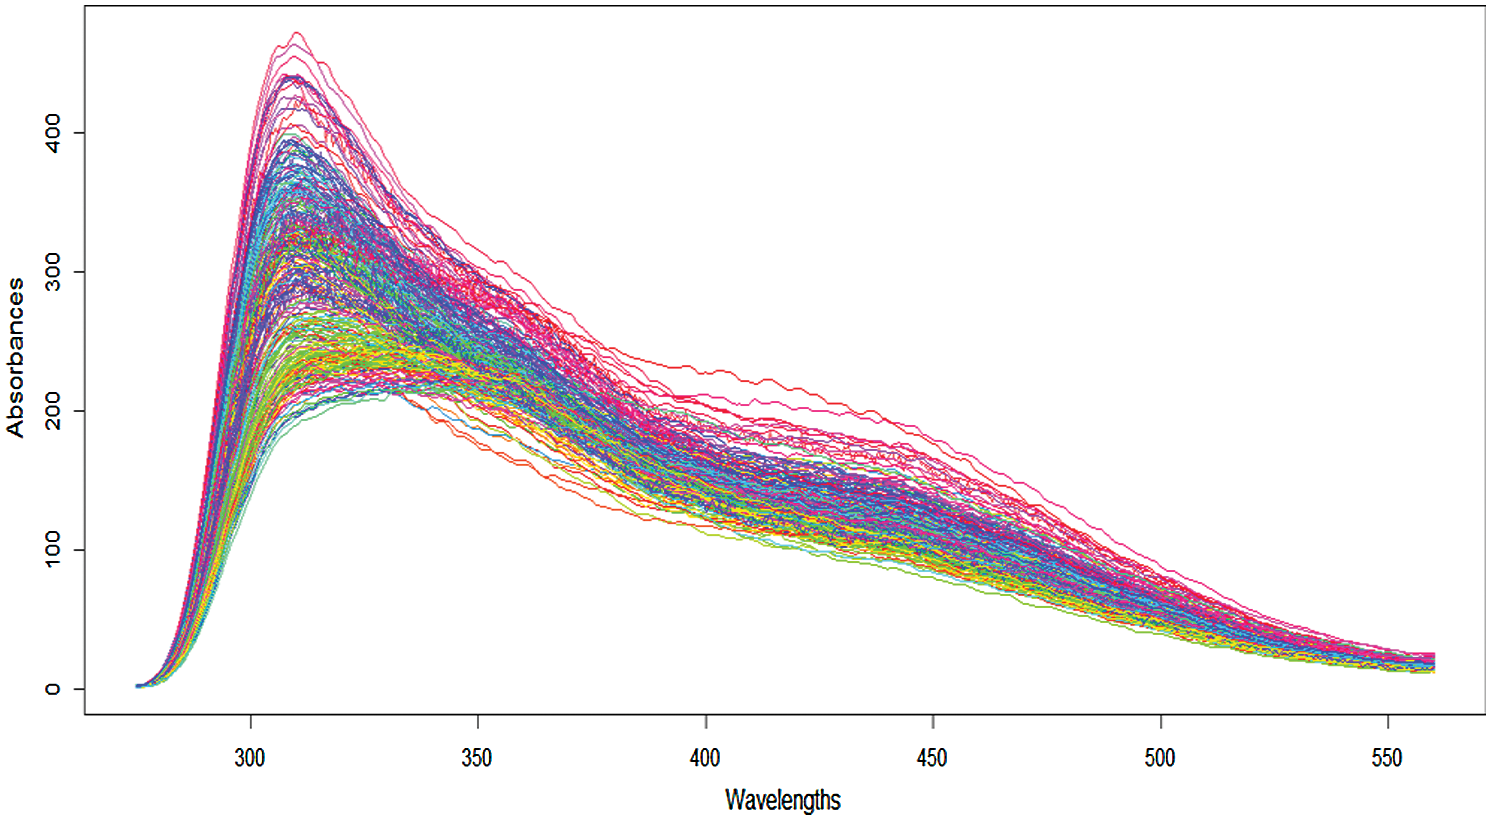
Figure 3: 268 spectrometric curves sampled of the sugar data
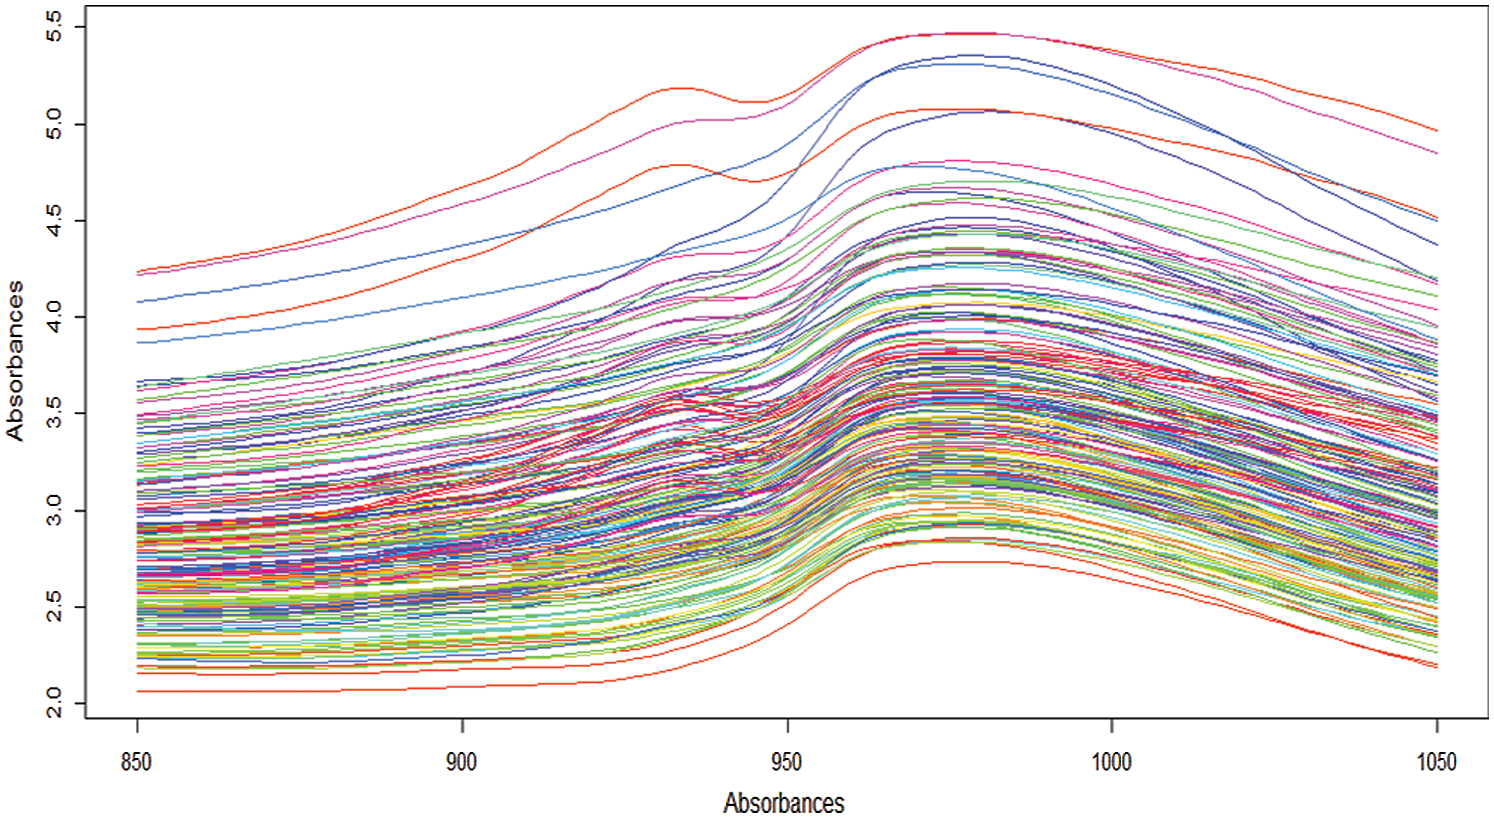
Figure 4: The 215 NIR spectroscopy curves of the tecator data
Throughout these three examples, which will be our connecting thread, one can remark that the grid of measurements (i.e., wavelengths) for the spectrometric curves is quite dense.
In chemometrics, there are often function-like absorbance or emission spectra–-mainly for food samples–-used to determine certain ingredients’ content. The use of spectra function is typically much cheaper than alternative chemical analysis.
This paper aims to present various ways of nonlinear modeling relationships in datasets containing functional data and discuss methodological aspects. We focus on the particular case when one regresses a scalar response on an explanatory functional variable. To fix the ideas, let’s present the mathematical formulation of our prediction problem. Indeed, assume that we aim to predict the content of certain ingredients: the sucrose content for the cookie dough, the quality ash in the percentage of the sugar given, and the fat content for the piece of meat. Denoted contents by Yi, the spectrometric curves associated Xi. Note that Y’s values for the percentage of the sugar are discrete; Therefore, we will consider that Y is a continuous approximation. We assume that the output variable Y and the input variable X are linked by the following regression formula

where  is an unknown operator modeling the relationship between X and Y and the white noise
  represents an independent random variable of X with a symmetric distribution. The statistical challenge consists of proposing a relevant estimator. Here, we focus our attention on regression models such that
  and propose in the following three models: Functional Nonparametric Classical Regression, Functional Robust Regression, and Functional Relative Error Regression.
2.2.1 Functional Classical Regression
The nonparametric estimation of the functional regression was initially studied by [19,20], who used the Nadaraya Watson method to estimate this statistical model. Precisely, the function m(.) is explicitly expressed using the least square error criterion by

It follows that
So, for all fixed curves x we predict the response y with respect to the criterion in Eq. (2) by  (the classical kernel estimator of m(x)) defined by

with K is a kernel function and hn is a non-negative real sequence.
2.2.2 Functional Robust Regression
This regression model is obtained by resolving the following optimization problem

 is a real-valued Borel function chosen by the user according to the studied data. The model in Eq. (4) has been introduced in functional statistics by [21,22]. The robustness is the main advantage of this model. It permits the analysis of the data even in the presence of the outliers. Its functional estimation is expressed by

2.2.3 Functional Relative Error Regression
This last regression is an alternative nonparametric regression to the least square regression model. It is recently considered in functional statistics by [23]. It is defined by the following rule

The expression of this regression is explicitly given by
and its estimator is defined by

The performance of all the models mentioned above is closely linked with the use of different parameters involved in the estimation. We opted for the asymmetric quadratic kernel defined as  . Thus, the smoothness of curves Xi(t) and the smoothing parameter hn are the most influencing parameters in this prediction issue. Concerning the norm
  , the distances between the smoothed curves are computed by
For basic materials on the latter notion, we refer the readers to [19]. On the other hand, the bandwidth parameter, h, selection is a more important procedure for conducting the estimation. Our main goal is to compare two methods (kernel CV method and the k-Nearest Neighbors k-NN method) for our three estimators  ,
,  and
and  . In the following, we describe the use of these methods for our proposed estimators.
Using the kernel CV method, we obtain


and

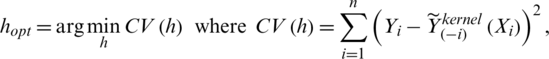
where hopt is the data-driven bandwidth obtained by a cross-validation procedure:
with  the values of the estimator
  ,
,  or
or  calculate at Xi.
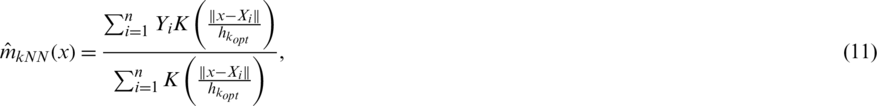
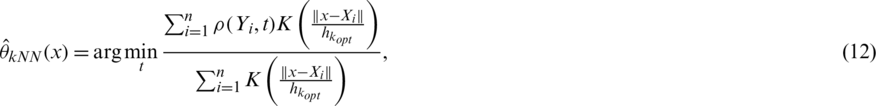
Using the method of k-Nearest Neighbors k-NN procedure, we obtain
and
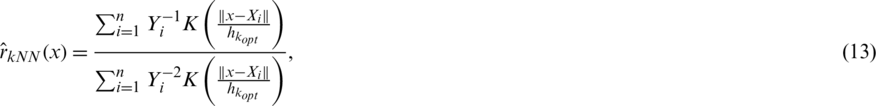
where hkopt is the bandwidth corresponding to the optimal number of neighbors obtained by a cross-validation procedure:
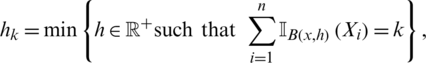
with
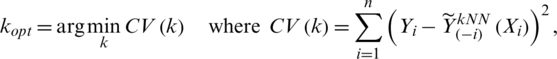
where  (
( is the ceiling function) and
  represent the values of the estimator
  ,
,  or
or  calculate at Xi. To evaluate the efficiency of the proposed model in this prediction issue, we randomly split the n-sample into two parts: One is a training sample
 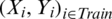 (for example, we take 65% of the sample form the cookie dough data, 75% form the sugar data) which is used for modeling procedure, and the other is a testing sample
 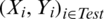 which is used to verify the prediction effect. The testing sample provides the mean squared error (MSE) and the relative mean squared error (RMSE) of prediction:

where nTest is the length of the testing sample and  indicate the prediction values of the estimators
  ,
,  ,
,  ,
,  ,
,  and
and  calculate at Xi. The obtained prediction results are shown in Figs. 5–7.
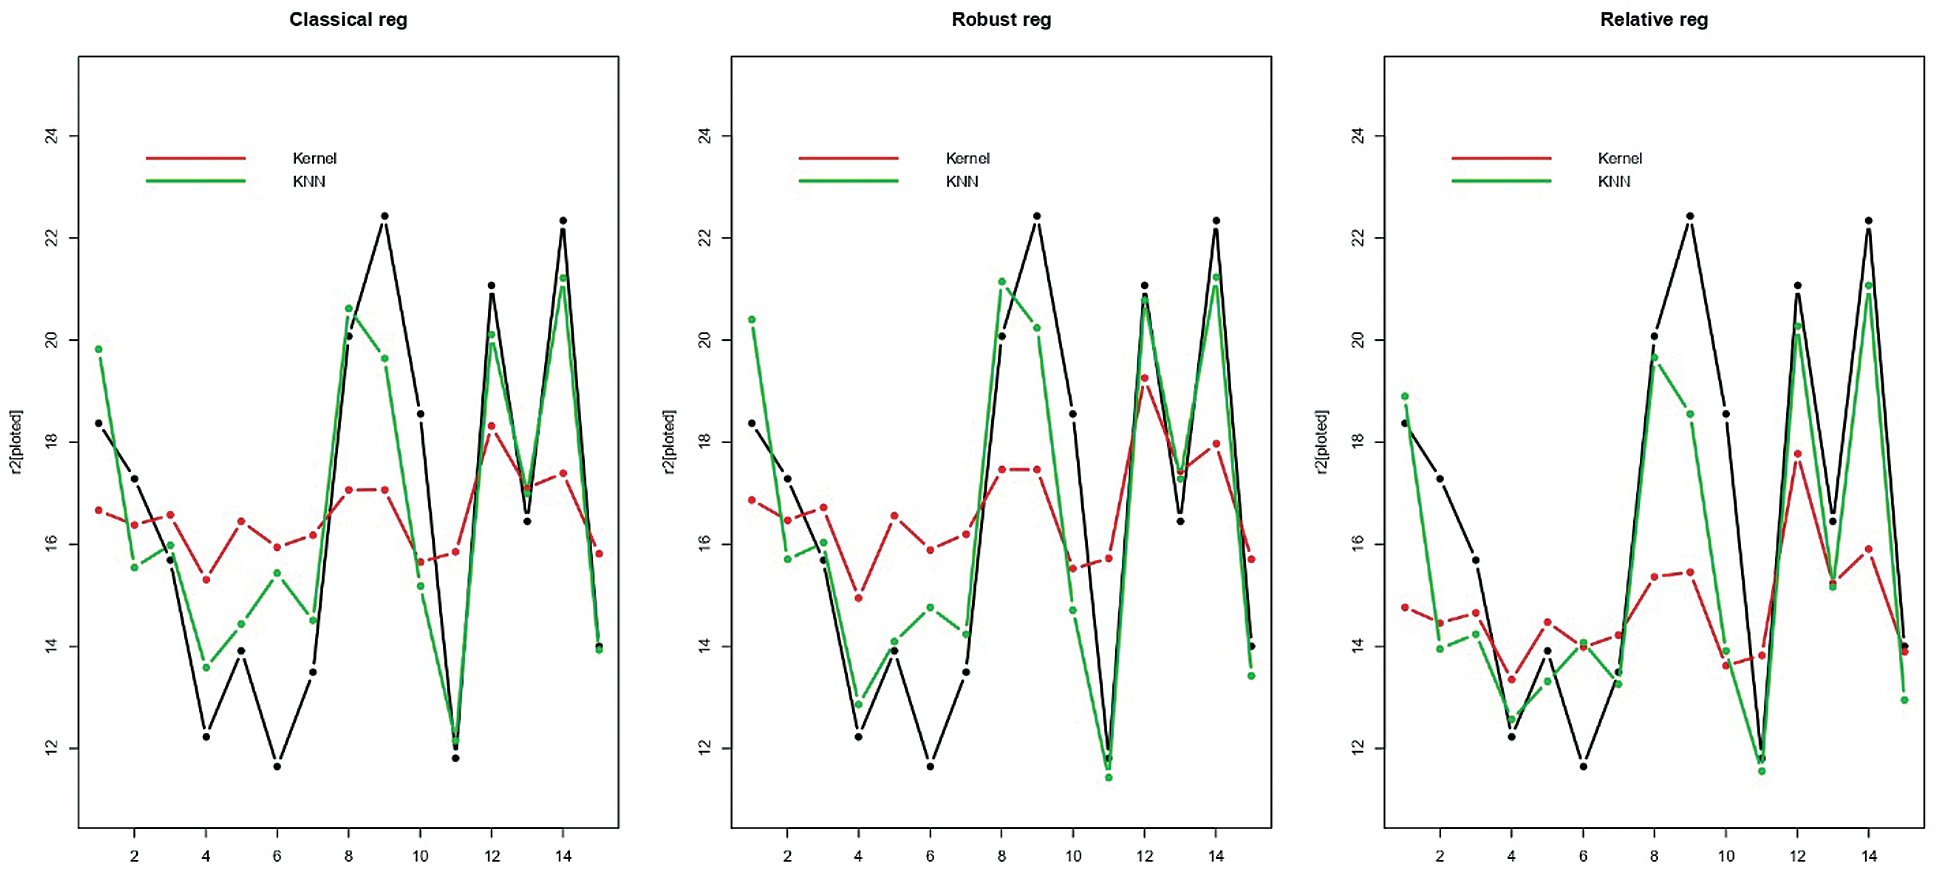
Figure 5: Prediction of the last 15 testing cookie dough samples
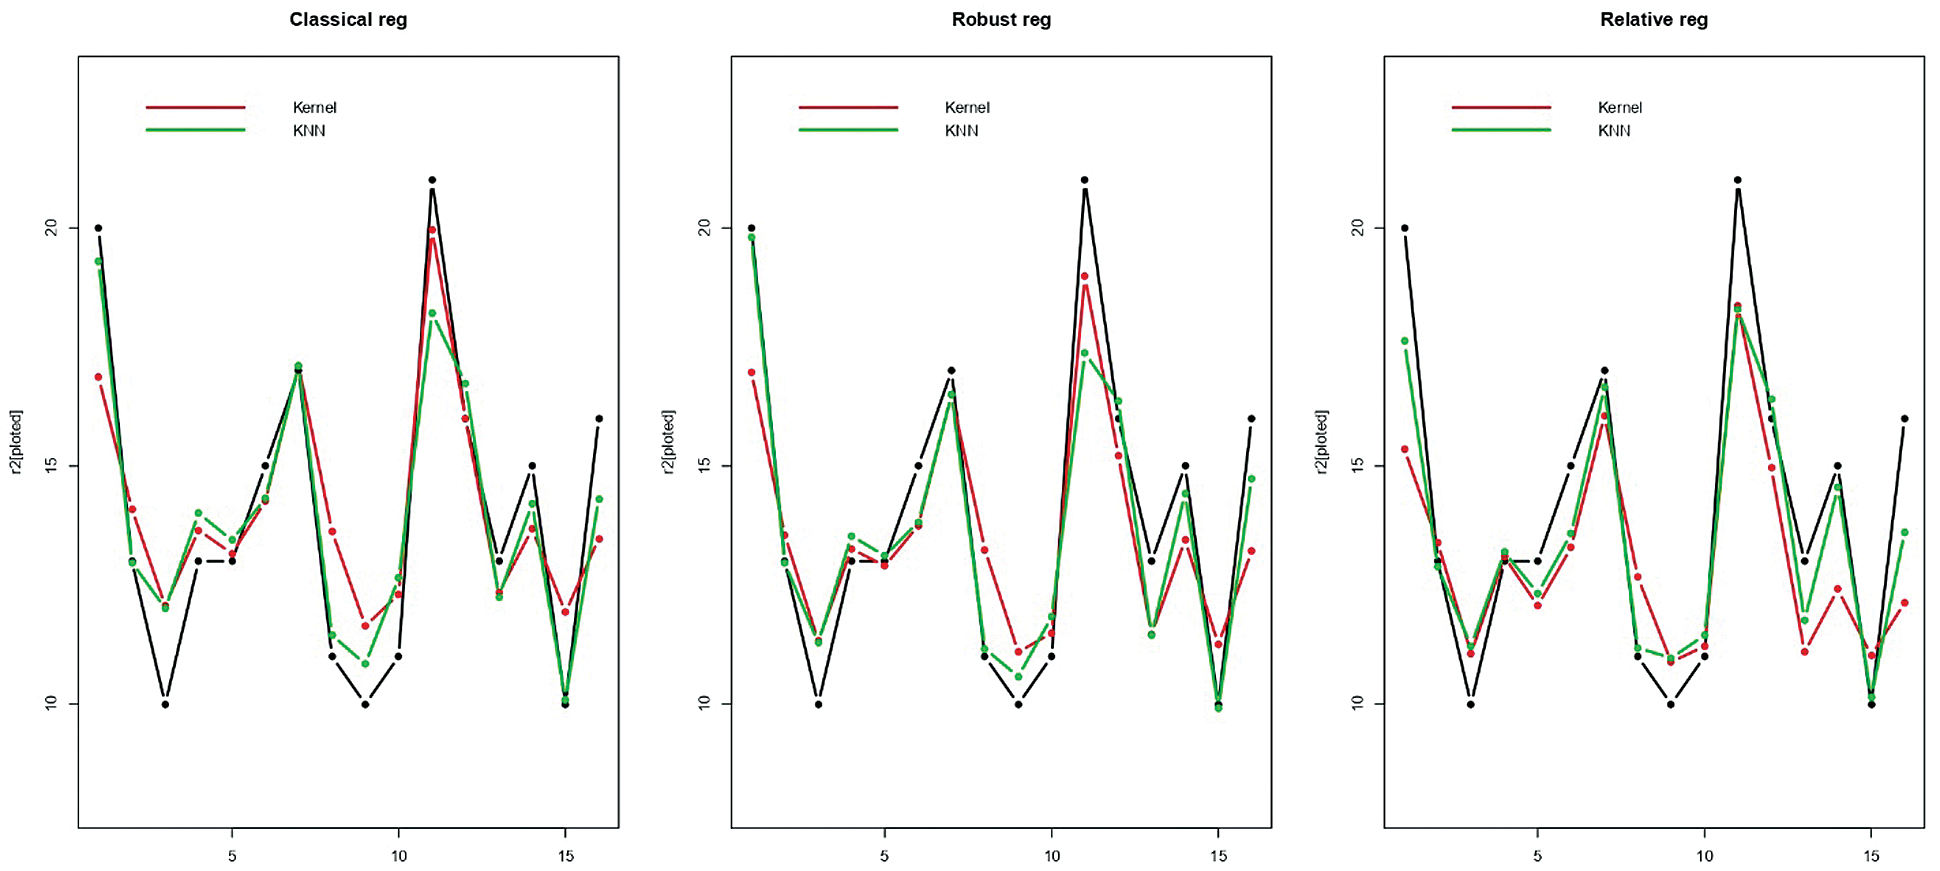
Figure 6: Prediction of the last 16 testing sugar samples
Figure 7: Prediction of the last 20 testing tecator samples
Figs. 5–7 give an idea of the accuracy of the predictions corresponding to one run. They present the last 15th, 16th and 20th of each data’s predictions, respectively: The observed values (black curve), the predicted values (dashed red for the kernel regression, and green for the k-NN one) are drawn. It is depicted in Figs. 5–7 that there is a significant gain among the k-NN models compared to the kernel CV ones. The k-NN models for the classical, robust, and relative regression give better results than the kernel CV for the classical, robust, and relative regression. To further explore the performances of the six methods, we carry out M = 100 independent replications, which allow us to compute 100 values for MSE and display their distribution through a bean plot. Figs. 8–10 show the bean-plots of the MSE of the prediction values. Moreover, Tab. 1 shows that the models in Eqs. (11)–(13) give small MSE followed by those in Eqs. (8)–(10). The same fact is confirmed by Tab. 2, where we present the RMSE.
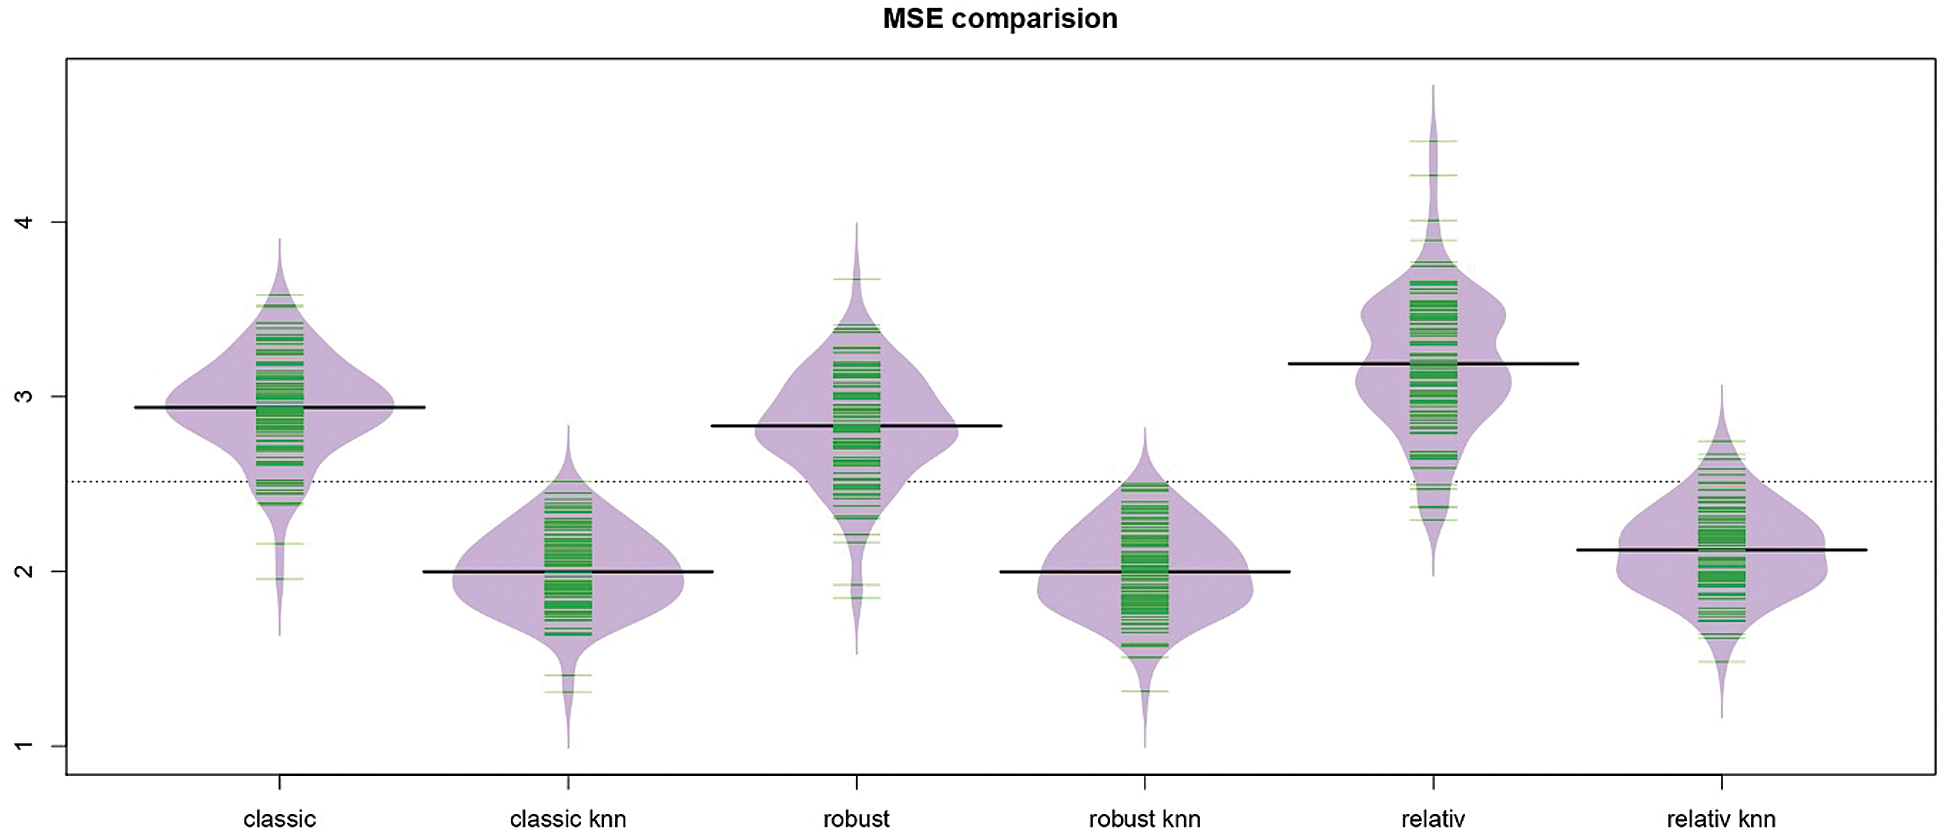
Figure 8: The bean-plots of the MSE of the prediction values by the six methods for the cookie dough data
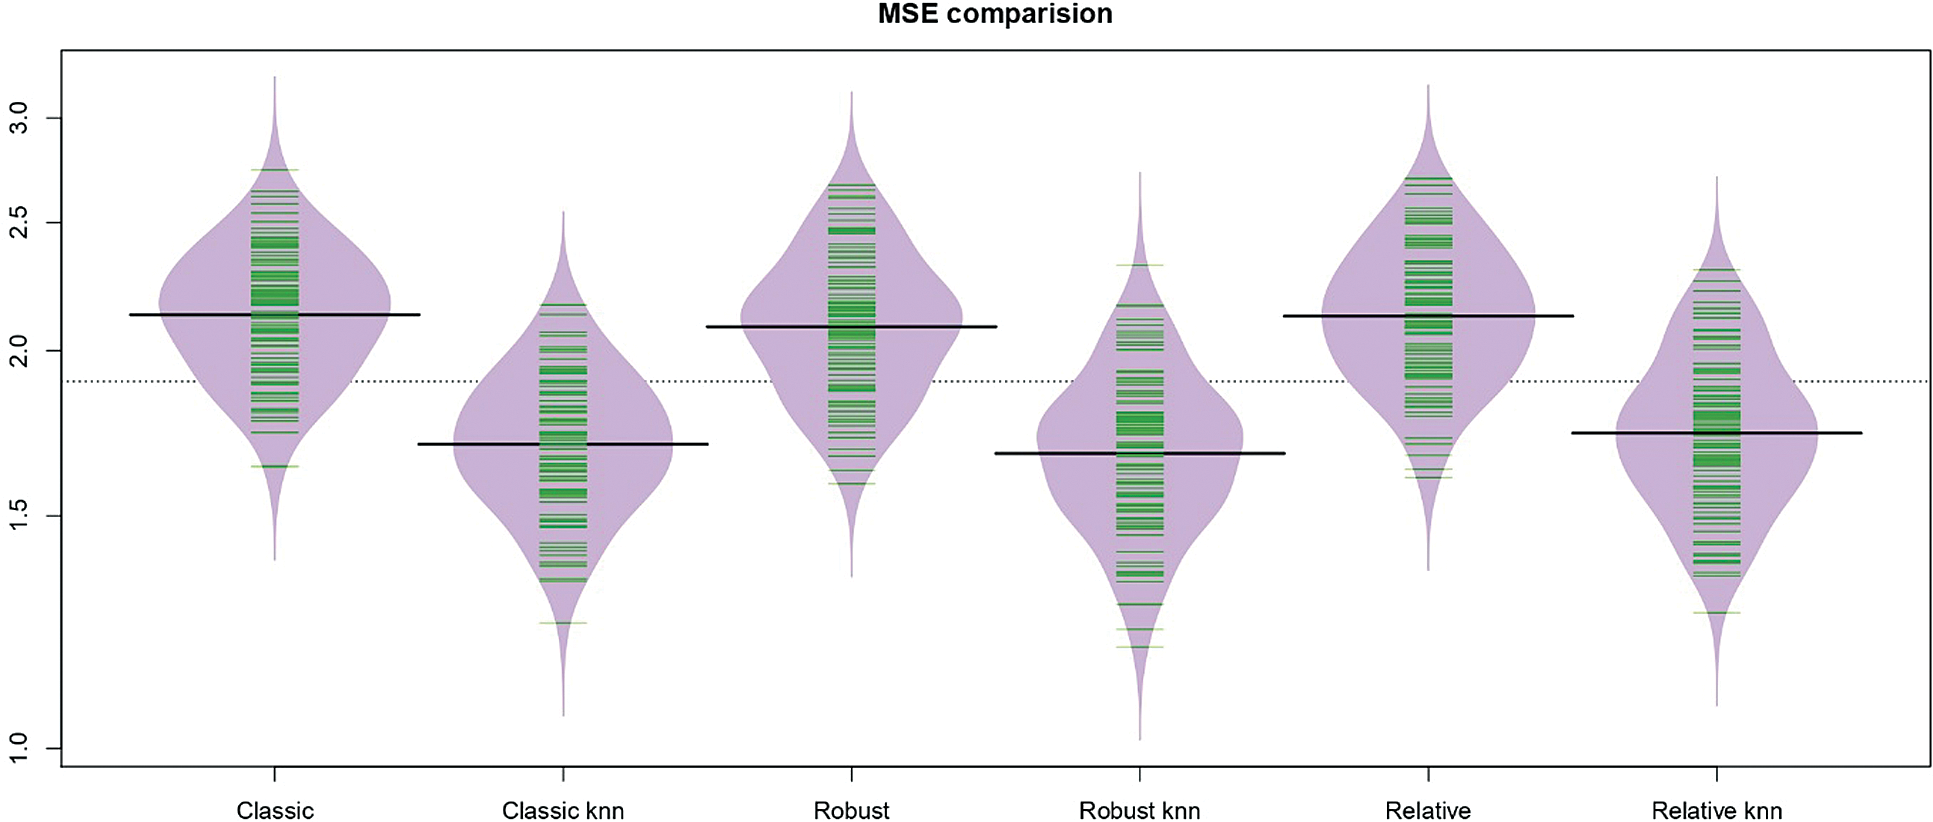
Figure 9: The bean-plots of the MSE of the prediction values by the six methods for the sugar data
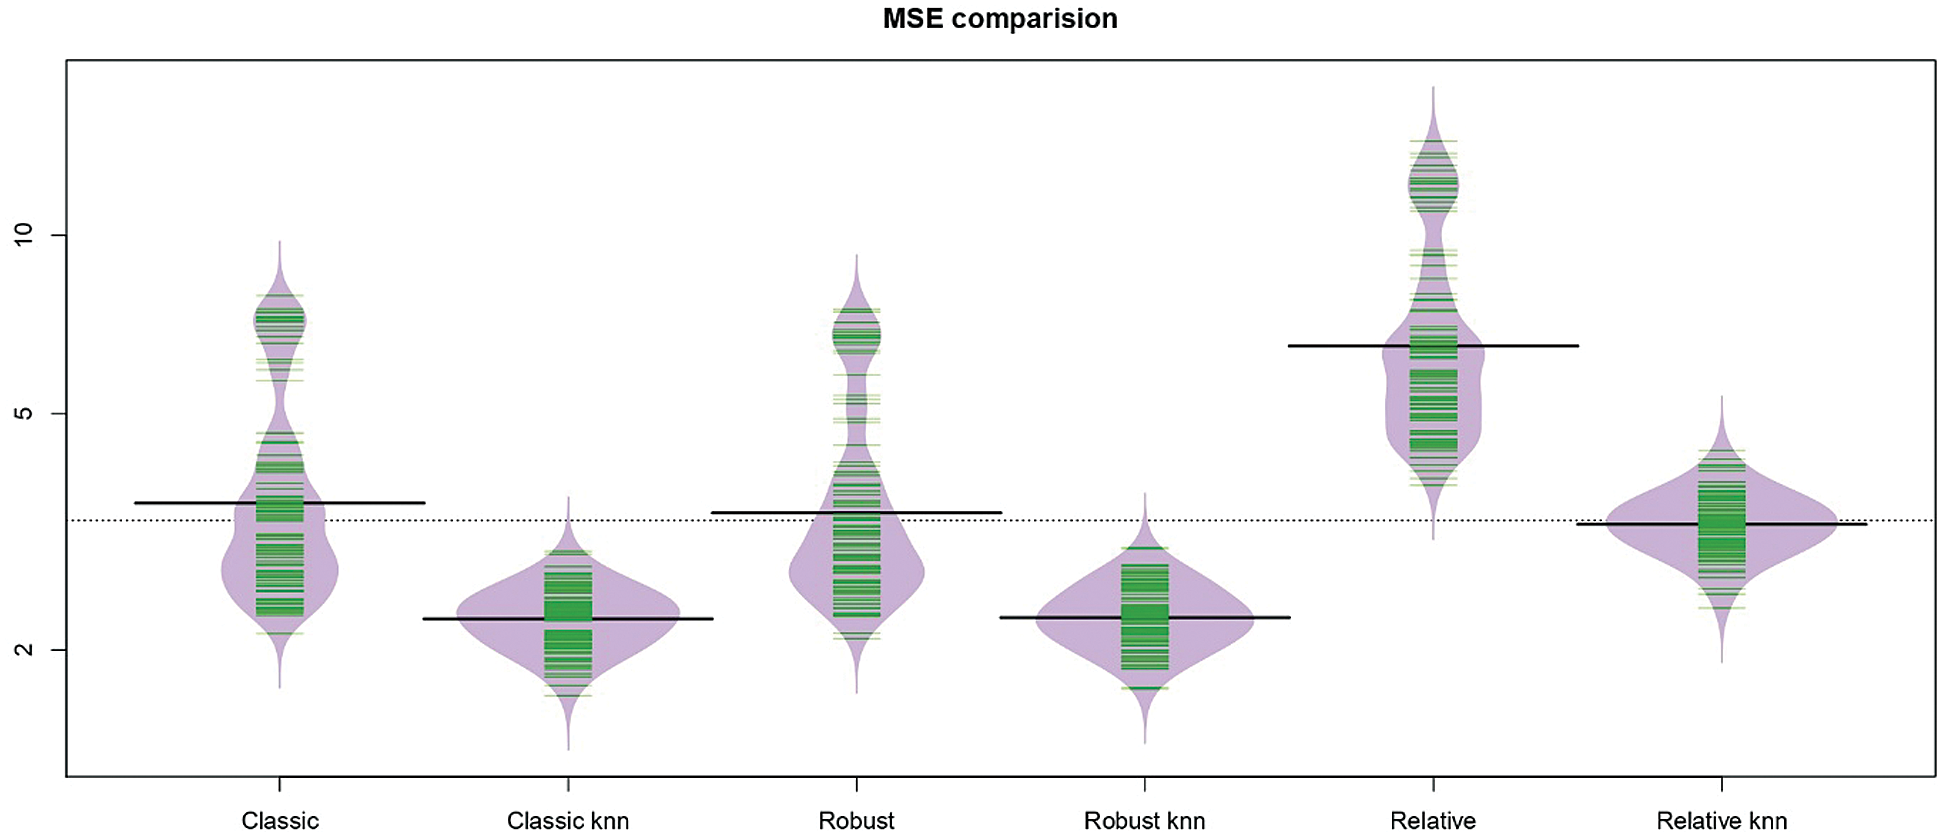
Figure 10: The bean-plots of the MSE of the prediction values by the six methods for the tecator data
Table 1: MSEs by the six methods for each data
Table 2: Relative mean squared error RMSE by the six methods for each data
The values of RMSE are relatively stable and smaller for the three k-NN functional models, namely  ,
,  and
and  as compared to the kernel CV models, namely
  ,
,  and
and  . Although the performance of the studied models is varied, the variability of the MSE and RMSE are relatively stable for the three proposed models k-NN for the classical, robust, and relative regression as compared to that of the kernel CV for the classical, robust and relative regression models.
The principal NIR data parameters were evaluated using a sample of 72, 268, and 215 observations for the cookie dough, sugar, and tecator data, respectively. The results are summarized in Figs. 5–10. The analyzed parameters are the sucrose content for the cookie dough, the quality ash in the percentage of the sugar given, and the fat content for the tecator, which are ranged between  for the sucrose content, 8%–33% for the ash and 0.9%–49.1% for the tecator fat, respectively. Such a data analysis was operated using six functional models: Functional Nonparametric Classical Regression, Robust Functional Regression, and Functional Relative Error Regression for both Kernel CV and k-NN procedures (i.e.,
  ,
,  ,
, 
 ,
,  and
and  ).
).
The comparison of both prediction plots in Figs. 5–7 indicates that the k −NN method (green dashed curve) gives better prediction results than the kernel CV approach (red dashed curve). Figs. 8–10 display various bean-plot which summarize the distribution of MSE computed over 100 experiments based on  ,
,  ,
,  ,
,  and
and  from left to right, respectively. That confirms the previous results, as we can see the distribution of MSE for the k-NN approach is small and very tight compared to the kernel CV method, as can be clearly seen in Figs. 8–10. Based on the results in Tabs. 1 and 2, it is clear that the best models (having a small MSE and RMSE) are
  ,
,  and
and  .
.
A review of the FDA methodologies, most used in chemometrics, has been presented in this work next to different applications, most of which are in spectroscopy where the absorbance spectrum is a functional variable whose observations are functions of wavelength. The work has been divided into two main parts that can be read independently. The first part (Section 2) presents a set of chemometrics applications in most of which the aim is to either predict a variable of interest from the NIR spectrum. The second part (Section 3) summarizes our functional models’ results based on the proposed methods defined in Eqs. 8–13.
In this work, an alternative approach to deal with spectrometric data has been suggested. This approach considers a spectrum as a function of the wavelength or wave-number rather than as a set of separate points. We combine the recent development in Chemistry and modern Statistics. Specifically, we use the NIR spectroscopy technology from Chemistry, which is an inexpensive, rapid, and accurate method. Moreover, it reduces the need for conventional wet Chemistry procedures. On the other hand, from modern statistics, we use some functional models that allow exploring all the information of the spectroscopy analysis where spectral data are viewed as curves. Specifically, we propose three models for this kind of data: Functional Nonparametric Regression, Functional Robust Regression, and Functional Relative Error Regression, with both kernel and k-NN approach to compare between them. On the real examples studied (Cookie dough, Sugar, and tecator data), we show that our method using the k-NN procedure is more efficient (gives better results in the sense of MSE) than those with Cross-validation. To conclude, models of intermediate dimensionality in the high-dimensional setting is undoubtedly a highway for deriving new useful statistical methods for the food industry.
Funding Statement: The authors thank and extend their appreciation to the Deanship of Scientific Research at King Khalid University for funding this work through the Research Groups Program under Grant Number R. G. P. 1/189/41. I. M. A. and M. K. A. received the grant.
Conflicts of Interest: The authors declare that they have no conflicts of interest to report regarding the present study.
1. I. M. Almanjahie, I. Ahmad, Z. Chiker-El-Mezouar and A. Laksaci. (2019). “Modern statistical analysis of forage quality assessment with nir spectroscopy,” Applied Ecology and Environmental Research, vol. 17, no. 6, pp. 14333–14346. [Google Scholar]
2. J. H. Kalivas. (1997). “Two data sets of near infrared spectra,” Chemometrics and Intelligent Laboratory Systems, vol. 37, no. 2, pp. 255–259. [Google Scholar]
3. B. G. Osborne and T. Fearn. (1986). Near Infrared Spectroscopy in Food Analysis. New York, USA: John Wiley & Sons. [Google Scholar]
4. C. Borggaard and H. H. Thodberg. (2001). “Risk factors for human disease emergence,” Philosophical Transactions of the Royal Society of London, Series B, Biological Sciences, vol. 356, no. 5, pp. 983–989. [Google Scholar]
5. G. Public Health Service, Atlanta. (1994). “Centers for disease control and prevention,” in Addressing Emerging Infectious Disease Threats: A Prevention Strategy for the United States, Atlanta, GA: U.S. Department of Health and Human Services. [Google Scholar]
6. J. Demongeot, A. Laksaci, M. Rachdi and S. Rahmani. (2014). “On the local linear modelization of the conditional distribution for functional data,” Sankhya A, vol. 76, no. 2, pp. 328–355. [Google Scholar]
7. I. M. Almanjahie, Z. Chiker-El-Mezouar, A. Laksaci and M. Rachdi. (2018). “KNN local linear estimation of the conditional cumulative distribution function: Dependent functional data case,” Comptes Rendus Mathematique, vol. 356, no. 10, pp. 1036–1039. [Google Scholar]
8. F. Ferraty and P. Vieu. (2002). “The functional nonparametric model and application to spectrometric data,” Computational Statistics, vol. 17, no. 4, pp. 545–564. [Google Scholar]
9. Q. Bai, S. Chen, X. Dong, Q. Meng, Y. Lu et al. (2004). , “Prediction of NDF and ADF concentrations with near infrared reflectance spectroscopy (NIRS),” Guang Pu Xue Yu Guang Pu Fen Xi/Spectroscopy and Spectral Analysis, vol. 24, no. 11, pp. 1345. [Google Scholar]
10. Z. Nie, J. Han, L. Zhang and J. Li. (2007). “Applications of near infrared reflectance spectroscopy technique (NIRS) to grassland ecology research,” Guang Pu Xue Yu Guang Pu Fen Xi/Spectroscopy and Spectral Analysis, vol. 27, no. 4, pp. 691–696. [Google Scholar]
11. S. Asekova, S. I. Han, H. J. Choi, S. j. Park, D. Shin et al. (2016). , “Determination of forage quality by near-infrared reflectance spectroscopy in soybean,” Turkish Journal of Agriculture and Forestry, vol. 40, no. 1, pp. 45–52. [Google Scholar]
12. Z. Yang, G. Nie, L. Pan, Y. Zhang, L. Huang et al. (2017). , “Development and validation of near-infrared spectroscopy for the prediction of forage quality parameters in lolium multiflorum,” PeerJ, vol. 5, pp. e3867. [Google Scholar]
13. F. Ferraty. (2014). “Regression on functional data: Methodological approach with application to near-infrared spectrometry,” Journal de la Société Française de Statistique, vol. 155, no. 2, pp. 983–989. [Google Scholar]
14. A. Goia and P. Vieu. (2016). “An introduction to recent advances in high/infinite dimensional statistics,” Journal of Multivariate Analysis, vol. 146, pp. 1–6. [Google Scholar]
15. G. Aneiros, R. Cao and P. Vieu. (2019). “Editorial on the special issue on functional data analysis and related topics,” Journal of Multivariate Analysis, vol. 170, pp. 1–2. [Google Scholar]
16. T. Fearn. (1986). “Some statistical comments on the errors in NIR calibrations,” Analytical Communications, vol. 23, no. 4, pp. 123–125. [Google Scholar]
17. J. Gertheiss, A. Maity and A. M. Staicu. (2013). “Variable selection in generalized functional linear models,” Stat, vol. 2, no. 1, pp. 86–101. [Google Scholar]
18. C. Borggaard and H. H. Thodberg. (1992). “Optimal minimal neural interpretation of spectra,” Analytical chemistry, vol. 64, no. 5, pp. 545–551. [Google Scholar]
19. F. Ferraty and P. Vieu. (2006). “Nonparametric functional data analysis: Theory and practice,” in Series in Statistics, 1st ed. New York, USA: Springer. [Google Scholar]
20. F. Ferraty, A. Laksaci, A. Tadj and P. Vieu. (2010). “Rate of uniform consistency for nonparametric estimates with functional variables,” Journal of Statistical Planning and Inference, vol. 140, no. 2, pp. 335–352. [Google Scholar]
21. N. Azzedine, A. Laksaci and E. Ould-Saïd. (2008). “On robust nonparametric regression estimation for a functional regressor,” Statistics & Probability Letters, vol. 78, no. 18, pp. 3216–3221. [Google Scholar]
22. M. Attouch, A. Laksaci and E. Ould-Saïd. (2009). “Asymptotic distribution of robust estimator for functional nonparametric models,” Communications in Statistics Theory and Methods, vol. 38, no. 8, pp. 1317–1335. [Google Scholar]
23. J. Demongeot, A. Hamie, A. Laksaci and M. Rachdi. (2016). “Relative-error prediction in nonparametric functional statistics: Theory and practice,” Journal of Multivariate Analysis, vol. 146, pp. 261–268. [Google Scholar]
 | This work is licensed under a Creative Commons Attribution 4.0 International License, which permits unrestricted use, distribution, and reproduction in any medium, provided the original work is properly cited. |