DOI:10.32604/cmc.2021.015170
| Computers, Materials & Continua DOI:10.32604/cmc.2021.015170 | |
| Article |
Fractional Rényi Entropy Image Enhancement for Deep Segmentation of Kidney MRI
1Faculty of Computer Science & Information Technology, University of Malaya, Kuala Lumpur, 50603, Malaysia
2Department of Computer Science, College of Computer and Information Sciences, Princess Nourah bint Abdulrahman University, Riyadh, 84428, Saudi Arabia
3Informetrics Research Group, Ton Duc Thang University, Ho Chi Minh City, 758307, Vietnam
4Faculty of Mathematics and Statistics, Ton Duc Thang University, Ho Chi Minh City, 758307, Vietnam
5Department of Mathematics, Cankaya University, Balgat, Ankara, 06530, Turkey
6Institute of Space Sciences, Magurele-Bucharest, R76900, Romania
7Department of Medical Research, China Medical University, Taichung, 40402, Taiwan
*Corresponding Author: Rabha W. Ibrahim. Email: rabhaibrahim@tdtu.edu.vn
Received: 09 November 2020; Accepted: 13 December 2020
Abstract: Recently, many rapid developments in digital medical imaging have made further contributions to health care systems. The segmentation of regions of interest in medical images plays a vital role in assisting doctors with their medical diagnoses. Many factors like image contrast and quality affect the result of image segmentation. Due to that, image contrast remains a challenging problem for image segmentation. This study presents a new image enhancement model based on fractional Rényi entropy for the segmentation of kidney MRI scans. The proposed work consists of two stages: enhancement by fractional Rényi entropy, and MRI Kidney deep segmentation. The proposed enhancement model exploits the pixel’s probability representations for image enhancement. Since fractional Rényi entropy involves fractional calculus that has the ability to model the non-linear complexity problem to preserve the spatial relationship between pixels, yielding an overall better details of the kidney MRI scans. In the second stage, the deep learning kidney segmentation model is designed to segment kidney regions in MRI scans. The experimental results showed an average of 95.60% dice similarity index coefficient, which indicates best overlap between the segmented bodies with the ground truth. It is therefore concluded that the proposed enhancement model is suitable and effective for improving the kidney segmentation performance.
Keywords: Fractional calculus; rényi entropy; convolution neural networks; MRI kidney segmentation
The new imaging technologies have gained an important role in the early diagnosis of kidney diseases. Every year, many people in developing countries are diagnosed with kidney diseases because of hypertension, diabetes mellitus, and glomerulonephritis. Various types of abnormalities such as renal cysts, renal calculi, and renal infections are related to the renal system. The precise segmentation of medical images is significant, but considered as a challenge because of the pathological changes and large variations in the renal shapes. As such, developing an automatic method to extract the kidney region is difficult because of image noise, inhomogeneity, discontinuous boundaries as well as the similar visual appearance of neighboring parts of various structures.
The MRI image acquisition could result in varying image contrast qualities and image artifacts, which degrade the quality of the captured image. Therefore, the efforts to improve the image contrast quality will enhance the performance of the whole imaging system, and provide valuable information for the diagnosis and treatment processes. During kidney segmentation, as shown in Fig. 1, the precise and correct segmentation of kidney edges is important for many applications associated with surgical planning and diagnosis (Fig. 1b). The inaccurate segmentation occurs due to the complex tissue environment surrounding the kidney, including the renal column (Fig. 1c), and liver, which have the same intensities due to low image contrast (Fig. 1d). Thus preprocessing of kidney MRI scans is an important procedure to enhance the image contrast which may lead to a better kidney segmentation. The internal structure of the kidney is complex and difficult to recognize. Several neighboring tissues or organs, including the renal column (Fig. 1c), muscles, and liver have the same intensities (Fig. 1d). The varieties of kidney shapes (in terms of length and volume) and the captured image contrast complicates the segmentation of the kidney. It is therefore evident why the kidney segmentation methods may not perform well. This motivates us to propose a new enhancement model for kidney MRI scans which improves the segmentation performance and accuracy. The proposed model must perform the segmentation process accurately to detect the kidney boundary and eliminate the unwanted structures of nearby regions (e.g., renal column, muscles, and liver) that share the same properties as the kidney (e.g., in intensity). This study is prepared as follows: The related work introduced in Section 2. Section 3 describes the proposed model. Section 4 discusses the experimentation results. Finally, Section 5 concludes the study.
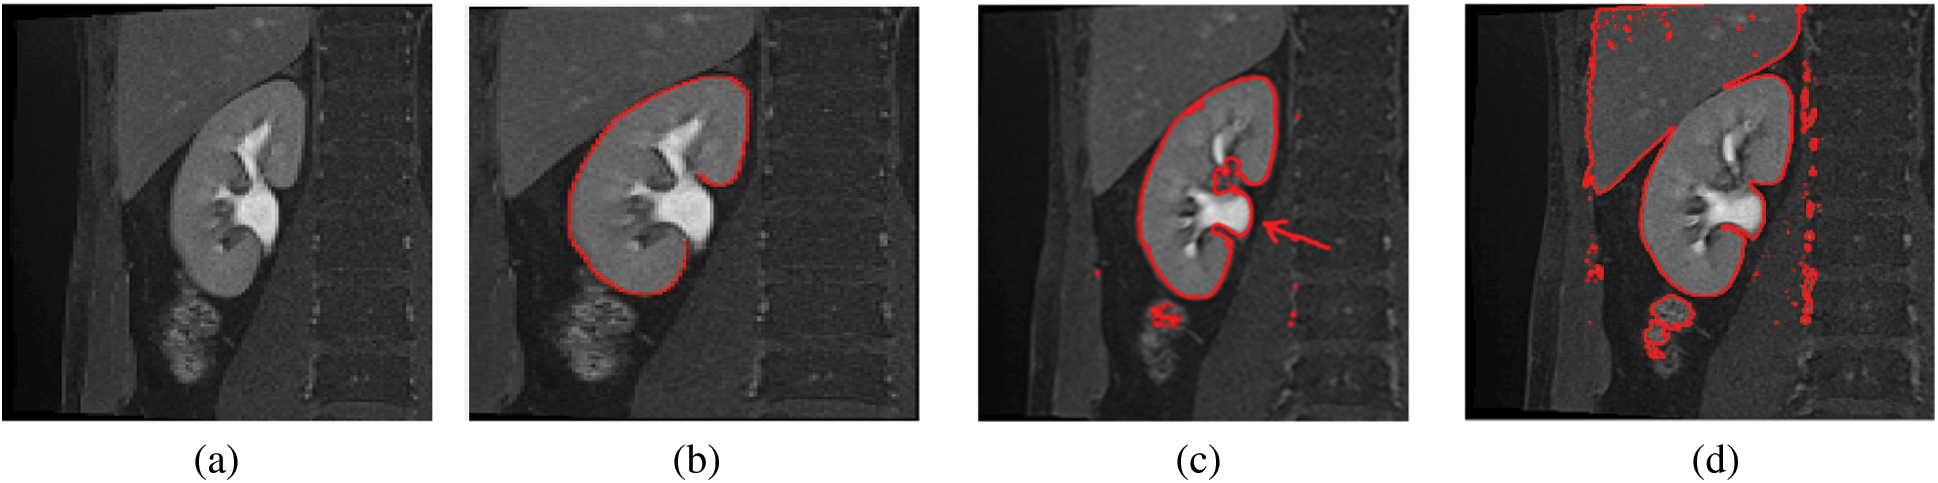
Figure 1: Sample images showing the results of automatic segmentation of kidney MRI scans. (a) The original image, (b) Correctly-segmented kidney, (c) Inaccurate segmentation, with the renal column (arrow), (d) Inaccurate segmentation, with the liver
Image enhancement is the process of improving the contents of an image for specific application. Different image processing algorithms have been developed to enhance image contrast [1]. Many contrast enhancement algorithms are applied to the whole image, often leading to undesirable results. In contrast, enhancement method using the Riesz fractional model [2], which is proposed for enhancing low-contrast text images, overcome this issue. This method was developed for detection and recognition of text in license plate images. Another approach for the enhancement of kidney images was proposed based on new local fractional entropy [3]. This technique performs poorly with kidney MRI scans that suffer from low contrast. For text enhancement in low-quality images, Roy et al. [4] proposed a new fractional Poisson based image enhancement model for text in video frames. Another image contrast enhancement approach based on image histogram has been proposed by Tohl et al. [5]. This method used the histogram operation to enhance the low contrast pixels in edges. However, the method failed when no clear edges are present. The study by [6] focused on the enhancement of brain MRI scans using Grünwald Letnikov (G-L) mask. The method applied the fractional derivative to form two masks of different pixels’ sizes to preserve the correlation of the neighboring image pixels. However, this method is not robust for low contrast images, since it only focused on enhancing the edges of brain in the MRI scans. Accordingly, we can confirm that, in the case of kidney image enhancement, it is not easy to maintain the image quality while enhancing the low contrast region. To solve this problem, the deep learning based methods have been recently applied as new image enhancement algorithms. In [7], an adaptive image contrast enhancement model using CNN has been proposed to enhance low contrast images. However, this method may not work well for kidney MRI scans. In summary, the above enhancement methods have been developed to address several image enhancement challenges where the enhancement of the whole image is more suitable than local enhancement (as in the case of kidney scans enhancement).
The methods developed for kidney segmentation in MRI scans perform poorly when input images suffer from low contrast, artifacts, and variability in the shape of kidney. As a result, the automatic segmentation of the kidney in MR images remains a challenging problem in image processing. The objective of image segmentation is to slice an image into various segments and discrete areas, which is a significant initial step towards the analysis of the contents of an image. Image segmentation is normally used to find boundaries, and to locate objects in images. Many researches have studied the kidney segmentation using different techniques with different medical images. Will et al. [8] applied the thresholding and shape detection for kidney segmentation in MR images. It is known that the MR imaging suffer from inappropriate imaging factors which increase the challenges associated with segmentations. Even though the method is efficient, the thresholding only performed well with clear MR images. Another approach for automated kidney segmentation in MRI scans was proposed by Gloger et al. [9]. In this study, a variation edge alignment force was proposed to guide the shape level set segmentation of the boundaries of the outer organs. Using kidney ultrasound images, Marsousi et al. [10] presented a technique for segmenting the 3D kidney shape. An effective strategy is applied to overcome ultrasound-explicit problems, including speckle noise, low boundary contrast, and partial kidney occlusion. This study offered another shape model called “the complex valued implicit shape model” by consolidating prior information of prepared shapes and anatomical learning. After that, the recognized kidney is segmented through the use of a novel complex area-based level set methodology. However, the proposed kidney detection is likely unable to recognize the kidney shape with different ultrasound image qualities. Another kidney segmentation technique for ultrasound images was proposed by Nithya et al. [11]. This approach proposed an artificial neural network for kidney stone detection, and multi-kernel k-means clustering for kidney segmentation. In that study, the median, as a denoising filter, was used, then the texture analysis has been used as the main features for classification. The accuracy of segmentation may not be good enough due to the clustering result which is sensitive to the type of kernel used, leading to a reduced overall segmentation accuracy. From non-differentiated contrast computed tomography (CT) information, an automatic approach of kidney segmentation was proposed by Turco et al. [12]. As a preprocessing step, this approach applied a manual selection of kidney regions in order to reduce the effect of noise. This method was also developed for non-contrast enhanced CT data. The common drawbacks of the above-mentioned segmentation techniques are the hand crafted features and thresholds. These two approaches affect the accuracy of the kidney regions segmentation and may not qualify as “fully automatic” methods. Alternatively, deep learning has only been recently used for image processing applications [13]. It is a trainable multi stage architecture where each stage detects certain feature patterns. Currently, different deep CNN models have been proposed such as AlexNet, GoogleNet, DenseNet, and U-Net [14]. These deep CNNs are used in different applications such as object detection, segmentation, and image classification. Thong et al. [15] proposed a CT scan kidney segmentation algorithm at variable pixel densities by using convolutional networks approach. The method was evaluated using collected dataset of 79 scans. This method achieved an accurate segmentation but at a higher computation time. Sharma et al. [16] presented a fully automated CNNs of different layers, which learned features without using any handcrafted features. The method was tested using the ADPKD patient dataset of 244 CT acquisitions. This method suffered from false positive identification due to small isolated noise which is wrongly classified as foreground. More recently, Jackson et al. [17] developed an automated kidney segmentation using 3D CNNs for right and left kidney contours. This method achieved accurate segmentation (dice score of 0.91) of right and left kidneys in clear CT images with the renal radiation dose. Along the same approaches, Haghighi et al. [18] proposed a kidney segmentation in dynamic contrast-enhanced MRI scans using a 3D U-Net. The segmentation performance was evaluated using both normal and abnormal kidney images. However, the 3D U-Net is not memory efficient and needs several parameters to learn. Another CT kidney segmentation model was proposed by Couteauxa et al. [19] where 5 levels of U-Net architecture was used to achieve successful segmentation of kidney. However, the CT images were cropped around the kidney which removed all other surrounding tissues. The image segmentation techniques that employ the CNN model show better performance and higher accuracy compared to the classical image segmentation methods [20,21].
From the review on the CNN models of kidney segmentation above, it can be observed that most of the used CNN models are based on the architecture of U-Net, which works well with certain selected types of images. The motivation for this study is to develop a CNN based model for automated kidney segmentation in MRI scans. Our contribution can be summarized as follows:
1. A new image enhancement algorithm for kidney MRI scan which is based on fractional Rényi entropy
2. A new deep learning-based network for the segmentation of kidney body from the MRI scan.
The proposed work consists of two stages: First, the enhancement by fractional Rényi Entropy; then, the deep segmentation of kidney MRI.
3.1 Proposed Enhancement Algorithm
The image enhancement stage is based on derivatives function for improving the perception of image quality. Since fractional calculus includes such derivations, this motivated us to propose the new enhancement algorithm that is based on fractional Rényi entropy (FRE) [22]. In information theory, Entropies measure the variety, improbability, or uncertainty of a scheme. In the setting of fractal measurement approximation, the Rényi entropy indicates the foundation of the notion of isolated measurements. It is presented as follows:


where

denotes the p-norm of the vector of probabilities. Note that 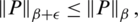 for a small non-negative real number (
 ). In general, for all discrete random variables,
  is a non-increasing concave function in
  . Note that, when
  1, we have the Shannon Entropy. And when
  , the Rényi entropy indicates the logarithm of the dimension of the space that is
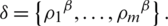
 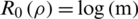 . In addition, the derivative of
  with respect to
  , which minimizes the value of
  is formulated as follows:

where

We proceed to investigate some properties of the information in images by introducing more studies and properties of fractional Rényi entropy.
Theorem 1. Consider Eq. (1) over a set of probability of pixel. The preference of alternative of Eq. (1) is obtained in terms of Rényi entropy by

Proof.
Define a set  of a window of dimension m as follows:
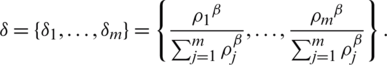
Since all pixels take equal probability, then 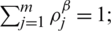 thus the set
  becomes
By applying  in Eq. (2), we have
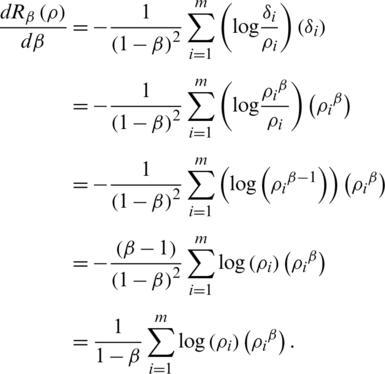
Now, from Eq. (2), a calculation implies that
Then we obtain (10)
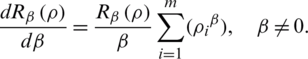
In our discussion, we shall use Eq. (6), which shows the relationship of the fractional Rényi entropy with its derivative (changing of entropy) with respect to the fractional power  . Also, we note that, when
  , we still have the Shannon Entropy. Hence, Eq. (6) is convergent to well know entropy. Next, we proceed to introduce a connection between the fractional Rényi entropy and gamma function. Note that gamma function indicates a good result in image processing, which is indicated in many fractional operators (differential and integral). The final enhanced image
  is formulated by:

where I is the input image. For each pixel in the input image, the proposed image enhancement model derives fractional Rényi entropy of order  .
.
The logic of applying fractional Rényi entropy for pixel type image enhancement is that the Rényi entropy enhances regions with low gray-level changes depending on its pixel’s probability. In order to determine the value for  used in deriving fractional Rényi entropy operator in Eq. (7), we choose our collected data for experimentation, where the average NIQE is calculated for different
  values. Fig. 2 shows that the average NIQE reaches 4.67 when
  = 1.45. Hence, we chose
  for all the experiments in this study.
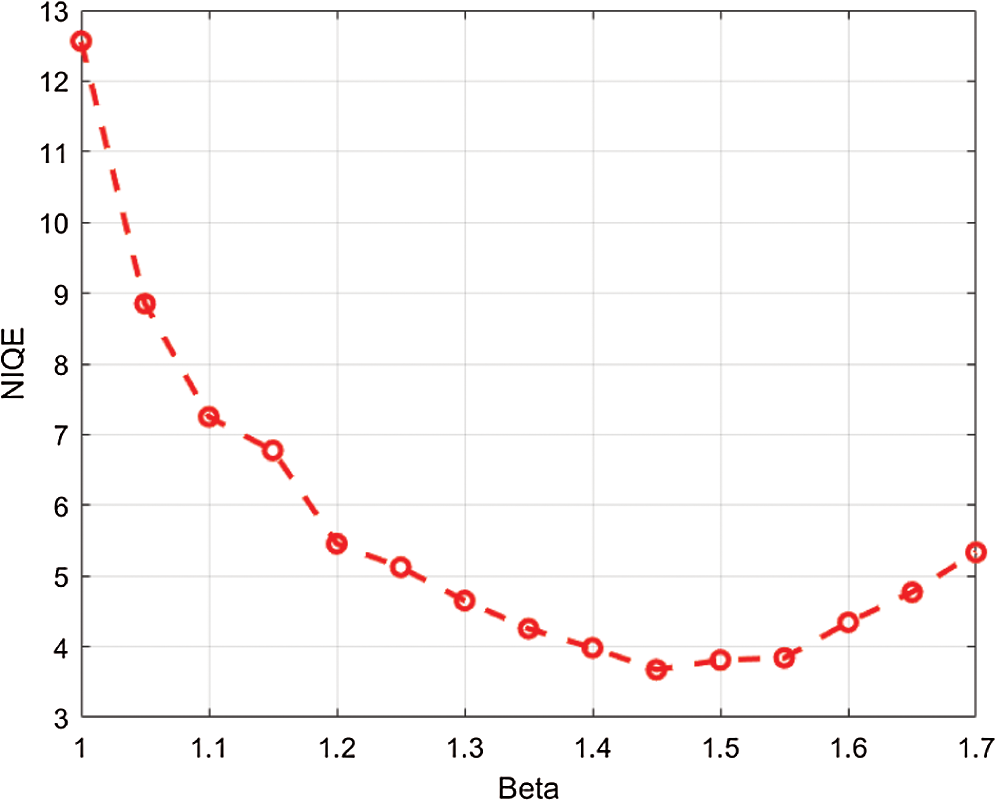
Figure 2: The average NIQE measure for different values of 
In this section, we discuss the proposed CNN based kidney segmentation algorithm for deep learning. There are two stages for image segmentation using CNNs, the training and the pixel-by-pixel classification. The main architecture of CNNs includes two essential parts: feature extraction and classification. The details are illustrated in Tab. 1, and the network architecture is shown in Fig. 3. The feature extractor consists of several connected layers in sequence, each layer of CNNs receives the output from the previous neighbor and passes it to next layer. CNNs consist of several convolution layers (CONV), pooling layers, activation function, dropout and class output layer. Each convolution layer includes a set of small filters, named kernels or convolution filters, which are applied to every layer independently to produce a tensor of feature maps. The extent to which the kernel filter convolves around the input volume by shifting from one position to another is called Stride. The output volume shrinks as the stride increases, so that the spatial dimensions of the output volume decrease significantly after each convolution layer, and this has an impact on the performance of the CNNs.
Table 1: The layers of proposed CNN model
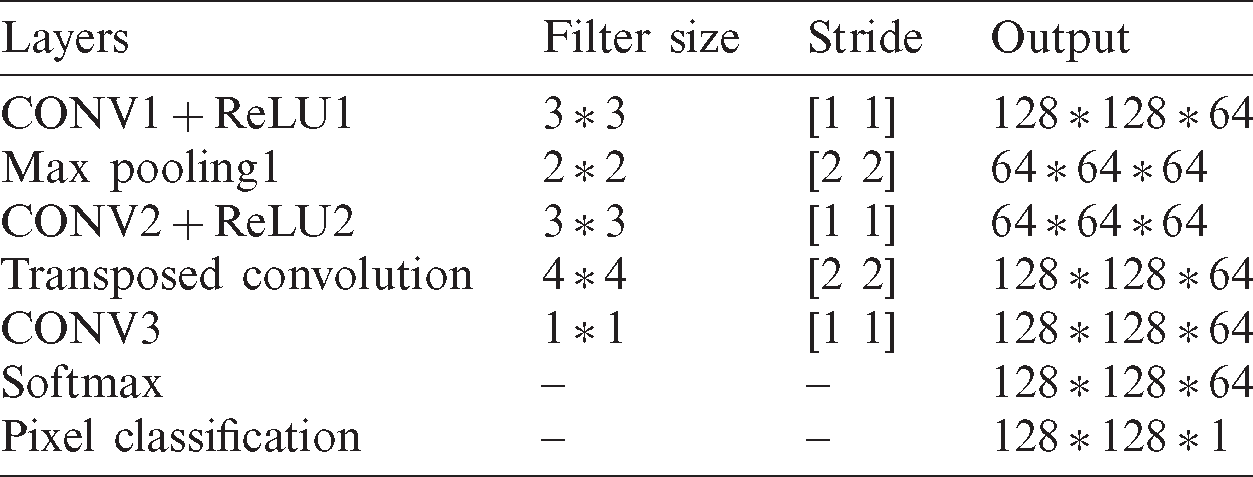
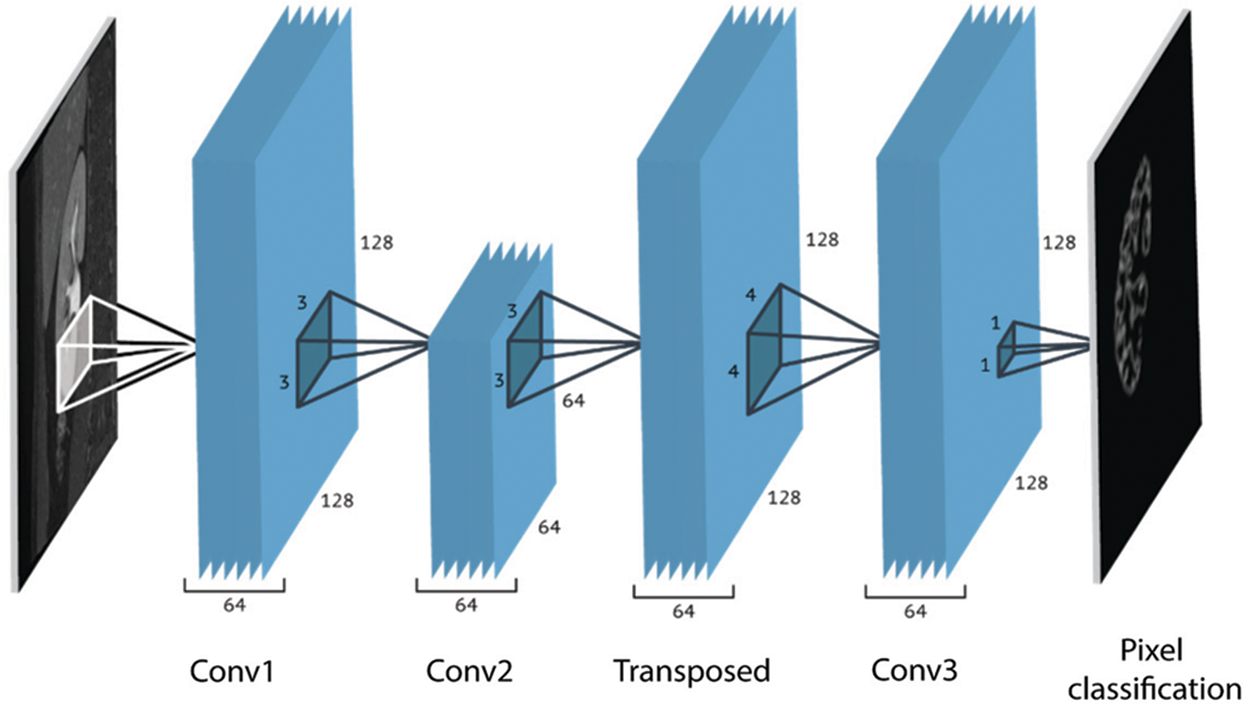
Figure 3: The network architecture
In each convolution layer, the stride (step size) controls how the filter shifts around the input volume, while the max pooling layer handles the down-sampling by using the rectangular pooling regions. Practically, striding filter by one or two pixels is acceptable, but higher values may negatively impact the performance of CNNs. Therefore, it is essential to preserve the input as much as possible in the early layers of CNNs in order to not lose the low level features. To do this, zero-padding is needed to preserve the same spatial dimensions. After each convolution layer, an activation layer, a rectified linear unit (ReLU), is used. The most commonly deployed activation function that is used in the activation layer of CNNs is ReLU, which is used to delete all of the negative numbers in the feature maps and set them to zero. The rectified features are then passed over the pooling layers (also named down sampling layer). A single value for each sub-region is determined to be passed to the output of the pooling layer. A filter of size ( ) with a stride of 2 is used to extract these sub-regions. Two common functions that are frequently used in the pooling layer of CNNs are the max and average pooling functions. The network is divided into two paths, one is the down-sampling for feature extraction path, and the other is the up-sampling path for precise localization of features in the higher resolution layers. The proposed segmentation was trained using
  pixels input BMP images. Reducing the training image size will help in reducing the processing time. The hyper parameters of the proposed model were adjusted turn the loss function to convergence during training. The learning rate has been set to 0.0001, with momentums of 0.9 and 200 epochs, and 64 minimum batch size of 300 iteration number. The code was developed using MATLAB 2020a. We used an NVidia GeForce GTX GPU with 12 GB RAM for the training. The label samples are important during the training process because the proposed CNN model uses pixels as the primary learning object. For this reason, they must be accurately labeled. Manually segmented kidney regions were used as a ground truth. This was done under the supervision of a physician. The training stage continued through the following steps: (1) Input both images and their labels into the CNN model as training samples. (2) Calculate the loss function. (3) Update the network parameters. The filters that operate on the output of the CONV1 layer extracted the lower-level features such as lines. The filters for layer CONV2 detected the edges and blobs, indicating that the filters at CONV2 are edge detectors and color filters, which are more complex patterns compared to the CONV1 layer. The complexity of the patterns increases considerably with depth of layers.
In this study, a total number of 230 MRI kidney scans were collected. This dataset was acquired by SIEMENS machine with a slice thickness of 1.72 units. All of the collected cases were diagnosed by physicians. The participants signed a consent form to grant the use of their images in this research. The collected images were in DICOM format.
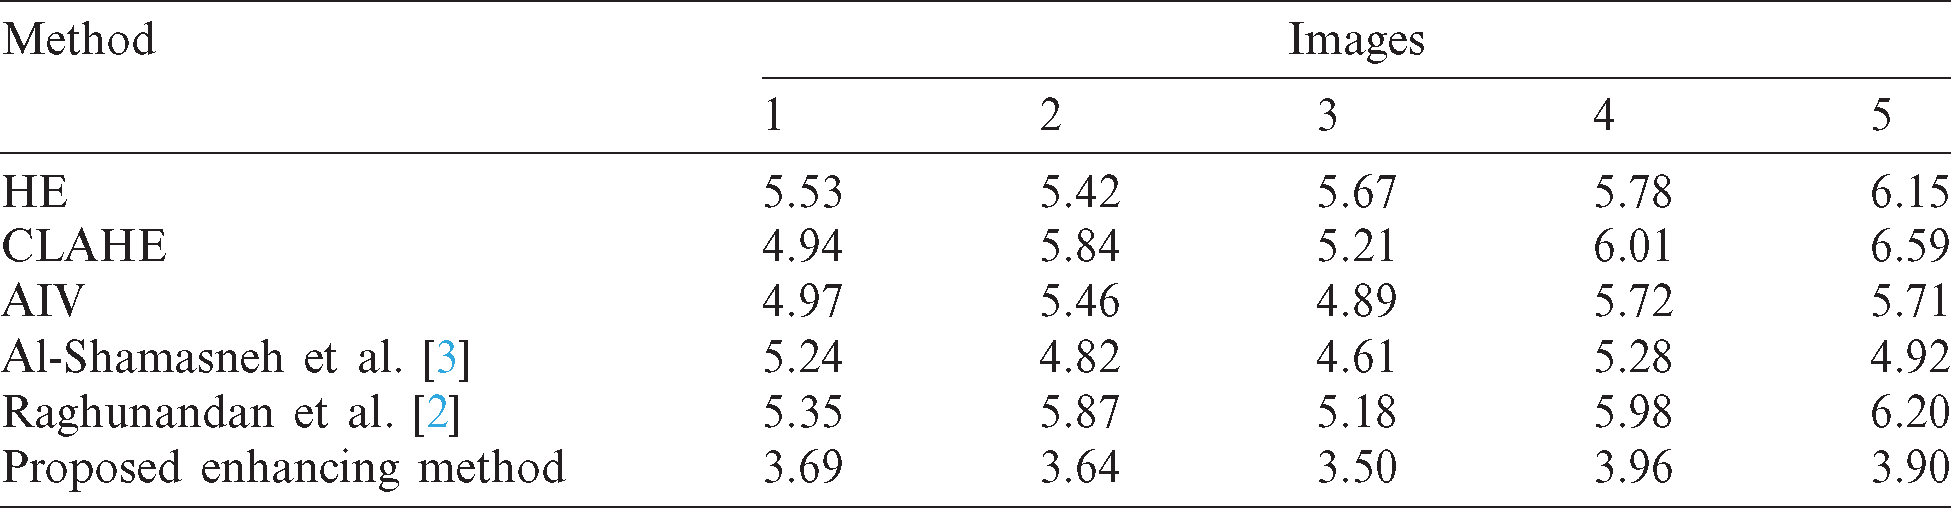
To evaluate the proposed image enhancement method, we considered three standard image processing enhancement methods, and two existing enhancement methods, which have been developed for improving the poor-quality images. The methods are Shamasneh et al.’s method [23] which proposes different fractional calculus for enhancing the poor quality of kidney images, and Raghunandan et al.’s method [2] which utilizes fractional calculus for enhancing the poor quality of license plate images. We choose the above methods for the comparative study because the primary objective of these existing methods is to improve poor quality images. For validating enhancement results given by the proposed approach, we used NIQE (Naturalness Image Quality Evaluator), which measures the quality of an image affected by arbitrary distortion. The reason for choosing this measure is that it does not require the original images for evaluation. It is noted that the low score of NIQE indicates better quality of enhanced images. The qualitative enhancement results using our collected kidney MRI scans dataset are shown in Fig. 4. When we look at the input images as shown in Fig. 4a and the corresponding enhanced images by proposed method as shown in Fig. 4g, the brightness and fine details such as pixels’ edges increase following the application of the proposed method compared to the input images, irrespective of the image content. Therefore, we can conclude that the proposed enhancement method is effective, and independent of the image contents. When we look at the qualitative results of Fig. 4, the proposed method achieves the highest quality in almost all images compared to the existing methods.

Figure 4: The enhancement results of the proposed and existing enhancement models. (a) Input image, (b) CLAHE, (c) AIV, (d) Histogram equalization, (e) Al-Shamasneh et al. [3], (f) Raghunandan et al. [2], (g) Proposed enhancing method
Quantitative enhancement results are stated in Tab. 2. The proposed enhancement method achieved the best NIQE score compared to the existing methods. This shows that the proposed method performs better regardless of image content. This is because the proposed enhancement method improved the fine details in images with low contrast.
Table 2: The quality measures (NIQE) for enhanced images of the proposed and existing enhancement models
4.3 Kidney Segmentation Results
To evaluate the kidney deep segmentation, we calculated the accuracy and the Dice similarity coefficient (DSC). We trained the proposed CNN segmentation model for automated segmentation of kidneys in MRI scan using a collected image dataset of 230 images. For evaluation, accuracy and DSC were used to measure the overlap between the background G and kidney region I.


where TP, TN, FP and FN are the true positive, true negative, false positive and false negative respectively.
After successful training using enhanced kidney images, the test images were fed into the proposed trained model to obtain kidney segmentation results. The test images belong to another set of MRI scans that have not been used for the training before. The qualitative results of the proposed segmentation model using the test images are shown in Fig. 5.

Figure 5: Kidney segmentation results of the proposed model. (a) Test images, (b) Ground truth, (c) Proposed CNN results
It could be seen that the segmentation results of the proposed model almost match the ground truth (Fig. 5). However, in some images, the segmentation results included the renal column, which has been falsely segmented as kidney body. Nonetheless, our proposed model achieved an acceptable segmentation accuracy especially at the boundaries of the kidney body.
4.4 Kidney Segmentation Comparative Analysis
We further compared the performance of the proposed kidney segmentation model to other kidney segmentation techniques using the same dataset.
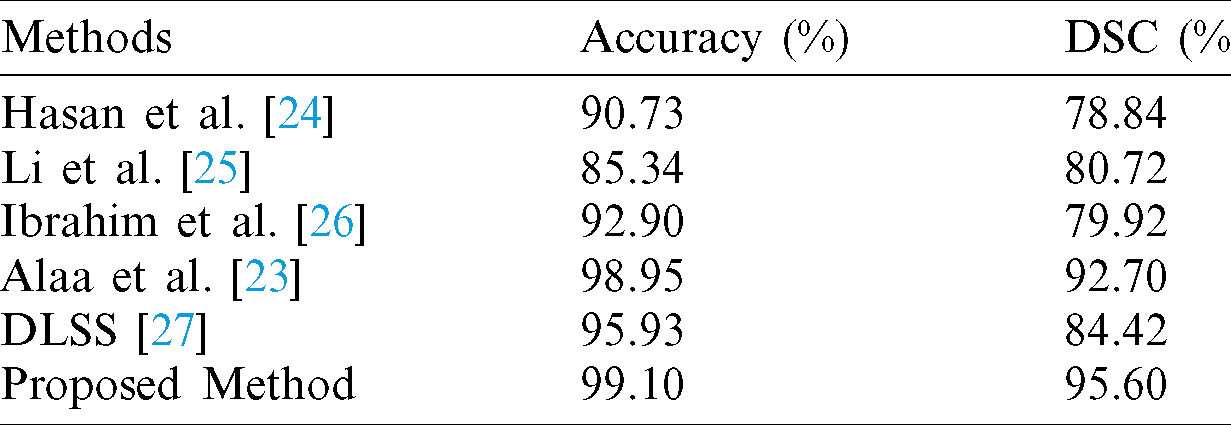
The proposed model is compared with the following state-of-the-art methods: Hasan et al. [24] proposed a segmentation method for MRI brain scan; Li et al. [25] applied the level set approach for kidney segmentation; Ibrahim et al. [26] used new fractional calculus approach as an energy function for MRI brain tumor segmentation, while [23] applied a new kidney segmentation method using a new fractional energy minimization function. The qualitative results compared to existing methods are illustrated in Fig. 6, while the comparative analysis based on accuracy and Dice metrics are given in Tab. 3. It could be seen that the proposed model separates the kidney region more accurately compared to the other methods. Also, a standard deep learning Semantic Segmentation (DLSS) is used for comparison as well [27]. From Tab. 3, it is evident that the proposed segmentation model achieves a much higher segmentation accuracy and Dice similarity coefficient compared to the other methods.

Figure 6: The results of comparative analysis of kidney segmentation between the proposed method and existing methods. (a) Input images, (b) Hasan et al. [24], (c) Li et al. [25], (d) Ibrahim et al. [26], (e) Al-Shamasneh et al. [23], (f) DL semantic segmentation [27] (g) Proposed segmentation method
Table 3: Performance of the proposed and other methods using our own dataset
In this study, we have presented a new image enhancement model based on fractional Rényi entropy for deep kidney segmentation in MRI scans. The proposed image enhancement model exploits the pixel’s probability representations for image enhancement, making the proposed model more robust against the inhomogeneous intensity values of kidney MRI scans. The proposed model has the ability to preserve the spatial relationship between the pixels of the image, which helped in enhancing the fine details of the kidney MRI scans, irrespective of the image contrast. Moreover, the proposed CNN kidney segmentation model has less parameters compared to existing kidney segmentation methods which require a larger memory size. The experimental results indicated that the proposed method could improve the performance of automatic kidney segmentation compared to the existing kidney segmentation methods. Future works may aim to enhance the proposed model by reducing the number of false positives through training with larger and more complex datasets, which may in turn increase the segmentation accuracies.
Funding Statement: This research was funded by the deanship of scientific research at princess Nourah bint Abdulrahman University through the fast-track research-funding program.
Conflicts of Interest: The authors declare that they have no conflicts of interest to report regarding the present study.
1. R. C. Gonzalez, R. E. Woods and S. L. Eddins. (2004). Digital Image Processing Using MATLAB. Upper Saddle River, NJ, USA: Pearson/Prentice Hall. [Google Scholar]
2. K. Raghunandan, P. Shivakumara, H. A. Jalab, R. W. Ibrahim, G. Hemantha Kumar et al. (2017). , “Riesz fractional based model for enhancing license plate detection and recognition,” IEEE Transactions on Circuits and Systems for Video Technology, vol. 28, no. 9, pp. 2276–2288. [Google Scholar]
3. A. R. Al-Shamasneh, H. A. Jalab, S. Palaiahnakote, U. H. Obaidellah and R. W. Ibrahim. (2018). “A New local fractional entropy-based model for kidney MRI image enhancement,” Entropy, vol. 20, no. 5, pp. 344. [Google Scholar]
4. S. Roy, P. Shivakumara, H. A. Jalab, R. W. Ibrahim, U. Pal et al. (2016). , “Fractional Poisson enhancement model for text detection and recognition in video frames,” Pattern Recognition, vol. 52, pp. 433–447. [Google Scholar]
5. D. Tohl and J. S. J. Li. (2019). “Contrast enhancement by multi-level histogram shape segmentation with adaptive detail enhancement for noise suppression,” Signal Processing: Image Communication, vol. 71, pp. 45–55. [Google Scholar]
6. A. Wadhwa and A. Bhardwaj. (2020). “Enhancement of MRI images of brain tumor using Grunwald-Letnikov fractional differential mask,” Multimedia Tools and Applications, vol. 79, pp. 25379–25402. [Google Scholar]
7. Y. S. Moon, B. G. Han, H. S. Yang and H. G. Lee. (2019). “Low contrast image enhancement using convolutional neural network with simple reflection model,” Advances in Science, Technology and Engineering Systems, vol. 4, no. 1, pp. 159–164. [Google Scholar]
8. S. Will, P. Martirosian, C. Würslin and F. Schick. (2014). “Automated segmentation and volumetric analysis of renal cortex, medulla, and pelvis based on non-contrast-enhanced T1-and T2-weighted MR images,” Magnetic Resonance Materials in Physics, Biology and Medicine, vol. 27, no. 5, pp. 445–454. [Google Scholar]
9. O. Gloger, V. Liebscher, K. D. Tönnies and H. Völzke. (2014). “Fully automatic renal parenchyma volumetry in LDA-based probability maps using variational outer cortex edge alignment forces,” In: IWBBIO, Universidad de Granada, Granada (Spainpp. 1207–1218. [Google Scholar]
10. M. Marsousi, K. N. Plataniotis and S. Stergiopoulos. (2016). “An automated approach for kidney segmentation in three-dimensional ultrasound images,” IEEE Journal of Biomedical and Health Informatics, vol. 21, no. 4, pp. 1079–1094. [Google Scholar]
11. A. Nithya, A. Appathurai, N. Venkatadri, D. Ramji and C. A. Palagan. (2020). “Kidney disease detection and segmentation using artificial neural network and multi-kernel k-means clustering for ultrasound images,” Measurement, vol. 149, 106952. [Google Scholar]
12. D. Turco, M. Valinoti, E. M. Martin, C. Tagliaferri, F. Scolari et al. (2018). , “Fully automated segmentation of polycystic kidneys from noncontrast computed tomography: A feasibility study and preliminary results,” Academic Radiology, vol. 25, no. 7, pp. 850–855. [Google Scholar]
13. T. Zhou, S. Ruan and S. Canu. (2019). “A review: Deep learning for medical image segmentation using multi-modality fusion,” Array, vol. 3–4, pp. 1–11. [Google Scholar]
14. O. Ronneberger, P. Fischer and T. Brox. (2015). “U-net: Convolutional networks for biomedical image segmentation,” in Int. Conf. on Medical Image Computing and Computer-Assisted Intervention, Munich, Germany, pp. 234–241. [Google Scholar]
15. W. Thong, S. Kadoury, N. Piché and C. J. Pal. (2018). “Convolutional networks for kidney segmentation in contrast-enhanced CT scans,” Computer Methods in Biomechanics and Biomedical Engineering: Imaging & Visualization, vol. 6, no. 3, pp. 277–282. [Google Scholar]
16. K. Sharma, C. Rupprecht, A. Caroli, M. C. Aparicio, A. Remuzzi et al. (2017). , “Automatic segmentation of kidneys using deep learning for total kidney volume quantification in autosomal dominant polycystic kidney disease,” Scientific Reports, vol. 7, no. 1, pp. 1–10. [Google Scholar]
17. P. Jackson, N. Hardcastle, N. Dawe, T. Kron, M. S. Hofman et al. (2018). , “Deep learning renal segmentation for fully automated radiation dose estimation in unsealed source therapy,” Frontiers in Oncology, vol. 8, pp. 215. [Google Scholar]
18. M. Haghighi, S. K. Wareld and S. Kurugol. (2018). “Automatic renal segmentation in DCE-MRI using convolutional neural networks,” in IEEE 15th Int. Sym. on Biomedical Imaging (ISBI 2018Washington, DC, USA, pp. 1534–1537. [Google Scholar]
19. V. Couteaux, S. Si-Mohamed, R. Renard-Penna, O. Nempont, T. Lefevre et al. (2019). , “Kidney cortex segmentation in 2D CT with u-nets ensemble aggregation,” Diagnostic and Interventional Imaging, vol. 100, no. 4, pp. 211–217. [Google Scholar]
20. A. M. Hasan, M. M. AL-Jawad, H. A. Jalab, H. Shaiba, R. W. Ibrahim et al. (2020). , “Classification of COVID-19 coronavirus, pneumonia and healthy lungs in CT scans using q-deformed entropy and deep learning features,” Entropy, vol. 22, no. 5, pp. 517. [Google Scholar]
21. A. M. Hasan, H. A. Jalab, F. Meziane, H. Kahtan and A. S. Al-Ahmad. (2019). “Combining deep and handcrafted image features for MRI brain scan classification,” IEEE Access, vol. 7, pp. 79959–79967. [Google Scholar]
22. H. A. Jalab, R. W. Ibrahim and A. Ahmed. (2017). “Image denoising algorithm based on the convolution of fractional Tsallis entropy with the Riesz fractional derivative,” Neural Computing and Applications, vol. 28, no. 1, pp. 217–223. [Google Scholar]
23. A. a. R. Al-Shamasneh, H. A. Jalab, P. Shivakumara, R. W. Ibrahim and U. H. Obaidellah. (2020). “Kidney segmentation in MR images using active contour model driven by fractional based energy minimization,” Signal, Image and Video Processing, vol. 14, pp. 1361–1368. [Google Scholar]
24. A. M. Hasan, F. Meziane, R. Aspin and H. A. Jalab. (2016). “Segmentation of brain tumors in MRI images using three-dimensional active contour without edge,” Symmetry, vol. 8, no. 11, pp. 132. [Google Scholar]
25. C. Li, C. Xu, C. Gui and M. D. Fox. (2010). “Distance regularized level set evolution and its application to image segmentation,” IEEE Transactions on Image Processing, vol. 19, no. 12, pp. 3243–3254. [Google Scholar]
26. R. W. Ibrahim, A. M. Hasan and H. A. Jalab. (2018). “A new deformable model based on fractional Wright energy function for tumor segmentation of volumetric brain MRI scans,” Computer Methods and Programs in Biomedicine, vol. 163, pp. 21–28. [Google Scholar]
27. The MathWorks, Inc. (2020). Deep Learning Toolbox, The MathWorks, Inc., USA. [Google Scholar]
 | This work is licensed under a Creative Commons Attribution 4.0 International License, which permits unrestricted use, distribution, and reproduction in any medium, provided the original work is properly cited. |