DOI:10.32604/cmc.2021.015047
| Computers, Materials & Continua DOI:10.32604/cmc.2021.015047 | |
| Article |
New Improved Ranked Set Sampling Designs with an Application to Real Data
1Department of Mathematics, Faculty of Science, Al al-Bayt University, Mafraq, Jordan
2Department of Mathematics, College of Science, King Khalid University, Abha, 62529, Saudi Arabia
3Statistical Research and Studies Support Unit, King Khalid University, Abha, 62529, Saudi Arabia
*Corresponding Author: Ibrahim M. Almanjahie. Email: imalmanjahi@kku.edu.sa
Received: 04 November 2020; Accepted: 08 December 2020
Abstract: This article proposes two new Ranked Set Sampling (RSS) designs for estimating the population parameters: Simple Z Ranked Set Sampling (SZRSS) and Generalized Z Ranked Set Sampling (GZRSS). These designs provide unbiased estimators for the mean of symmetric distributions. It is shown that for non-uniform symmetric distributions, the estimators of the mean under the suggested designs are more efficient than those obtained by RSS, Simple Random Sampling (SRS), extreme RSS and truncation based RSS designs. Also, the proposed RSS schemes outperform other RSS schemes and provide more efficient estimates than their competitors under imperfect rankings. The suggested mean estimators under perfect and imperfect rankings are more efficient than the linear regression estimator under SRS. Our proposed RSS designs are also extended to cover the estimation of the population median. Real data is used to examine wthe usefulness and efficiency of our estimators.
Keywords: Ranked set sampling; unbiased estimator; simple random sampling; mean squared error; efficiency; imperfect ranking
The Ranked Set Sampling (RSS) is originally derived by McIntyre [1] as a new design to increase the efficiency of pasture and forage yields estimates for fixed sample units. The RSS is considered when the study variable can simply be ranked than quantified. Takahasi et al. [2], independently, introduced the background of the RSS design, mathematically. It is shown that mean estimator by the RSS is unbiased, and provides more efficient estimates than the simple random sampling mean estimator. Even when the measured observations are ranked with errors, the RSS still provides an unbiased estimator, but the imperfect ranking is generally better than ordering based on random [3]. Stokes [4] considered the case of measuring the variable of interest and concluded that the study variable can be ranked by some concomitant variables. The competence of the estimator then depends on the relation between the study variables and the ancillary variables. With perfect ranking, the estimation based on RSS is more adequate as compared to the regression estimation based on SRS, especially, when the study variables and the ancillary variables are highly correlated (say  ) [5].
In the last few decades, many applications and modifications of the RSS design have been proposed. Halls et al. [6] for considering an application of forage yields using RSS. Samawi et al. [7] introduced the Extreme RSS (ERSS) design. Al-Omari et al. [8] introduced ratio estimators of the population mean with missing values using RSS. Al-Omari [9] considered the median estimation based on double robust extreme RSS. Al-Saleh et al. [10] extended the work further and provided Multistage RSS (MSRSS) design. They proved that as the number of stages increases, the efficiency of the mean estimator under MSRSS increases and vice versa. A Robust L RSS procedure based on the idea of L estimators is suggested by Al-Naseer [11]. Muttlak [12] introduced Median RSS (MRSS); he showed that it provides an unbiased estimator of the mean of symmetric distributions, and is more efficient than the SRS and RSS mean estimators. Jemain et al. [13] suggested multistage median RSS for estimating the population median and Jemain et al. [14] proposed some variations of RSS. Al-Omari [15] proposed ratio estimators of the population mean by considering ancillary information in SRS and median RSS and Al-Omari [16] considered the entropy estimation in RSS methods. Hossain et al. [17] suggested paired RSS for estimating the population mean. Shadid et al. [18] considered the BLUEs and BLIEs of the scale and location parameters together with the population mean using RSS. Al-Omari et al. [19] investigated the ratio estimation using a multi-stage median RSS approach. Al-Omari [20] proposed robust extreme RSS mean for mean estimation. Haq [21] proposed Shewhart control chart for monitoring process mean based on partially ordered judgment subset sampling. Haq et al. [22] suggested unbiased estimators for the basic linear regression model based on double RSS. Yu et al. [23] for investigating regression estimator in RSS. Al-Naseer et al. [24] proposed robust extreme RSS. Haq et al. [25] suggested some ratio estimators for the population mean in ERSS using two ancillary variables. Ozturk [26] studied sampling based on partially rank-ordered sets. Haq et al. [22] proposed the hybrid RSS method. Zamanzade et al. [27] introduced a new RSS estimation method for the population mean and variance. Haq [28] considered cluster sampling with hybrid RSS. Haq [29] studied the distribution function estimation under hybrid RSS. Al-Omari et al. [30,31] dealt with tests based on Laplace and logistic distributions. Al-Nasser et al. [32] studied information-theoretic weighted mean based on truncated RSS. Zamanzade et al. [33] used population proportion estimation in pair RSS. Haq [34] studied ordered partially subset sampling and consider the applications of this method to parametric inference. Al-Omari et al. [35] suggested a new RSS procedure called Truncation Based RSS (TBRSS), and showed that their estimator is unbaised of the population mean of symmetric distributions. Al-Nasser et al. [36] suggested minimax RSS method. Haq et al. [37] proposed the Hybrid ranked set sampling scheme. Wang et al. [38] investigated general ranked set sampling with cost consideration. Muttlak [39] introduced median ranked set sampling with concomitant variables and a comparison with ranked set sampling and regression estimators. For applications and new techniques based on RSS, we refer the readers to the references [40–44].
In this paper, we extended the work in this area and proposed two new improved RSS designs called the Simple Z Ranked Set Sampling (SZRSS) and the Generalized Z Ranked Set Sampling (GZRSS) methods. For some cases, SZRSS becomes a particular case of GZRSS design. The proposed sampling procedure estimator is unbiased of the population mean for symmetric distributions. It is shown, theoretically and numerically, that under perfect and imperfect rankings for symmetric non-uniform distributions, the proposed mean estimators under the GZRSS design are more efficient than those obtained by RSS and TBRSS. For asymmetric distributions, the proposed estimators based on GZRSS are more precise as compared to the estimators based on RSS and TBRSS. Also, we extended our sampling designs for estimating the population median. The efficiency of the suggested median estimators under GZRSS is better than that based on the RSS and TBRSS estimators, for symmetric non-uniform and asymmetric distributions. The GZRSS estimator of the population mean is investigated based on perfect and imperfect rankings, and is also compared to the SRS linear regression mean estimator. It is noteworthy that for small to moderate correlation between the auxiliary and study variables, the proposed estimators are more efficient than the SRS linear regression estimator of the population mean.
This paper is organized as follows. Some sampling methods are presented in Section 2. The proposed ZRSS designs are described in detail in Section 3. The problem of errors in ranking and a comparison with the SRS linear regression estimator is discussed in Section 4. The problem of estimating the population median is considered in Section 5. A detailed application to real data is given in Section 6, and finally, the paper is concluded in Section 7.
In this section, we explain some existing sampling schemes considered in this study.
We describe the RSS design as follows:
Step 1: Given the value of sample size, say m, identify m2 units from the corresponding population.
Step 2: These units are randomly allocated to m sets such that the size of each set is m.
Step 3: Now, rank the units within each set, this ranking can be done visually or by an inexpensive method with respect to the study variable. Then select the smallest ranked unit from the first set of m units. Similarly, select the second smallest ranked unit from the second set of m units. The procedure continues until the largest ranked unit is selected from the last set. This completes a cycle of a ranked set sample of size m.
Step 4: For a large sample size, say n, the above steps are repeated r times until size of the sample becomes n = mr, for  .
.
Let Z be the variable of interest with a distribution function (cdf) F(z) and a probability density function (pdf) f(z). Suppose that Z has a mean  and a variance
  . Let
. Let  be a SRS of size m drawn from the pdf f(y), i.e.,
  , for
, for  . Then, the mean of SRS is denoted by
  . Here,
  (an unbiased estimator of
  ), and variance is
  . Suppose that
  be m independent SRS each of size m. Let
  denotes the order statistics of the
  sample
  . Now, implement the RSS method to m selected samples. This gives a balanced RSS of size m,
  . The RSS mean estimator is denoted by
  . Assuming that
  be the pdf of the ith order statistic
  , and noting that for each i,
  , where d stands for equality in distribution. The pdf of the
  is given by
  ,
,  , with mean
  and variance
  It is of interest to note that
  is unbiased estimator of
  and the corresponding variance is
  . Takahasi et al. [2] introduced the foundation of the RSS design and proved that
  and
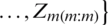
and  . The efficiency (Eff) of
  and
and  is
is  . For further details See Takahasi et al. [2].
As we mentioned in the introduction that Al-Omari et al. [35] derived the TBRSS design; its describtion is as follows:
Step 1: Choose m by SRS of size m each from the parent population.
Step 2: Within each choden sample, rank the units visually based on the variable of interest or by any inexpensive method.
Step 3: Define a coefficient  , for
, for  . Note that
  denotes the integer part of t.
Step 4: Choose the minumum ranked unit from the first  samples and the maximum ranked unit from the last
  samples. From the remaining
  , choose the
  ranked unit from the
  sample for
  .
.
Step 5: This finalizes a cycle of a TBRSS. Steps 1–4 are repeated r times if needed to determine a sample of size n = mr.
The corresponding estimator of population mean based on TBRSS is  The estimator
  becomes unbiased if the population is symmetric. For symmetric populations, the variance of
  is
is  Note that for
  ,
,  . For samples of odd sizes, when
  , The TBRSS and ERSS become equivalent. For further details and application of this method, see Al-Omari et al. [35].
This section introduces two new RSS methods; namely, simple Z ranked set sampling (SZRSS) and generalized Z ranked set sampling (GZRSS) designs.
The SZRSS procedure for both even and odd samples is described as follows. To get an SZRSS of m size, select m random samples each of size m. Without yet knowing the values in the samples, rank the units within each sample based on any inexpensive or cost free method.
i) For even m, choose the  smallest ranked unit from the first m/2 samples, for
  . Similarly, choose
  th the smallest ranked unit from the last m/2 samples, for
  .
.
ii) For odd sample size m, choose the  smallest ranked unit from the first
  samples, for
  Then select the median of the
  sample. From the last
  samples, select the
  smallest ranked unit, for
  .
.
This process provides a cycle of an SZRSS of size m The cycle are repeated r times to determine the size n = mr. The SZRSS estimator of  for an even m is

The variance of  is
is  . For odd sample size m, the estimator based on SZRSS is
 . The variance of
  is given by
  .
.
Lemma 1: (i) For symmetric distributions, the estimator  (
( ) of the population mean
  is unbiased. (ii) Var
 for symmetric (non-uniform) distributions.
Proof:
i) For the estimator, given in Eq. (1), we have 
 . For any symmetric distribution,
  for
for  . After some simplications, we can write
  . Follow the same process to prove that
  .
.
ii) The variance of Eq. (1) is defined as 
For any symmetric distribution,  ,
,  . With some algebraic operations, we can write
  . Note that the variance decreases as i increases for symmetric (non-uniform) distributions, with minimum value occuring at
  , i.e.,
  for
for 
 with
with  Here,
Here,  represents the greatest integer value of t. Therefore,
  and hence,
  , which completes the proof. Follow the same process to prove that
  .
.
Now, we propose a generalized ZRSS (GZRSS) design. The steps of selecting a GZRSS are given below in which the Steps 1–3 are similar to the TBRSS method.
Step 1: Choose m simple random samples, each with size m selected from the corresponding population.
Step 2: Within each sample, rank the units visually with respect to the variable of interest or by inexpensive or cost free method.
Step 3: Define a coefficient  , for
, for  and
and  symbolizes the integer value of t.
Step 4: From the first  samples, draw the
  smallest ranked unit. From the last
  samples, draw the
  smallest ranked unit. But from the remaining
  samples, draw the
  ranked unit from the
  sample for
  .
.
Step 5: Previous steps finalize a cycle of a GZRSS of size m. Steps 1–4 are done r times if needed to determine a sample of size n = mr.
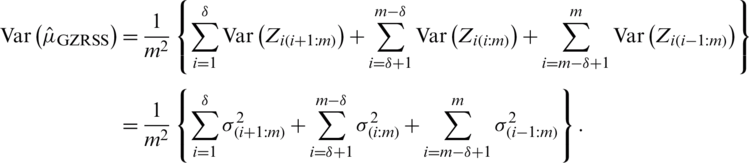
Let  be m independent simple random samples each of size m. The GZRSS estimator of population mean
  based on this sample is

and the corresponding variance is 
 . Note that for
  , we have
  .
.
Lemma 2: For symmetric distributions about its population mean  we have
i)  is an unbiased estimator of
  .
.
ii)  and
and  .
.
Proof:
i) Take the expectation of  , given in Eq. (2), we have

 . As
. As  for
for  . Therefore, we can write
  , which completes the proof.
ii) Consider the estimator, given in Eq. (2), we have
For any symmetric distribution,  ,
,  . After some simplication, we can write
  . As explain above, for symmetric (non-uniform) distributions,
  for
for  with
with  Therefore,
  and hence,
  . The equality is attained when k = 0, which completes the proof.
iii)  if and only if
  . This implies that
 and also we have
 It can be written as

 .
.
As mentioned above, for symmetric (non-uniform) distributions,  for
for  with
with  Therefore, all of the above differences are positive and hence
 . The equality is attained when
  , which completes the proof.
In the case of symmetric of the parent distribution, the Eff of  with respect to
  is defined by
  . For asymmetric populations, the Eff will be
  . Now, to illustrate the method, some choices of the sample size m and the coefficient
  are considered for normal and Weibull distributions.
Let  , where
  ,
,  . The cdf and pdf of the ith ranked unit from an RSS of size m = 5, respectively, are
  and
and 
 where
where  is the complementary error function,
  is the regularized incomplete beta function and
  is the beta function or Euler integral of the first kind. Consider the estimator given in Eq. (2), and let m = 5, we have
  . Based on the order statistics, the means and variances of the ith, for
  , are
, are  ,
,  ,
,  ,
,  ,
,  ,
,  ,
,  ,
,  ,
,  , and
, and  . Also, the cases below for
  can be treated as follows:
Case I:  : The computed results for expectation and the variance of the estimator, given in Eq. (2), are, respectively,
  ,
,  . The Eff of
  with respect to
  is given by
  .
.
Case II:  : The expectation of
  is
is  and variance
  . The Eff of
  with respect to
  is
is  .
.
Case III:  : The expectation of the estimator given in Eq. (2) is
  with variance
  The Eff of
  with respect to
  is
is  .
.
Let  , having pdf
  , z > 0. The cdf and pdf of the ith ranked unit from a ranked set sample for m = 5, respectively, are
  and
and 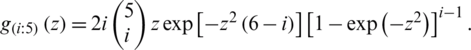
For m = 5, we have  Based on the order statistics, the means and variances are
  ,
, 
 ,
,  ,
,  , and
, and 
 ,
, 
 ,
,  , respectively. Also, the cases below for
  can be treated as follows:
Case I: Consider  :
:
The expectation of  is
is  , which is an unbiased estimate with variance of
  is
is  . The Eff of
  with respect to
  is
is  .
.
Case II: Consider  : Similarly, the mean (expectation) and variance of
  are
are  and
and  , respectively. As the estimator is not unbiased, therefore, the MSE of
  is given by
  . The bias of
  is
is  . Therefore,
  . The Eff of
  with respect to
  is
is  .
.
Case III:  : The mean and variance of
  are
are  and
and  . Again the estimator is biased with
  and
and  The Eff of
  with respect to
  is
is  .
.
Now, we consider the mean estimation for some symmetric distributions, and also for some asymmetric distributions. The exact relative efficiencies of our proposed estimators are presented in Tabs. 1 and 2.
Table 1: Exact Eff of mean estimators under symmetric distributions

Table 2: Exact Eff comparison of mean estimators under asymmetric distributions

Tabs. 1 and 2 show that, for symmetric distributions, the efficiency of the GZRSS increases as the  value increases except in the case of the uniform distribution. In the case of asymmetric distributions, generally, the efficiencies increase when
  increases for 0 to 1, and they decrease function when
  . For both asymmetric and symmetric distributions, the relative efficiency of mean estimators under GZRSS is an increasing function of the sample size. For all considered cases, GZRSS is more efficient than RSS and TBRSS except that TBRSS is more adequate than GZRSS when the considered distribution is standard uniform.
4 Errors in Ranking and Comparison with SRS Regression Estimator
We investigate the fulfillment of the suggested estimators for the mean under both GZRSS design and imperfect rankings. The suggested estimators under both rankings’ schemes are also compared with the SRS for the population mean based on the linear regression estimator.
Accurate ranking increases the efficiency of the RSS. However, Dell et al. [3] show that even if the ranking has some errors, the estimator under RSS still remains unbiased and performs at least as well as the SRS estimator. Here, we study the performance of the estimators under the proposed RSS designs, when ranking has some errors. The mostly used RSS model to study the effect of errors in ranking is based on the ranking with respect to a concomitant variable that is correlated with the study variable. The efficiency of the estimator now depends on the correlation value between the study variable Z and the concomitant or ancillary variable W. Stokes [4] suggested a model for imperfect ranking assuming that an ancillary variable W is available, can be simply measured and is correlated with the interest variable Z. For further details see Stokes [4], Patil et al. [5] and Muttlak [39]. Stokes [4] imposed the following assumptions considered in developing the following model:
i) The relationship between Z and the regressor W is linear,
ii)  and
and  variables follow the same distribution.
If  follows the bivariate normal distribution, then both conditions are easily satisfied. Following Stokes [4] and (i), we can write
  ,
,  , where where
  is the coefficient of correlation,
  and
and  are the population standard deviations,
  and
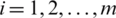
and  are the corresponding means. Note that the ranking of the auxiliary variable W is perfect whereas the ranking of Z is imperfect, i.e., the ranking of Z has some errors. Here,
  and
and  denote the
  order statistic and the
  judgment order statistic of a random sample of size m.
  denotes the error term with zero mean and a constant variance, i.e.,
  and
and  . As SZRSS becomes a special case of GZRSS, therefore, we consider the estimator based on GZRSS. Now, the mean of the study variable Z with ranking based on the auxiliary variable W under GZRSS can be written as
  , where
  is unbiased estimaor of
  , and it variance is
 . Note that if we consider
  in
in  , then it becomes the simple RSS estimator of population mean. The efficiency of
  with respect to
  is
is
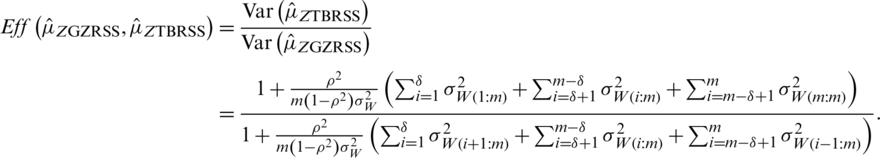
The efficiency of the  with respect to
  is
is
which shows that  is always better over
  and
and  , even when there are errors in ranking. Similarly, we can define the estimator of population mean
  based on TBRSS by
  , where
  is unbiased estimaor of
  , and it variance is given by
  .
.
The efficiency of  with respect to
  (based on imperfect ranking) is given by
The exact efficiencies of our proposed estimators under GZRSS with respect to RSS and TBRSS are given in Tab. 3.
Table 3: Exact Eff comparison of mean estimators under standard bivariate normal distribution

It is clear from the results given in Tab. 3 that, as the efficiencies under each design are a function of the correlation coefficient  , i.e., as the value of
  increases, the relative efficiencies increase and vice versa. As expected, the increase in the sample size also increases the efficiency of the estimator under each of the RSS design. The proposed estimators are better than the existing counterparts.
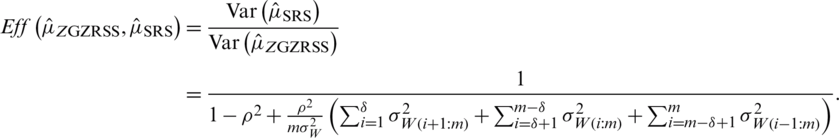
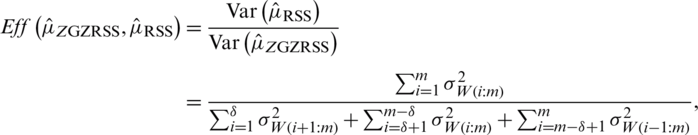
4.2 Comparison with Regression Estimator Based on SRS
Patil et al. [5] compared the estimator of a population mean under RSS with the regression estimator based on SRS. It is shown that for a small correlation between the study variable and the ancillary variable, the RSS mean estimator is better than the regression estimator under SRS. In this section, we compare the performance of the proposed mean estimator under GZRSS with respect to the SRS regression estimator. It is assumed that the population mean of the ancillary variable is known. Following Muttlak [39], the linear regression of Z on W is  ,
,  , where
  and
and  are the intercept and slope of the regression line. Here,
  is error term with zero mean. The linear regression estimator of the population mean
  when
when  is known is

where  and
and  are the corresponding sample mean of Z and W, based on an SRS of size m. Note that,
  is the least square estimator of the slope
  of the regression line. Sukhatme and Sukhatme (1970) showed that the regression estimator given in Eq. (3) of the population mean
  is an unbiased estimator once the joint distribution of Z and W is a bivariate normal distribution. The variance of
  is given by
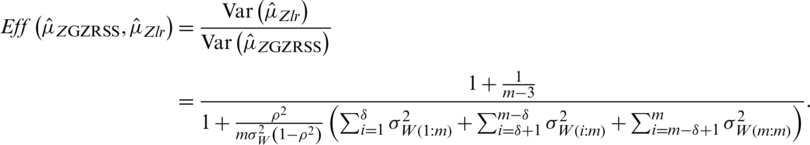
 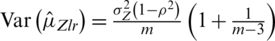 . In case of perfect ranking, the Eff of
  relative to
  is given by
  . Similarly, in case of imperfect ranking, the Eff of
  relative to
  is given by
In Tab. 4, we provide exact relative efficiencies of the proposed estimators with respect to the classical linear regression estimator of mean. Note that the proposed mean estimator with perfect ranking under GZRSS outperforms other competitor estimators when the value of  is less than 0.9.
Table 4: The Eff of the SRS linear regression estimator with respect to the GZRSS estimator based on perfect ranking
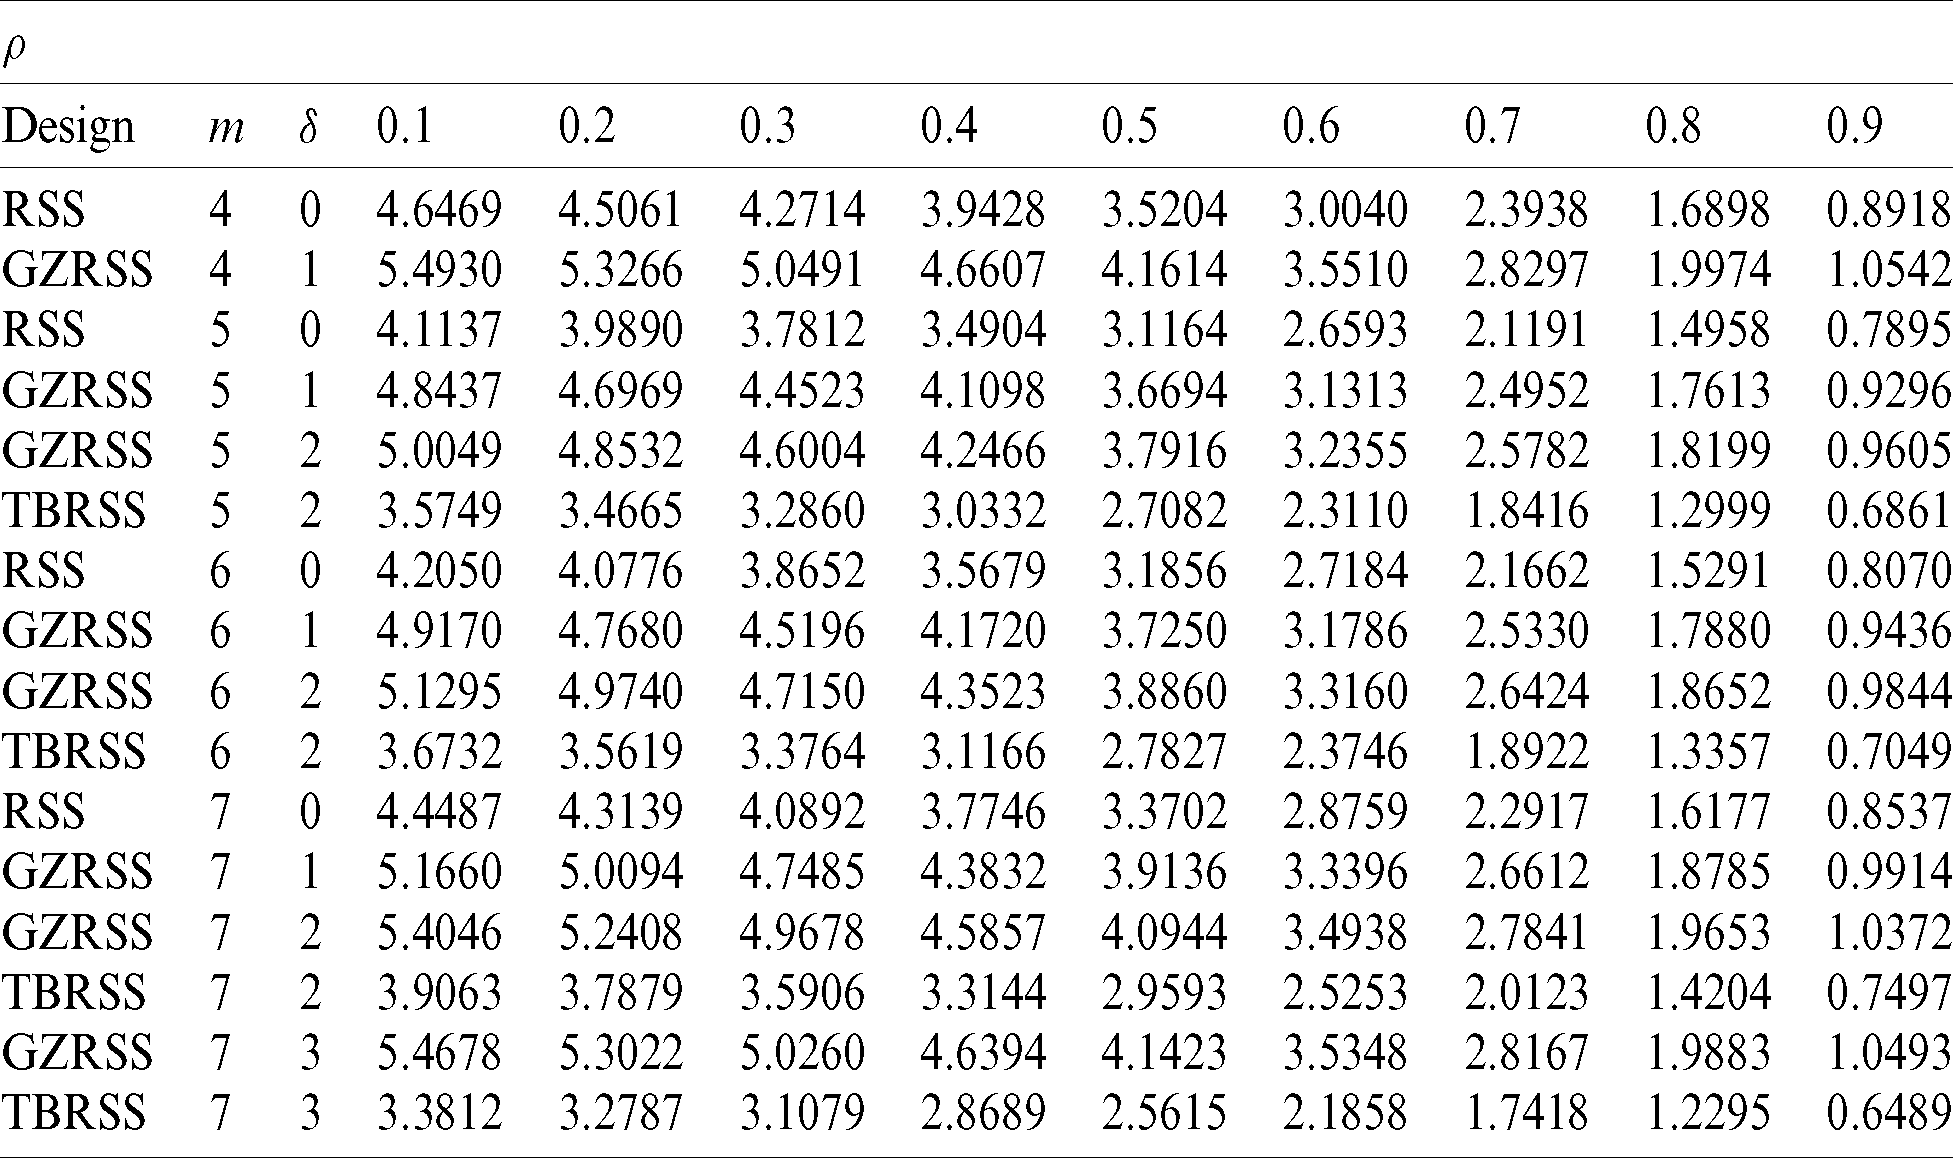
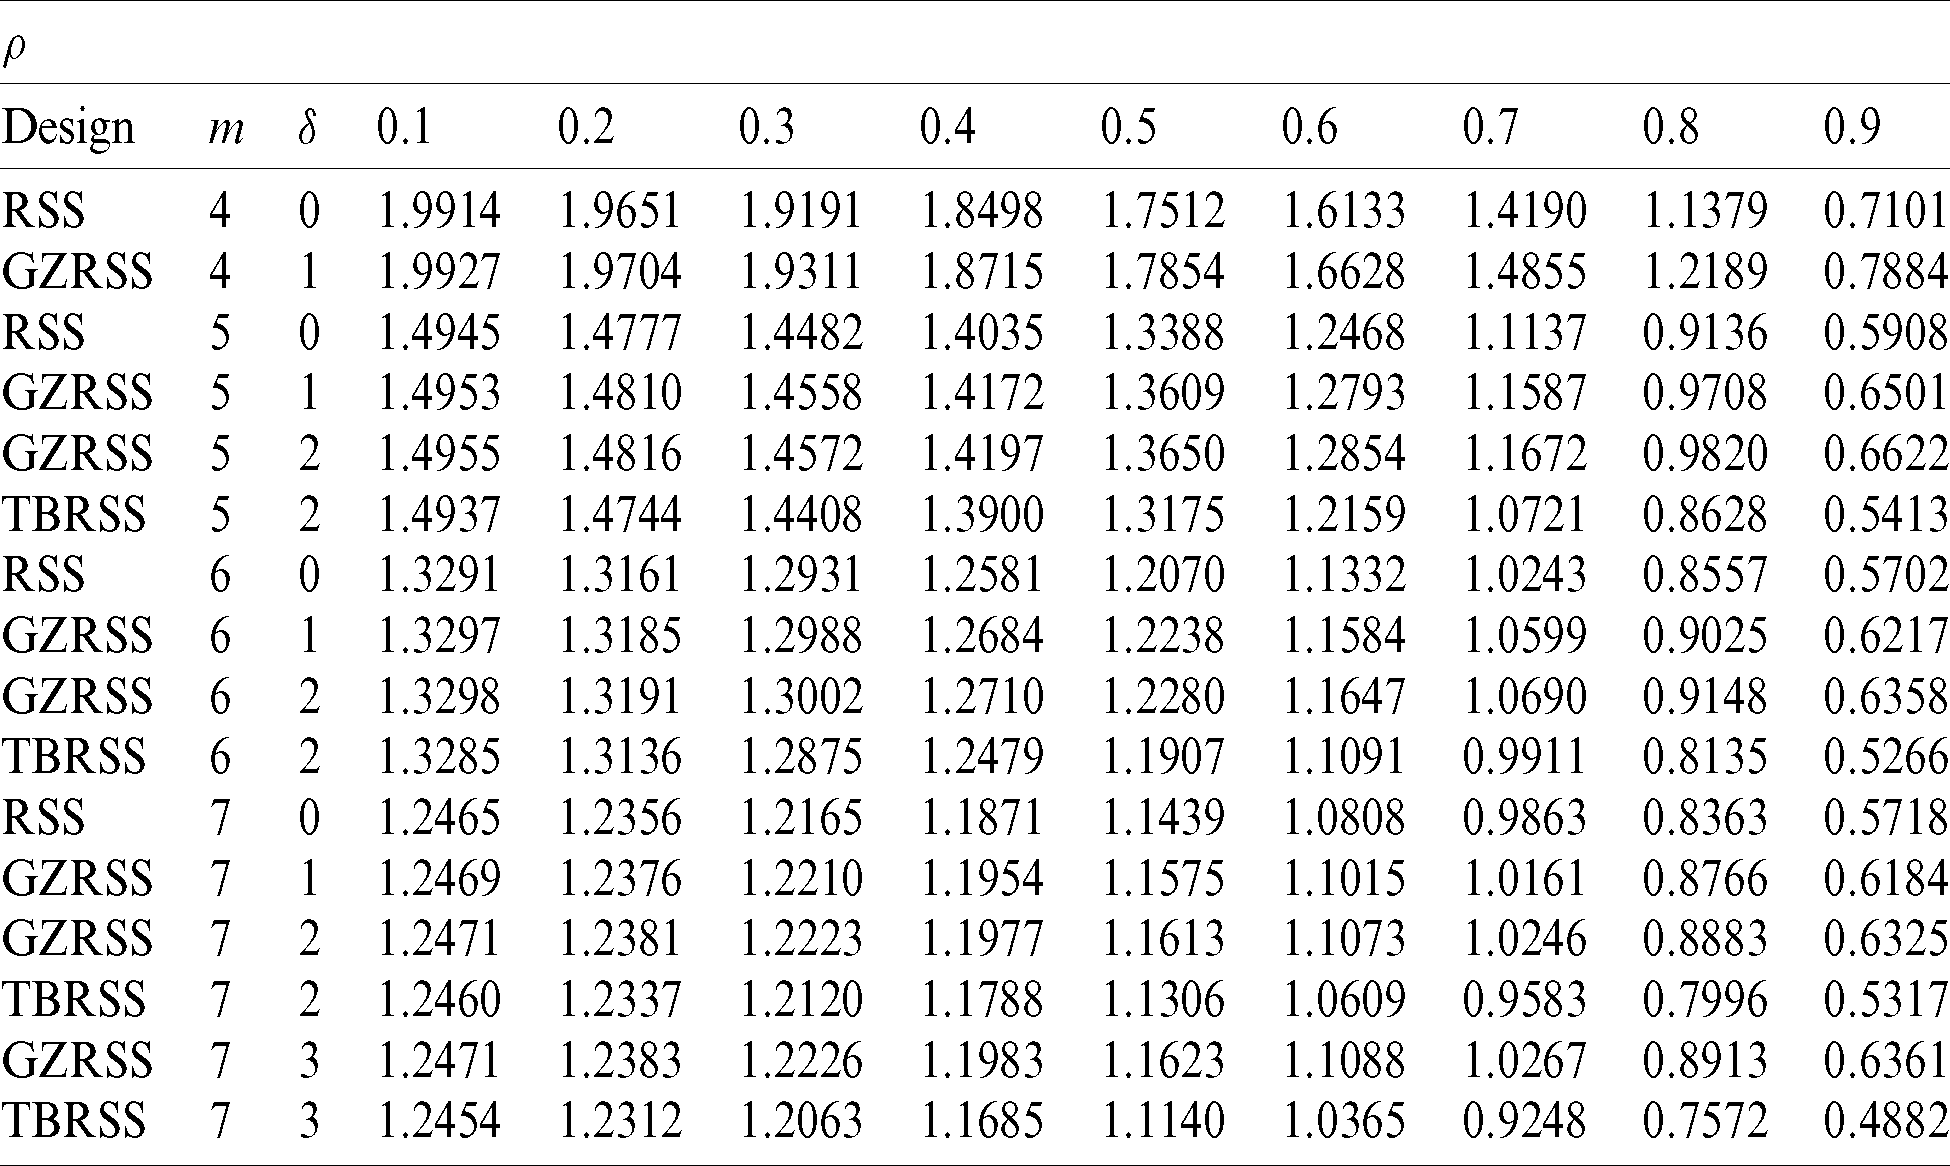
Similarly, in Tab. 5, we compared the performance of the suggested estimators under imperfect ranking with respect to the linear regression estimator. It is worth mentioning that even when there are errors in ranking, the proposed estimator is still more efficient than the linear regression estimator when the value of  is less than 0.8. The efficiencies of the newly estimators are high based on perfect ranking as compared with the case of imperfect ranking. Note that here RE is a decreasing function of sample size because the performance of linear regression estimator is increasing with the increasing of the sample size. For all of the cases, GZRSS mean estimator always performs better than the TBRSS estimator.
Table 5: The Eff of the SRS linear regression estimator with respect to the GZRSS estimator based on imperfect ranking
5 Estimation of Population Median
Estimation of the population median based on the sampling methods, studied in this paper, is presented in this section. Let Q be the population median and  be an SRS of size m. Then, the median estimator is given by
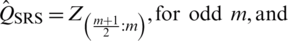
 . From RSS units of size m, i.e.,
  ,
,  , the population median estimator based on the RSS is
 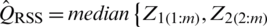 ,
,  . The corresponding population median estimator based on the GZRSS is
  . The efficiencies of
  and
and  with respect to
  , are given by
  where
where 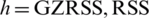 . The estimated MSE of any median estimator is defined as
  The median estimation of some symmetric and asymmetric distributions is considered here based on extensive Monte Carlo simulations. The obtained results are presented in Tabs. 6–8.
Table 6: Eff comparison of median estimators under symmetric distributions
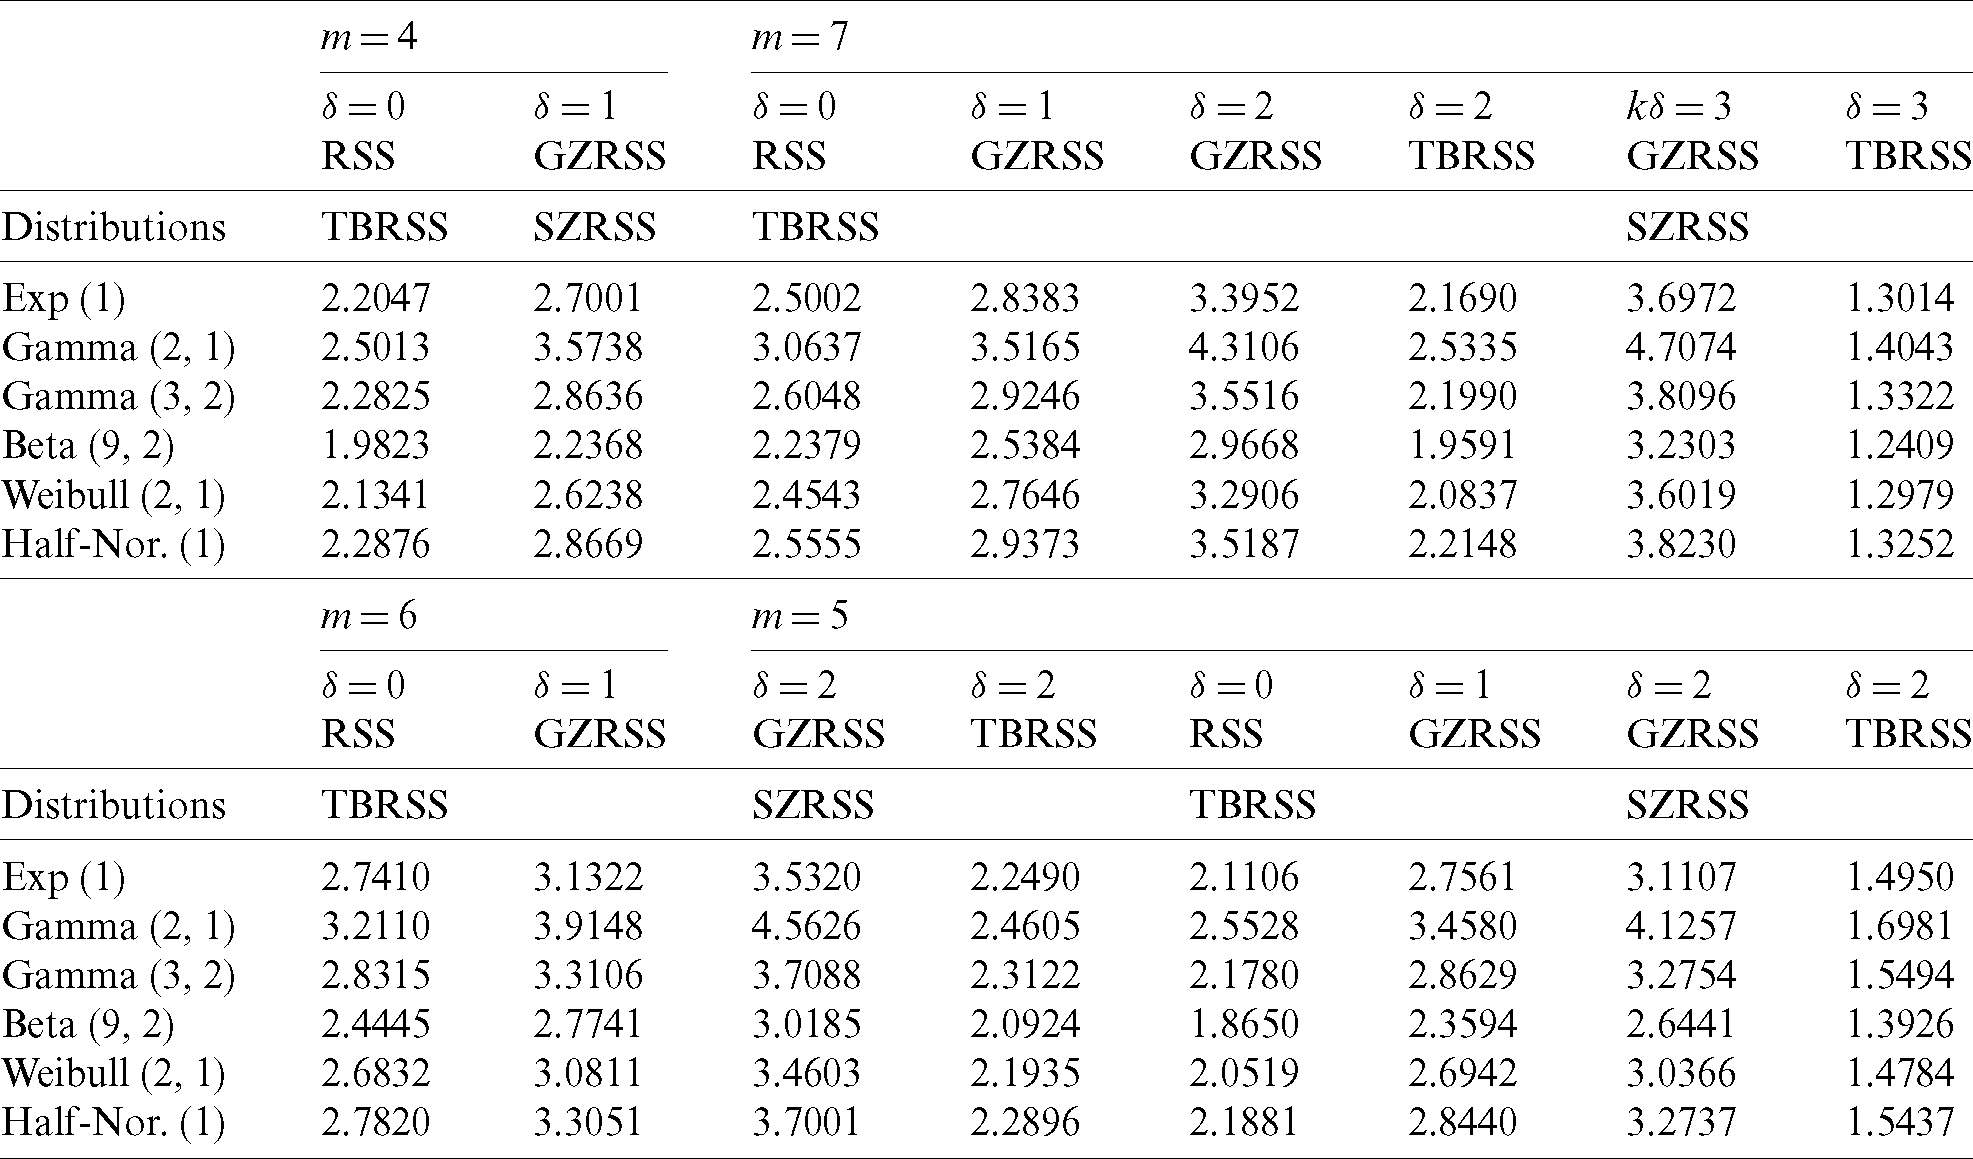
Table 7: Eff comparison of median estimators under asymmetric distributions
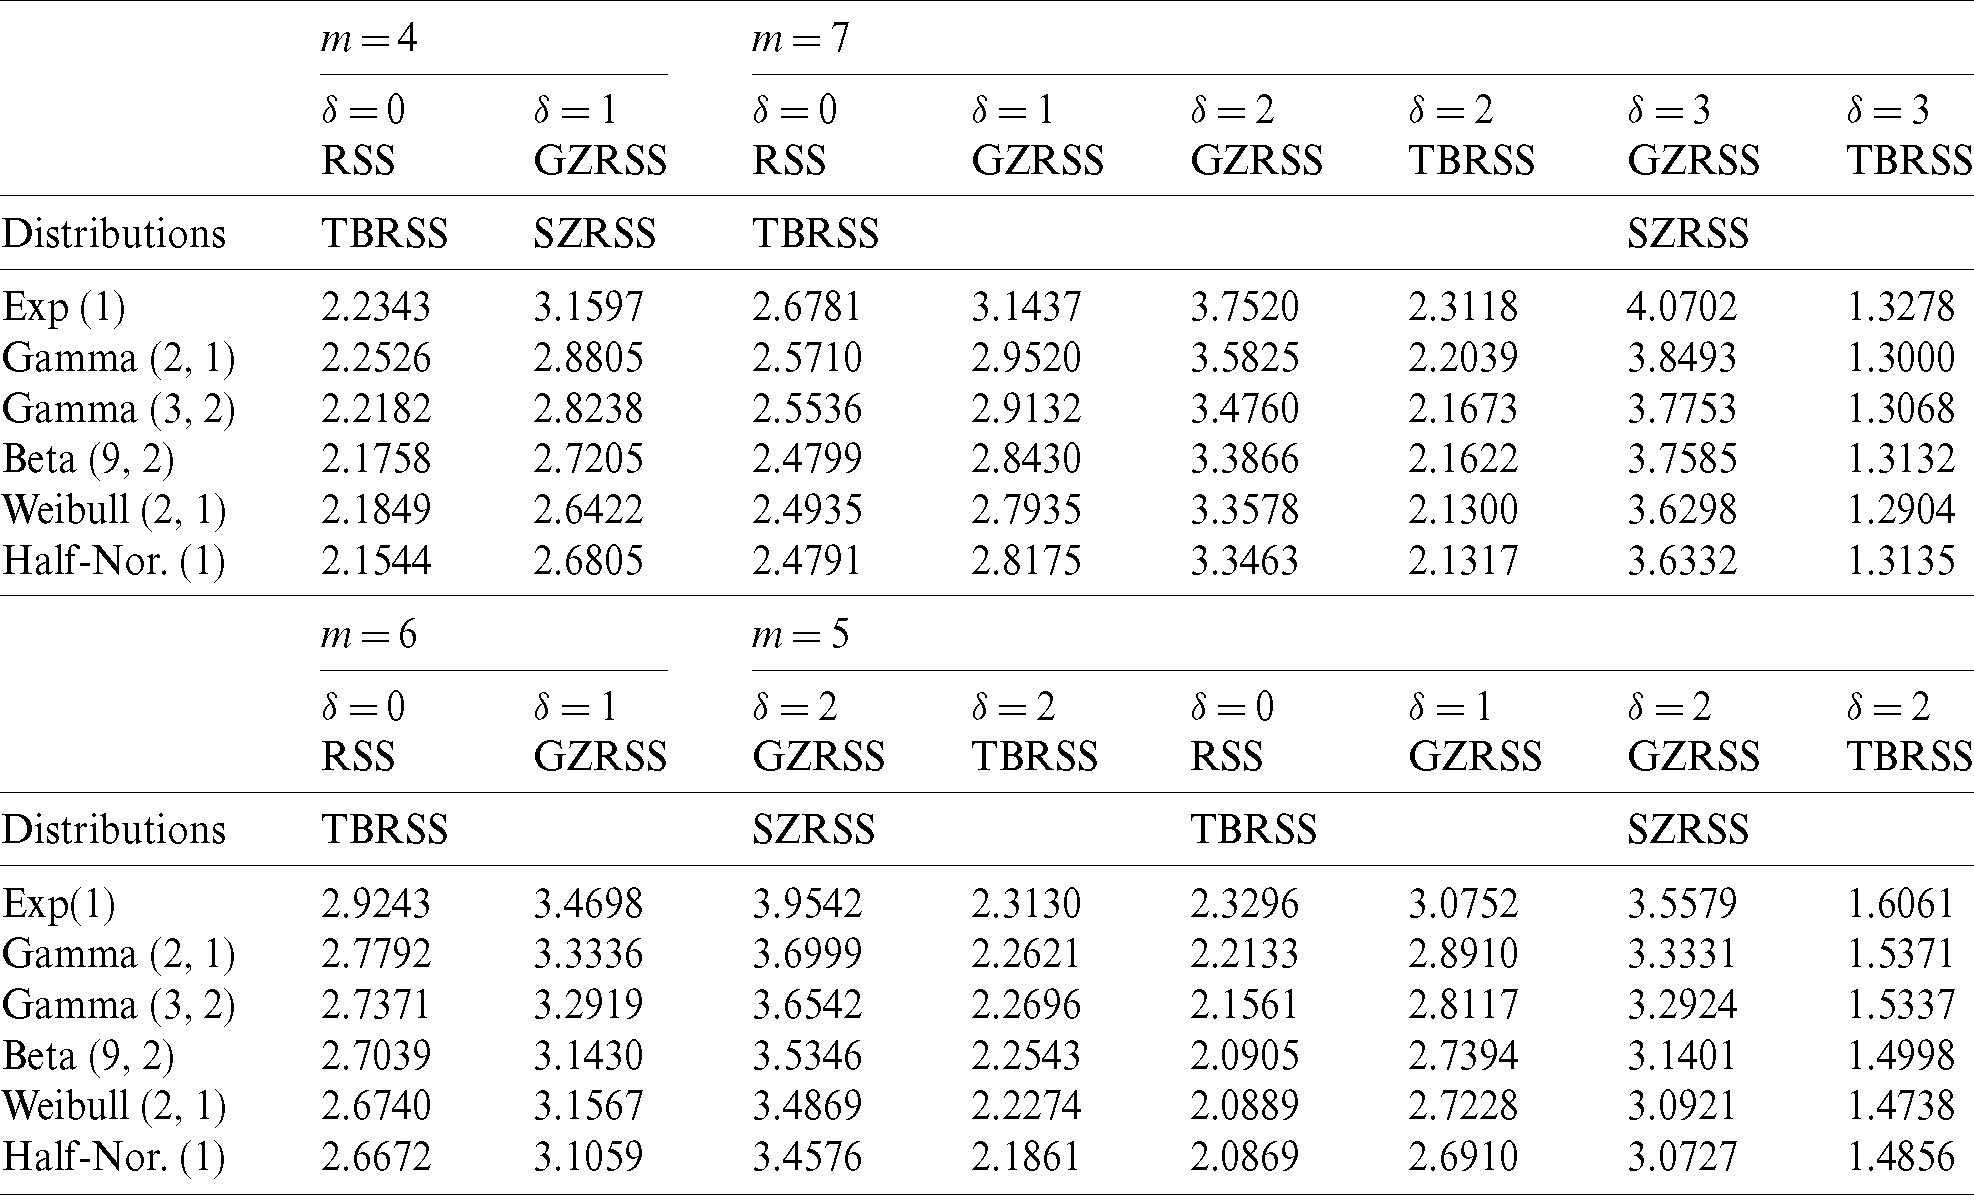
Table 8: Eff comparison of median estimators under bivariate normal distribution
The results, given in Tabs. 6 and 7, reveal that the attainment in efficiency determined by using the GZRSS method. For instance, when m = 7 and  , the RE of the GZRSS is 3.5187 for estimating the median of the student’s t distribution. Also, GZRSS is more efficient than RSS and TBRSS based on the same sample size for a fixed value of
  . To study the performance of the proposed median estimators under GZRSS for imperfect rankings, we have considered standard bivariate normal distribution. The relative efficiencies of the median estimators are obtained for different values of correlation coefficient using extensive Monte Carlo simulations and are displayed in Tab. 8.
According to the results given in Tab. 8, the median estimators under proposed designs are at least as efficient as compared with the SRS median estimator. Here, the relative efficiencies are also increasing function of m and  . The results under GZRSS are efficient as compared to RSS and TBRSS under perfect and imperfect rankings.
To illustrate the use of the GZRSS method in the field, a real data set is considered for both mean and median estimation. This real data set is considered by Platt et al. [45] and it is related to the height and diameter of 399 conifers (Pinus Palustris) trees. The data consists of 7 variables of which we have considered only 2 variables. Let the variable of interest Z represents the height of the conifer tree measured in feet while the ancillary variable W is the diameter of the tree at breast height. In Tab. 9, we provide the summary statistics of the data, and the corresponding plots of the data are displayed in Fig. 1.
Table 9: Statistics summary of the trees data
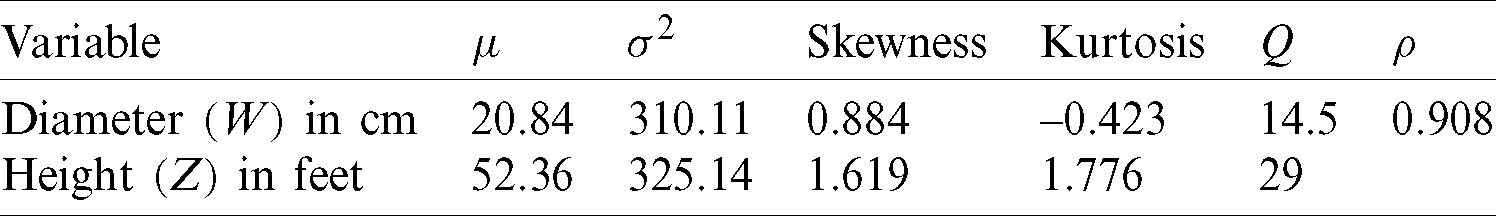

Figure 1: List plot (left) and histogram (right) of the 399-tree data
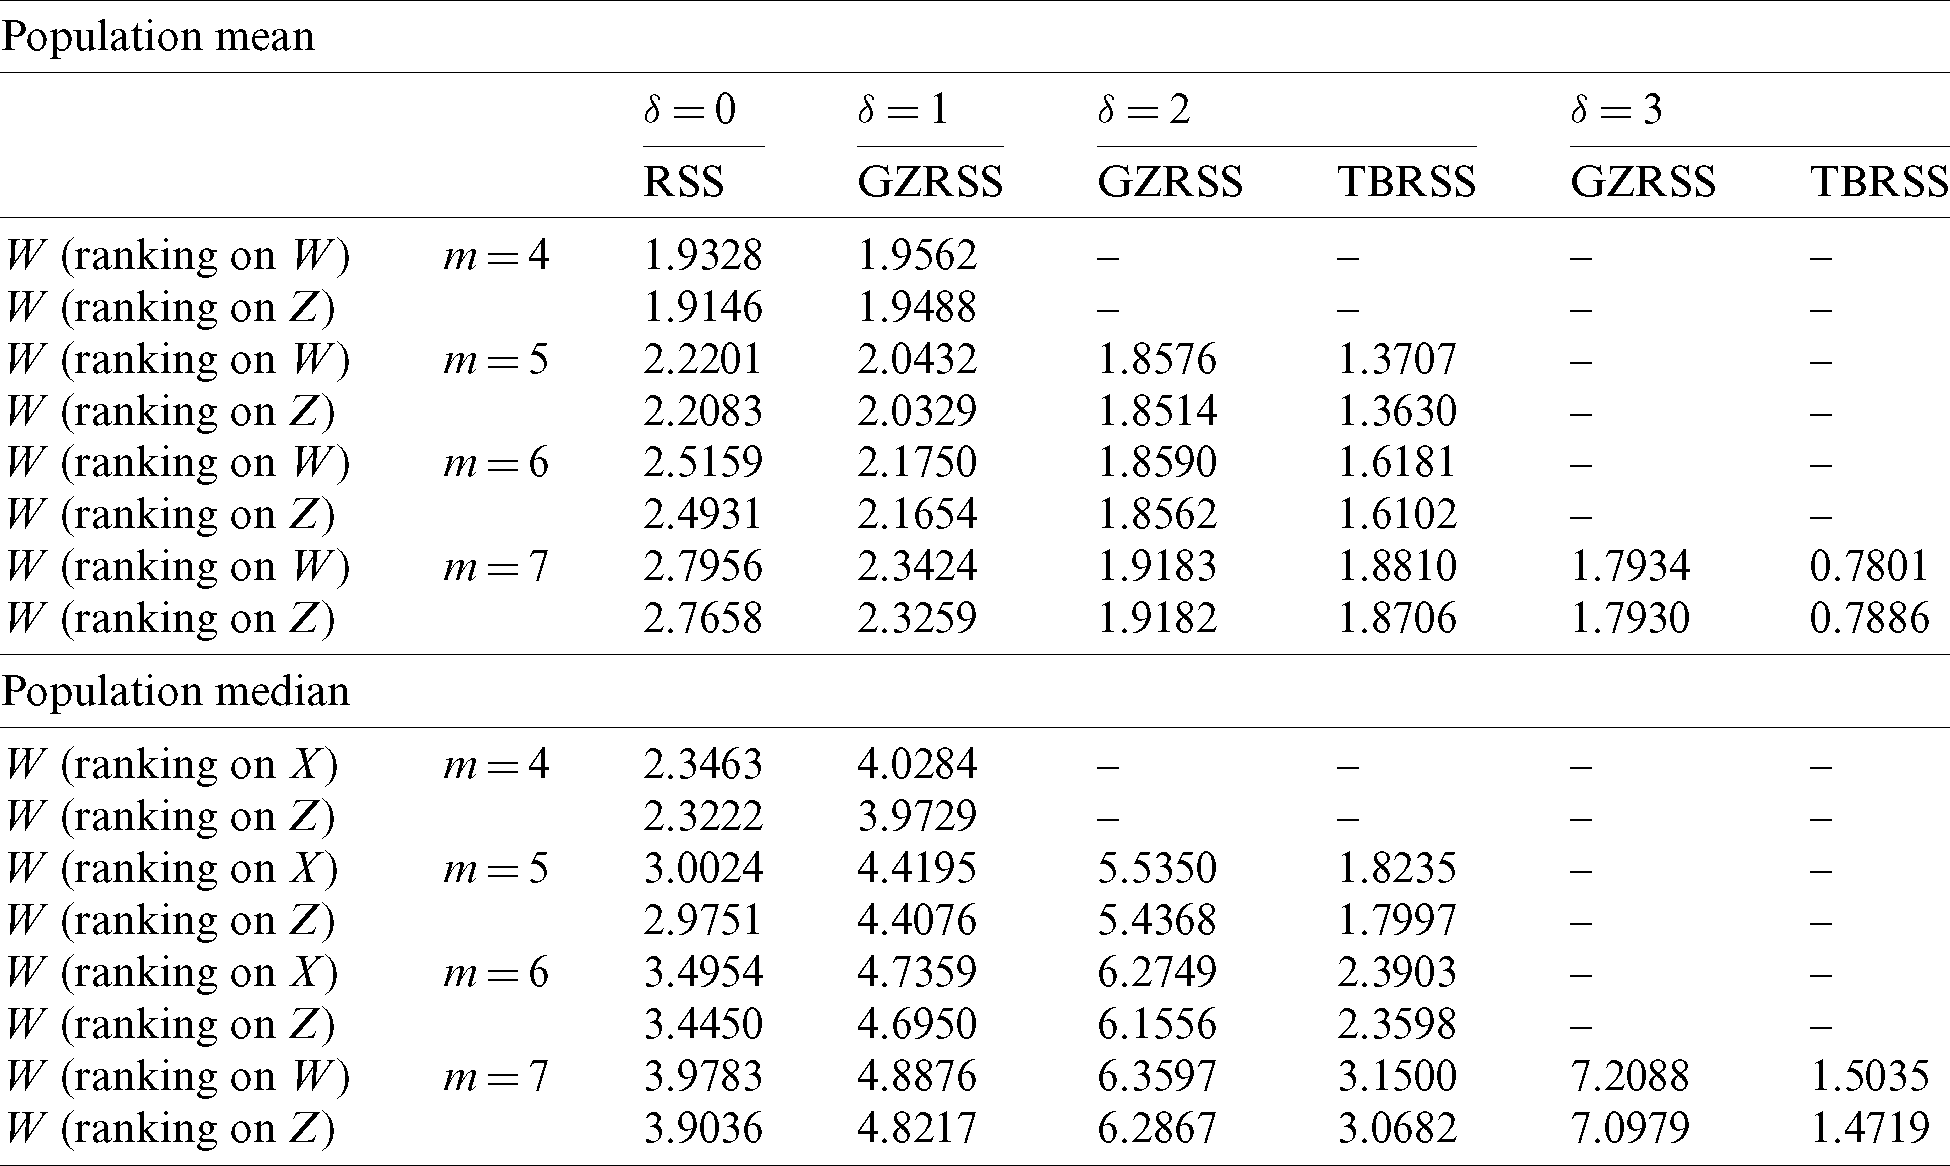
For the diameter and the height, the coefficients of skewness are 0.884 and 1.619 respectively, indicating that these data are non-symmetric. The MSEs for various estimators (under SRS, RSS, TBRSS and GZRSS methods) were calculated by one million iterations. The obtained results are summarized in Tab. 10. The samples were drawn using SRS without replacement. The results given in Tab. 10 are the mean and median estimation values of the trees’ heights under perfect and imperfect rankings. These results demonstrate that the GZRSS estimators are more efficient than their competitors. As we concluded in the above sections, the RE increases as sample size increases and vice versa. The perfect ranking provides efficient estimates than imperfect ranking. Also, the relative efficiencies under GZRSS in median estimation are greater than mean estimation because the data is asymmetrically distributed. The GZRSS is recommended for estimating the mean and median of the trees data.
Table 10: The Eff of estimating of the population mean and median of the study variable based on perfect and imperfect rankings
We propose two new efficient RSS sampling methods for estimating the population mean and median. The proposed estimators based on the new designs are compared with their competitors using SRS, RSS and TBRSS techniques based on the same number of quantified units. It turns out that the GZRSS estimators of the population mean for symmetric populations are unbiased. It is worth mentioning that for non-uniform symmetric distributions, under perfect and imperfect rankings, the mean estimators under the proposed GZRSS are more efficient than those under SRS, RSS and TBRSS methods. We also compare the performance of the mean estimator under GZRSS with the SRS linear regression estimators. It is observed that for small and moderate correlation between the study and ancillary variables, the suggested estimators are more efficient than the SRS linear regression estimator for perfect and imperfect rankings. Therefore, we recommend the use of the proposed sampling methods over the existing RSS methods, considered here. The proposed methods, in this paper, can be considered in many real applications, such as mean estimation in case of missing data [46], quality control charts for monitoring the process mean [47], and in acceptance sampling plans [48,49].
Funding Statement: The authors extend their appreciation to Deanship of Scientific Research at King Khalid University for funding this work through Research Groups Program under Grant No. R. G. P. 2/68/41. I. M. A. and A. I. A. received the grant.
Conflicts of Interest: The authors declare that they have no conflicts of interest to report regarding the present study.
1. G. A. McIntyre. (1952). “A method for unbiased selective sampling using ranked sets,” Australian Journal of Agricultural Research, vol. 3, no. 4, pp. 385–390. [Google Scholar]
2. K. Takahasi and K. Wakimoto. (1986). “On unbiased estimates of the population mean based on the sample stratified by means of ordering,” Annals Institute of Statistics and Mathematics, vol. 20, pp. 1–31. [Google Scholar]
3. T. R. Dell and J. L. Clutter. (1972). “Ranked set sampling theory with order statistics background,” Biometrics, vol. 28, pp. 545–553. [Google Scholar]
4. S. L. Stokes. (1977). “Ranked set sampling with concomitant variables,” Communication in Statistics Theory and Methods, vol. 6, pp. 1207–1211. [Google Scholar]
5. G. P. Patil, A. K. Sinha and C. Taillie. (1993). “Relative precision of ranked set sampling: A comparison with the regression estimator,” Environmetrics, vol. 4, no. 4, pp. 399–412. [Google Scholar]
6. L. K. Halls and T. R. Dell. (1996). “Trial of ranked-set sampling for forage yields,” Forest Sciences, vol. 12, no. 1, pp. 22–26. [Google Scholar]
7. H. M. Samawi, M. S. Ahmed and W. Abu-Dayyeh. (1996). “Estimating the population mean using extreme ranked set sampling,” Biometrical Journal, vol. 38, no. 5, pp. 577–586. [Google Scholar]
8. A. I. Al-Omari and C. N. Bouza. (2015). “Ratio estimators of the population mean with missing values using ranked set sampling,” Environmetrics, vol. 26, no. 2, pp. 67–76. [Google Scholar]
9. A. I. Al-Omari. (2010). “Estimation of the population median of symmetric and asymmetric distributions using double robust extreme ranked set sampling,” Revista Investigacion Operacional, vol. 31, no. 3, pp. 200–208. [Google Scholar]
10. M. F. Al-Saleh and A. I. Al-Omari. (2002). “Multistage ranked set sampling,” Journal of Statistical Planning and Inference, vol. 102, no. 2, pp. 273–286. [Google Scholar]
11. A. D. Al-Nasser. (2007). “L ranked set sampling: A generalized procedure for robust visual sampling,” Communications in Statistics–Simulation and Computation, vol. 36, no. 1, pp. 33–43. [Google Scholar]
12. H. A. Muttlak. (1997). “Median ranked set sampling,” Journal of Applied Statistical Science, vol. 6, pp. 245–255. [Google Scholar]
13. A. A. Jemain, A. I. Al-Omari and K. Ibrahim. (2007). “Multistage median ranked set sampling for estimating the population median,” Journal of Mathematics and Statistics, vol. 3, no. 2, pp. 58–64. [Google Scholar]
14. A. A. Jemain, A. I. Al-Omari and K. Ibrahim. (2008). “Some variations of ranked set sampling,” Electronic Journal of Applied Statistical Analysis, vol. 1, no. 1, pp. 1–15. [Google Scholar]
15. A. I. Al-Omari. (2012). “Ratio estimation of population mean using auxiliary information in simple random sampling and median ranked set sampling,” Statistics and Probability Letters, vol. 82, no. 11, pp. 1883–1890. [Google Scholar]
16. A. I. Al-Omari. (2014). “Estimation of entropy using random sampling,” Journal of Computational and Applied Mathematics, vol. 261, pp. 95–102. [Google Scholar]
17. S. S. Hossain and H. A. Muttlak. (1999). “Paired ranked set sampling: A more efficient procedure,” Environmetrics, vol. 10, pp. 195–212. [Google Scholar]
18. M. R. Shadid, M. Z. Raqaband and A. I. Al-Omari. (2011). “Modified BLUEs and BLIEs of the location and scale parameters and the population mean using ranked set sampling,” Journal of Statistical Computation and Simulation, vol. 81, no. 3, pp. 261–274. [Google Scholar]
19. A. I. Al-Omari and A. D. Al-Nasser. (2018). “Ratio estimation using multistage median ranked set sampling approach,” Journal of Statistical Theory and Practice, vol. 12, no. 3, pp. 512–529. [Google Scholar]
20. A. I. Al-Omari. (2011). “Estimation of mean based on modified robust extreme ranked set sampling,” Journal of Statistical Computation and Simulation, vol. 81, no. 8, pp. 1055–1066. [Google Scholar]
21. A. Haq. (2015). “A new Shewhart control chart for monitoring process mean based on partially ordered judgment subset sampling,” Quality & Quantity, vol. 49, no. 3, pp. 1185–1202. [Google Scholar]
22. A. Haq, J. Brown and E. Moltchanova. (2015). “Improved best linear unbiased estimators for the simple linear regression model using double ranked set sampling schemes,” Communications in Statistics Theory and Methods, vol. 45, no. 12, pp. 3541–3561. [Google Scholar]
23. P. L. H. Yu and K. Lam. (1997). “Regression estimator in ranked set sampling,” Biometrics, vol. 53, no. 3, pp. 1070–1080. [Google Scholar]
24. A. D. Al-Nasser and A. B. Mustafa. (2009). “Robust extreme ranked set sampling,” Journal of Statistical Computation and Simulation, vol. 79, no. 7, pp. 859–867. [Google Scholar]
25. A. Haq and J. Shabbir. (2010). “A family of ratio estimators for population mean in extreme ranked set sampling using two auxiliary variables,” SORT, vol. 34, no. 1, pp. 45–64. [Google Scholar]
26. O. Ozturk. (2011). “Sampling from partially rank-ordered sets,” Environmental and Ecological Statistics, vol. 18, no. 4, pp. 757–779. [Google Scholar]
27. E. Zamanzade and A. I. Al-Omari. (2016). “New ranked set sampling for estimating the population mean and variance,” Hacettepe Journal of Mathematics and Statistics, vol. 45, no. 6, pp. 1891–1905. [Google Scholar]
28. A. Haq. (2017). “Two-stage cluster sampling with hybrid ranked set sampling in the secondary sampling frame,” Communications in Statistics Theory and Methods, vol. 46, no. 17, pp. 8450–8467. [Google Scholar]
29. A. Haq. (2017). “Estimation of the distribution function under hybrid ranked set sampling,” Journal of Statistical Computation and Simulation, vol. 87, no. 2, pp. 313–327. [Google Scholar]
30. A. I. Al-Omari and E. Zamanzade. (2017). “Goodness of-fit-tests for Laplace distribution in ranked set sampling,” Revista Investigacin Operacional, vol. 38, no. 4, pp. 366–276. [Google Scholar]
31. A. I. Al-Omari and E. Zamanzade. (2018). “Goodness of fit tests for logistic distribution based on Phi-divergence,” Electronic Journal of Applied Statistical Analysis, vol. 11, no. 1, pp. 185–195. [Google Scholar]
32. A. D. Al-Nasser and A. I. Al-Omari. (2014). “Information theoretic weighted mean based on truncated ranked set sampling,” Journal of Statistical Theory and Practice, vol. 9, no. 2, pp. 313–329. [Google Scholar]
33. E. Zamanzade and M. Mahdizadeh. (2018). “Estimating the population proportion in pair ranked set sampling with application to air quality monitoring,” Journal of Applied Statistics, vol. 45, no. 3, pp. 426–437. [Google Scholar]
34. A. Haq. (2019). “Ordered partially ordered judgment subset sampling with applications to parametric inference,” Journal of Statistical Computation and Simulation, vol. 89, no. 18, pp. 3354–3376. [Google Scholar]
35. A. I. Al-Omari and M. Z. Raqab. (2012). “Estimation of the population mean and median using truncation-based ranked set samples,” Journal of Statistical Computation and Simulation, vol. 83, no. 8, pp. 453–471. [Google Scholar]
36. A. D. Al-Nasser and A. I. Al-Omari. (2018). “MiniMax ranked set sampling,” Revista Investigacin Operacional, vol. 39, no. 4, pp. 560–570. [Google Scholar]
37. A. Haq, J. Brown and E. Moltchanova. (2014). “Hybrid ranked set sampling scheme,” Journal of Statistical Computation and Simulation, vol. 86, no. 1, pp. 1–28. [Google Scholar]
38. Y. G. Wang, Z. H. Chen and J. Liu. (2004). “General ranked set sampling with cost consideration,” Biometrics, vol. 60, no. 2, pp. 556–561. [Google Scholar]
39. H. A. Muttlak. (1998). “Median ranked set sampling with concomitant variables and a comparison with ranked set sampling and regression estimators,” Environmetrics, vol. 9, pp. 225–267. [Google Scholar]
40. E. Zamanzade and M. Mahdizadeh. (2017). “A more efficient proportion estimator in ranked set sampling,” Statistics & Probability Letters, vol. 129, pp. 28–33. [Google Scholar]
41. M. Mahdizadeh and E. Zamanzade. (2018). “Smooth estimation of a reliability function in ranked set sampling,” Statistics: A Journal of Theoretical and Applied Statistics, vol. 52, no. 4, pp. 750–768. [Google Scholar]
42. M. Mahdizadeh and E. Zamanzade. (2020). “Estimation of a symmetric distribution function in multistage ranked set sampling,” Statistical Papers, vol. 61, no. 2, pp. 851–867. [Google Scholar]
43. L. Dümbgen and E. Zamanzade. (2020). “Inference on a distribution function from ranked set samples,” Annals of the Institute of Statistical Mathematics, vol. 72, no. 1, pp. 157–185. [Google Scholar]
44. E. Zamanzade and M. Mahdizadeh. (2020). “Using ranked set sampling with extreme ranks in estimating the population proportion,” Statistical Methods in Medical Research, vol. 29, no. 1, pp. 165–177. [Google Scholar]
45. W. J. Platt, G. W. Evans and S. L. Rathbun. (1988). “The population dynamics of a long lived conifer (pinus palustris),” American Nature, vol. 131, no. 4, pp. 491–525. [Google Scholar]
46. C. N. Bouza and A. I. Al-Omari. (2011). “Ranked set estimation with imputation of the missing observations: The median estimator,” Revista Investigacion Operacional, vol. 32, no. 1, pp. 30–37. [Google Scholar]
47. A. I. Al-Omari and A. Haq. (2012). “Improved quality control charts for monitoring the process mean, using double-ranked set sampling methods,” Journal of Applied Statistics, vol. 39, no. 4, pp. 745–763. [Google Scholar]
48. A. I. Al-Omari. (2018). “Improved acceptance sampling plans based on truncated life tests for Garima distribution,” International Journal of System Assurance Engineering and Management, vol. 9, no. 6, pp. 1287–1293. [Google Scholar]
49. A. I. Al-Omari. (2018). “The transmuted generalized inverse Weibull distribution in acceptance sampling plans based on life tests,” Transactions of the Institute of Measurement and Control, vol. 40, no. 16, pp. 4432–4443. [Google Scholar]
 | This work is licensed under a Creative Commons Attribution 4.0 International License, which permits unrestricted use, distribution, and reproduction in any medium, provided the original work is properly cited. |