DOI:10.32604/cmc.2021.014956
| Computers, Materials & Continua DOI:10.32604/cmc.2021.014956 | |
| Article |
Deep Learning Approach for COVID-19 Detection in Computed Tomography Images
1Department of Applied Computer Science, College of Applied Computer Engineering, King Saud University, Riyadh, 11362, Saudi Arabia
2Department of Computer Engineering, College of Computer and Information Science, King Saud University, Riyadh, 11362, Saudi Arabia
3Department of Computer Science, College of Computer and Information Science, King Saud University, Riyadh, 11362, Saudi Arabia
*Corresponding Author: Yakoub Bazi. Email: ybazi@ksu.edu.sa
Received: 29 October 2020; Accepted: 13 December 2020
Abstract: With the rapid spread of the coronavirus disease 2019 (COVID-19) worldwide, the establishment of an accurate and fast process to diagnose the disease is important. The routine real-time reverse transcription-polymerase chain reaction (rRT-PCR) test that is currently used does not provide such high accuracy or speed in the screening process. Among the good choices for an accurate and fast test to screen COVID-19 are deep learning techniques. In this study, a new convolutional neural network (CNN) framework for COVID-19 detection using computed tomography (CT) images is proposed. The EfficientNet architecture is applied as the backbone structure of the proposed network, in which feature maps with different scales are extracted from the input CT scan images. In addition, atrous convolution at different rates is applied to these multi-scale feature maps to generate denser features, which facilitates in obtaining COVID-19 findings in CT scan images. The proposed framework is also evaluated in this study using a public CT dataset containing 2482 CT scan images from patients of both classes (i.e., COVID-19 and non-COVID-19). To augment the dataset using additional training examples, adversarial examples generation is performed. The proposed system validates its superiority over the state-of-the-art methods with values exceeding 99.10% in terms of several metrics, such as accuracy, precision, recall, and F1. The proposed system also exhibits good robustness, when it is trained using a small portion of data (20%), with an accuracy of 96.16%.
Keywords: COVID-19; deep learning; computed tomography; multi-scale features; atrous convolution; adversarial examples
The coronavirus disease 2019 (COVID-19) is an ongoing pandemic, which has caused coronavirus outbreak worldwide. It has been initially discovered in the city of Wuhan, China, at the end of 2019. COVID-19 has been found to be caused by severe acute respiratory syndrome coronavirus-2 (SARS-CoV-2). The term “coronavirus” has been derived from a Latin word “corona,” which means crown, indicating the spikes or crown-like projections from the membrane of the virus, as presented in Fig. 1 [1]. According to the reports of the World Health Organization (WHO), the number of people infected with this virus is rapidly increasing every day. As of October 23, 2020, more than 41.5 million cases have already been recorded, with approximately 1.13 million deaths [2].
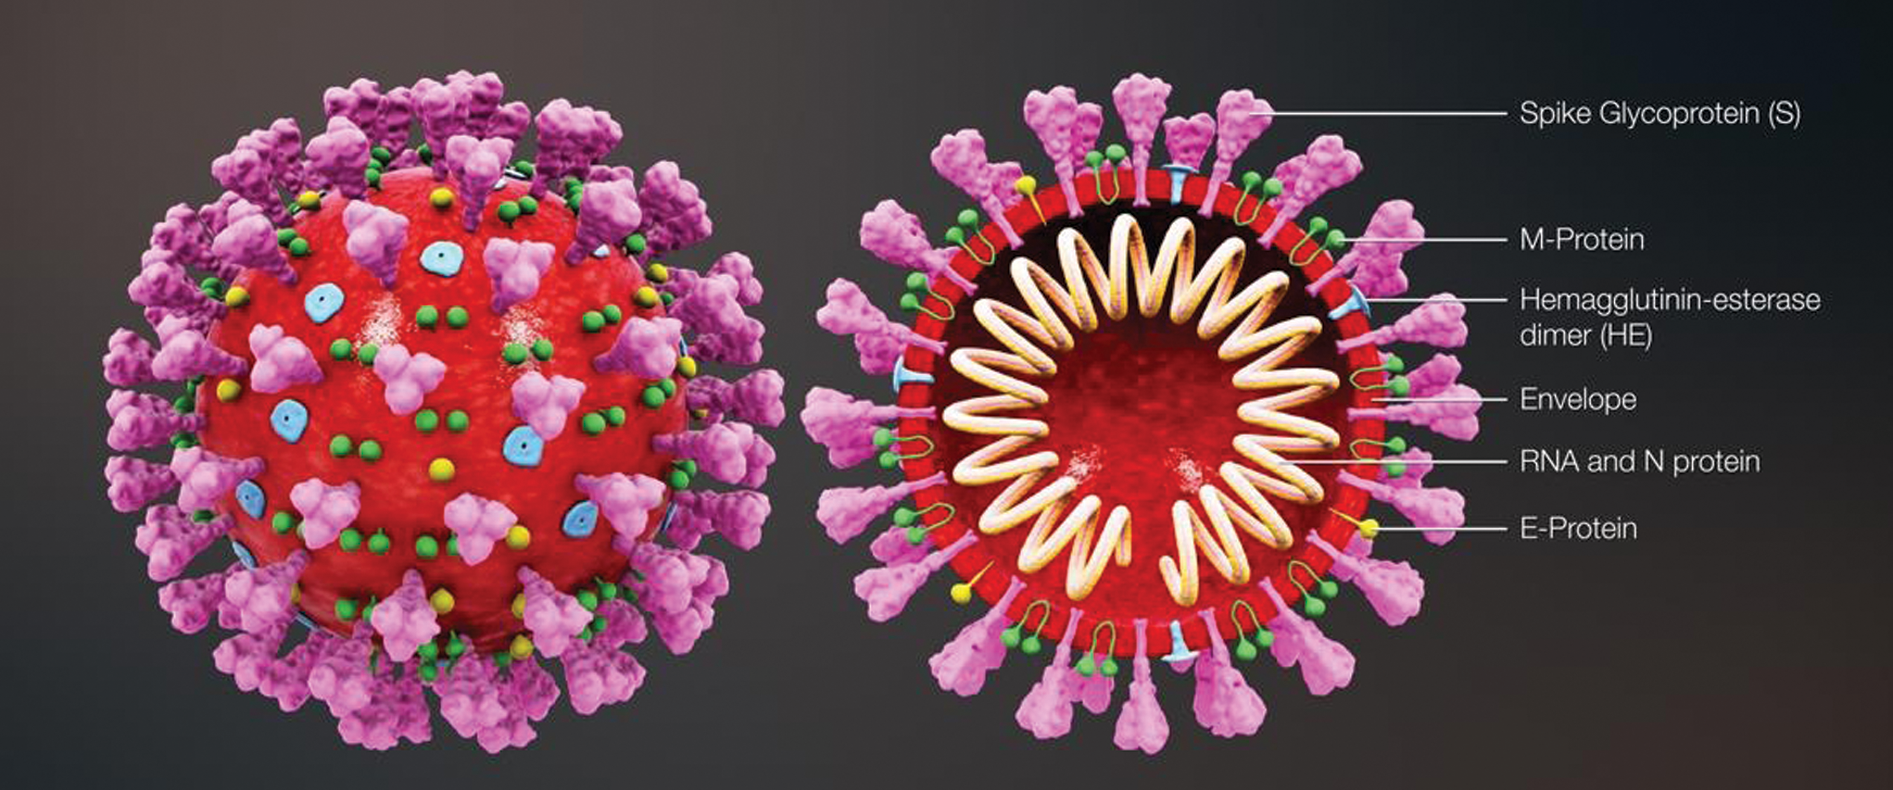
Figure 1: Three-dimensional medical animation captured, which demonstrates the structure of the coronavirus [1]
The routine real-time reverse transcription-polymerase chain reaction (rRT-PCR) test is considered as the standard test for COVID-19 detection. However, several concerns have been raised about this test, including the long time to obtain results, the limited availability of the kits, lower accuracy (83.3%) in detecting the virus, and higher error rate in false-negative results [3]. These limitations prompted the researchers to study the importance of radiology (i.e., chest computed tomography [CT] and chest X-ray [CXR]) in screening COVID-19 [3,4]. The studies revealed that the diagnosis of COVID-19 using CT scan images is more efficient than RT-PCR, as reported in [5], where it has been found that the sensitivity of CT for COVID-19 infection is 98%, whereas it is 71% for RT-PCR. Ai et al. [6] suggested that chest CT may be the primary tool for the detection of COVID-19 in areas affected by the epidemic. They found that the sensitivity of CT is 88%, whereas that of RT-PCR is 59%.
Deep learning techniques, mainly convolutional neural networks (CNNs), which are among the powerful deep learning architectures, have recently proven their superiority over traditional approaches in several domains, such as pattern recognition and image classification [7,8]. In recent years, these techniques have provided promising results in medical image analysis [9,10]. Numerous studies have used deep learning models to analyze and detect COVID-19 using CT scan images [11–23] or in CXR images [24–33].
In addition, Panwar et al. [15] revealed that the detection of COVID-19 can be more efficient and accurate when using CT scan images compared with CXR images. They employed transfer learning to screen COVID-19 using the VGG-19 model. They trained their model on three different datasets from CT and CXR images.
Wang et al. [12] proposed a deep learning-based system to automatically detect COVID-19 using CT scan images. Their proposed model is based on transfer learning. They employed a modified version of the pre-trained Inception model, which they called M-Inception. Moreover, they evaluated their model using a non-publicly available CT dataset. Such dataset is composed of positive COVID-19 cases and viral pneumonia cases. The reported performance result exhibited an accuracy of 82.0% in detecting COVID-19.
Li et al. [16] also proposed an automatic deep learning-based system to detect COVID-19 using CT scan images. The objective of their system is to distinguish COVID-19 from community-acquired pneumonia (CAP) and other lung diseases. Their proposed model, which is called COVNet, used ResNet50 [34] as the backbone. They evaluated COVNet using a non-publicly available dataset. Such dataset is composed of 4356 3D chest CT exams of 3322 patients, 1296 (30%) of COVID-19 patients, 1735 (40%) of CAP patients, and 1325 (30%) for non-pneumonia patients. The reported results revealed that their system was able to detect COVID-19, with a sensitivity of 90% and specificity of 96%.
Butt et al. [13] proposed an early prediction model to distinguish COVID-19 pneumonia from Influenza-A viral pneumonia and healthy cases using pulmonary CT scan images by applying deep learning techniques. Their model has yielded an overall accuracy of 86.7%.
Barstugan et al. [35] proposed a system for the early detection of COVID-19 using CT scan images. Their system is based on the extraction of four different features from CT scan images with four different patch sizes. Moreover, they used support vector machine (SVM) to classify the features of COVID-19. They evaluated their system using 150 CT scan images of 53 infected cases, which were provided by the Italian Society of Medical Radiology (SIRM) [36]. Their system was able to achieve an accuracy of 99.68%. The author has advised to evaluate their system using another dataset.
Song et al. [11] proposed a deep learning-based system to automatically distinguish COVID-19 viral pneumonia from bacterial pneumonia or healthy cases. They evaluated their system using a dataset obtained from two hospitals. The dataset is composed of 777, 505, and 708 CT scan images of 88 COVID-19 patients, 100 bacterial pneumonia patients, and 86 healthy cases, respectively. The reported result exhibited an accuracy of 94% with recall of 93% in distinguishing COVID-19 patients from others.
Several studies have employed segmentation techniques on CT scan images for the detection and analysis of COVID-19 [14,17,18]. Chen et al. [17] proposed a deep learning-based model to detect COVID-19 using high-resolution CT scan images. Their model is based on the utilization of UNet++ segmentation architecture to extract the lesions representing the COVID-19 cases. They evaluated their model using a non-publicly available dataset. This dataset is composed of 46096 CT scan images of 106 patients, of whom 55 and 51 are COVID-19 and non-COVID-19 patients, respectively. The evaluation revealed that their proposed model achieved an accuracy of 95.24% and 98.85% in per-patient experiments and per-image experiments, respectively.
Chen et al. [18] proposed a Residual Attention U-Net system to segment the lung CT scan image. They exploited the residual network and attention mechanism to improve the efficacy of U-Net. Moreover, they evaluated their proposed system using a publicly available CT dataset provided by the SIRM [36]. The reported results revealed that their system achieved an accuracy of 94% in the segmentation of the COVID-19 symptoms.
Zhang et al. [14] proposed a weakly supervised deep learning-based system for the detection of COVID-19 using 3D CT scan images. For each patient, the lung region was segmented using a pre-trained UNet; then, the segmented 3D lung region was fed into a 3D deep neural network to predict the probability of COVID-19 infection. They evaluated their system using non-publicly available dataset. This dataset is composed of 313 COVID-19 and 229 non-COVID-19 patients. Their system was able to achieve an accuracy of 90.1% in the detection of COVID-19.
In this study, a deep learning-based architecture for the detection of COVID-19 using CT scan images is proposed. This system is based on the extraction of multi-scale feature maps along with the application of atrous convolution. To overcome the problem of limited amount of training data, we increased the dataset by performing adversarial examples generation. The main contributions of this study are presented below:
• We propose a deep learning-based model for the detection of COVID-19 using CT scan images, which is faster and more accurate compared with the routine rRT-PCR test.
• The proposed model is based on the extraction of multi-scale feature maps along with the application of atrous convolution at different rates to generate dense features.
• We increase the CT dataset by generating adversarial examples, which clearly improved the performance.
• The experimental results prove the superiority of the proposed framework over the state-of-the-art methods in terms of all the reported performance metrics.
• Furthermore, the proposed system exhibits high robustness despite the scarcity of the training data, which the case of COVID-19 pandemic circumstances.
The remainder of this paper is organized as follows. Section 2 describes the proposed methodology in detail. Section 3 provides the dataset description and describes the experimental protocol. Section 4 presents and discusses the results and findings. Finally, Section 5 provides the conclusion and future works.
Let  be a training set, where
  denotes a CT scan image,
  its corresponding class label (the two classes are COVID-19 and non-COVID-19); and n the number of training samples. We aimed to develop a deep architecture to classify the test CT scan images
  . Fig. 2 presents a flowchart of the proposed method, which has four main components: CNN backbone, multi-scale feature maps with atrous convolution at different rates, weighted fusion, and classification. The detailed descriptions of these components are presented in the next subsections.
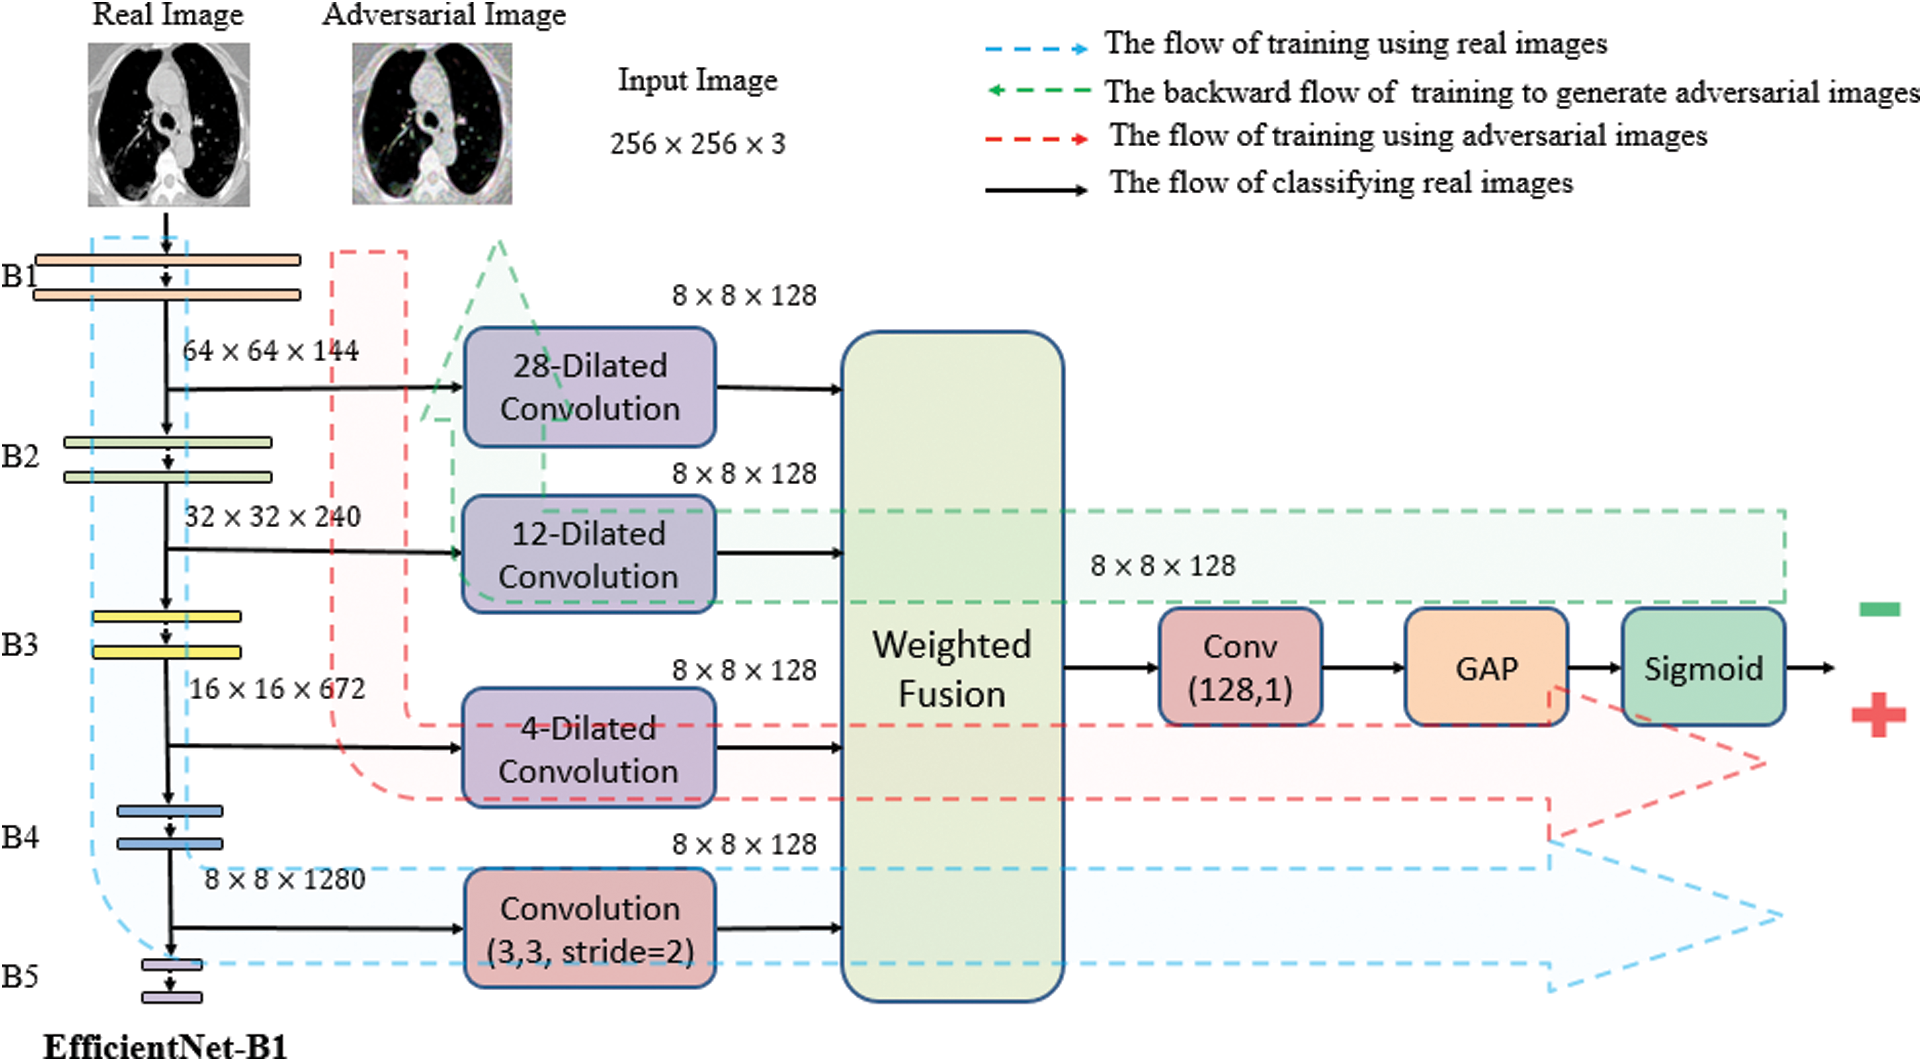
Figure 2: Architecture of the proposed method which consists of four main stages: CNN backbone, multi-scale feature maps extractor, weighted fusion, and classification. The three types of image flow can be distinguished
To learn the visual features f(Xi) of the CT scan image, we use pre-trained EfficientNet CNN as the backbone of our proposed architecture. EfficientNet has been recently developed by Google [37] for scaling up CNNs. It uses a simple and highly effective compound coefficient. Contrary to pre-trained traditional methods, which scale the dimensions of networks (width, depth, and resolution), EfficientNet scales each dimension with a constant ratio. This improves the performance of the whole network, as presented in Fig. 3.
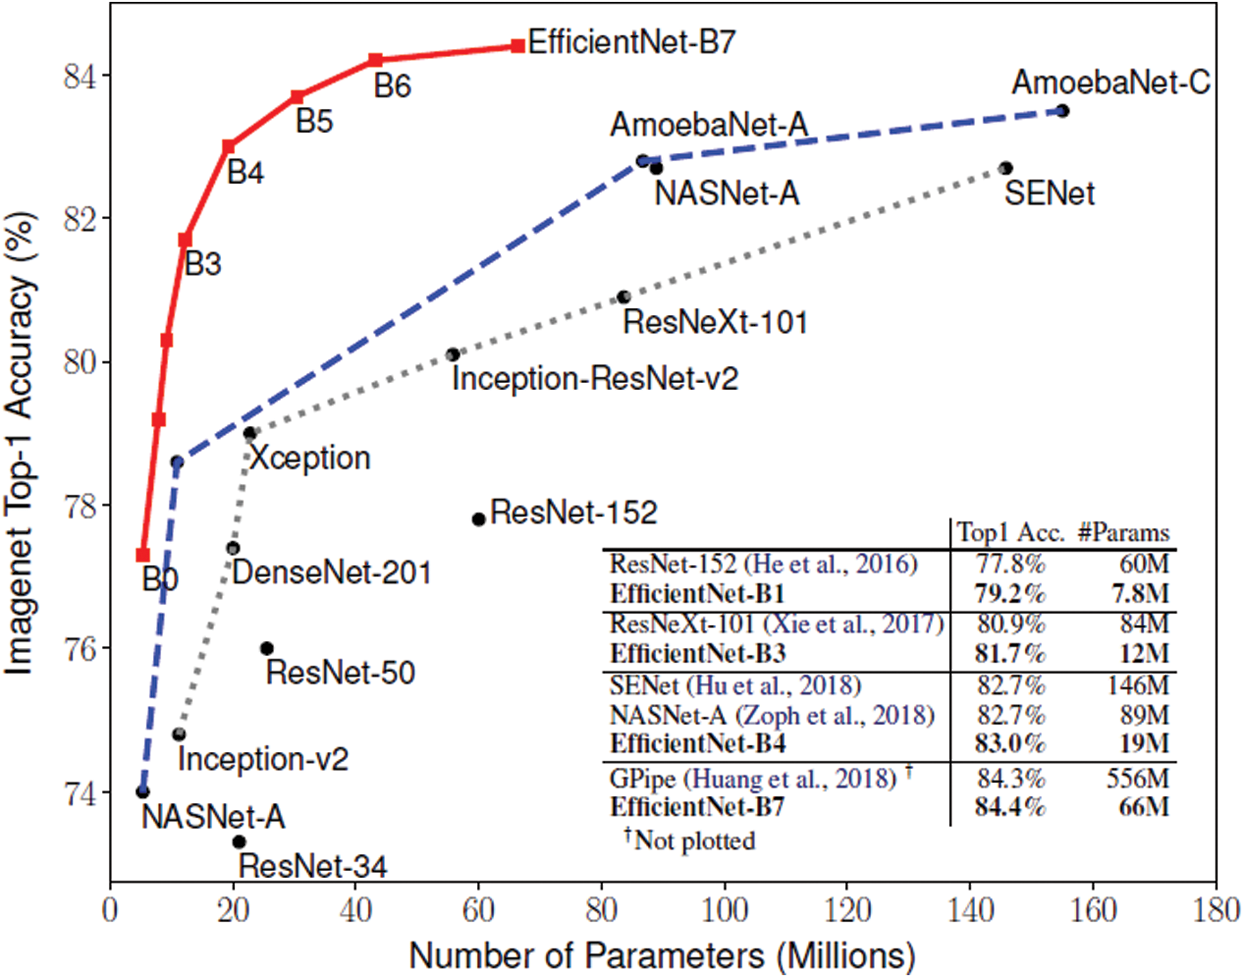
Figure 3: Comparison between EfficientNets and other CNNs [38]
2.2 Multi-Scale Feature Map Extraction
To extract feature maps with different spatial scales representing different levels of abstraction, we use EfficientNet as the backbone, as presented in Fig. 2. The multi-scale feature maps generate dense features, which enable the detection of the relations between the spaced pixels apart. Such dense features can be used to represent objects of the COVID-19 findings in the input CT scan images. These CT findings include bilateral and peripheral ground-glass and consolidative pulmonary opacities [4], which are dependent on the infection time course, thus, they may differ in shape, size, and frequency.
We extract four feature maps, whose spatial scales are  ,
,  ,
,  , and
, and  . Therefore, these feature maps can effectively represent COVID-19 findings with different sizes in the CT scan images.
To generate multi-scale feature maps, we apply atrous convolution at different rates. Atrous convolution, also known as dilated convolution, is very useful for generating output in a large field. Thus, it can keep the regulation of feature map. It also allows the repurposing of ImageNet pre-trained networks to extract denser feature maps by removing the downsampling operations from the last few layers and upsampling the corresponding filter kernels, which is equivalent to inserting holes (“trous” in French) between filter weights. Using atrous convolution enables one to control the resolution at which feature responses are computed within the CNNs without the requirement of learning extra parameters. Atrous convolution can be expressed by (1):

where y[m, n] denotes the output of atrous convolution, whereas the input is x[m, n]; w, the kernel filter with length j; and r, the rate corresponding to the stride with which the input signal is sampled. Fig. 4 presents atrous convolution on an image with  kernel at rates of 1, 2, and 3.
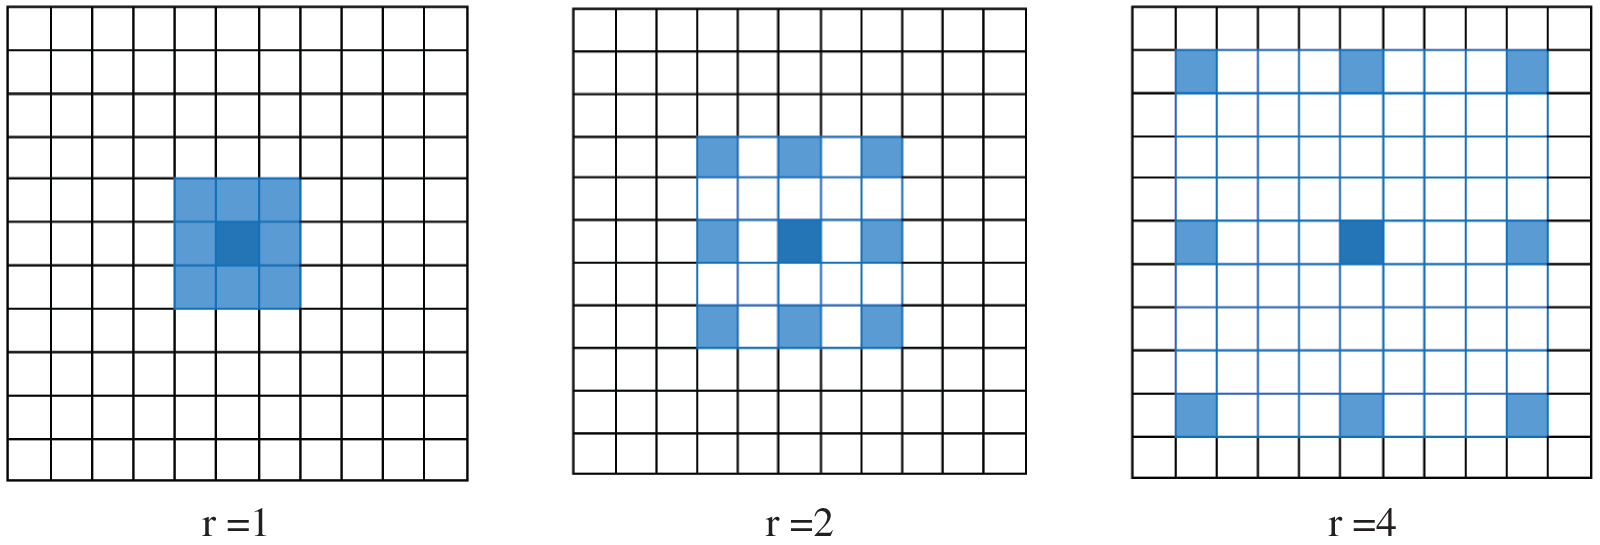
Figure 4: 2D atrous convolution with a kernel size of  over an image at rates of 1, 2, and 4. The blue pixels indicate the target pixels involved in the convolution. As the rate increases, a bigger receptive field is considered
We apply atrous convolution at different rates to the different feature maps, with rates of 24, 16, and 8 on the first three features. Conversely, we apply normal convolution to the fourth feature, as presented in Fig. 2.
The application of atrous convolution to the four multi-scale feature maps resulted in the generation of four feature maps with the same dimensions (i.e.,  ) according to (2). At this level, we apply batch normalization (BN) and activation (i.e., Swish) to the features, which help improve the performance.
The features obtained from the multi-scale feature map extractor are fused using a weighted average fusion operator. In this study, we use a fast normalized fusion technique proposed by [39], which has a performance comparable to that of the softmax-based fusion technique. It speeds up the performance by up to 30%. If we let  represent the resultant feature from the scale si (i.e.,
  ), then the output feature maps after applying atrous convolution on each of these feature maps is given by (2):

The weighted average fusion  can be expressed by (3):

where wi denotes a learnable weight corresponding to the feature  that satisfies
  by applying the rectified linear activation function (Relu), and
  is a constant with a small value that helps avoid numerical instability.
2.4 Classification Module and Network Optimization
The classification module takes the output of the global average pooling (GAP) layer and sigmoid layer and uses binary cross-entropy loss function. The loss function is composed of the loss function of the original data and adversarial examples.
If we define the network predicted output as  , then the distribution of these outputs follow a Bernoulli distribution. The determination of the parameters
  of the network can be performed by maximizing the following likelihood function:

which is equivalent to minimizing the following log-likelihood function:

where  , are the parameters of the network. Usually, the loss function in (5) is called a cross-entropy loss function. To optimize this loss, the Adam optimization algorithm is employed in this work.
Due to the scarcity of the radiology datasets used for the analysis of COVID-19, several studies have employed data augmentation techniques, such as generative adversarial network (GAN), which is one of the recent techniques that has proven its superiority in computer vision. GAN is employed in several works, such as [40,41], to increase the COVID-19 datasets for CXR images. Mobiny et al. [42] employed a data augmentation technique that is based on conditional generative adversarial networks (CGAN) to increase the CT scan image dataset. Xie et al. [43] proposed AdvProp to increase the limited datasets, which help prevent overfitting in image classification models. In our proposed architecture, we apply this technique to improve the accuracy of COVID-19 detection using CT scan images.
AdvProp is based on training the network by generating adversarial examples. These examples are generally used to fake networks. However, they have also been shown to improve the performances of classification models [43]. Since the adversarial examples belong to distribution which is different from the distribution of the original (clean) examples, separate auxiliary batch norm layers are used to train the network by generating these adversarial examples, whereas the original examples are trained through the traditional BN layers. The objective function of traditional models expressed in (5) in which no adversarial examples are considered can be written as follows:

where D denotes the distribution of the training data;  , the loss function;
  , the parameters of the network; and x, the training example with the label y.
When using adversarial images as additional training examples combined with the original training images for training the network, this objective function is expressed as in (5).

where  ; here,
  denotes an adversarial perturbation, and S denotes the perturbation range, in which the adversarial image is generated by adding a perturbation to an original image, i.e.,
  . To overcome the problem on performance degradation, which results from training the network using the new objective function presented in (7) due to the different distributions of the original and adversarial images, AdvProp proposed the use of auxiliary BN layers, as presented in Fig. 5.
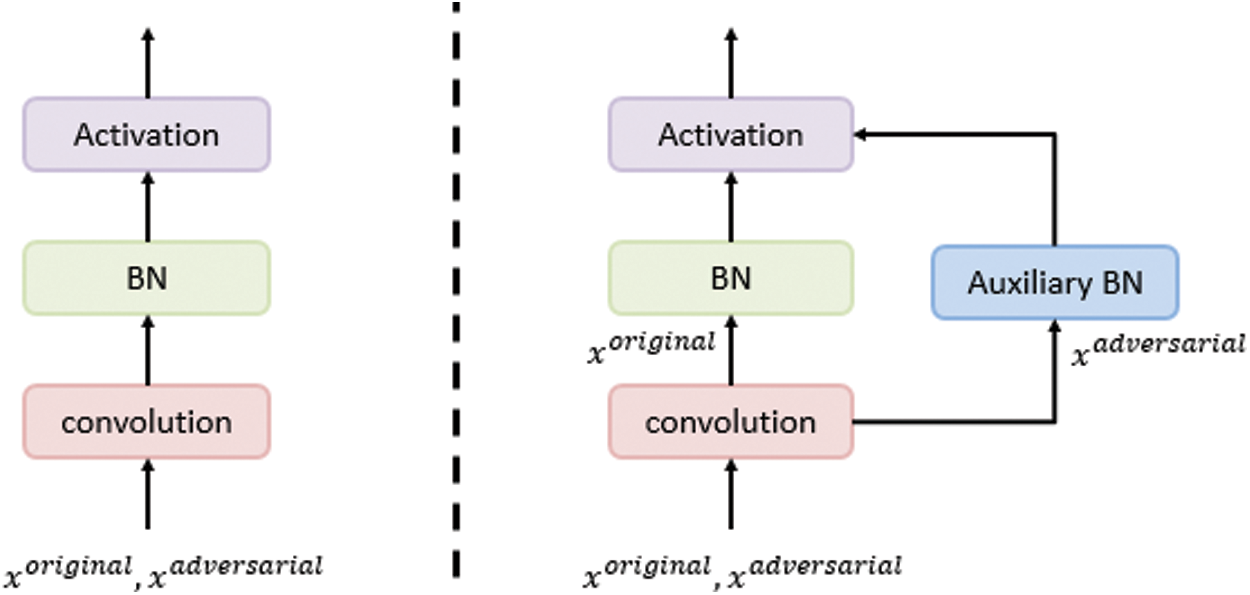
Figure 5: The use of an auxiliary BN layer for the adversarial examples training, whereas the traditional BN layer is used for the original images training. This auxiliary layer is used only while training [43]
For each training batch, AdvProp randomly selects an original image xo with the label y and generates a corresponding adversarial image xa. Then, the loss functions are calculated for the original and adversarial images; the original loss is calculated using the main BNs, whereas the adversarial loss is calculated using the auxiliary BN layers, as presented in Fig. 5. Finally, the network parameters are updated to minimize the total loss, as presented in (5).
In this section, the dataset used in the experiments and the metrics used to evaluate the performance of the proposed model are described. Moreover, the procedure we followed to conduct the different experiments in this study are also discussed.
Due to the rapid spread of COVID-19 and the need for a rapid response to this disease, several CT datasets were utilized by deep learning-based applications to analyze and detect COVID-19. However, there is scarcity of publicly available datasets, such as the SARS-CoV-2 CT scan dataset proposed by Soares et al. [19], which is used in this study to evaluate the proposed model. SARS-CoV-2 CT scan dataset is one of the widely publicly available datasets. This was obtained from the hospitals in Sao Paulo, Brazil [19]. Moreover, this dataset is composed of 2482 CT scan images (1252 CT scan images of 60 COVID-19 patients and 1230 CT scan images of 60 non-COVID-19 patients). The detailed characteristic of each patient has been omitted by the hospitals due to ethical concerns. Fig. 6 presents some examples of the CT scan images of COVID-19 and non-COVID-19 patients, which compose the dataset.
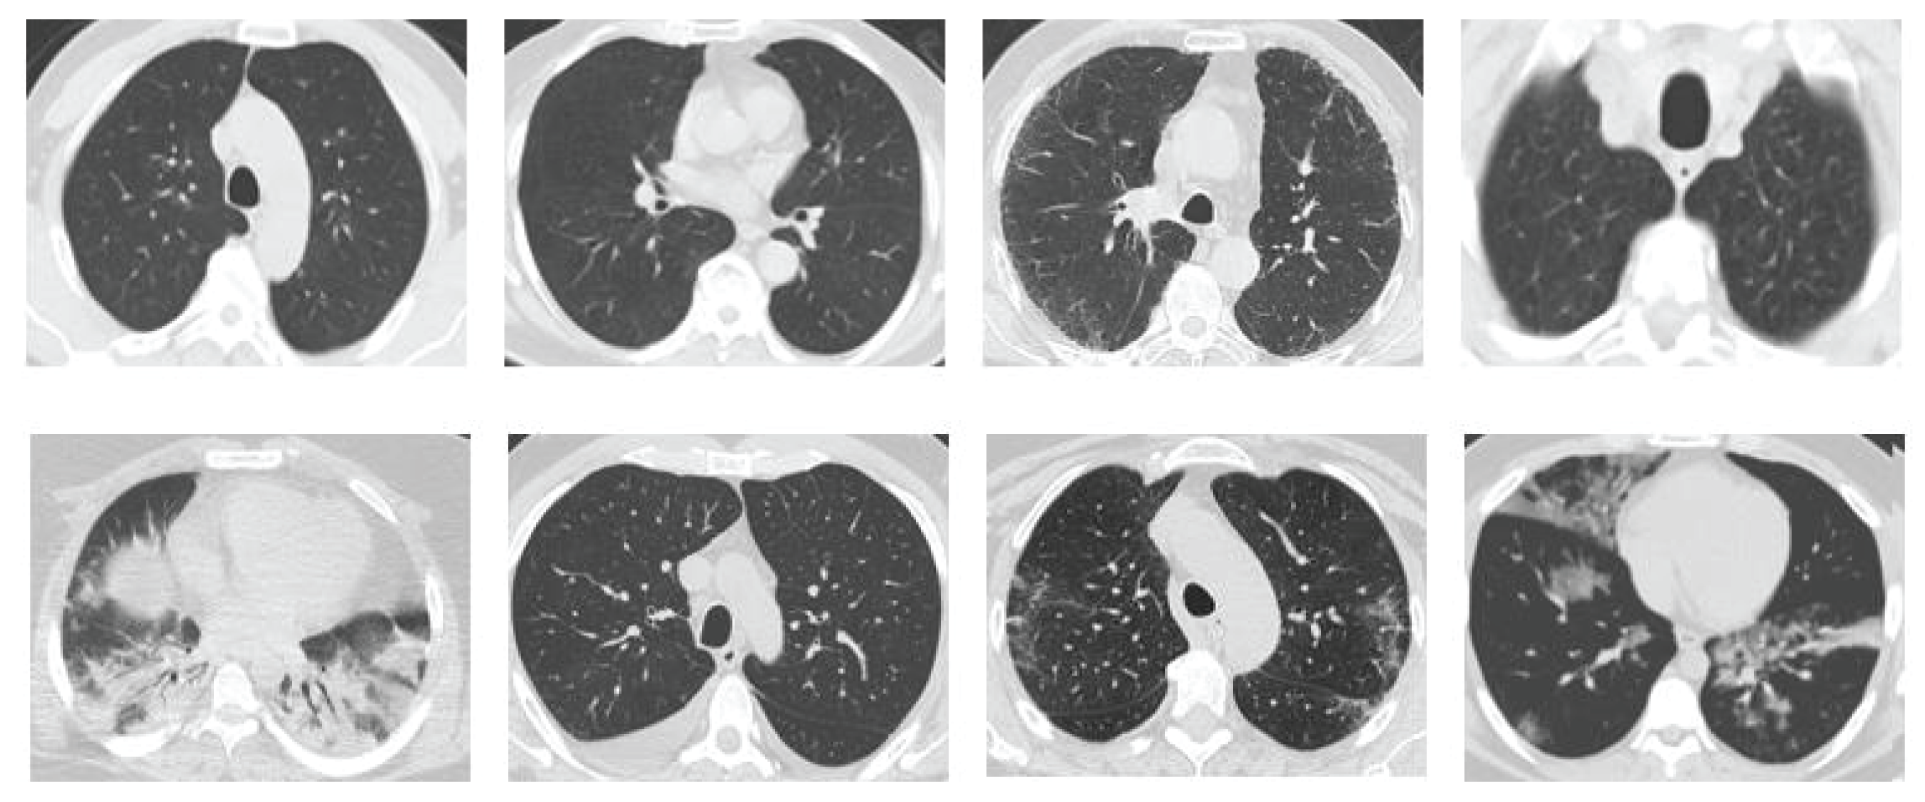
Figure 6: Sample images from the CT dataset. The images in the first row are those of non-COVID-19 patients, whereas the images in the second row are those of COVID-19 patients
To evaluate the performance of our proposed system, we reported numerous performance metrics, which enabled us to compare our model with those of the previous works and to be consistent with the evaluation procedures of such medical diagnostic systems [44]. Therefore, our results were reported in terms of accuracy, precision, recall, and F-measure (F1 score), which are expressed in Eqs. (8)–(11):


where these metrics are calculated based on the confusion matrix, as presented in Tab. 1, and where TP and TN denote true positive and true negative, respectively, and FP and FN denote false positive and false negative, respectively.
Table 1: Confusion matrix. The rows represent the numbers of actual classes, whereas the columns represent the numbers of the predicted classes

Accuracy is one of the main metrics to analyze the performance of the classification problems. It is calculated by dividing the number of images (TP and TN) correctly classified from the two classes by the total number of the images, as expressed by (8). Precision and recall are two additional metrics that facilitate in evaluating the classification problems. Precision (also known as positive prediction) determines how many of the predictions are correct. It is calculated by dividing the number of correctly classified COVID-19 images (TP) by the number of the total predicted positive (TP and FP) cases, as expressed by (9). Conversely, recall (also known as sensitivity) is calculated by dividing the number of correctly classified positive cases by the total number of all actual positive (TP and FN) cases, as expressed by (10). The recall metric determines the ability of a system to recognize patients infected with the virus [44]. Thus, it indicates the performance of the system in case there is a high cost accompanying the false evaluation of infected patients as non-infected patients, i.e., false-negative predictions. Therefore, recall can be considered as one of the most important metrics in the case of pandemics, such as COVID-19.
F-measure or F1 score is a well-known metric in the classification problems. It is considered as a balance between precision and recall and is obtained by calculating the weighted harmonic mean of both precision and recall, as presented in (11).
We conducted several experiments, with each experiment repeated for five rounds. The average and detailed values of the results are also reported and discussed. First, we reported the results of our proposed model under a realistic scenario to split the dataset, in which only 20% of the available data was used for training. Then, we simulated the scenarios of the state-of-the-art works, some of which used 80% and others 60% of the dataset for training.
Our proposed system and experiments were implemented under Keras built on the top of TensorFlow, where we used the Adam optimization algorithm to train the network. The experiments were conducted using a workstation with i9 CPU@2.9 GHz, 32 GB of RAM, and NVIDIA GeForce GTX 1080 Ti (11 GB GDDR5X).
In this section, the results of the experiments are presented and discussed to evaluate the proposed system. We reported the results based on the aforementioned performance metrics. First, we presented an example from the input CT scan image through the different stages of the system, i.e., generation of perturbation and adversarial example, as presented in Fig. 7, and some of the activation maps, as presented in Fig. 8.
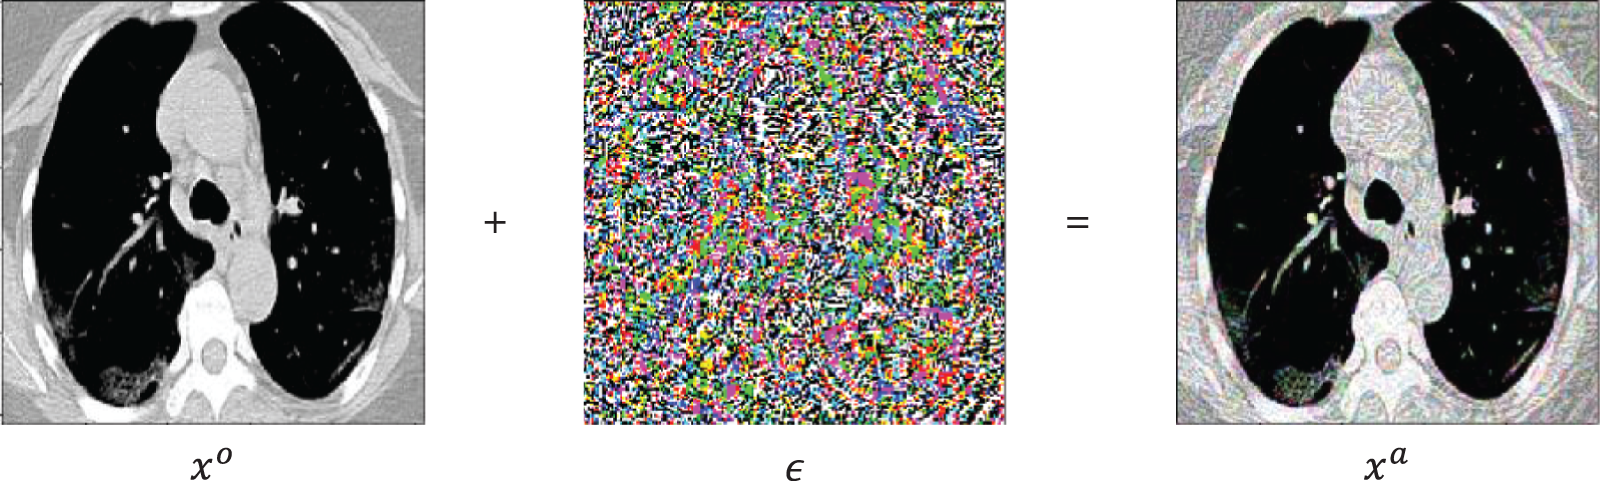
Figure 7: A random sample obtained from the dataset demonstrating that the addition of a perturbation  in an original image
  results an adversarial image
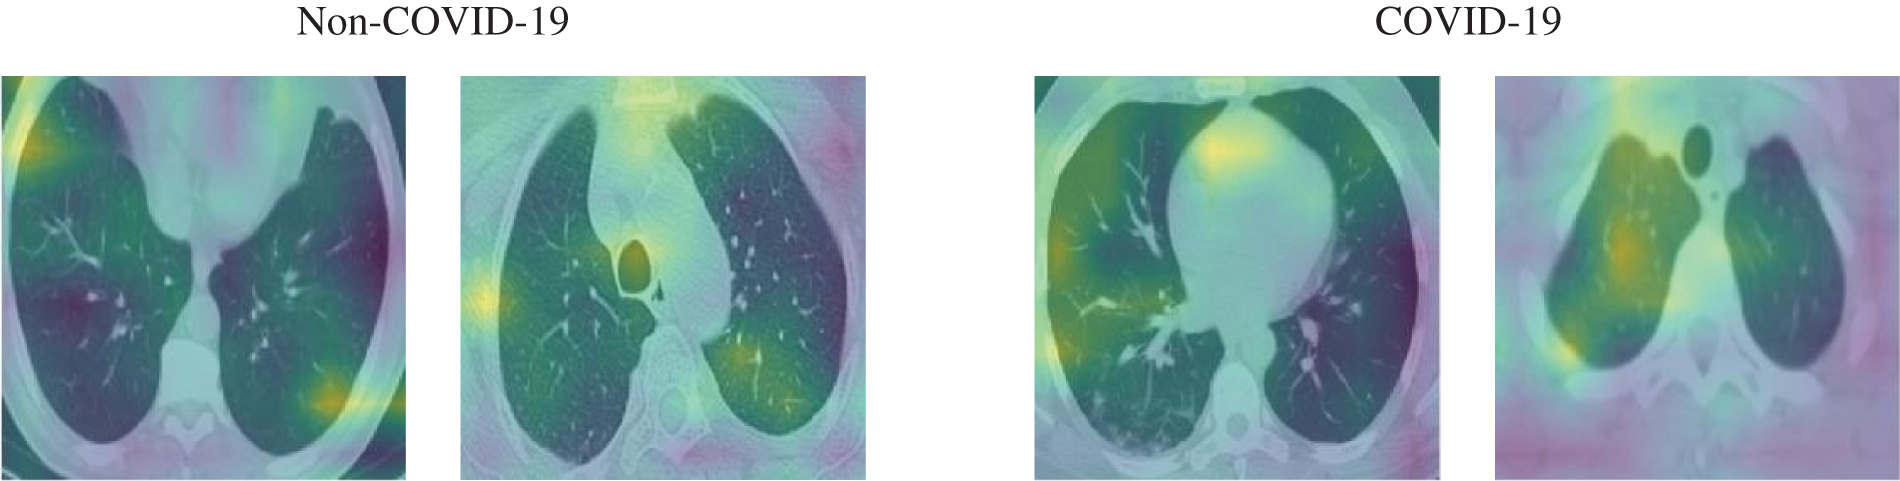
Figure 8: Samples of the activation maps of both COVID-19 and non-COVID-19
We split the CT scan dataset into training and testing sets, where we used 200 samples for the COVID-19 class and 200 samples for the nonCOVID-19 class for the training (corresponding to 20% of the dataset), whereas the 80% were kept as test. For the data augmentation, we apply adversarial examples with  .
.
Fig. 9 presents the detailed results of the five rounds in terms of the confusion matrices.
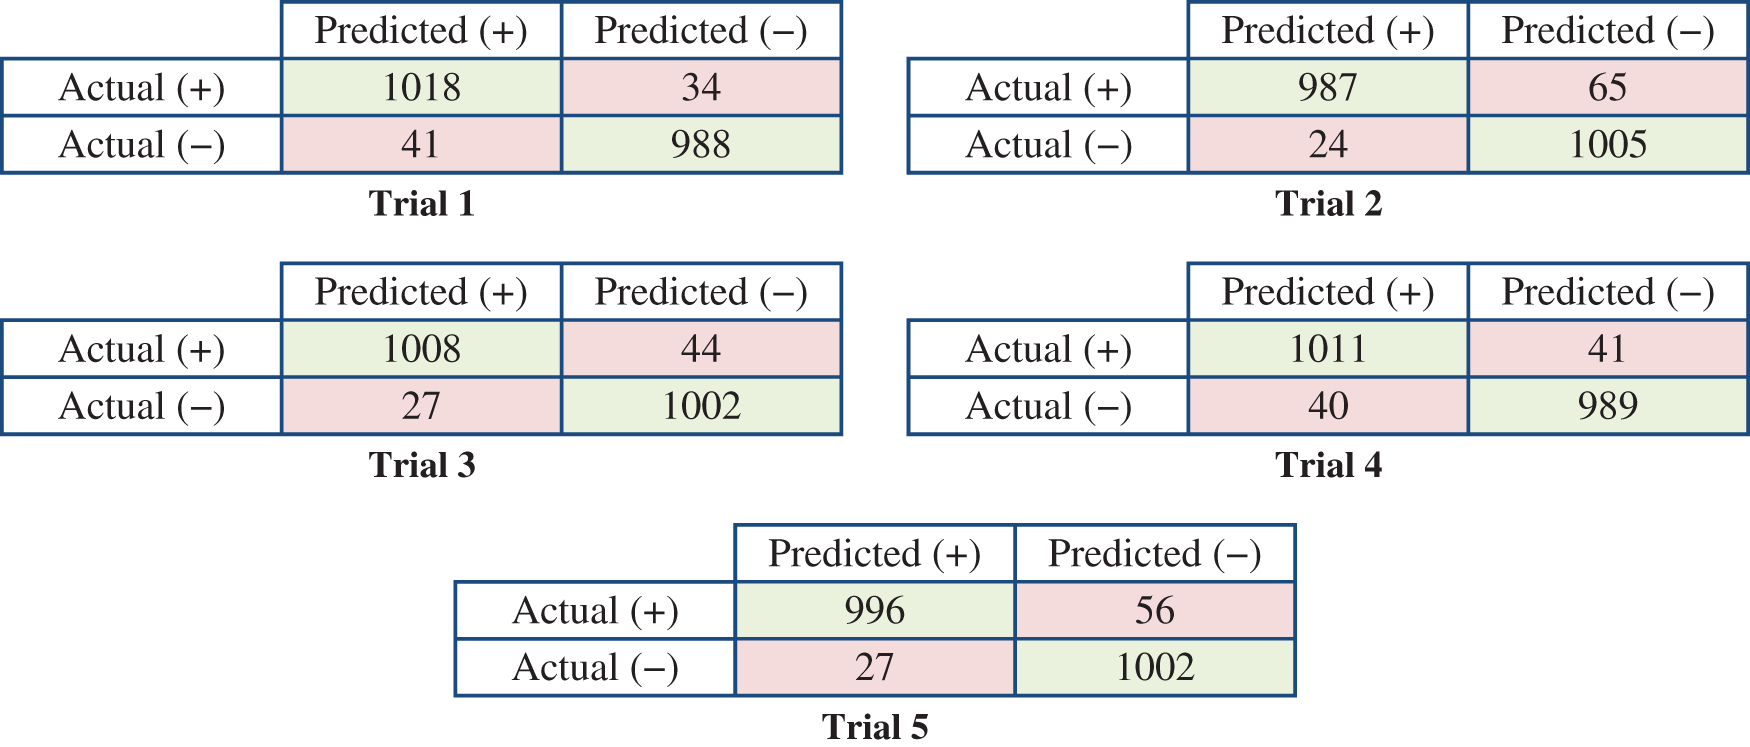
Figure 9: Confusion matrices of the five trials based on the splitting ratio (20:80) of the training and testing
The performance metric values were calculated, and the results are presented in Tab. 2.
Table 2: Performance metrics for the five trials with the average values and standard deviation. The splitting ratio of the training and testing is 20:80
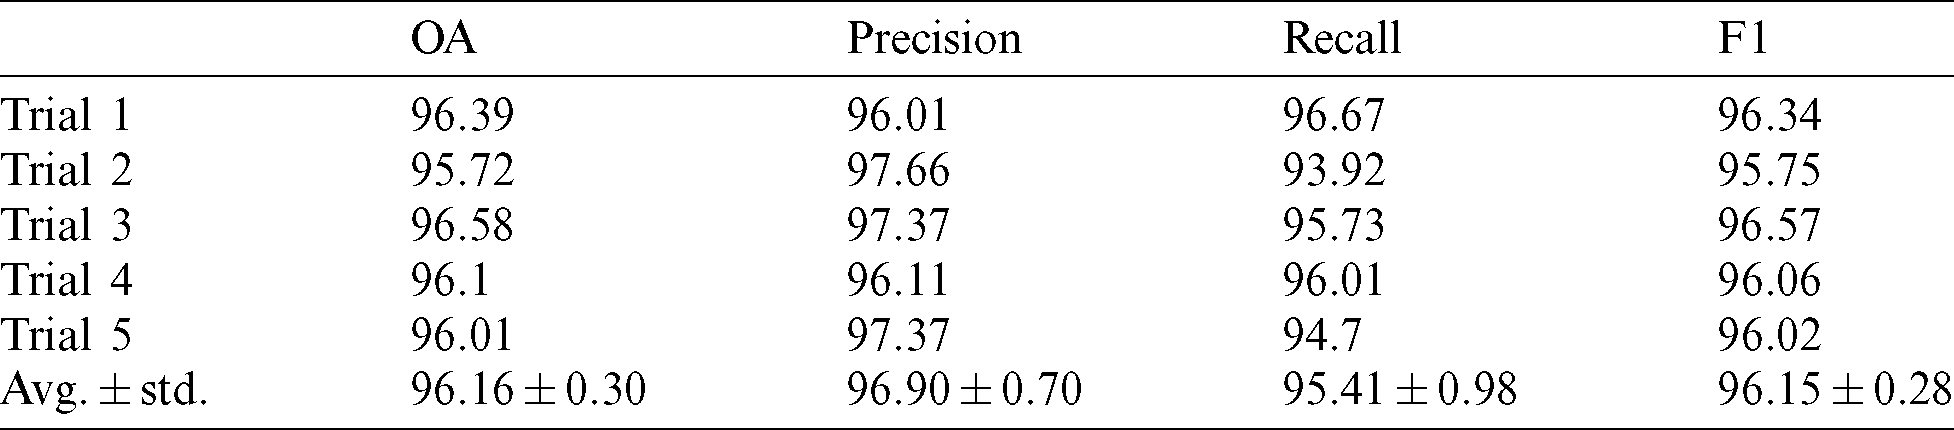
Tab. 2 demonstrates that the proposed network exhibits high performance, with an average overall accuracy of 96.16%, recall of 95.41%, precision of 96.90%, and F1 of 96.15%.
The results presented in Tab. 2 were calculated under a scenario that simulates the real scenario: There is a small amount of data for the training of the diagnosis system; therefore, we trained and evaluated the system using 20% and 80% of the dataset, respectively. However, to compare the proposed system with those of the other works, different splitting ratios need to be considered, as presented in Tabs. 3 and 4.
Table 3: Performance metrics for the five trials with the average values and standard deviation. The splitting ratio of the training and testing is 60:40

Table 4: Performance metrics for the five trials with the average values and standard deviation. The splitting ratio of the training and testing is 80:20

In Tab. 3, we reported the results of the performance metrics by splitting the data into training (60%) and testing (40%), according to the protocol followed by [22].
In Tab. 4, we reported the results of the performance metrics by splitting the data into training (80%) and testing (20%), according to the protocol followed by several works, such as [15,19,20,23].
Fig. 10 presents the effect of decreasing the ratio of the training portion to the test portion on the performance of the trained model.
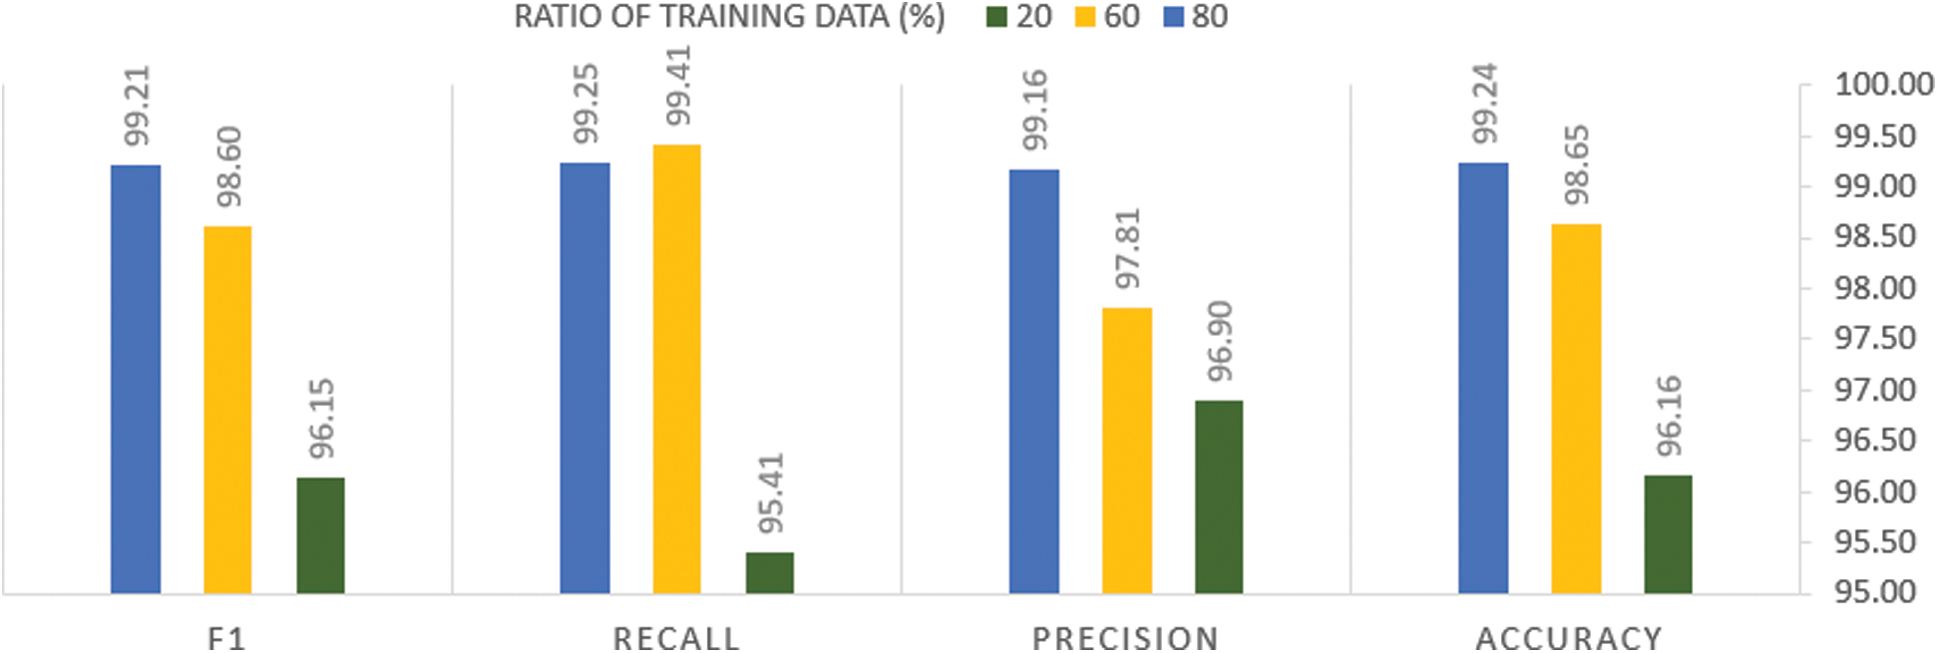
Figure 10: Analysis of the performance metrics of the proposed method among different splitting ratios of the training data
From Fig. 10, it can be seen that decreasing the splitting portion of the training examples leads to the performance degradation of the proposed system in terms of all the evaluation metrics. Although such degradation prompts us to increase the training datasets, it is impossible during this time of COVID-19 pandemic, as no sufficient data is available for training the systems. However, the reported evaluation metric values of our system indicate that it is still robust, although a small portion of the examples are used for the training.
Fig. 11 presents the loss function of the training process of the proposed model. From the figure, it can be clearly seen that our proposed model does not require long training, fifty epochs are more than enough to train the model and ensure high performance.
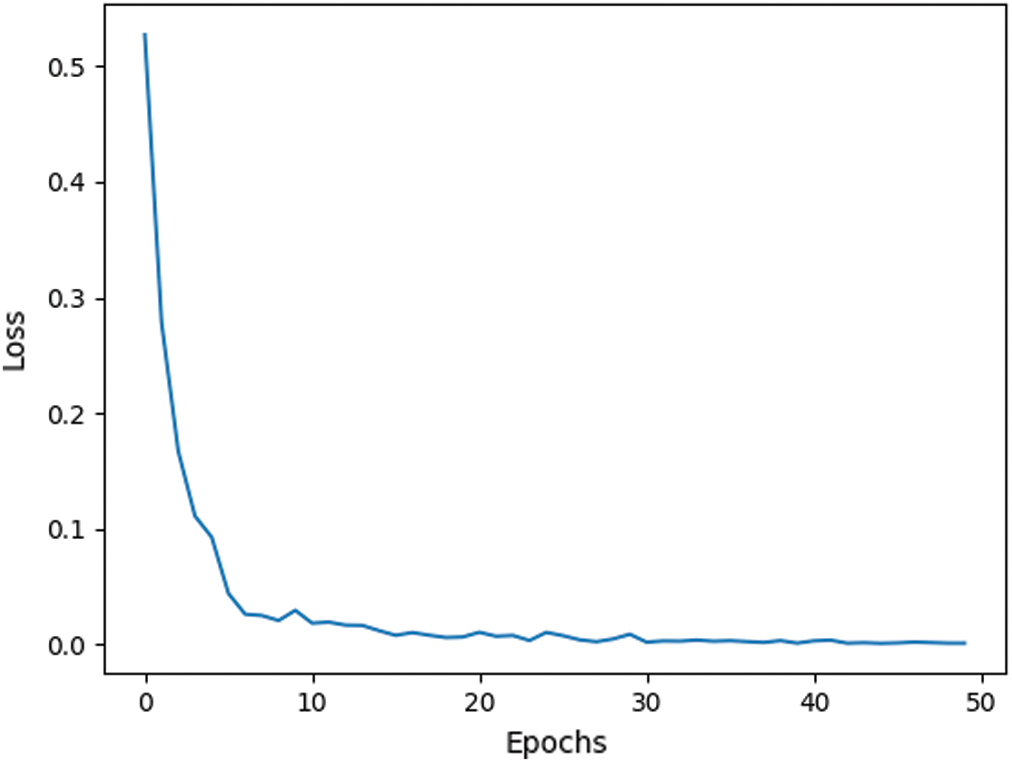
Figure 11: Loss function of the proposed network
4.1 Comparison with the State-of-the-Art Works
In this section, the performance of our proposed model is compared with those of the state-of-the-art works using the same dataset, i.e., SARS-CoV-2 CT scan dataset. These works reported different evaluation metric values according to different splitting ratios; thus, we reported our results according to the same evaluation metrics and splitting ratios as presented in Tab. 5.
Table 5: Comparison with the state-of-the-art works using the SARS-CoV-2 CT scan dataset. The reported result of our proposed model is the average of five trials

Tab. 5 demonstrates that the proposed model achieves significantly higher accuracy compared with the competitive models, regardless of the splitting ratio. The proposed model outperforms the competitive models with an accuracy of 99.24% and 98.68% with splitting ratios of 80:20 and 60:40, respectively. Similarly, for the other metrics, i.e., precision, recall, and F1, our model outperforms the competitive models.
From Tab. 5, it can be seen that training our system using only 20% of the dataset yields an accuracy of 96.16% and recall of 95.41%. These values are comparable to those of the other models that were trained using 60% or 80% of the dataset. This result ensures the robustness of our system, even with the limited amount of data for training.
In this study, we proposed a deep learning-based framework for the detection of coronavirus disease 2019 using computed tomography (CT) scan images. EfficientNet architecture was used as the backbone to extract multi-scale feature maps from the input CT scan images. Moreover, we employed atrous convolution at different rates to generate denser features from multi-scale feature maps. To augment the dataset, we performed the adversarial examples generation, which clearly improved the performance. The classification results revealed that our proposed framework achieves better performance and provides faster results compared with the routine real-time reverse transcription-polymerase chain reaction test. Furthermore, it outperforms the state-of-the-art deep learning techniques. The proposed framework also exhibits a robust behavior toward the low of the training data. The application of the framework can be extended to multimodal medical images in the future.
Acknowledgement: The authors extend their appreciation to the Deanship of Scientific Research at King Saud University for funding this work through Research Group No. (RG-1435-050).
Funding Statement: The financial support provided from the Deanship of Scientific Research at King Saud University through the, Research Group No. (RG-1435-050.)
Conflicts of Interest: The authors declare that they have no conflicts of interest to report regarding the present study.
1. Scientific Animations, “3D medical animation still shot showing the structure of a coronavirus,” Scientific Animations. [Online]. Available: https://www.scientificanimations.com/coronavirus-symptoms-and-prevention-explained-through-medical-animation/. [Google Scholar]
2. World Health Organization (WHO). (2020). “COVID-19 situation reports,” . [Online]. Available: https://www.who.int/emergencies/diseases/novel-coronavirus-2019/situation-reports. [Google Scholar]
3. C. Long, H. Xu, Q. Shen, X. Zhang, B. Fan et al. (2020). , “Diagnosis of the Coronavirus disease (COVID-19RRT-PCR or CT?,” European Journal of Radiology, vol. 126, 108961. [Google Scholar]
4. A. Bernheim, X. Mei, M. Huang, Y. Yang, Z. A. Fayad et al. (2020). , “Chest CT Findings in coronavirus disease-19 (COVID-19Relationship to duration of infection,” Radiology, vol. 295, no. 3, 200463. [Google Scholar]
5. Y. Fang, H. Zhang, J. Xie, M. Lin, L. Ying et al. (2020). , “Sensitivity of chest CT for COVID-19: Comparison to RT-PCR,” Radiology, vol. 296, no. 2, pp. E115–E117. [Google Scholar]
6. T. Ai, Z. Yang, H. Hou, C. Zhan, C. Chen et al. (2020). , “Correlation of chest CT and RT-PCR testing in coronavirus disease 2019 (COVID-19) in China: A report of 1014 cases,” Radiology, vol. 296, no. 2, pp. E32–E40. [Google Scholar]
7. K. Chatfield, K. Simonyan, A. Vedaldi and A. Zisserman. (2014). “Return of the devil in the details: Delving deep into convolutional nets. in Proc. British Machine Vision Conf. BMVA Press. [Google Scholar]
8. K. Simonyan and A. Zisserman. (2014). “Very deep convolutional networks for large-scale image recognition, Arxiv:1409.1556. [Google Scholar]
9. D. Shen, G. Wu and H. I. Suk. (2017). “Deep learning in medical image analysis,” Annual Review of Biomedical Engineering, vol. 19, no. 1, pp. 221–248. [Google Scholar]
10. G. Litjens, T. Kooi, B. E. Bejnordi, A. A. A. Setio, F. Ciompi et al. (2017). , “A survey on deep learning in medical image analysis,” Medical Image Analysis, vol. 42, pp. 60–88. [Google Scholar]
11. S. Ying, S. Zheng, L. Li, X. Zhang, X. Zhang et al. (2020). , “Deep learning enables accurate diagnosis of novel coronavirus (COVID-19) with CT images,” Medrxiv. [Google Scholar]
12. S. Wang. (2020). B. Kang, J. Ma, X. Zeng, M. Xiao et al., “A deep learning algorithm using CT images to screen for Corona virus disease (COVID-19). ” MedRxiv. [Google Scholar]
13. C. Butt, J. Gill, D. Chun and B. A. Babu. (2020). “Deep learning system to screen coronavirus disease 2019 pneumonia,” Applied Intelligence, pp. 1–7. [Google Scholar]
14. X. Wang, X. Deng, Q. Fu, Q. Zhou, J. Feng et al. (2020). , “A weakly-supervised framework for COVID-19 classification and lesion localization from chest CT,” IEEE Transactions on Medical Imaging, vol. 39, no. 8, pp. 2615–2625. [Google Scholar]
15. H. Panwar, P. K. Gupta, M. K. Siddiqui, R. Morales-Menendez, P. Bhardwaj et al. (2020). , “A deep learning and grad-CAM based color visualization approach for fast detection of COVID-19 cases using chest X-ray and CT-Scan images,” Chaos, Solitons & Fractals, vol. 140, 110190. [Google Scholar]
16. L. Li. (2020). L. Qin, Z. Xu, Y. Yin, X. Wang et al., “Using artificial intelligence to detect COVID-19 and community-acquired pneumonia based on pulmonary CT: Evaluation of the diagnostic accuracy,” Radiology, 296, no. 2, pp. E65–E71. [Google Scholar]
17. J. Chen, L. Wu, J. Zhang, L. Zhang, D. Gong et al. (2020). , “Deep learning-based model for detecting 2019 novel coronavirus pneumonia on high-resolution computed tomography: A prospective study,” MedRxiv, vol. 91, no. 10210, pp. 264. [Google Scholar]
18. X. Chen, L. Yao and Y. Zhang. (2020). “Residual attention u-net for automated multi-class segmentation of COVID-19 chest CT images,” ArXiv200405645 Cs Eess Q-Bio, . [Online]. Available: http://arxiv.org/abs/2004.05645. [Google Scholar]
19. E. Soares, P. Angelov, S. Biaso, M. H. Froes and D. K. Abe. (2020). “SARS-CoV-2 CT-scan dataset: A large dataset of real patients CT scans for SARS-CoV-2 identification,” MedRxiv, vol. 395, no. 10223, pp. 497. [Google Scholar]
20. P. Silva, E. Luz, G. Silva, G. Moreira, R. Silva et al. (2020). , “COVID-19 detection in CT images with deep learning: A voting-based scheme and cross-datasets analysis,” Informatics in Medicine Unlocked, vol. 20, 100427. [Google Scholar]
21. L. Liang, L. Ma, L. Qian and J. Chen. (2020). “An Algorithm to attack neural network encoder-based out-of-distribution sample detector,” ArXiv200908016 Cs Eess, . [Online]. Available: http://arxiv.org/abs/2009.08016. [Google Scholar]
22. Y. Pathak, P. K. Shukla and K. V. Arya. (2020). “Deep bidirectional classification model for COVID-19 disease infected patients,” IEEE/ACM Transactions on Computational Biology and Bioinformatics, pp. 1. [Google Scholar]
23. Z. Wang, Q. Liu and Q. Dou. (2020). “Contrastive cross-site learning with redesigned net for COVID-19 CT classification,” IEEE Journal of Biomedical and Health Informatics, pp. 1. [Google Scholar]
24. X. Li, C. Li and D. Zhu. (2020). “COVID-MobileXpert: On-device COVID-19 screening using snapshots of chest X-Ray,” ArXiv200403042 Cs Eess, . [Online]. Available: http://arxiv.org/abs/2004.03042. [Google Scholar]
25. L. Wang and A. Wong. (2020). “COVID-Net: A tailored deep convolutional neural network design for detection of COVID-19 cases from chest X-Ray images,” . [Online]. Available: https://arxiv.org/abs/2003.09871v4. [Google Scholar]
26. E. E.-D. Hemdan, M. A. Shouman and M. E. Karar. (2020). “Covidx-net: A framework of deep learning classifiers to diagnose covid-19 in X-ray images,” Arxiv: 2003.11055. [Google Scholar]
27. I. D. Apostolopoulos and T. A. Mpesiana. (2020). “COVID-19: Automatic detection from X-ray images utilizing transfer learning with convolutional neural networks,” Physical and Engineering Sciences in Medicine, 43, no. 2, pp. 635–640. [Google Scholar]
28. P. K. Sethy, S. K. Behera, P. K. Ratha and P. Biswas. (2020). “Detection of coronavirus disease (COVID-19) based on deep features and support vector machine,” . [Online]. Available: https://www.preprints.org/manuscript/202003.0300/v2. [Google Scholar]
29. A. Narin, C. Kaya and Z. Pamuk. (2020). “Automatic detection of coronavirus disease (COVID-19) using X-ray images and deep convolutional neural networks,” , Arxiv: 2003:10849. [Google Scholar]
30. P. Afshar, S. Heidarian, F. Naderkhani, A. Oikonomou, K. N. Plataniotis et al. (2020). , “COVID-CAPS: A Capsule Network-based Framework for identification of COVID-19 cases from X-ray images,” . [Online]. Available: http://arxiv.org/abs/2004.02696. [Google Scholar]
31. M. Farooq and A. Hafeez. (2020). “Covid-resnet: A deep learning framework for screening of covid19 from radiographs, , Arxiv: 2003:14395. [Google Scholar]
32. M. E. H. Chowdhury. (2020). T. Rahman, A. Khandakar, R. Mazhar, M. A. Kadir et al., “Can AI help in screening viral and COVID-19 pneumonia?” IEEE Access, 8, pp. 132665–132676. [Google Scholar]
33. F. Ucar and D. Korkmaz. (2020). “COVIDiagnosis-Net: Deep Bayes-SqueezeNet based diagnosis of the coronavirus disease 2019 (COVID-19) from X-ray images,” Medical Hypotheses, vol. 140, pp. 109761. [Google Scholar]
34. K. He, X. Zhang, S. Ren and J. Sun. (2016). “Deep residual learning for image recognition,” Proceedings of the IEEE Conference on Computer Vision and Pattern Recognition (CVPR), pp. 770–778. [Google Scholar]
35. M. Barstugan, U. Ozkaya and S. Ozturk. (2020). “Coronavirus (COVID-19) Classification using CT Images by Machine Learning Methods,” ArXiv200309424 Cs Eess Stat, . [Online]. Available: http://arxiv.org/abs/2003.09424. [Google Scholar]
36. S.-I. S. O. M. A. I. Radiology, COVID-19 Database, 2020. [Online]. Available: https://www.sirm.org/category/senza-categoria/covid-19/. [Google Scholar]
37. M. Tan and Q. V. Le. (2019). “EfficientNet: Rethinking model scaling for convolutional neural networks,” ArXiv190511946 Cs Stat, . [Online]. Available: http://arxiv.org/abs/1905.11946. [Google Scholar]
38. M. Tan and Q. V. Le. (2019). “EfficientNet: Rethinking model scaling for convolutional neural networks,” ArXiv190511946 Cs Stat, . [Online]. Available: http://arxiv.org/abs/1905.11946. [Google Scholar]
39. M. Tan, R. Pang and Q. V. Le. (2020). “EfficientDet: Scalable and efficient object detection,” ArXiv191109070 Cs Eess, . [Online]. Available: http://arxiv.org/abs/1911.09070. [Google Scholar]
40. N. E. M. Khalifa, M. H. N. Taha, A. E. Hassanien and S. Elghamrawy. (2020). “Detection of Coronavirus (COVID-19) associated pneumonia based on generative adversarial networks and a fine-tuned deep transfer learning model using chest X-ray dataset,” ArXiv200401184 Cs Eess, . [Online]. Available: http://arxiv.org/abs/2004.01184. [Google Scholar]
41. M. Loey, F. Smarandache and N. E. M. Khalifa. (2020). “Within the lack of chest COVID-19 X-ray dataset: A novel detection model based on GAN and deep transfer learning,” Symmetry, vol. 12, no. 4, pp. 651. [Google Scholar]
42. A. Mobiny. (2020). P. A. Cicalese, S. Zare, P. Yuan, M. Abavisani et al. “Radiologist-level COVID-19 detection Using CT scans with detail-oriented capsule networks,” Arxiv: 2004.07407. [Google Scholar]
43. C. Xie, M. Tan, B. Gong, J. Wang, A. L. Yuille et al. (2020). , “Adversarial examples improve image recognition,” pp. 819–828, . [Online]. Available: http://openaccess.thecvf.com/content_CVPR_2020,/html/Xie_Adversarial_Examples_Improve_Image_Recognition_CVPR_2020_paper.html. [Google Scholar]
44. A. M. Šimundić. (2009). “Measures of diagnostic accuracy: Basic definitions,” EJIFCC, vol. 19, no. 4, pp. 203–211. [Google Scholar]
 | This work is licensed under a Creative Commons Attribution 4.0 International License, which permits unrestricted use, distribution, and reproduction in any medium, provided the original work is properly cited. |