DOI:10.32604/cmc.2021.014931
| Computers, Materials & Continua DOI:10.32604/cmc.2021.014931 | |
| Article |
Image-Based Lifelogging: User Emotion Perspective
1College of Computing, Sungkyunkwan University, Suwon, 16417, Korea
2School of Computing, KAIST, Daejeon, 34141, Korea
*Corresponding Author: Joyce Jiyoung Whang. Email: jjwhang@kaist.ac.kr
Received: 28 October 2020; Accepted: 13 December 2020
Abstract: Lifelog is a digital record of an individual’s daily life. It collects, records, and archives a large amount of unstructured data; therefore, techniques are required to organize and summarize those data for easy retrieval. Lifelogging has been utilized for diverse applications including healthcare, self-tracking, and entertainment, among others. With regard to the image-based lifelogging, even though most users prefer to present photos with facial expressions that allow us to infer their emotions, there have been few studies on lifelogging techniques that focus upon users’ emotions. In this paper, we develop a system that extracts users’ own photos from their smartphones and configures their lifelogs with a focus on their emotions. We design an emotion classifier based on convolutional neural networks (CNN) to predict the users’ emotions. To train the model, we create a new dataset by collecting facial images from the CelebFaces Attributes (CelebA) dataset and labeling their facial emotion expressions, and by integrating parts of the Radboud Faces Database (RaFD). Our dataset consists of 4,715 high-resolution images. We propose Representative Emotional Data Extraction Scheme (REDES) to select representative photos based on inferring users’ emotions from their facial expressions. In addition, we develop a system that allows users to easily configure diaries for a special day and summaize their lifelogs. Our experimental results show that our method is able to effectively incorporate emotions into lifelog, allowing an enriched experience.
Keywords: Lifelog; facial expression; emotion; emotion classifier; transfer learning
Nowadays, people record their daily lives on smartphones thanks to the availability of devices with cameras and high-capacity memory cards. The proliferation of social media encourages the creation and sharing of more personal photos and videos. Users can now store and access their entire life through their smartphones [1]. As the number of photo collections preserved by individuals rapidly grows, it becomes more difficult to browse and retrieve among the unorganized collections. People often waste their time exploring vast numbers of photos trying to remember certain events or memorable moments; this accelerates the need to automatically organize large collections of personal media [2–4].
Different methods have been proposed for automatically collecting, archiving, and summarizing huge collections of lifelog data [5]. Structuring images into temporal segments (that is, separating them into events) facilitates image retrieval [6]. Metadata such as time and location are typically used to identify events in a photo collection and then key photos are selected within events. Lifelogging helps to increase the memory of elderly people and dementia patients by recording the events of their daily lives and allowing them to recall what they have seen and done [5,7]. Photo-sharing social-networking services have received increased attention in recent years; smartphones and wearable cameras combined with social media extend the scope of lifelogging.
Most users prefer photos with facial expressions in their photo collections. According to a recent study [8], human presence and facial expressions are key indicators of how appealing photos are. Google Photos or Apple’s iPhoto applications now automatically generate a summary based on people, places, and things. With the recent development of research on the visual-sentiment analysis, the sentiment-based recommender system and explanation interface have been studied [9]. However, few studies use emotional characteristics to select key photos (especially emotions in facial expressions such as surprise, joy, and sadness). Moreover, accurate analysis and interpretation of the emotion conveyed by human facial expressions remain a great challenge.
With the advent of deep neural networks, facial expression recognition systems have changed profoundly [10]. In particular, convolutional neural networks (CNN) have led to breakthroughs in image recognition, classification, and object tracking based on big datasets such as ImageNet [11], and are widely applied in various fields. Training a deep-learning model from scratch by collecting sufficient data is an expensive and time-consuming task. One recent alternative to this is transfer learning [12,13], whereby a new model is trained with pre-trained weights. Face recognition systems that used hand-crafted features such as histogram-oriented gradients (HOG) and Gabor filters have been moved to those using deep-learning features. Especially, CNN architectures have shown excellent results in the field of computer vision. Here, we exploit a new facial-emotion classifier based on CNN architectures.
In the present paper, we develop a lifelogging system that extracts photos from smartphones, analyzes the users’ emotions based on their faces, selects a set of representative images that show different emotions, and then outputs a summary in diary form. We also propose a selection technique that can improve emotional diversity and representativeness in a photo collection. Our main contribution is the creation of a new emotion dataset in high resolution and the development of an emotion classifier, and the use of emotion features to group images in a visual lifelog. The rest of this paper is organized as follows. Section 2 briefly reviews related studies. Section 3 explains the structure and processes of our image-based lifelogging system. Implementation and user experiments are presented in Section 4. Finally, future research directions are discussed in Section 5.
Lifelog research that collects and visualizes data using wearable cameras and sensors has received much attention in recent years [14–17]. Since high-end smartphones have become widely used by the public enabling lifelogs to be easily collected without requiring users to carry additional devices, various studies have been conducted on the use of smartphones as lifelogging platforms. UbiqLog is a lightweight and extendable lifelog framework that uses mobile phones as a lifelog tool through continuous sensing [18]. Gou et al. proposed a client-server system that uses a smartphone to manage and analyze personal biometric data [2]. To automatically organize large photo collections, a hierarchical photo organization method using topic-related categories has been proposed [4]. The method estimates latent topics in the photos by applying probabilistic latent semantic analysis and automatically assigning a name to each topic by relying on a lexical database.
Lifelogs must be summarized in a concise and meaningful manner because similar types of data are repeatedly accumulated. We focus on images from among the different kinds of lifelog data. The most relevant study was presented in [19], where emotion factors in lifelogs were used when selecting keyframes. A wearable biosensor was used to measure emotions quantitatively through the physiological response of skin conductance. Assuming that the most important and memorable moments in life involve emotional connections among human beings, they collectively evaluated the image quality and emotional criteria for keyframe selection. The important moments that individuals want to remember are highly subjective, making it difficult to achieve satisfactory results using uniform objective criteria. Even though it is interesting to include user emotions in the keyframe selection, there are limitations arising from the need to wear a biosensor to measure emotions. A recent study has explored how lifelogging technology can help users to collect data for self-monitoring and reflection [20]; they use a biosensor and a camera to provide a timeline of experience, including self-reported key experiences, lifelog experiences, heart rates, decisions, and valence. They conclude that their result supports recall and data richness. However, when those techniques are combined with automated tools such as key photo selection, better user experiences can be achieved [21].
EmoSnaps, the product of another emotion-related study, is a mobile application that allows a smartphone to take a picture while the user is unaware to help recall the emotion at that moment later [22]. Users evaluate their photos every day and enter emotional values. In addition, they can observe changes in their happiness every day and week. The study shows that facial expressions play an important role in the memory of one’s emotions. It has been also shown that emotions are closely related to facial expressions, making it difficult to hide basic emotions such as anger, contempt, disgust, fear, happiness, neutrality, sadness, and surprise [23]. In this study, emotion features are extracted from facial expressions and key images are selected to represent the diversity of lifelogs.
Facial emotion recognition is indeed a challenging task in the computer vision field. Large-scale databases play a significant role in solving this problem. The facial emotion recognition 2013 (FER2013) dataset was created in [24]. The dataset consists of 35,887 facial images that were resized  pixels and then converted to grayscale. Human recognition on this dataset has an accuracy of
  . It has been revealed that CNNs were indeed capable of outperforming handcrafted features for recognizing facial emotion. The extended Cohn–Kanade (CK+) facial expression database [25] includes 592 sequences from 210 adults from various ethnicities (primarily European- and African-Americans). The database contains 24-bit color images, of which the majority are grayscale. The Japanese female facial expression (JAFFE) database [26] contains 213 images of 10 Japanese female models exhibiting six facial expressions. All images are grayscale. The Radboud faces database (RaFD) [27] consists of 4,824 images collected from 67 Caucasian and Moroccan Dutch models displaying eight emotions. RaFD is a high-quality face database, with all images being captured in an experimental environment with a white background.
With the advancement of deep neural networks, the CNN architecture has yielded excellent results in image-related problems with learning spatial characteristics [28,29]. Research on facial emotion recognition has also been noticeably improved. Kumar et al. [30] utilized a CNN which has nine convolutional layers to train and classify seven types of emotion on the FER-2013 and CK+ databases. They were able to achieve an accuracy of about 90% or more. Li et al. [31] proposed new strategies for face cropping and rotation as well as a simplified CNN architecture with two convolution layers, two sub-sampling layers, and one output layer. The image was cropped to remove the useless region, and histogram equalization, Z-score normalization, and down-sampling were conducted. They experimented on the CK+ and JAFFE databases to obtain high average recognition accuracies of 97.38% and 97.18%, respectively. Handouzi et al. [32] proposed a deep convnet architecture for facial expression recognition based on the RaFD dataset. This architecture consists of a class of networks which have six layers: two convolutional layers, two pooling layers, and two fully connected layers. Recent research has extended from basic emotion recognition to compound emotion recognition. Gou et al. [33] released a dataset consisting of 50 classes of compound emotions composed of dominant and complementary emotions (e.g., happily-disgusted and sadly-fearful). The compound-emotion pairs are more difficult to recognize; thus, the top-5 accuracy is less than 60%. Slimani et al. [34] proposed a highway CNN architecture for the recognition of compound emotions. The highway layers of this architecture facilitate the transfer of the error to the top of the CNN. They achieved an accuracy of 52.14% for 22 compound-emotion categories.
VGGNet [35] is a CNN model composed of convolutional layers, pooling layers, and fully connected layers. VGG16 uses a  convolution filter, and the simplicity of the VGG16 architecture makes it quite appealing. VGG16 performs almost as well as the larger VGG19 neural network. Transfer learning has received much attention in recent years where the idea is to transfer knowledge from one domain to another [36]. A pre-trained model is a saved network that was previously trained on a large dataset such as ImageNet; we can use the pre-trained model as it is or use transfer learning to customize this model for our own purposes. Transfer learning applies when insufficient data are provided; it has the advantage of requiring relatively little computation because it only needs to adjust the weights of the designated layers. In general, the lower layers of CNN maintain general features regardless of the problem domain and the higher layers to be optimized to the specific dataset. Therefore, we can reduce the number of parameters to be trained, while reusing the lower-level layers. In this paper, we experiment with various methods including modified transfer learning and finetuning to select the optimal model.
We propose the Representative Emotional Data Extraction Scheme (REDES), a technique for selecting representative images from the user’s emotional perspective to identify the most representative photos from the user’s lifelog data. We develop a novel emotion classifier in this process to correctly extract emotions and use the Systemsensplus server to archive photos from the smartphones. Details are provided in the following subsections.
The proposed system is divided into two parts: A mobile application and a server based on Systemsensplus. The overall architecture is shown in Fig. 1. The mobile application consists of a face-registration module and a diary-generation module that includes REDES. The face-registration module registers the user’s face for recognition, while the REDES submodule identifies the days of special events and chooses representative photos. The diary-generation module displays the representative photos selected by REDES on the user’s smartphone screen and creates a diary for a specific date.

Figure 1: Basic architecture and modules of the proposed system including REDES
Systemsens [37] is a monitoring tool that tracks data on smartphone usage (e.g., CPU, memory, network connectivity). We use the extended Systemsensplus to effectively manage user photos and related tagging information. The emotion-detection module identifies the user’s face, predicts emotion from the facial expression, and tags the information using International Press Telecommunications Council (IPTC) photographic metadata standards. The IPTC format is suitable because it provides metadata, such as a description of the photograph, copyright, date created, and custom fields. The Systemsensplus client module operates as a background process on the user’s smartphone; it collects and stores data at scheduled times and events in a local database. When the smartphone is inactive, the Systemsensplus uploader sends data to the server overnight.
3.2 Emotion Classification Model
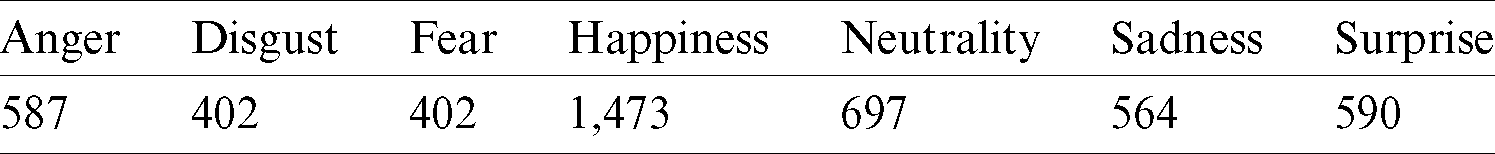
Well-refined, large-scale datasets are required for high accuracy of facial expression classification. On the FER2013 dataset [24], it is difficult to achieve a high performance due to the very low resolution of the given images. RaFD [27] consists of 4,824 images collected from 67 participants and includes eight facial expressions. The CelebFaces Attributes (CelebA) [38] dataset contains 202,599 celebrity facial images, but includes no label for facial expressions. We collect seven facial emotion expressions (excluding contempt) from the RaFD dataset and manually label facial emotion expressions in the CelebA dataset. The integrated dataset consists of seven emotions and Tab. 1 shows the number of images for each facial emotion.
Table 1: The number of images per emotion in our dataset
For experiments, we divided the dataset into three parts: Training (70%), validation (10%) and testing (20%). AlexNet [39], VGG 11, VGG16, and VGG19 network structures are used for comparing transfer learning and finetuning of facial expression recognition problems. The pre-trained VGG16 and VGG19 networks perform facial expression classification using transfer learning methods. To make an acceptable comparison, the same training options are used for all scenarios. When recognizing emotions from facial expressions, a pre-processing is performed to detect facial regions—i.e., detecting faces in images and cropping only the face region. For this pre-processing step, we utilize the face recognition python library [40]. This library has an accuracy of 99.38% for the labeled faces in the wild benchmark [41]. A sample of our dataset is shown in Fig. 2.

Figure 2: Exemplary images from our refined dataset
We aim to select the best model by comparing the performance of facial emotion classifiers using transfer learning or finetuning techniques based on pre-trained CNN models. We evaluated the four models—AlexNet, VGG11, VGG16, and VGG19—using different learning scenarios. The last fully connected layer of each model is replaced with the new fully connected layers for the purpose of emotion classification and the softmax function is applied at the end. For the VGG16 and VGG19 models, four methods are impelmented: A) Transfer learning in which all of the convolution layers are frozen and only the fully connected layers are trained; B) and C) Two transfer learning techniques in which the front-convolution layers are ..xed and the weight of highconvolution layers, i.e., convolution block 5 for B) and convolution blocks 4 and 5 for C), are trained; and D) A finetuning technique in which the weights of all layers are adjusted.
Our experiments were conducted using Keras [42] deep-learning library. A Nvidia GeForce RTX 2080 Ti GPU has been used to execute the experiments, and the Adam optimizer has been applied to a mini-batch of 32 images with categorical cross-entropy loss. The number of epochs and the learning rate is set to 100 and 10−4, respectively. Tab. 2 shows the validation and test accuracies of facial emotion classification in transfer learning for four CNN models. The results with the best test accuracy are highlighted in bold.
Table 2: The validation and test accuracies of the emotion classification models

On VGG16, the worst performance is shown when its convolution layers are fixed and only its fully connected layers are trainable. Considering the results, we see that the features extracted from the pre-trained model on ImageNet are not perfectly suitable for our classification problem. Although it shows slightly different results, the best test accuracy is obtained when the lower convolution layers are fixed and the layers of the last convolution block are trained. We also observe that finetuning methods, for which weights of all layers were adjusted, failed to acquire the best score.
Inspired by VGG16’s best results for transfer learning, we experimented to see if performance can be further improved when the weights of its layers 1 to 7 are fixed and the remaining layers are shallower. The CNN architecture of the emotion recognition classifier is shown in the Fig. 3. Based on the VGG16 architecture, the number of layers and filters of convolution blocks 4 and 5 are adjusted to improve the training speed and to prevent overfitting. It is assumed that feature maps for emotion recognition are not much required at a high level.

Figure 3: Proposed CNN model for facial emotion classification
We trained the proposed model using the same parameters. The test and validation accuracies of the proposed model are 95.22% and 97.01%, respectively, which is higher than the best-performing model, VGG16 transfer learning (fixed layer  ). Fig. 4 depicts the confusion matrix for the test samples using the proposed model; Fig. 5 depicts the model accuracy and loss, respectively, during the training and validation phase. We can observe from the plot that the model converges. The classification results of the model based on precision, recall, and F1-score are provided in Tab. 3. We utilize this emotion classifier to extract emotion features from the user’s photos.

Figure 4: Confusion matrix for the seven emotion categories
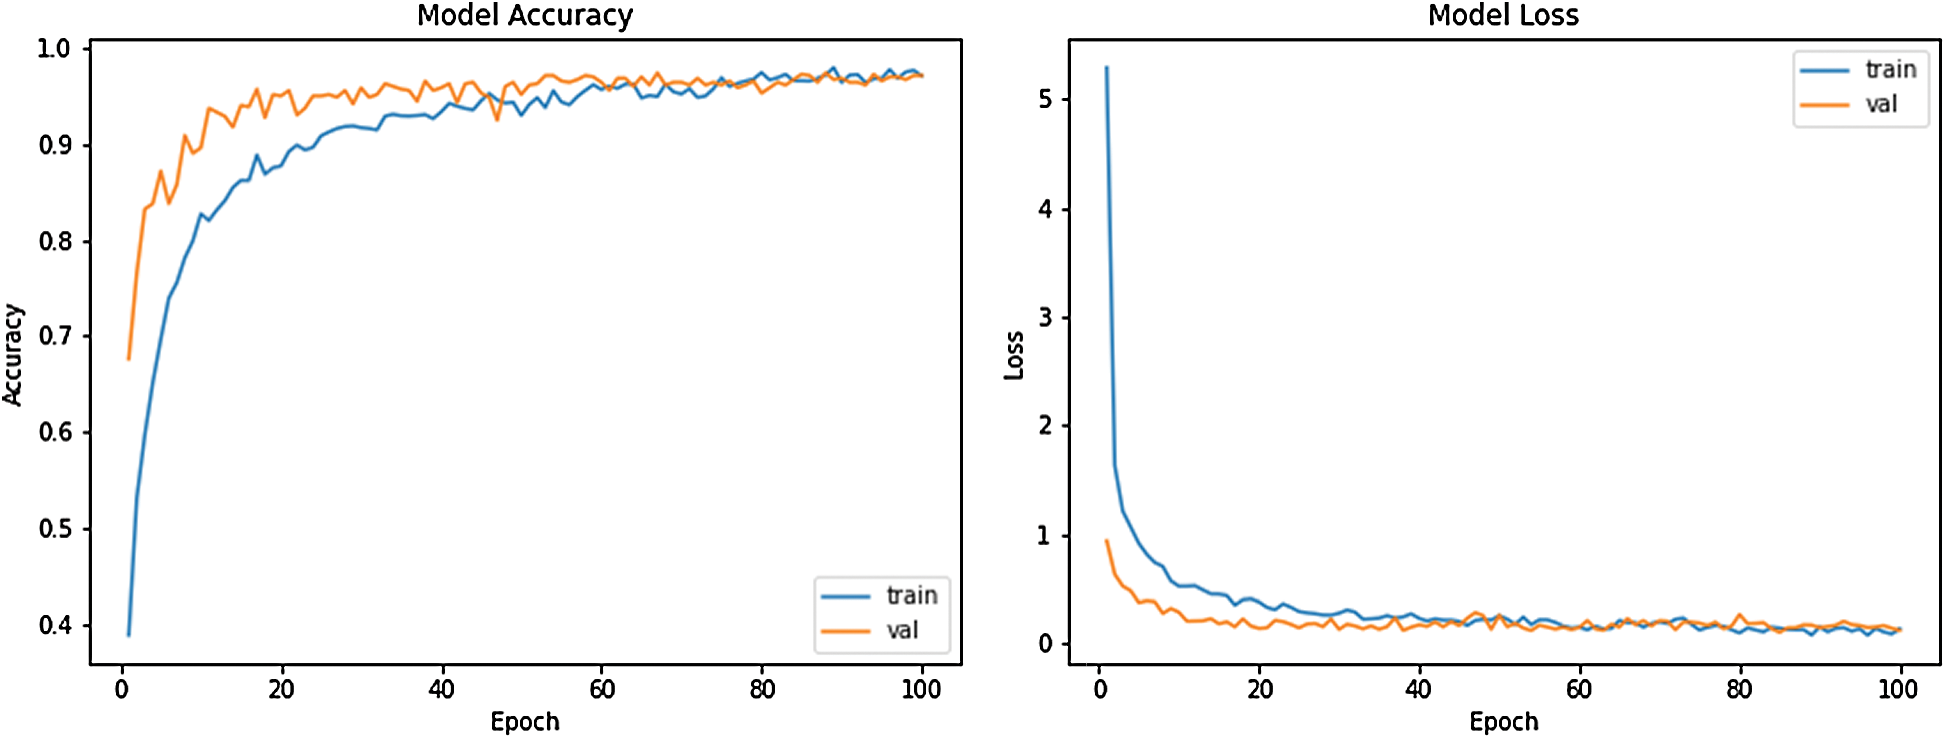
Figure 5: Training accuracy vs. validation accuracy (left); training loss vs. validation loss (right)
Table 3: The classification results based on precision, recall, and F1-score

This subsection describes how photos and related information are collected from users. The Systemsensplus client module operates as a background process and stores the required metadata in a local database, along with smartphone usage data. In this study, we focus on the image-based lifelogging system, which we consider to store mainly photo-related data.
When a user launches the application for the first time, the user’s face registration screen will be activated. After the user’s facial image has been successfully registered, it can be recognized and its emotion scores can be extracted. Users are also able to register new facial images through the face-registration user interface. The Systemsensplus supports two types of virtual sensors; event-based sensors generate log records whenever the corresponding state changes, and are activated when a user registers new face photos; and polling sensors record information at regular intervals. The upload mechanism is designed to upload only when the smartphone is being charged and has a network connection.
The emotion-detection module on the Systemsensplus server estimates the emotion scores of new photos added at a predefined time when uploading is completed. The extraction of emotion scores occurs in two steps: (1) Determining whether the user’s face is in the photo and if it is, (2) Calculating the confidence scores for seven emotion types. If faces are found, their similarity to the registered user is checked, and if the face in the photo is the user’s face, the emotion scores are acquired. Otherwise, the process stops. The emotion types and scores acquired are tagged in the photo in accordance with the IPTC standards. The type of emotion with the largest score is tagged as text in the ‘category’ column and the seven emotion scores are given as an array in the custom field of the IPTC content. Systemsensplus transfers only the metadata of the photos that have been tagged with emotion data to the client during the next scheduled cycle.
3.4 Representative Photo Selection Phase
Our goal is to maximize the diversity and representativeness of the lifelog images from the emotional perspective. To obtain diversity, we use emotion scores. A group of photos with similar emotion scores is grouped together and we choose key photos among the group. REDES uses the k-means clustering algorithm for this task. This algorithm partitions the given data into k clusters such that the variance of the distances within each cluster is minimized [43].
We use the k-means clustering algorithm with eight-dimensional vectors, consisting of time and the seven emotion scores:
— Time: The date/timestamp from the exchangeable image file formant header of the photos normalized to a real number between 0 and 1.
— Emotion: Seven emotion scores for anger, disgust, fear, happiness, neutrality, sadness, and surprise (where  ).
).
Given a set of photos  with each photo represented in an 8-dimensional vector space, the algorithm partitions the N photos into k (
 ) sets
  , to minimize the pairwise-squared deviations of points in the same cluster, as shown Eq. (1):

where  is the mean vector of cluster Ci.
To apply the k-means clustering algorithm, the number k should be specified. The number of clusters can be calculated as the square root of half the input size [44] as shown in Eq. (2):

where N is the number of photos.
We obtain a final k of cluster groups. Then REDES determines the photos represented by the data points closest to each center. Each cluster is a group of similar photos, so the data point closest to the center can be used to represent each cluster group.
The proposed system extracts emotion scores and stores the photos on the server. Tab. 4 shows the distribution of emtions collected from the facial expressions of one graduate student over the last five years; as we might expect, the distribution is quite skewed. However, it helps REDES to select diverse facial expressions. The results of the proposed method are shown in Fig. 6.
Table 4: Ratio of emotions extracted from one user’s photos


Figure 6: An example of the REDES result for a special day. The entire photostream of a day (top); representative photos selected by REDES (bottom)
To evaluate the performance of the REDES, we conducted a user experiment employing three datasets for 32 participants. One dataset contains 300 photos taken over the past three months, whereas the others are special day datasets of 97 and 48 photos, respectively. We employed a clustering method using only time feature as the baseline method, called Time in our comparison. In addition, we designed two comparable methods: One using only emotion features, called REDES(Emotion), and the other which selects photos with the largest emotion score, denoted by MaxEmotion. To conduct this experiment, we prepared an online questionnaire; first, we showed the entire dataset to the participants and instructed them to “Please rate each photo collection according to your preference (i.e., how representative and/or appealing the group of photos is).” We prepared four different groups of photo collections according to the photo selection strategies—i.e., REDES, REDES(Emotion), MaxEmotion, and Time—and randomly presented them to participants. The scoring system that we used was a scale of 1 to 5. The higher the score, the higher the user’s preference.
The overall grade-distribution range and score averages ( ,
,  ,
,  ,
,  ) are presented in Fig. 7, indicating that our proposed method outperforms the other methods. When comparing the mean values of each method for the experimental results, the preferred summary methods are REDES, REDES(Emotion), Time, and MaxEmotion, in that order. To further check whether the difference between the above four methods was statistically significant, one-way analysis of variance (ANOVA) was performed using the MATLAB statistics and machine learning toolbox [45]. As a result, the ratio of the between-group variability to the within-group variability (F) is 34.604 and the P-value is 8.57E-20. Thus, we conclude that there was a significant difference in the preference of photo selection from the datasets among those methods at significance level of 0.01. In other words, there was a significant difference between at least two of the group means.

Figure 7: The rating results from the experiment. The dots indicate the means; the boxes indicate the interquartile range, with vertical lines depicting the range and the red lines indicating the median
To determine which means significantly differ from that of our proposed method, we conducted post hoc comparisons between pairs of methods. Using the overall rating results (N = 96), a paired t-test was conducted. As shown by the P-values in Tab. 5, there is a significant difference between REDES and the other methods.
Table 5: Result of a paired t-test between our proposed method and other methods

Our detailed findings are as follows. Firstly, the MaxEmotion method selects the photo with the largest emotion score; thus, there is a tendency for similar photos with a high score in the happiness column to be chosen. Secondly, the time clustering method—as the baseline method—selects the photos among significant time intervals. We found that this method randomly yielded good or bad results depending on the dataset. Finally, since the REDES(Emotion) method mainly focuses on emotional diversity, the selected photos sometimes do not cover the entire period of the datasets. Thus, we concluded that REDES outperforms the other methods, and through the paired t-test we observed that the result has statistical significance. Our proposed scheme visualizes the lifelog by distinguishing the emotions displayed in the user’s photos. Representative photos are selected using emotion and time features, and the user configures the diary form conveniently using different metadata provided from the photos. Representative photos and emotions are displayed together, such that the user can easily recall the emotions of the day. Therefore, our proposed system, REDES, is able to effectively generate a lifelog based on the users’ emotional perspective.
In this work, we have proposed a new scheme for visualizing lifelogs using emotions extracted from the facial expressions in a user’s photos. The experimental results show that users preferred REDES over the baseline methods. For future work, we plan to extend our clustering scheme to more effectively capture the underlying clustering structure [46] and to develop a more sophisticated lifelogging system that can automatically generate a diary by capturing the objects, locations, and people as well as the user’s emotions.
Acknowledgement: The authors acknowledge Yechan Park for providing the personal dataset and supporting the experiments.
Funding Statement: This research was supported by the MSIT(Ministry of Science and ICT), Korea, under the Grand Information Technology Research Center Support Program (IITP-2020-2015-0-00742), Artificial Intelligence Graduate School Program (Sungkyunkwan University, 2019-0-00421), and the ICT Creative Consilience Program (IITP-2020-2051-001) supervised by the IITP. This work was also supported by NRF of Korea (2019R1C1C1008956, 2018R1A5A1059921) to J. J. Whang.
Conflicts of Interest: The authors declare that they have no conflicts of interest to report regarding the present study.
1. A. Pigeau. (2017). “Life gallery: Event detection in a personal media collection,” Multimedia Tools and Applications, vol. 76, no. 7, pp. 9713–9734. [Google Scholar]
2. A. Guo and J. Ma. (2015). “A smartphone-based system for personal data management and personality analysis,” in Proc. of the 13th IEEE Int. Conf. on Pervasive Intelligence Computing, Liverpool, UK, pp. 2114–2122. [Google Scholar]
3. I. Khan, S. Ali and S. Khusro. (2019). “Smartphone-based lifelogging: An investigation of data volume generation strength of smartphone sensors,” in Proc. of the 11th Int. Conf. on Simulation Tools and Techniques, Chengdu, China, pp. 63–73. [Google Scholar]
4. S. Lonn, P. Radeva and M. Dimiccoli. (2019). “Smartphone picture organization: A hierarchical approach,” Computer Vision and Image Understanding, vol. 187, 102789. [Google Scholar]
5. J. Gemmell, G. Bell and R. Lueder. (2006). “Mylifebits: A personal database for everything,” Communications of the ACM, vol. 49, no. 1, pp. 88–95. [Google Scholar]
6. A. R. Doherty and A. F. Smeaton. (2008). “Automatically segmenting lifelog data into events,” in Proc. of the 9th Int. Workshop on Image Analysis for Multimedia Interactive Services, Klagenfurt, Austria, pp. 20–23. [Google Scholar]
7. C. Gurrin, A. F. Smeaton and A. R. Doherty. (2014). “Lifelogging: Personal big data,” Foundations and Trends® in Information Retrieval, vol. 8, no. 1, pp. 1–125. [Google Scholar]
8. V. Vonikakis, R. Subramanian, J. Arnfred and S. Winkler. (2017). “A probabilistic approach to people-centric photo selection and sequencing,” IEEE Transactions on Multimedia, vol. 19, no. 11, pp. 2609–2624. [Google Scholar]
9. L. Chen, D. Yan and F. Wang. (2019). “User evaluations on sentiment-based recommendation explanations,” ACM Transactions on Interactive Intelligent Systems, vol. 9, no. 4, pp. 1–38. [Google Scholar]
10. R. Mu and X. Zeng. (2019). “A review of deep learning research,” KSII Transactions on Internet and Information Systems, vol. 13, no. 4, pp. 1738–1764. [Google Scholar]
11. J. Deng, W. Dong, R. Socher, L. J. Li, K. Li et al. (2009). , “Imagenet: A large-scale hierarchical image database,” in Proc. of 2009 IEEE Conf. on Computer Vision and Pattern Recognition, Miami, USA, pp. 248–255. [Google Scholar]
12. K. Weiss, T. M. Khoshgoftaar and D. D. Wang. (2016). “A survey of transfer learning,” Journal of Big Data, vol. 3, no. 9, pp. 1–40. [Google Scholar]
13. S. J. Pan and Q. Yang. (2009). “A survey on transfer learning,” IEEE Transactions on Knowledge and Data Engineering, vol. 22, no. 10, pp. 1345–1359. [Google Scholar]
14. S. Taubert, S. Kahl, D. Kowerko and M. Eibl. (2019). “Automated lifelog moment retrieval based on image segmentation and similarity scores,” in Working Notes of CLEF, 2019-Conf. and Labs of the Evaluation Forum, Lugano, Switzerland. [Google Scholar]
15. A. G. del Molino, C. Tan, J. H. Lim and A. H. Tan. (2017). “Summarization of egocentric videos: A comprehensive survey,” IEEE Transactions on Human-Machine Systems, vol. 47, no. 1, pp. 65–76. [Google Scholar]
16. M. Bolanos, M. Dimiccoli and P. Radeva. (2017). “Toward storytelling from visual lifelogging: An overview,” IEEE Transactions on Human-Machine Systems, vol. 47, no. 1, pp. 77–90. [Google Scholar]
17. M. Bolanos, R. Mestre, E. Talavera, X. G. Nieto and P. Radeva. (2015). “Visual summary of egocentric photostreams by representative keyframes,” in Proc. of 2015 IEEE Int. Conf. on Multimedia and Expo Workshops, Torino, Italy, pp. 1–6. [Google Scholar]
18. R. Rawassizadeh, M. Tomitsch, K. Wac and A. M. Tjoa. (2013). “Ubiqlog: A generic mobile phone-based life-log framework,” Personal and Ubiquitous Computing, vol. 17, no. 4, pp. 621–637. [Google Scholar]
19. P. Ratsamee, Y. Mae, A. Jinda-Apiraksa, J. Machajdik, K. Ohara et al. (2013). , “Lifelogging keyframe selection using image quality measurements and physiological excitement features,” in Proc. of 2013 IEEE/RSJ Int. Conf. on Intelligent Robots and Systems, Tokyo, Japan, pp. 5215–5220. [Google Scholar]
20. M. Arvola, J. Blomkvist and F. Wahlman. (2017). “Lifelogging in user experience research: Supporting recall and improving data richness,” The Design Journal, vol. 20, no. sup1, pp. S3954–S3965. [Google Scholar]
21. C. H. Tsai and P. Brusilovsky. (2020). “Exploring social recommendations with visual diversity-promoting interfaces,” ACM Transactions on Interactive Intelligent Systems, vol. 10, no. 1, pp. 1–34. [Google Scholar]
22. E. Niforatos and E. Karapanos. (2015). “Emosnaps: A mobile application for emotion recall from facial expressions,” Personal and Ubiquitous Computing, vol. 19, no. 2, pp. 425–444. [Google Scholar]
23. D. Keltner, P. Ekman, G. C. Gonzaga and J. Beer. (2003). “Facial expression of emotion,” in R. J. Davidson, K. R. Scherer, H. H. Goldsmith (Eds.Handbook of Affective Sciences, New York, USA: Oxford University Press, pp. 415–432. [Google Scholar]
24. I. J. Goodfellow, D. Erhan, P. L. Carrier, A. Courville, M. Mirza et al. (2015). , “Challenges in representation learning: A report on three machine learning contests,” Neural Networks, vol. 64, pp. 59–63. [Google Scholar]
25. P. Lucey, J. F. Cohn, T. Kanade, J. Saragih, Z. Ambadar et al. (2010). , “The extended Cohn-Kanade dataset (CK+A complete dataset for action unit and emotion-specified expression,” in Computer Vision and Pattern Recogntion Workshops, San Francisco, USA, pp. 94–101. [Google Scholar]
26. M. Lyons, S. Akamatsu, M. Kamachi and J. Gyoba. (1998). “Coding facial expressions with gabor wavelets,” in Proc. of the 3rd IEEE Int. Conf. on Automatic Face and Gesture Recognition, Nara, Japan, pp. 200–205. [Google Scholar]
27. O. Langner, R. Dotsch, G. Bijlstra, D. H. Wigboldus, S. T. Hawk et al. (2010). , “Presentation and validation of the radboud faces database,” Cognition & Emotion, vol. 24, no. 8, pp. 1377–1388. [Google Scholar]
28. G. Zhao, H. Yang, Y. Tao, L. Zhang and C. Zhao. (2020). “Lightweight CNN-based expression recognition on humanoid robot,” KSII Transactions on Internet and Information Systems, vol. 14, no. 3, pp. 1188–1203. [Google Scholar]
29. H. Wu, Q. Liu and X. Liu. (2019). “A review on deep learning approaches to image classification and object segmentation,” Computers, Materials & Continua, vol. 60, no. 2, pp. 575–597. [Google Scholar]
30. R. Kumar, R. Kant and G. Sanyal. (2017). “Facial emotion analysis using deep convolution neural network,” in Proc. of 2017 Int. Conf. on Signal Processing and Communication, Coimbatore, India, pp. 369–374. [Google Scholar]
31. K. Li, Y. Jin, M. W. Akram, R. Han and J. Chen. (2020). “Facial expression recognition with convolutional neural networks via a new face cropping and rotation strategy,” Visual Computer, vol. 36, no. 2, pp. 391–404. [Google Scholar]
32. W. Handouzi and A. Ziane. (2019). “Deep convnet for facial emotion recognition,” in Int. Conf. on Advanced Intelligent Systems for Sustainable Development. Advances in Intelligent Systems and Computing, M. Ezziyyani (Ed.vol. 1105. Cham, Switzeland: Springer, pp. 202–209. [Google Scholar]
33. J. Guo, Z. Lei, J. Wan, E. Avots, N. Hajarolasvad et al. (2018). , “Dominant and complementary emotion recognition from still images of faces,” IEEE Access, vol. 6, pp. 26391–26403. [Google Scholar]
34. K. Slimani, K. Lekdioui, R. Messoussi and R. Touahni. (2019). “Compound facial expression recognition based on highway CNN,” in Proc. of the New Challenges in Data Sciences: Acts of the Second Conf. of the Moroccan Classification Society, Kenitra, Morocco, pp. 1–7. [Google Scholar]
35. K. Simonyan and A. Zisserman. (2015). “Very deep convolutional networks for large-scale image recognition,” in Proc. of 3rd Int. Conf. on Learning Representations, San Diego, CA, USA. [Google Scholar]
36. M. Shorfuzzaman and M. Masud. (2020). “On the detection of COVID-19 from chest x-ray images using CNN-based transfer learning,” Computers, Materials & Continua, vol. 64, no. 3, pp. 1359–1381. [Google Scholar]
37. H. Falaki, R. Mahajan and D. Estrin. (2011). “Systemsens: A tool for monitoring usage in smartphone research deployments,” in Proc. of the 6th Int. Workshop on MobiArch, Bethesda, USA, pp. 25–30. [Google Scholar]
38. Z. Liu, P. Luo, X. Wang and X. Tang. (2008). “Large-scale celebfaces attributes (celeba) dataset,” . [Online]. Available: http://mmlab.ie.cuhk.edu.hk/projects/CelebA.html. [Google Scholar]
39. A. Krizhevsky, I. Sutskever and G. E. Hinton. (2017). “Imagenet classification with deep convolutional neural networks,” Communictaions of the ACM, vol. 60, no. 6, pp. 84–90. [Google Scholar]
40. A. Geitgey. (2016). “Machine learning is fun! part 4: Modern face recognition with deep learning,” Medium, . [Online]. Available: https://medium.com/@ageitgey/machine-learning-is-fun-part-4-modern-face-recognition-with-deep-learning-c3cffc121d78. [Google Scholar]
41. G. Huang, M. Mattar, T. Berg and E. Learned-Miller. (2008). “Labeled faces in the wild: A database for studying face recognition in unconstrained environments,” in Proc. of the 10th European Conf. on Computer Vision, Marseille, France, pp. 1–14. [Google Scholar]
42. F. Chollet. (2015). “Keras: The python deep learning library,” . [Online]. Available: https://keras.io. [Google Scholar]
43. S. Lloyd. (1982). “Least squares quantization in PCM,” IEEE Transactions on Information Theory, vol. 28, no. 2, pp. 129–137. [Google Scholar]
44. B. Boehmke and B. Greenwell. (2020). “K-means clustering,” in Hands-On Machine Learning with R, 1 ed., Chapter 20, Boca Raton, USA: CRC Press, . [Online]. Available: https://bradleyboehmke.github.io/HOML/. [Google Scholar]
45. D. J. Higham and N. J. Higham. (2016). MATLAB Guide. 3 ed. Philadelphia, PA, USA: Society for Industrial and Applied Mathematics. [Google Scholar]
46. J. J. Whang, Y. Hou, D. F. Gleich and I. S. Dhillon. (2019). “Non-exhaustive, overlapping clustering,” IEEE Transactions on Pattern Analysis and Machine Intelligence, vol. 41, no. 11, pp. 2644–2659. [Google Scholar]
 | This work is licensed under a Creative Commons Attribution 4.0 International License, which permits unrestricted use, distribution, and reproduction in any medium, provided the original work is properly cited. |