DOI:10.32604/cmc.2021.014873
| Computers, Materials & Continua DOI:10.32604/cmc.2021.014873 | |
| Article |
Modelling the Psychological Impact of COVID-19 in Saudi Arabia Using Machine Learning
1College of Education, King Faisal University, Al-Ahsa, 31982, Saudi Arabia
2Community College in Abqaiq, King Faisal University, Al-Ahsa, 31982, Saudi Arabia
3Department of Economics and Quantitative Methods, ESSECT, University of Tunis, Tunis, Tunisia
4Department of Computer Engineering and Science, Al-Baha University, Al-Bahah, Saudi Arabia
*Corresponding Author: Theyazn H. H. Aldhyani. Email: taldhyani@kfu.edu.sa
Received: 23 October 2020; Accepted: 16 December 2020
Abstract: This article aims to assess health habits, safety behaviors, and anxiety factors in the community during the novel coronavirus disease (COVID-19) pandemic in Saudi Arabia based on primary data collected through a questionnaire with 320 respondents. In other words, this paper aims to provide empirical insights into the correlation and the correspondence between socio-demographic factors (gender, nationality, age, citizenship factors, income, and education), and psycho-behavioral effects on individuals in response to the emergence of this new pandemic. To focus on the interaction between these variables and their effects, we suggest different methods of analysis, comprising regression trees and support vector machine regression (SVMR) algorithms. According to the regression tree results, the age variable plays a predominant role in health habits, safety behaviors, and anxiety. The health habit index, which focuses on the extent of behavioral change toward the commitment to use the health and protection methods, is highly affected by gender and age factors. The average monthly income is also a relevant factor but has contrasting effects during the COVID-19 pandemic period. The results of the SVMR model reveal a strong positive effect of income, with R2 values of 99.59%, 99.93% and 99.88% corresponding to health habits, safety behaviors, and anxiety.
Keywords: COVID-19; health habits; safety behaviors; anxiety; support vector machine regression; regression trees
With the announcement by the World Health Organization (WHO) that the new coronavirus disease (COVID-19) had become a global pandemic, the rapid activation of “social spacing” or “social distancing” was recommended. These terms refer to making space between people when they are outside their homes, such as by avoiding crowded places and mass gatherings, for the sake of preventing the spread of the disease [1–6]. However, there must be special care taken when applying the term “social distancing,” which implies closing schools, universities, and some institutions. Such practices can be compensated for by working remotely from home if possible and minimizing physical interaction with others. The SARS epidemic resulted in 8,000 cases and 800 deaths worldwide (in 26 countries) in 2003 [7]; it was controlled by July 2003, within eight months [7,8]. Symptoms of moderate to severe post-traumatic stress were reported among the population in areas that were severely affected by the SARS epidemic [9–13]. PTSD is a psychological result of exposure to traumatic events and is characterized by symptoms of re-experiencing the trauma and avoiding trauma reminders. Earlier studies have shown that Middle East respiratory syndrome, the H1N1 virus, and Ebolavirus have affected people’s mental health, resulting in such symptoms as anxiety, depression, and post-traumatic stress. Likewise, patients with coronavirus have mental health problems with similar symptoms [12–14]. Furthermore, among the reported effects of these diseases, people have experienced food and resource insecurity and discrimination. Such effects can lead to some negative mental health outcomes during these epidemics [14–19].
People around the world have developed significant anxiety because the new coronavirus has spread globally; the best way to for people to protect themselves is to stay in their homes as a necessary step to avoid infection. Thus, people are affected by being isolated in their homes and exposed to changing social and economic lifestyles. Health organizations and authorities have reported that people with prior health problems and older people are prone to death when they contract the virus in this pandemic. This has led country authorities and health organizations to impose measures for limiting the spread of COVID-19. They have called on individuals to avoid gatherings except in necessary cases and to stay in their homes, as well as to ensure hygiene. Such warnings and measures have caused panic in various societies; as experts indicate, this will be difficult to contain [20].
There is a paucity of research that has assessed mental health concerns during the COVID-19 epidemic. Considering all the factors mentioned above, to address this gap, this study aims to assess knowledge, attitudes, anxiety, and perceived mental healthcare needs in the community during the coronavirus epidemic in Saudi Arabia. This research paper attempts to assess health habits, safety behaviors, and anxiety factors in the Saudi population. Coronavirus has left the world in a state of uncertainty, and the flow of news has engendered constant anxiety. Following the news is understandable, but the worry this causes can enhance any psychological problems that a person already has [21]. When the WHO published its recommendations on how to protect mental health in the face of the coronavirus outbreak, the measure was widely welcomed. Therefore, this study aims to investigate whether there is an immediate effect of the COVID-19 epidemic on health habits, safety behaviors, and anxiety. It further examines the lifestyle habits and quality of life among Saudi people, especially after the imposed quarantine and travel restrictions by the government.
The anxiety and concerns in society globally affect every individual to varying degrees [22]. Recent evidence has proposed that isolated and quarantined individuals suffer from great distress in the form of anxiety, anger, confusion, and post-traumatic stress symptoms [23]. Public knowledge and attitudes are expected to largely affect the degree of commitment to personal protective measures, and eventually, the clinical outcome [24–26]. Therefore, it is important to study this phenomenon in society.
According to the objective of the National Mental Health Program to develop and encourage mental health care services, community members first have to be evaluated to identify their perceptions, knowledge, and attitudes toward people who access mental health services [27–29]. Developing mental health services can assist the government in reducing the spread of pandemics. By the beginning of March 2020, the Saudi government had reported the first case of COVID-19 in the city of Qatif. At the end of March 2020, about 1,563 confirmed cases had been discovered in different cities. As a result of the increase in deaths, levels of fear and anxiety escalated among people.
2 Overview of the Dataset and Variables
This section presents the material and methods of the research.
2.1 Design of Questionnaire Tool
The questionnaire was developed to measure the changes in societal behaviors that have occurred during the emergence of the COVID-19 pandemic. It has three main parts. The first part consists of five questions on demographic information, specifically, gender, age, nationality, education, and average monthly income. The second part consists of 11 questions focused on testing the hypotheses represented by the current behaviors in society in light of facing COVID-19 and changes in social behaviors that may continue after COVID-19. The final part of the questionnaire is composed of nine questions that focus on the extent of behavioral change toward the commitment to use the safety and protection measures of COVID-19. A 5-point Likert items was used with the following response options: “strongly agree,” “agree,” “neutral,” “disagree,” and “strongly disagree.” The level of commitment was measured according to methods of protecting against exposure to the coronavirus by selecting measures with a score of 1–5, representing “rarely or never,” “rarely,” “seldom,” “sometimes,” and “always.”
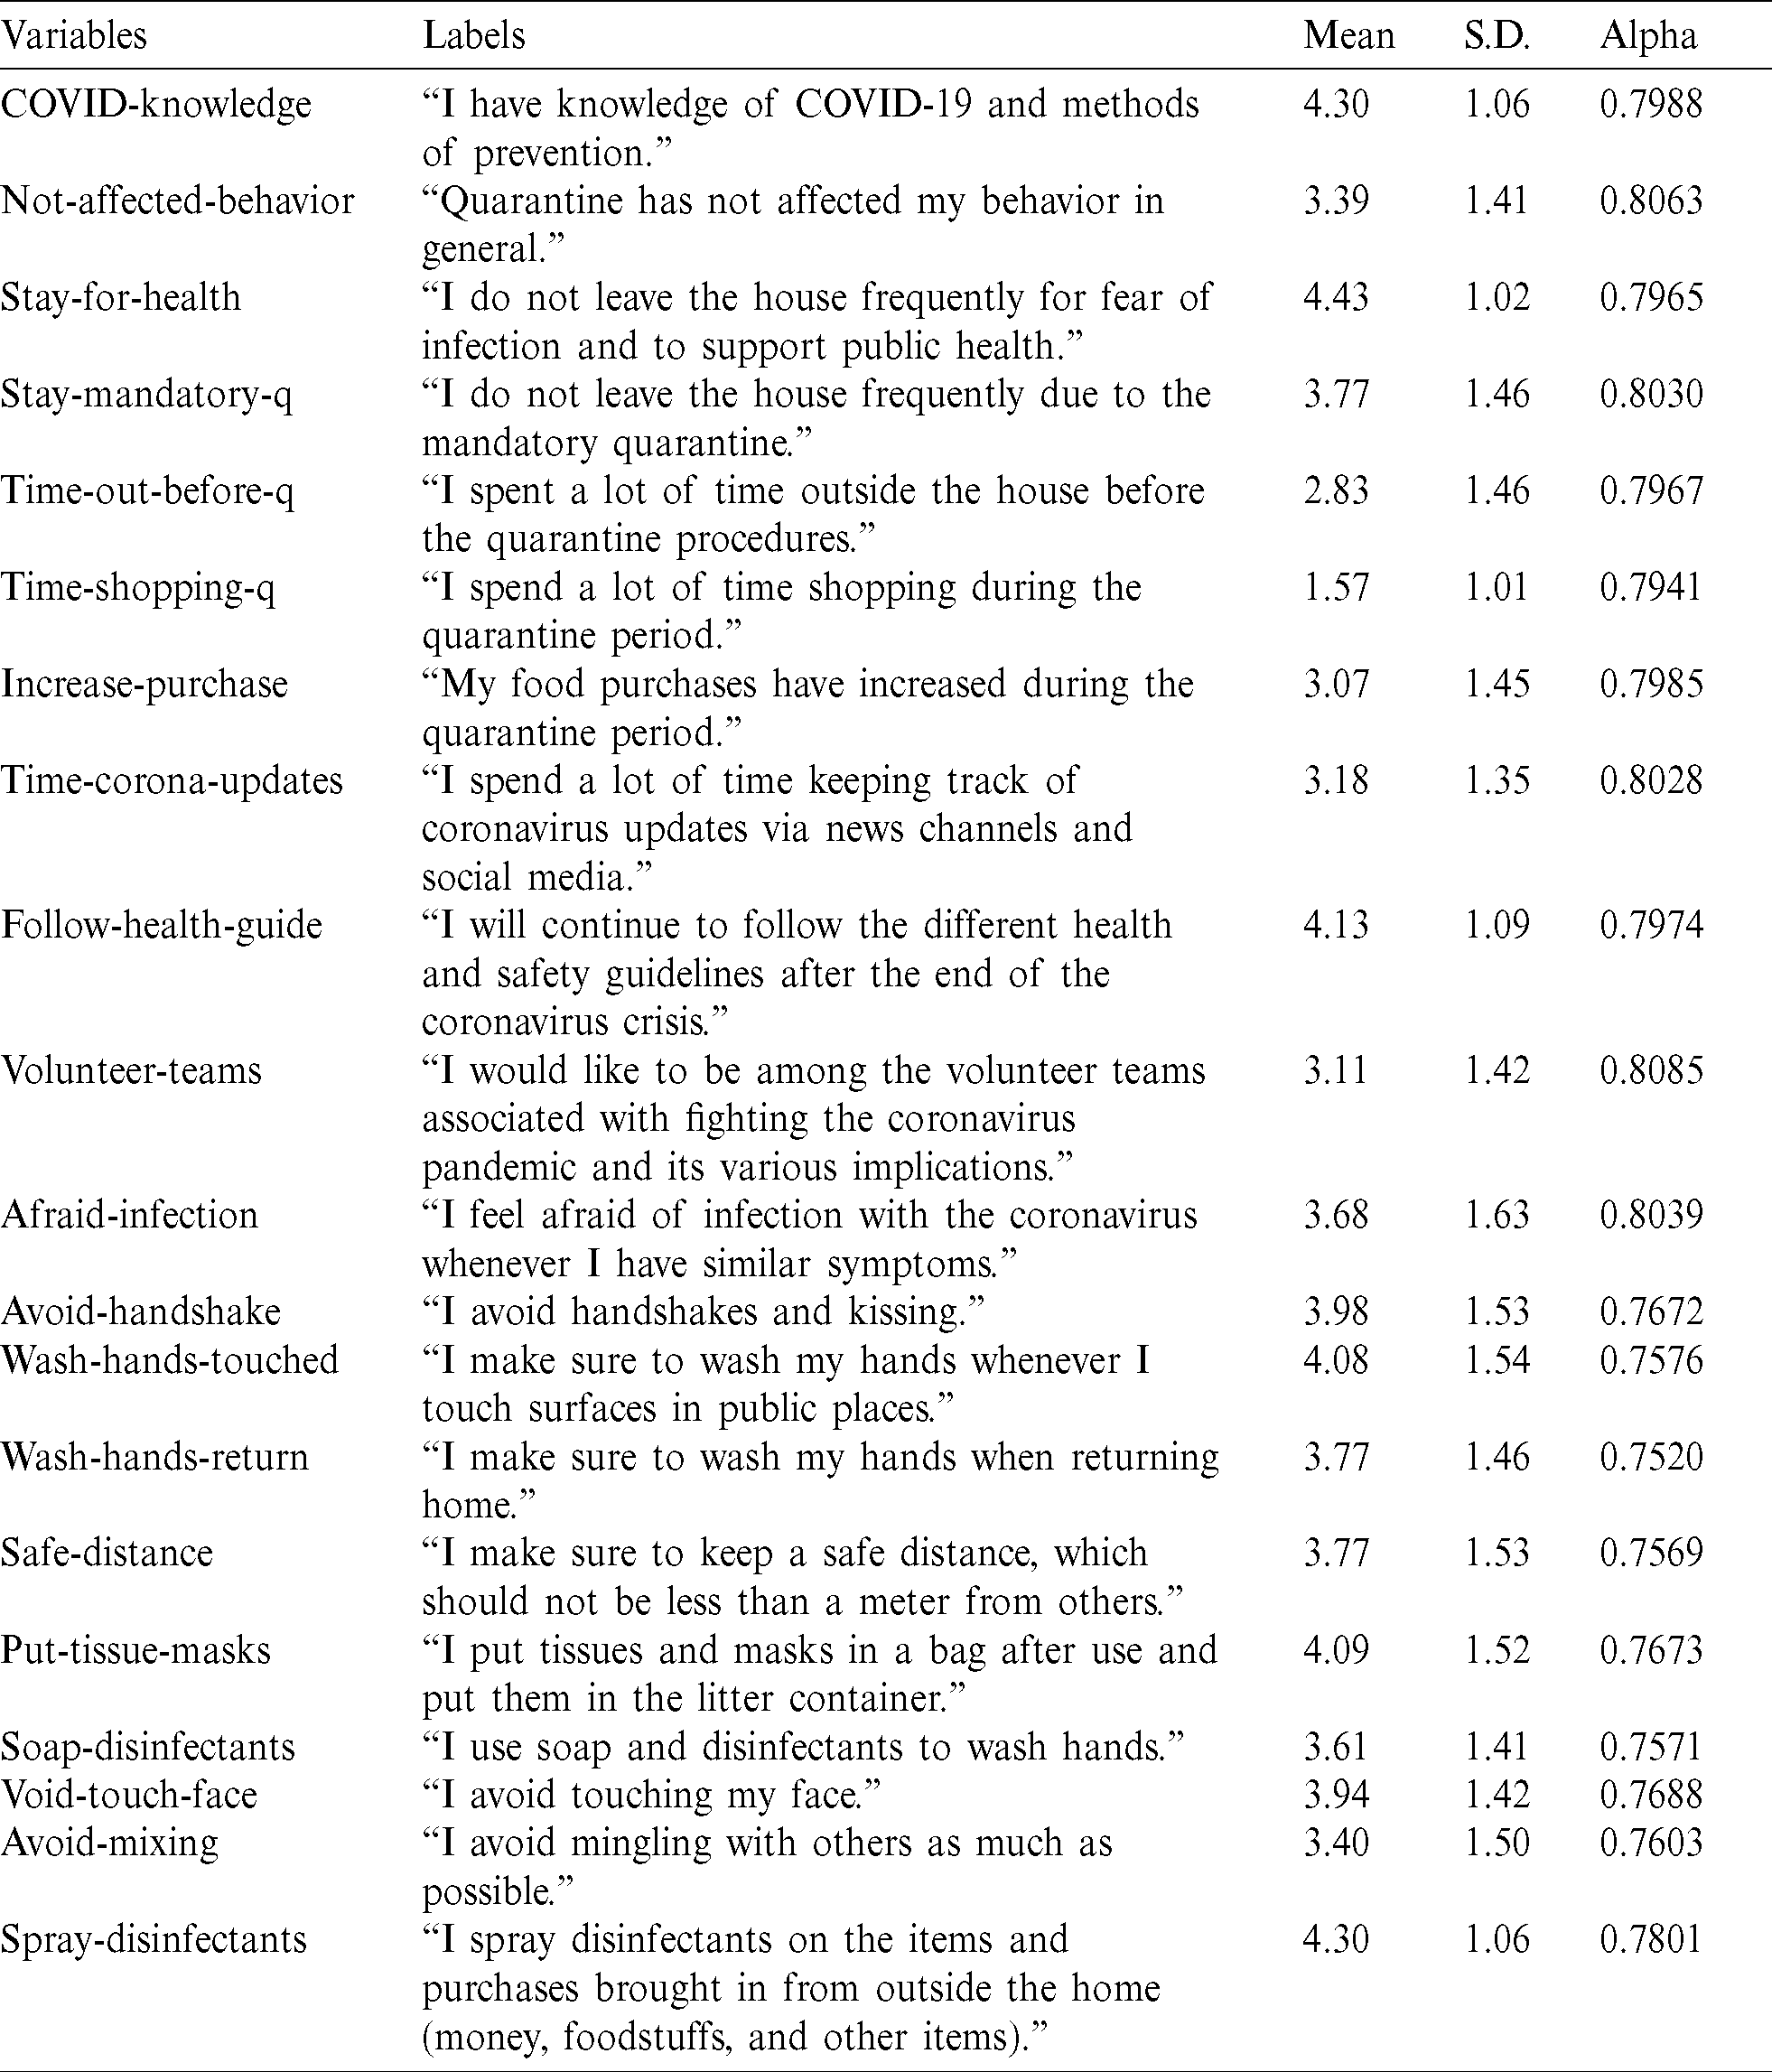
Tab. 1 reports the descriptive statistics and the demographic information about the survey respondents. Most of the respondents were men (76.88%), aged between 30 and 50 years, and 53.44% of the participants had a bachelor’s degree. Respondents were asked about their average monthly income and nationality. It was observed that most respondents were Saudi (90%), while 23.13% received less than 3,000 riyals, 19.69% received 3000–9000 riyals, and 57.18% received more than 9,000 riyals. Tab. 2 presents the items, and their corresponding descriptive statistics are shown. We used Cronbach’s alpha to assess the internal consistency (or reliability) of the set of scale items [30]. In fact, the reliability of any given measurement refers to the extent to which it is a consistent measure of a concept, and the alpha coefficient is one way of measuring the strength of that consistency [31,32]. When calculating alpha, we ensured that all items were formulated in the same direction (positively or negatively worded). This needed to be reversed prior to the reliability analysis [31,33]. There were 20 items on the scale, and the scale reliability coefficient (Cronbach’s alpha) was 0.7937. However, it was inappropriate to calculate one Cronbach’s alpha value for all 20 items. Thus, Tab. 2 also reports the value for each item.
Table 1: Statistics and demographic information about the survey respondents
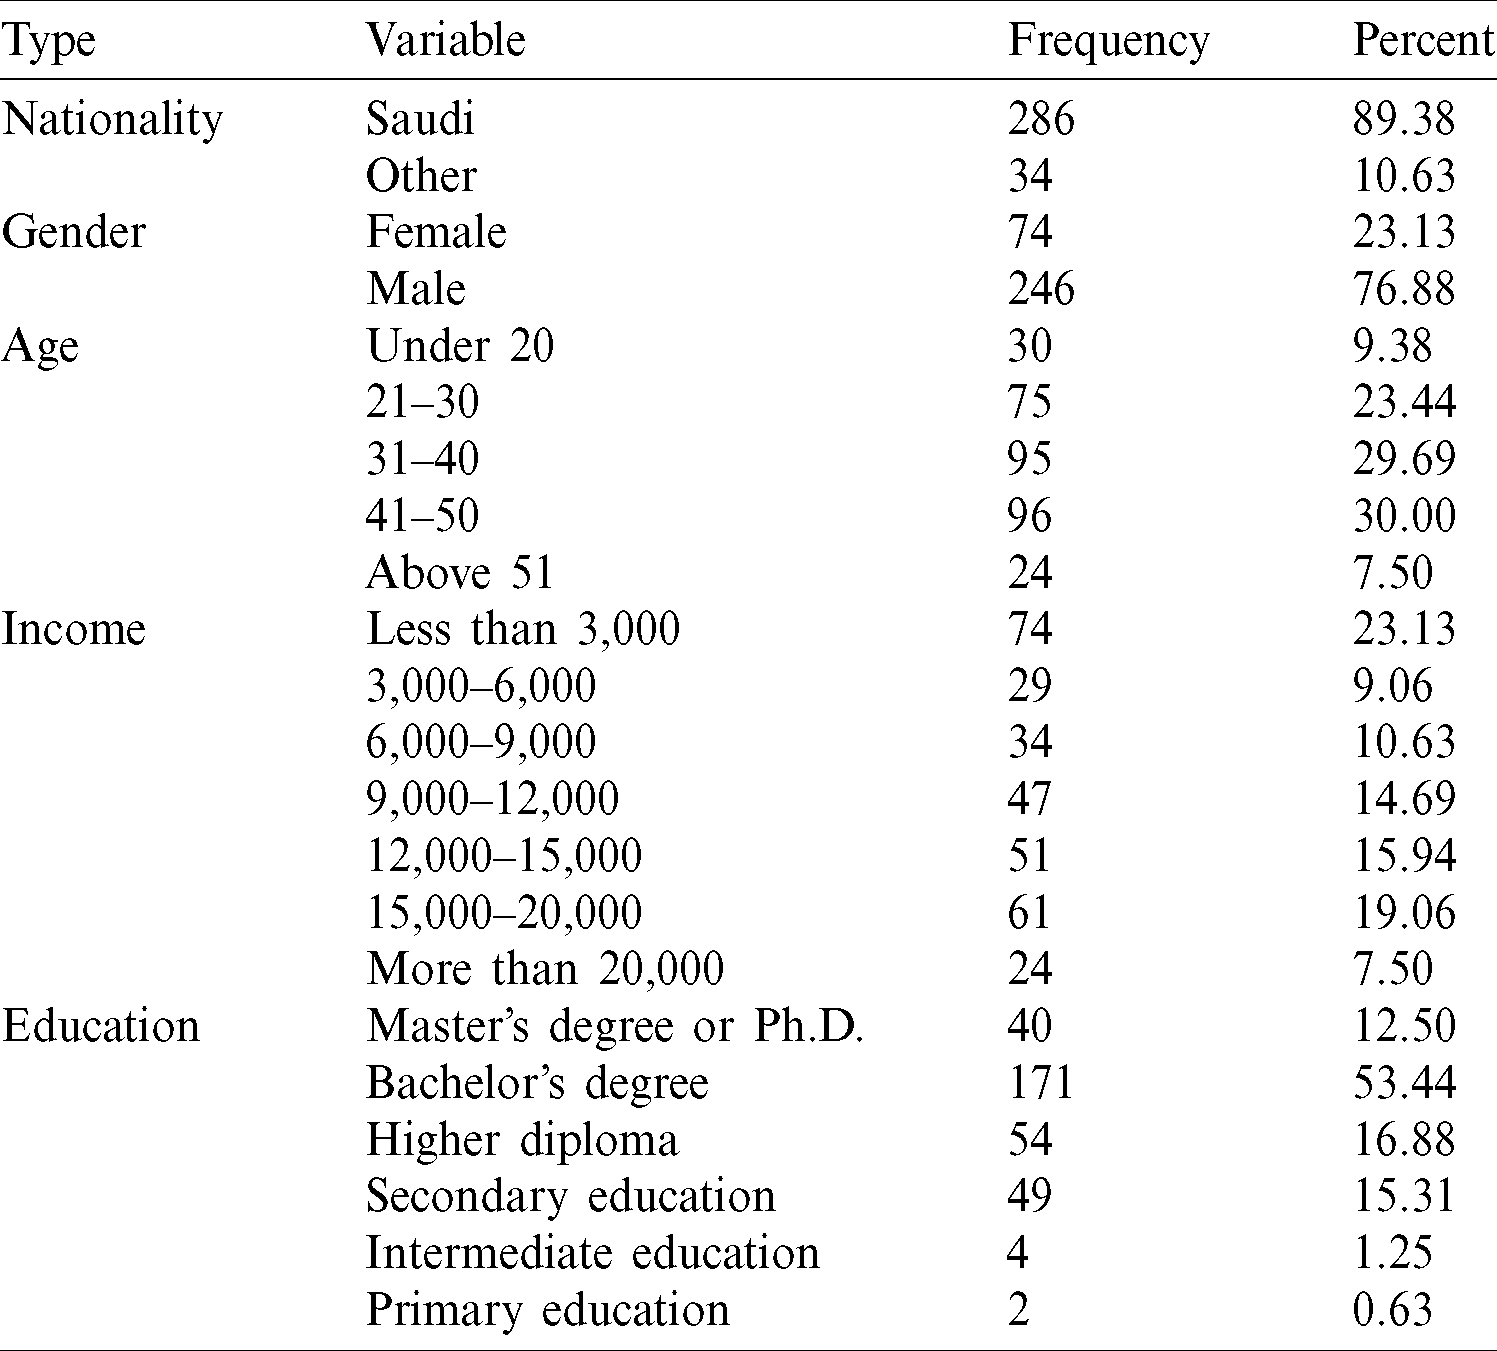
Table 2: Variables and descriptive statistics
We used exploratory factor analysis for data reduction. This approach reduces the number of variables by describing linear combinations of the items that contain most of the information and admit meaningful interpretations.
3.1 Exploratory Factor Analysis
Principal component factor (PCF) analysis allows us to transform the variables (20 items) such that they are statistically correlated into a few independent factors. We use this approach as an exploratory tool to reduce the information into several components expressing the maximum variance of the data. The meaning and interpretation of the obtained factors are deduced from the initial items with which they are strongly associated. The factoring procedure consists of seeking, within a cloud of points, an axis for which the inertia projected on this axis is maximized [34]. This makes it possible to highlight latent components, considering the total variance of all the initial variables (generating a synthetic quantity that best differentiates the individual behaviors). The latent components are linear combinations of the initial variables. Graphically, the observations are projected on axes, and their new coordinates are the values of the main component. Indeed, the highly correlated variables are grouped around an axis that represents a newly constructed factor. The new axes are the eigenvectors, ordered by decreasing eigenvalues, of the covariance matrix of the data. Bartlett and Kaiser–Meyer–Olkin (KMO) sphericity tests are used to ensure the validity of measurement scales [35,36]. In the factoring procedure, we use the polychoric correlation matrix, which assumes that the ordinary items are imperfect measures of underlying latent continuous ones [37]. Determining the number of factors to extract is also a critical decision in exploratory factor analysis [38]. The Kaiser criterion suggests retaining those factors with eigenvalues equal to or higher than 1. However, this criterion is well known for over-specifying the number of factors; that is, the criterion suggests more factors than it should [39]. Parallel analysis [40] adjusts the original eigenvalues for sampling error-induced collinearity among the variables to arrive at adjusted eigenvalues. It compares the randomly generated eigenvalues with those from the original analysis [33,39,41].
3.2 Non-Parametric Regression Trees
We use non-parametric regression trees to divide our observation space to analyze the interactions between the individual characteristics and the three obtained factors—health habits, safety behaviors, and anxiety. Regression tree analysis is a machine learning approach that aims to accurately predict the value of the output variable from certain explanatory variables [42]. In fact, a regression tree establishes a hierarchy between the explanatory variables using their contribution to the overall fit of the regression. More exactly, it divides the set of observations into subclasses characterized by their values in terms of their contribution to the overall fit and their prediction for the dependent variable [43]. These values are validated against a fraction (10%) of the sample that is not used in the estimation. The value at which the partitioning is stopped (and the tree cut) is given by the complexity parameter (cp) [44]. A regression tree is flexible and powerful in the clarification of the structure of the observations [42,45,46]. The tree gives a hierarchical sequence of “conditions” on the independent variables of the model: The higher the role of a condition in the classification of the observed cases, the higher its status on the tree. For each condition, the left branch gives the case for which the condition is true, and the right branch gives the case that is compatible with the complementary condition [47–50].
3.3 Support Vector Machine Regression (SVMR)
In this subsection, the support vector machine regression (SVMR) algorithm is applied to find the behavioral and perceived mental responses of Saudi society. The SVMR algorithm includes a nonlinear mapping of an n-dimensional information space into a high-dimensional component space [51].
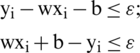
The support vector (SV) algorithm is a machine learning algorithm in the framework of statistical learning. This theory has been developed over the last four decades by [52]. The SVM algorithm is used to classify hyperspectral images SVR [53]. The authors have compared the performance of this algorithm with existing research. They applied three algorithms, namely, the MLR, SVR, and artificial neural network (ANN) algorithms, to predict load performance using hyperspectral data [54]. The SVR algorithm is regarded as an application of trickle bed reactors where key design variables for numerous correlations exist in the literature [55]. The SVMR model has great potential and superior performance, as has been witnessed in many existing studies. According to researchers [56] using SVR for travel-time forecasting, the prediction results are compared with another baseline travel-time prediction model using real highway traffic data. The SVMR model was applied to predict network traffic. Reference [57] applied SVR to predict the link load of a network. The results showed that the SVR model is robust for modeling network traffic. The main object of the SVM algorithm is classified data, but using the SVM algorithm for regression, we have used an  -insensitive SVR, and the main ideal is to find the function f(x) that deviates from the obtained target yi for the training data. The main principle is the same as SVM classification, but we have a new function to be minimized, where

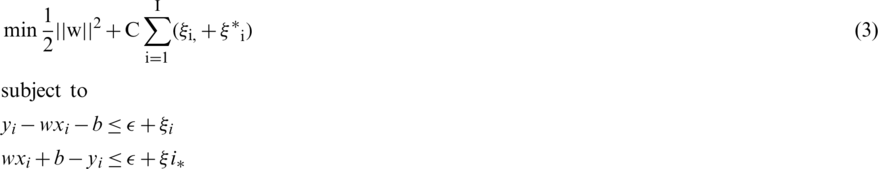
From this equation, we must solve the problem

subject to
If the problem is not feasible, we need to introduce the slack variables  ,
,  . This is called the soft margin.
where  ,
,  i
i
 0; C
0; C  0
0
For determination of the trade-off between the flatness of f(x) using the  -insensitive SVR, when the amount up for deviations is larger than s are tolerated. This case is called
  -insensitive loss function
  .
.
Fig. 1a displays the hyperplane of the SVM algorithm separating the data for classification and regression. The SVM algorithm is a powerful machine learning algorithm for classification that has the ability to solve the regression problem, as shown in Fig. 1b.
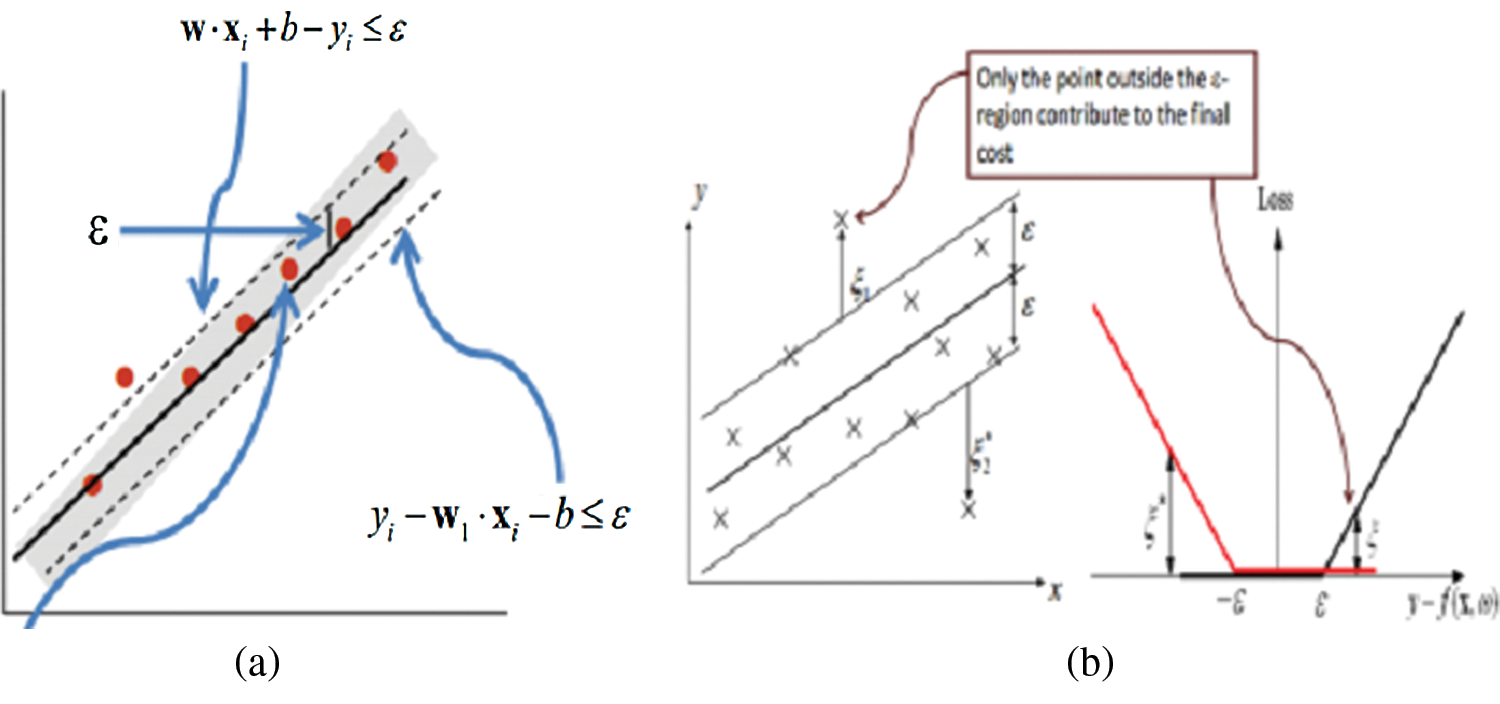
Figure 1: Hyperplanes and support vectors (a) hyperplane (b) soft margin
The normalization method has been employed to improve time series models. We applied the min-max method to scale the data with the same range to assist the SVM regression model to obtain an appropriate output. The min-max method maps input data into a predefined range [0,1]:

where xmin is the minimum of the data and xmax is the maximum of the data. Furthermore, Newminx is the minimum number 0 and Newmaxx is the maximum number 1.
Several evaluation metrics have been used to test and evaluate SVMR for predicting health habits, safety behaviors, and anxiety. The evaluation metrics used here were the R-squared value, mean square error (MSE), and root mean square error (RMSE). A short description of these evaluation metrics along with their formulations are described below.
Mean Square Error (MSE):


where xt comprises observed responses and  represents estimated responses.
Regression trees and SVMR techniques were used to determine the health habits, safety behaviors, and anxiety caused by COVID-19 in Saudi Arabian society.
4.1 Results of Factor Analysis
The results of the principal component factors analysis are given in Tab. 3. Five factors are retained. Factor loadings with absolute values smaller than 0.4 are replaced by blanks. Each principal component (axis) explains a linear combination of a group of interrelated variables having the greatest contribution to the axis. However, Horn’s [40] parallel analysis criterion confirms the existence of three components. Furthermore, the results are confirmed using the hierarchical clustering of variables around latent components, clearly showing the existence of three factors. Thus, the first three axes will be retained for the analysis.
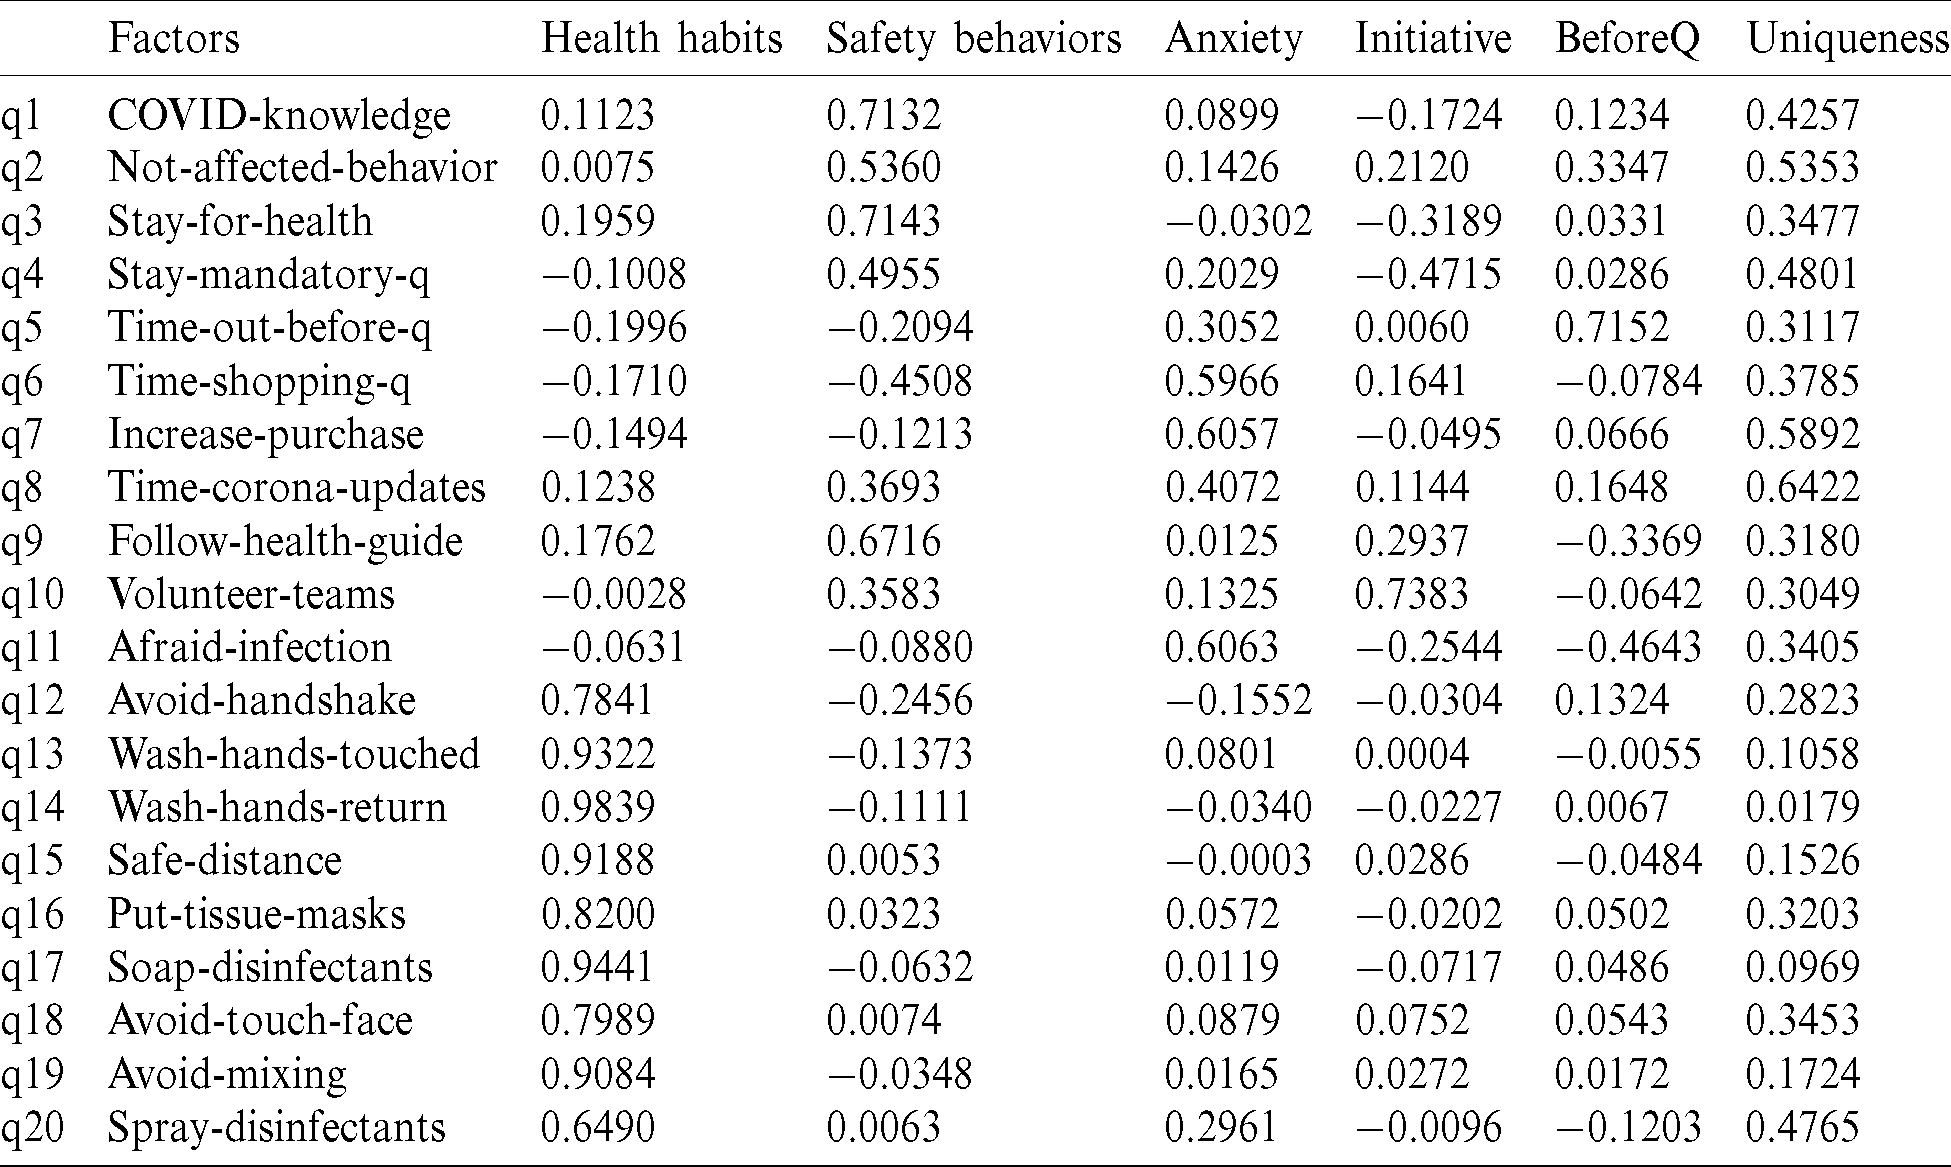
The first principal component accounts for the maximum of the variance in the data. The uniqueness is the proportion of the variance of the variable that is not explained by common factors. It should be noted that a greater “uniqueness” is associated with a lower relevance of the variable in the factor model. Generally, the extracted factors should account for at least 50% of a variable’s variance. Thus, the uniqueness values should be below 0.5. The KMO measure of sampling adequacy is equal to 0.889, which indicates that the items correlate sufficiently [35]. The score of Bartlett’s test of sphericity is significant ( ), which indicates that the components used are not correlated and are suitable for use in factor analysis (i.e., the correlation matrix is not an identity matrix). Thus, the results of factor analysis will be appropriate [35]. In addition, the likelihood ratio (LR) test of the independent versus saturated model gives
 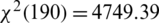 with a
  . This indicates that a no-factor (independent) model does not fit the observed correlation matrix significantly in a way that is better than the saturated or the perfect-fit model. The first three retained axes show that these factors correspond to what would be easily considered health habits, safety behaviors, and anxiety. We calculate the new composite scores as the means of the items related to each factor. (Their continuous values are between 1 and 5).
4.2 Results of the Regression Tree Analysis
The regression trees help us to better understand the interactions between the independent variables and the possible complementarity (or substitutability) that can exist between them in relation to health habits, safety behaviors, or anxiety. In the trees below, we include the five variables (nationality, gender, age, education, and monthly income) as characteristics that are potentially related to the individual behaviors. They explore which combinations of the characteristics are associated with high (or low) expected values of health habits, safety behaviors, or anxiety. The regression trees select the more relevant variables and are read from the root upwards [58].
Fig. 2a shows that the initial split of the health habits was effected by the gender variable (which plays a predominant role), with affirmation of that item leading to a second item on the left, which is the average monthly income for male gender. Node 2, on the right side of the tree in Fig. 2a, shows the data related to the variable “age” for female gender. The highest expected value of the composite factor (health habit) is observed on the right side of the tree, when 44 women are more than 30 years old with an expected mean  and 30 women are below 30 years old with an expected mean
  . The second node, on the left side, indicates that the best variable to classify and predict health habits is the average monthly income for the men. We observe that 155 men with a monthly income of more than 10,000 riyals have an expected mean of 3.841. The regression tree in Fig. 2c also provides useful information on the variables used at each split of the main determinants of the safety behavior index. The variables used in the final regression tree were as follows: monthly income, nationality, and age. The first split used to bifurcate the data was the monthly income (Fig. 2b). The persons with an average monthly income above 20,000 riyals were found to have an expected safety behavior index of 3.45 (n = 24 persons). The highest expected value of the composite factor (more than 4) can be observed on the right side of the tree for Saudi citizens with an average monthly income under 20,000 riyals. For persons above 30 years old, the expected mean is
  (n = 175 persons). For Saudi citizens aged under 30 years old and with an average monthly income above 13.5 thousand riyals,
  .
.
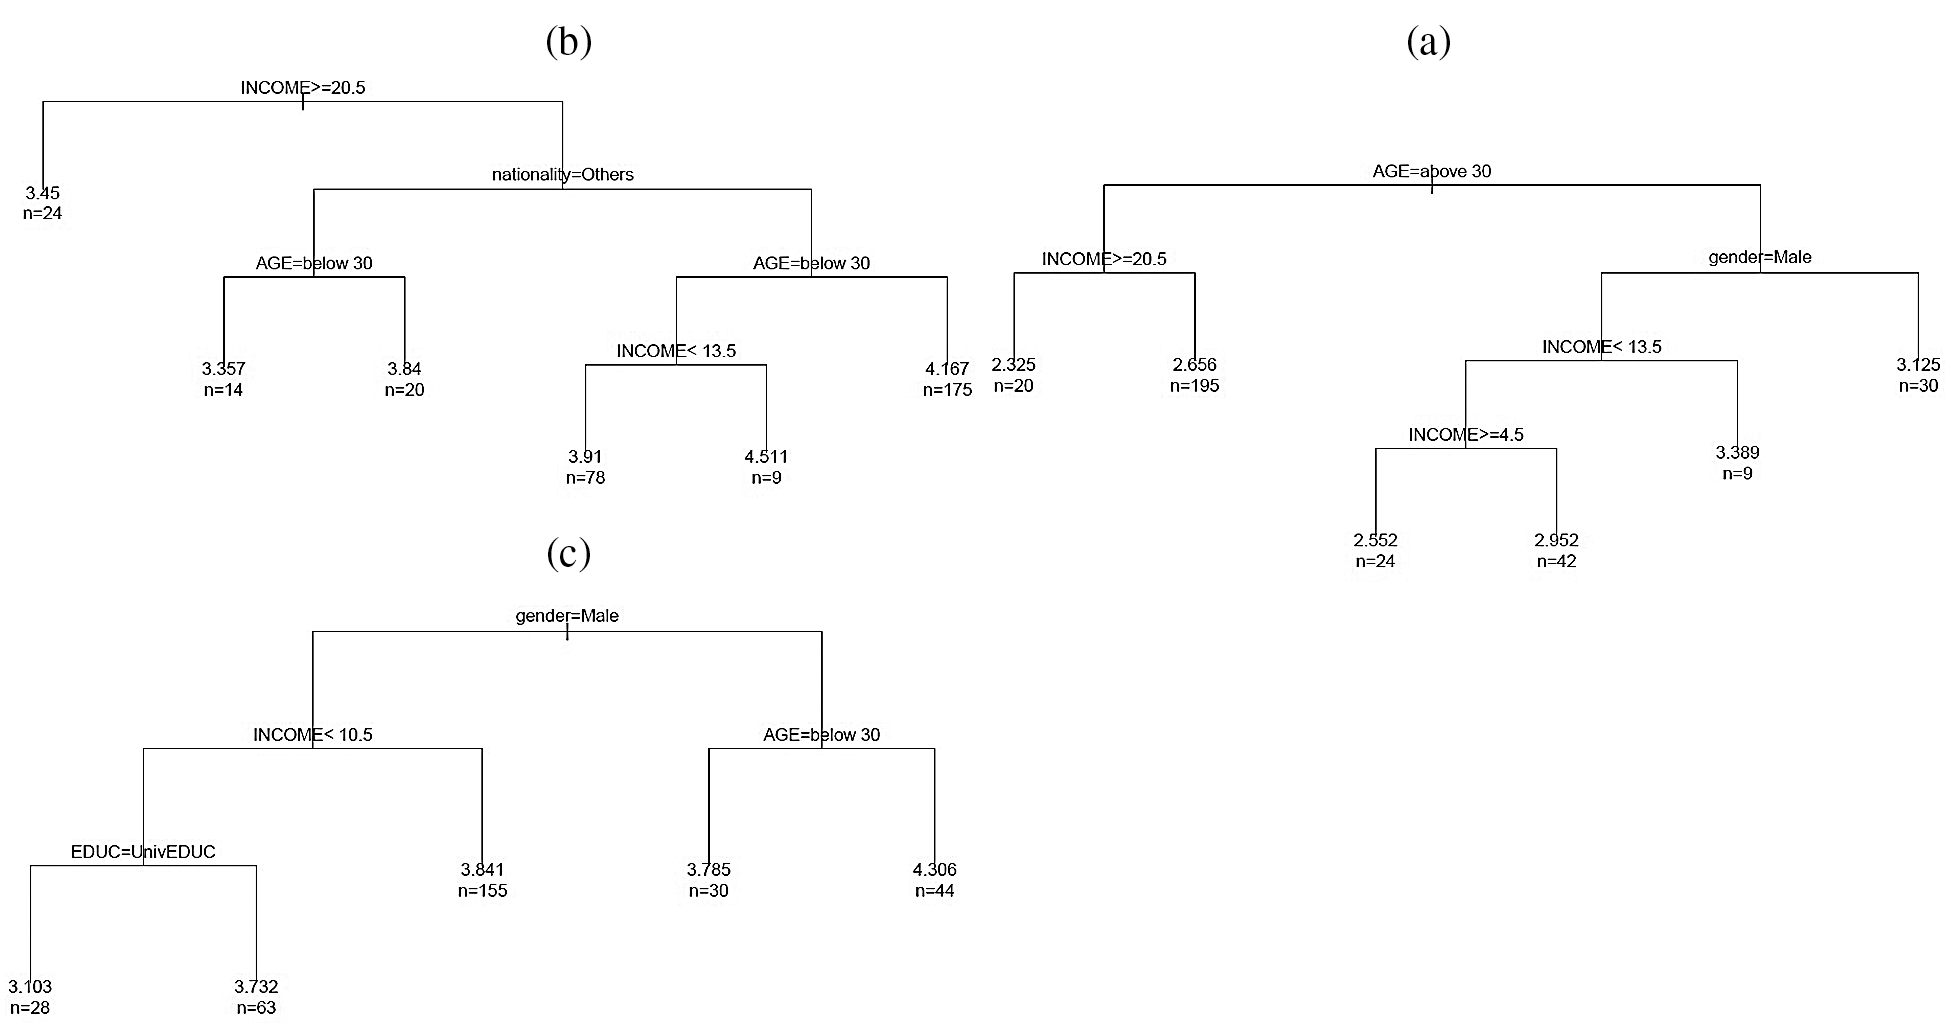
Figure 2: (a) Determinants of health habit ( ), (b) determinants of safety behavior (
 ) and (c) determinants of anxiety (
 )
)
Fig. 2c displays the tree model predicting the calculated anxiety factor. The model yielded a total of three predictor variables: Age, gender, and monthly income. The age variable is the first partitioning predictor in the regression tree model. All the terminal nodes predicted a low expected level of anxiety (less than 3).
This section presents and describes the results of the SVMR model to predict health habits, safety behaviors, and anxiety from COVID-19 in Saudi Arabia. We have considered five independent variables, which are as follows: age, income, education, gender, and nationality. The dependent variables are health habits, safety behaviors, and anxiety scores. The min-m method was employed to normalize the data.
Tab. 4 summarizes the empirical results of the health habits factors with the independent variables. The analysis results show that income, gender and nationality have a positive relationship with health habits. The significant results are 99.59%, 95.55%, and 95.55% with respect to the R2 metric. It is noted that the income, gender, and nationality variables have a strong relationship with health habits. Figs. 3a–3d show the performance of the SVMR model for estimating the health habits factors related to COVID-19.
Table 4: SVMR results of health habits factors
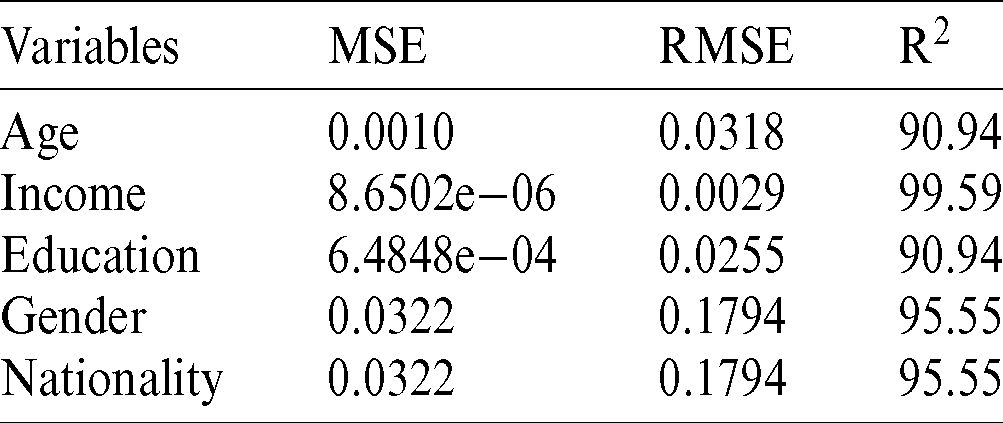
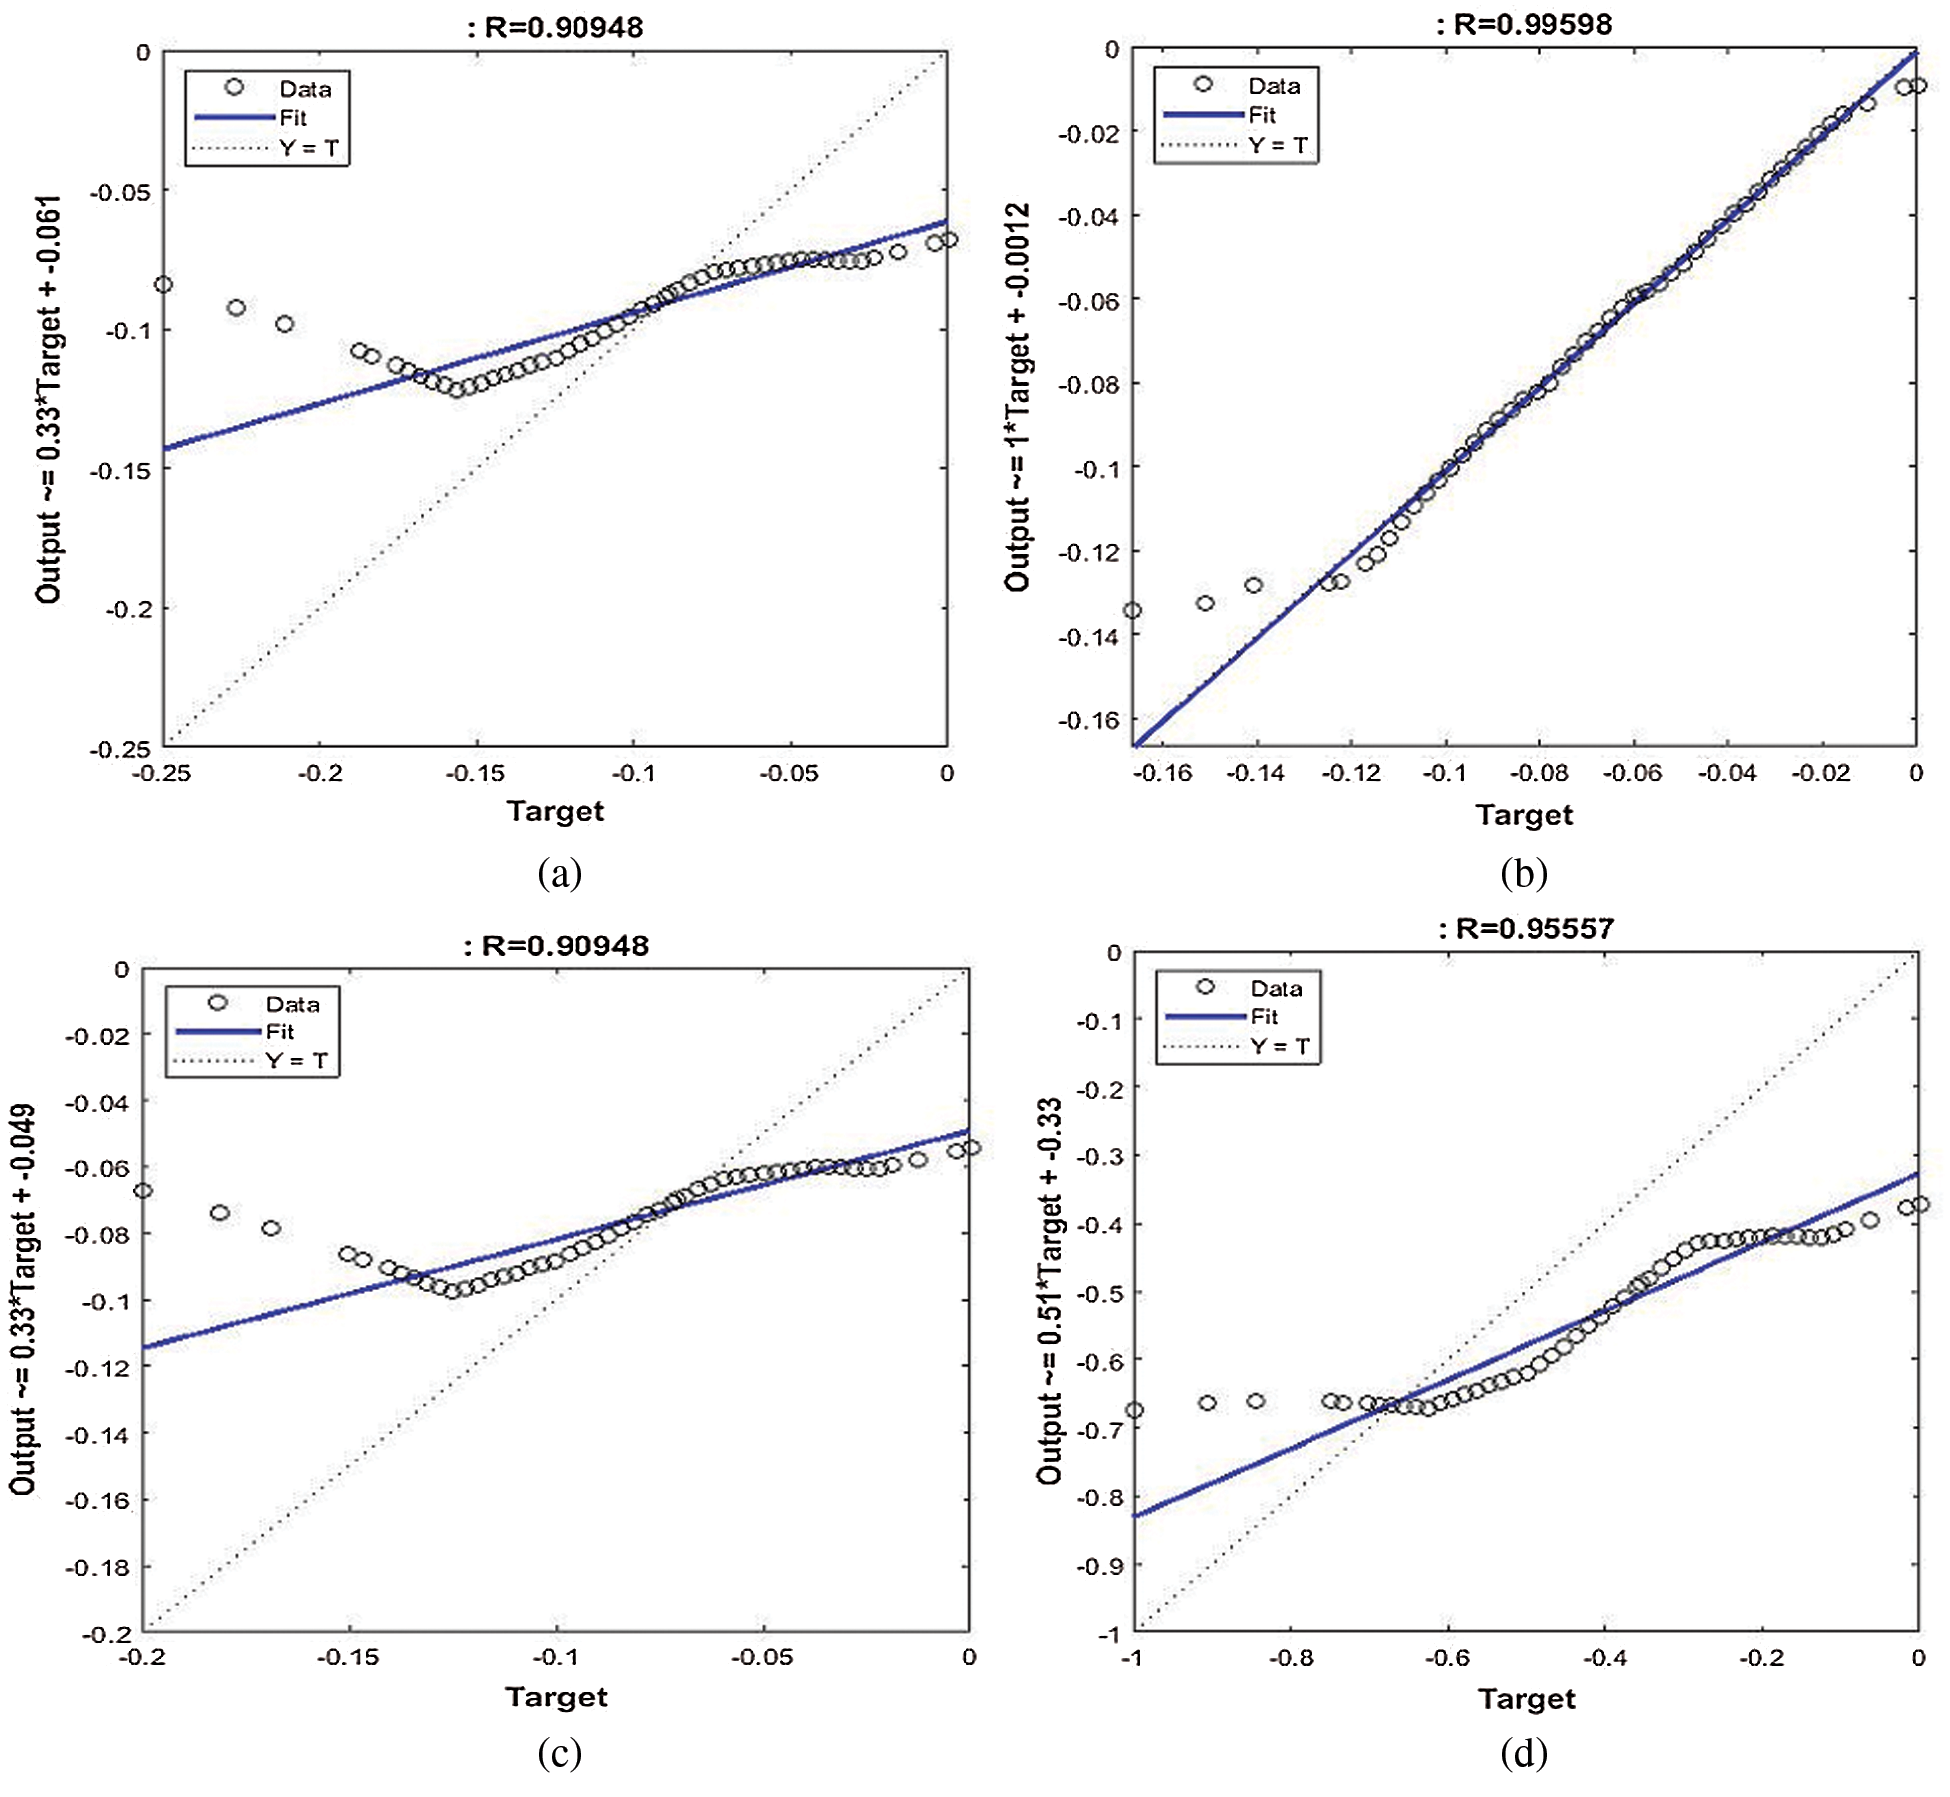
Figure 3: Performance of SVM regression model for health habits factor. (a) Age, (b) income, (c) education, (d) nationality and gender
Tab. 5 demonstrates the results of the SVMR model to discover the correlation between the independent variables of age, income, education, and nationality and the dependent safety behavior factor. From the prediction results, it is indicated that the income and age variables have more association with the safety behavior factor in relation to COVID-19. The regression result of income with safety behaviors factors is  , whereas the relationship between the age and safety behaviors factors is
  . Figs. 4a–4e illustrates the performance of SVMR for estimating the health habits factors related to COVID-19. It is concluded that the income and age variables have a strong relationship with the safety behavior factor.
Table 5: SVM regression results of safety behavior factor
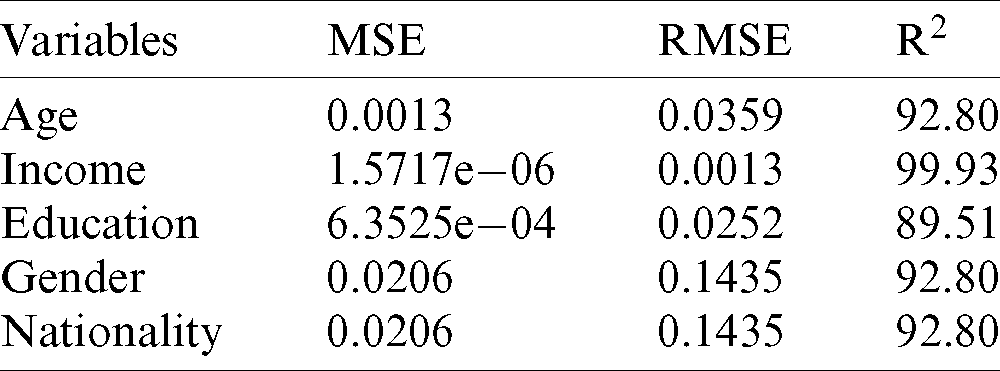
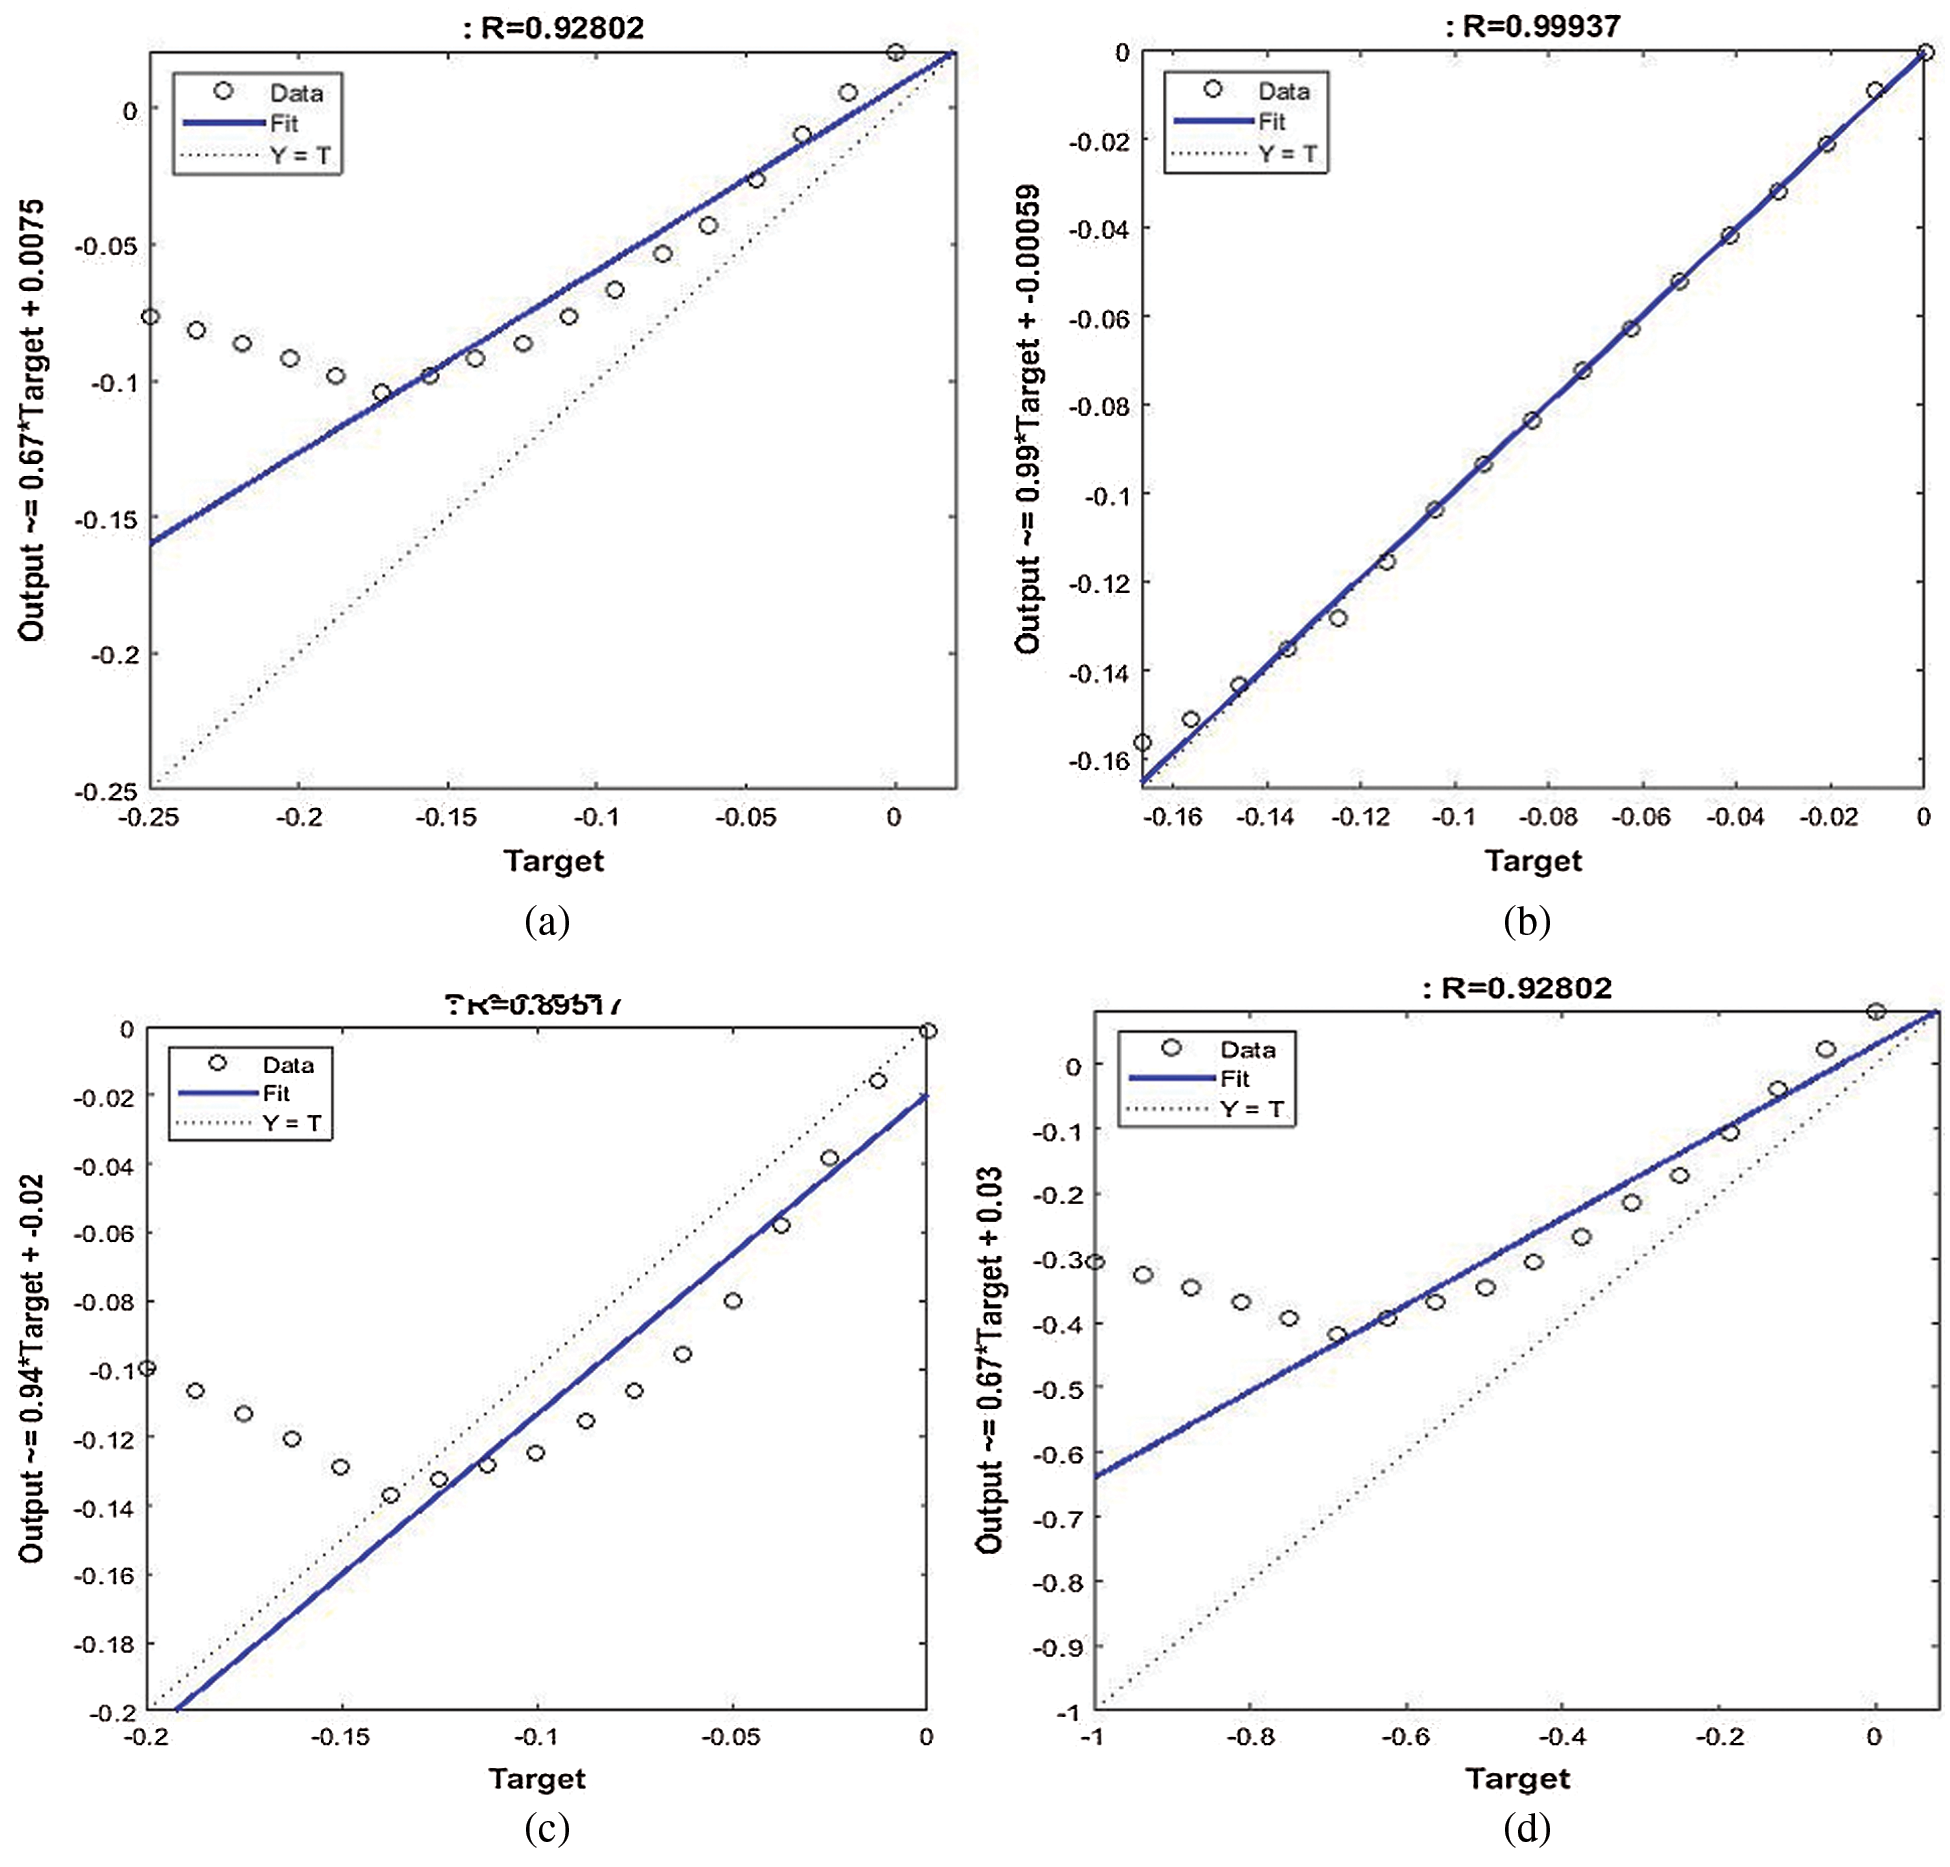
Figure 4: Performance of SVM regression model for safety behavior factor. (a) Age, (b) income, (c) education, (d) nationality and gender
Tab. 6 summarizes the output of the SVMR model to predict the relationship between the independent variables and anxiety-dependent factors related to COVID-19 in Saudi society. It discloses that all variables of the proposed research (independents and dependents) have the strongest positive relationship with each other. Among them, there are relationships between the income and education variables and the anxiety factor. It is noted that these positive relationships are 99.88% and 87.87% in terms of the R2 metric. Figs. 5a–5e show the performance of the SVMR model to estimate independent variables, such as age, income, education, and nationality, with the anxiety factor (dependent variable) in relation to COVID-19. We conclude that income and education have a positive influence on the anxiety factor in Saudi society during the COVID-19 outbreak.
Table 6: SVMR results of the anxiety factor
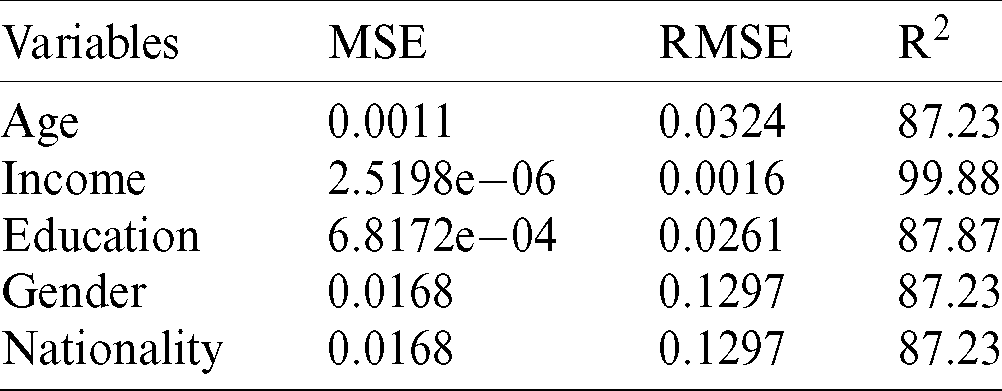
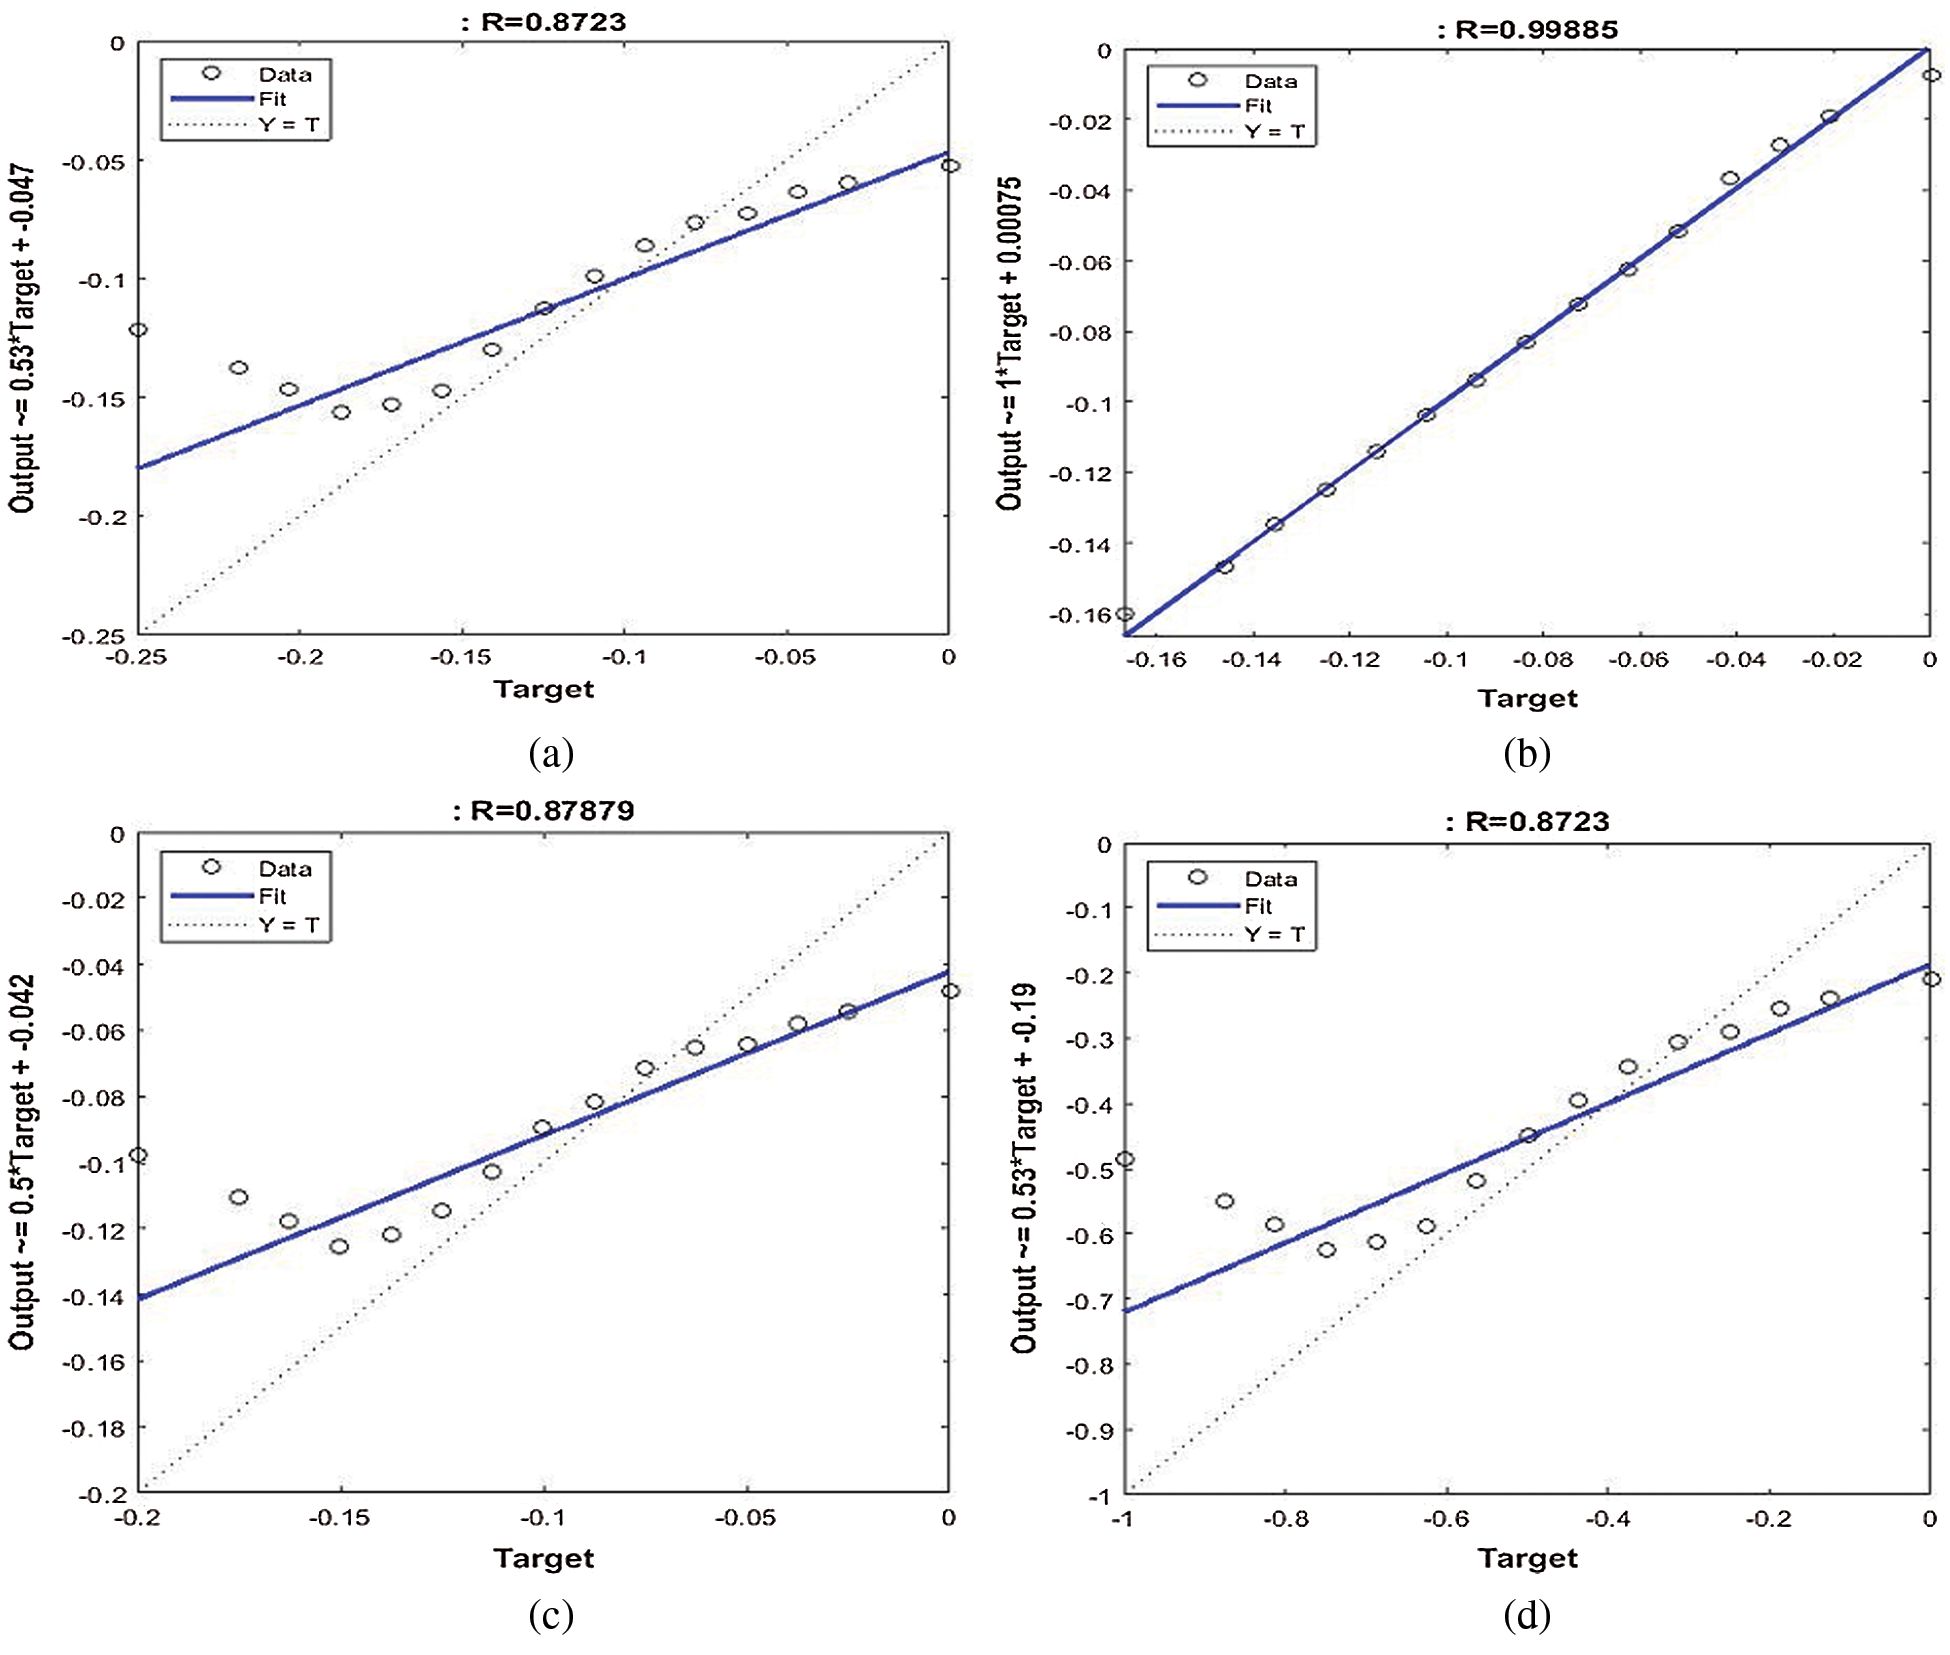
Figure 5: Performance of the SVMR model for the anxiety factor. (a) Age, (b) income, (c) education, (d) gender and nationality
This paper provides insights into the correlation between health habits, safety behaviors, and anxiety on the one hand and age, gender, nationality, income, and citizenship factors on the other. It investigates individual behaviors during the COVID-19 pandemic in Saudi Arabia. Which combinations of the characteristics favor the psycho-behavioral responses to COVID-19 in Saudi Arabia? We used regression trees to answer this question. The regression tree analysis was performed to identify relevant discriminating factors (age, gender, nationality, income, and citizenship) that affect individual behavior during the COVID-19 pandemic. The scores calculated using principal factor analysis were used as continuous variables in our analysis.
For each index, Tab. 7 gives the combinations of characteristics that correspond to the lowest and highest average expected scores. This table summarizes the paths as they appear in the regression trees. A score is considered high if its expected value is more than 4 and low if its mean is less than 3. The numbers in parentheses give the order of importance (level) of the corresponding factors.
Table 7: Paths to the lowest and highest expected scores
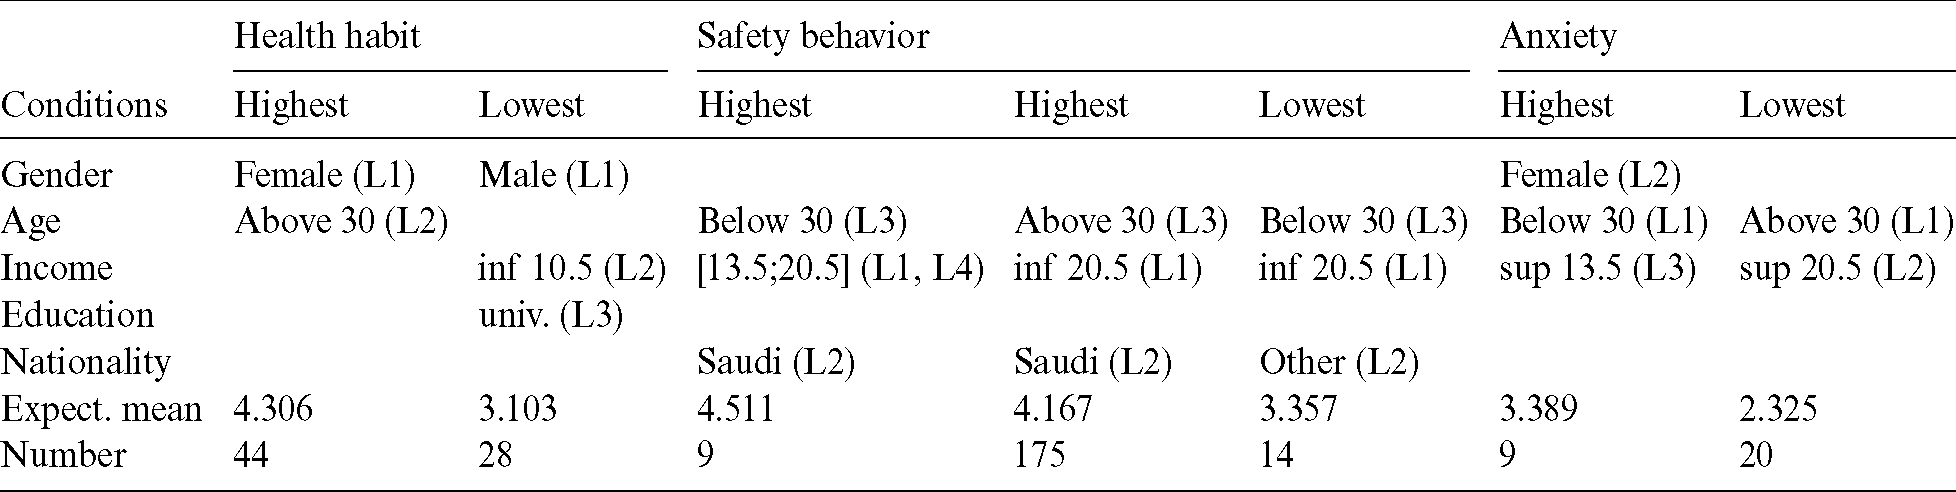
It should be noted that women over 30 years of age have a high expected mean for the health habit index, whereas they have a somewhat high average of anxiety if they are under 30 years old. Women spend a lot of time shopping, and their food purchases increase during the quarantine period. They spend a lot of time keeping track of coronavirus updates via news channels and social media. Furthermore, women feel afraid of infection with the coronavirus whenever they feel similar symptoms. However, men with an average monthly income of less than 10,500 Saudi riyals and a university education show a somewhat high average health habit score. The health habit index consists of nine items (q12 to q20) that focus on the extent of behavioral change toward the commitment to use the health and protection methods related to COVID-19. We also note that people aged over 30 years have the lowest expected score for anxiety ( , n = 175) but the highest scores for health habit (
 ; n = 44) and safety behaviors (
 , n = 175). Participant responses indicate that the respondents have more knowledge of COVID-19 and the methods of prevention. Quarantine has not affected their behavior in general, but they avoid leaving the house frequently because of fear of infection and to support public health. The responses indicate that respondents do not leave the house frequently because of the mandatory quarantine. However, the findings show that only nine respondents aged below 30 years have higher expected scores for safety behaviors. Moreover, Fig. 2 highlight that the average monthly income plays predominant and contrasting roles in health habits, safety behaviors, and anxiety during the COVID-19 pandemic period. Saudi citizens have a higher predicted average score of safety behaviors than other residents do.
The results indicate that 87.8% of the respondents were experiencing mild anxiety and 12.2% moderate anxiety during the COVID-19 outbreak, where the predicted means were between 3 and 4. Unfortunately, the results do not show whether economic effects and effects on daily life, or delays in economic activities, are positively associated with anxiety symptoms. Social support may be negatively correlated with the level of anxiety regarding the COVID-19 epidemic [59]. Similarly, the place of residence and the source of income affect the anxiety level resulting from COVID-19 [59]. The respondents’ anxiety may be related to the place of residence, the source of income, and the effect of the coronavirus on their employment or studies [60–62]. The differences between individuals’ behaviors could potentially be explained by the imbalance of economic, cultural, and educational resources in urban versus rural areas. Some regions are relatively prosperous and provide citizens with more sanitary conditions, which are better in cities than in towns and villages [63,64]. The stability of family income is a factor in experiencing anxiety during the coronavirus period, which could be explained by increased psychological and economic pressure [60]. Because of the outbreak, some families will lose their source of income, and individuals might feel anxious about their financial obligations and daily expenses.
The coronavirus pandemic has had an extensive psychological impact on the Saudi Arabian population. This paper assessed empirical evidence on the role of sociodemographic characteristics (gender, age, nationality, education, and average monthly income) in psycho-behavioral responses in Saudi Arabia. Regression tree and SVMR model analyses were performed to identify relevant discriminating factors (age, gender, nationality, income, and citizenship) that affect individual behavior during the COVID-19 pandemic. This permitted a better understanding of the interactions between the independent factors and the possible complementarity (or substitutability) that can exist between them in relation to health habits, safety behaviors, or anxiety scores. The scores were calculated using PCF analysis used as continuous variables in our analysis. It was revealed that the age variable plays a predominant role in health habits, safety behaviors, and anxiety according to the regression tree analysis model, whereas the SVMR model demonstrated that the income variable has a strong and positive relationship with health habits, safety behaviors, and anxiety factors. The health habit index, which focuses on the extent of behavioral change toward the commitment to use the health and protection methods related to COVID-19, is highly affected by the gender and age factors. We found that women over 30 years of age had a high expected mean on the health habit index, whereas women under 30 years old had a medium average for anxiety. The average monthly income was also a relevant factor, but it had contrasting effects on health habits, safety behaviors, and anxiety during the COVID-19 pandemic period.
This study could serve as a basis for future in-depth research papers on the effect of COVID-19 on MENA countries, where a woefully limited number of studies has been published. Despite the robust findings in the current study and the importance of the topic related to the analysis of the effect of COVID-19 on individual behavior, which is under-represented in the literature, we note several limitations of our research. Specifically, this study only included people who had smartphones, email addresses, and the ability to speak Arabic and English. Saudi Arabia has different communities that do not speak Arabic or English, including Indian, Bangladeshi, and Indonesian communities, and they were not represented. As another limitation, most of the respondents were relatively educated; this study could be improved by including non-educated people to increase awareness and mental health care in all Saudi communities in future possible epidemics. As a final limitation, the respondents of the current study mostly belonged to the Saudi nationality; thus, including other nationalities in future research could enhance the mental healthcare systems.
Funding Statement: The author(s) received no specific funding for this study.
Conflicts of Interest: The authors declare that they have no conflicts of interest to report regarding the present study.
1. M. A. Mohammed, K. H. Abdulkareem, A. S. Al. Waisy, S. A. Mostafa, S. Alfahdawet al. (2020). , “Benchmarking methodology for selection of optimal COVID-19 diagnostic model based on entropy and TOPSIS methods,” IEEE Access, vol. 8, pp. 99115–99131. [Google Scholar]
2. M. Marchiori. (2020). “COVID-19 and the social distancing paradox: dangers and solutions,” Arxiv Preprint arXiv: 2005.12446. [Google Scholar]
3. T. C. Reluga. (2010). “Game theory of social distancing in response to an epidemic,” PLoS Computational Biology, vol. 6, no. 5, pp. e1000793. [Google Scholar]
4. J. K. Kelso, G. J. Milne and H. Kelly. (2009). “Simulation suggests that rapid activation of social distancing can arrest epidemic development due to a novel strain of influenza,” BMC Public Health, vol. 9, no. 117, pp. 261. [Google Scholar]
5. P. Caley, D. J. Philp and K. McCracken. (2008). “Quantifying social distancing arising from pandemic influenza,” Royal Society Interface, vol. 5, no. 23, pp. 631–639. [Google Scholar]
6. R. Glass, L. Glass, W. Beyeler and H. Min. (2006). “Targeted social distancing designs for pandemic influenza,” Emerging Infectious Diseases, vol. 12, no. 11, pp. 1671–1681. [Google Scholar]
7. A. Wilder-Smith, C. J. Chiew and V. J. Lee. (2020). “Can we contain the COVID-19 outbreak with the same measures as for SARS?,” Lancet Infectious Diseases, vol. 20, no. 5, pp. e102–e107. [Google Scholar]
8. M. Loey, F. Smarandache and M. Khalifa. (2020). “The lack of chest COVID-19 X-ray dataset: A novel detection model based on gan and deep transfer learning,” Symmetry, vol. 12, no. 14, pp. 1–19. [Google Scholar]
9. Y. Fan, K. Zhao, Z. L. Shi and P. Zhou. (2019). “Bat coronaviruses in China,” Viruses, vol. 11, no. 3, pp. 210–224. [Google Scholar]
10. D. Cyranoski. (2020). “Did pangolins spread the China coronavirus to people?,” Nature, vol. 10, pp. 979. [Google Scholar]
11. M. Olff. (2017). “Sex and gender differences in post-traumatic stress disorder: An update,” European Journal of Psychotraumatology, vol. 8, no. 4, 1351204. [Google Scholar]
12. T. G. Ksiazek, D. Erdman, C. S. Goldsmith, S. R. Zaki, T. Peret et al. (2003). , “A novel coronavirus associated with severe acute respiratory syndrome,” New England Journal of Medicine, vol. 348, no. 20, pp. 1953–1966. [Google Scholar]
13. E. A. Holmes, R. C. O’Connor, V. H. Perry, I. Tracey, S. Wessely et al. (2020). , “Multidisciplinary research priorities for the COVID-19 pandemic: A call for action for mental health science,” Lancet Psychiatry, vol. 7, no. 6, pp. 547–560. [Google Scholar]
14. S. A. Lee. (2020). “Coronavirus anxiety scale: A brief mental health screener for COVID-19 related anxiety,” Death Studies, vol. 44, no. 7, pp. 393–401. [Google Scholar]
15. D. Baud, X. Qi, K. Nielsen-Saines, D. Musso, L. Pomar et al. (2020). , “Real estimates of mortality following COVID-19 infection,” Lancet Infectious Diseases, vol. 20, no. 7, pp. 773. [Google Scholar]
16. S. X. Jiang, M. Coffee, A. Bari, J. Wang, X. Jiang et al. (2020). , “Towards an artificial intelligence framework for data-driven prediction of coronavirus clinical,” Computers, Materials & Continua, vol. 63, no. 1, pp. 537–551. [Google Scholar]
17. A. H. Mehrsafar, P. Gazerani, A. Moghadam Zadeh and J. C. J. Sánchez. (2020). “Addressing potential impact of COVID-19 pandemic on physical and mental health of elite athletes,” Brain, Behavior, and Immunity, vol. 87, pp. 147–148. [Google Scholar]
18. F. Rezaeetalab, M. Mozdourian, M. Amini, Z. Javidarabshahi and F. Akbari. (2020). “COVID-19: A new virus as a potential rapidly spreading in the worldwide,” Cardio-Thoracic Medicine, vol. 8, no. 1, pp. 563–564. [Google Scholar]
19. P. Brennan and R. Oeppen. (2020). “Safe healthcare teams during the coronavirus outbreak,” Oral & Maxillofacial Surgery, vol. 58, no. 3, pp. 254–255. [Google Scholar]
20. J. Everts. (2013). “Announcing swine flu and the interpretation of pandemic anxiety,” Antipode, vol. 45, no. 4, pp. 809–825. [Google Scholar]
21. J. F. W. Chan, S. Yuan, K. H. Kok, K. K. W. To, H. Chu et al. (2020). , “A familial cluster of pneumonia associated with the 2019 novel coronavirus indicating person-to- person transmission: A study of a family cluster,” Lancet, vol. 395, no. 10223, pp. 514–523. [Google Scholar]
22. D. Roy, S. Tripathy, S. K. Kar, N. Sharma, S. K. Verma et al. (2020). , “Study of knowledge, attitude, anxiety & perceived mental healthcare need in Indian population during COVID-19 pandemic,” Asian Journal of Psychiatry, vol. 51, 102083. [Google Scholar]
23. S. K. Brooks, R. K. Webster, L. E. Smith, L. Woodland, S. Wessely et al. (2020). , “The psychological impact of quarantine and how to reduce it: Rapid review of the evidence,” Lancet, vol. 395, no. 10227, pp. 912–920. [Google Scholar]
24. B. L. Zhong, W. Luo, H. M. Li, Q. Q. Zhang, X. G. Liu et al. (2020). , “Knowledge, attitudes, and practices towards COVID-19 among Chinese residents during the rapid rise period of the COVID-19 outbreak: A quick online cross-sectional survey,” Biological Sciences, vol. 16, no. 10, pp. 1745–1752. [Google Scholar]
25. IOM (Institute of Medicine). (2011). Preventing transmission of pandemic influenza and other viral respiratory diseases: Personal protective equipment for healthcare personnel: Update 2010. Washington, DC: The National Academies Press. [Google Scholar]
26. S. M. ElZoghby, E. M. Soltan and H. M. Salama. (2020). “Impact of the COVID pandemic on mental health and social support among adult Egyptians,” Community Health, vol. 287, pp. 1–7. [Google Scholar]
27. A. A. Habeeb and N. Qureshi. (2010). “Mental and social health Atlas I in Saudi Arabia: 2007-08,” Eastern Mediterranean Health, vol. 16, no. 5, pp. 570–577. [Google Scholar]
28. A. Bener, M. Abou-Saleh, E. Dafeeah and D. Bhugra. (2015). “The prevalence and burden of psychiatric disorders in primary health care visits in Qatar: Too little time?,” Family Medicine and Primary Care, vol. 4, no. 1, pp. 89–95. [Google Scholar]
29. T. H. Aldhyani, A. S. Alshebami and M. Y. Alzahrani. (2020). “Soft computing model to predict chronic diseases,” Information Science and Engineering, vol. 36, no. 2, pp. 365–376. [Google Scholar]
30. L. J. Cronbach. (1951). “Coefficient alpha and the internal structure of tests,” Psychometrika, vol. 16, no. 3, pp. 297–334. [Google Scholar]
31. S. Makkar and S. Basu. (2017). “The impact of emotional intelligence on workplace behaviour: A study of bank employees,” Global Business Review, vol. 20, no. 2, pp. 458–478. [Google Scholar]
32. J. M. Cortina. (1993). “What is coefficient alpha? an examination of theory and applications,” Applied Psychology, vol. 78, no. 1, pp. 98–104. [Google Scholar]
33. E. Mooi, M. Safirstedt and I. Mooi-Reci. (2017). Market research: The process, data, and methods using Stata. Singapore: Springer. [Google Scholar]
34. O. Kammoun and M. Rahmouni. (2014). “Appropriation instruments and innovation activities: Evidence from Tunisian firms,” International Journal of Innovation and Technology Management, vol. 11, no. 6, pp. 1450046. [Google Scholar]
35. M. Kaiser. (1974). “Kaiser-Meyer-Olkin measure for identity correlation matrix,” Journal of the Royal Statistical Society, vol. 52, pp. 296–298. [Google Scholar]
36. A. G. Reece, A. J. Reagan, K. L. Lix, P. S. Dodds et al. (2017). , ”Forecasting the onset and course of mental illness with twitter data,” Scientific Report, vol. 7, no. 13006, pp. 1–10. [Google Scholar]
37. F. P. Holgado-Tello, S. Chacón-Moscoso, I. Barbero-García and I. Vila-Abad. (2008). “Polychoric versus pearson correlations in exploratory and confirmatory factor analysis of ordinal variables,” Quality & Quantity, vol. 44, no. 1, pp. 153–166. [Google Scholar]
38. R. H. Hoyle and J. L. Duvall. (2004). “Determining the number of factors in exploratory and confirmatory factor analysis,” in Handbook of Quantitative Methodology for the Social Sciences, D. Kaplan (Eds.New York: SAGE Publications, Inc., pp. 301–315. [Google Scholar]
39. M. Sarstedt and E. Mooi. (2019). A Concise Guide to Market Research: The Process, Data, and Methods Using IBM SPSS Statistics. Berlin Heidelberg: Springer. [Google Scholar]
40. J. L. Horn. (1965). “A rationale and test for the number of factors in factor analysis,” Psychometrika, vol. 30, no. 2, pp. 179–185. [Google Scholar]
41. S. J. Cho, F. Li and D. Bandalos. (2009). “Accuracy of the parallel analysis procedure with polychoric correlations,” Educational and Psychological Measurement, vol. 69, no. 5, pp. 748–759. [Google Scholar]
42. L. Yang, S. Liu, S. Tsoka and L. G. Papageorgiou. (2017). “A regression tree approach using mathematical programming,” Expert Systems with Applications, vol. 78, pp. 347–357. [Google Scholar]
43. W. Venables and B. Ripley. (1999). Modern applied statistics with S-PLUS. 3rd ed., New York: Springer. [Google Scholar]
44. A. D’Ambrosio, M. Aria, C. Iorio and R. Siciliano. (2017). “Regression trees for multivalued numerical response variables,” Expert Systems with Applications, vol. 69, pp. 21–28. [Google Scholar]
45. T. H. H. Aldhyani, M. Alrasheedi, A. A. Alqarni, M. Y. Alzahrani and A. M. Bamhdi. (2020). “Intelligent hybrid model to enhance time series models for predicting network traffic,”IEEE Access, vol. 8, pp. 130431–130451. [Google Scholar]
46. P. Geurts, A. Irrthum and L. Wehenkel. (2009). “Supervised learning with decision tree-based methods in computational and systems biology,” Molecular BioSystems, vol. 5, no. 12, pp. 1593–1605. [Google Scholar]
47. V. Rodriguez-Galiano, M. Sanchez-Castillo, M. Chica-Olmo and M. Chica-Rivas. (2015). “Machine learning predictive models for mineral prospectively: An evaluation of neural networks, random forest, regression trees and support vector machines,” Ore Geology Reviews, vol. 71, pp. 804–818. [Google Scholar]
48. C. D. Sutton. (2005). “Classification and regression trees, bagging, and boosting,” Handbook of Statistics, vol. 24, pp. 303–329. [Google Scholar]
49. M. Rahmouni, M. Ayadi and M. Yildizoglu. (2010). “Characteristics of innovating firms in Tunisia: The essential role of external knowledge sources,” Structural Change and Economic Dynamics, vol. 21, no. 3, pp. 181–196. [Google Scholar]
50. L. Breiman, J. Friedman, C. J. Stone and R. A. Olshen. (1984). Classification and Regression Trees. Boca Raton: CRC Press. [Google Scholar]
51. M. M. Najafabadi, F. Villanustre, T. M. Khoshgoftaar, N. Seliya, R. Wald. (2015). “Deep learning applications and challenges in big data analytics,” Big Data, vol. 2, no. 1, pp. 2–21. [Google Scholar]
52. V. Vapnik. (2013). The Nature of Statistical Learning Theory. Berlin: Springer Science & Business Media. [Google Scholar]
53. G. Mercier and M. Lennon. (2003). “Support vector machines for hyperspectral image classification with spectral-based kernels,” in Proc. IEEE Int. Geoscience and Remote Sensing Sym. (IGARSS 2003IEEE, pp. 288–290. [Google Scholar]
54. M. Pal and P. M. Mather. (2004). “Assessment of the effectiveness of support vector machines for hyperspectral data,” Future Generation Computer Systems, vol. 20, no. 7, pp. 1215–1225. [Google Scholar]
55. T. Rumpf, A. K. Mahlein, U. Steiner, E. C. Oerke, H. W. Dehne et al. (2010). , “Early detection and classification of plant diseases with support vector machines based on hyperspectral reflectance,” Computers and Electronics in Agriculture, vol. 74, no. 1, pp. 91–99. [Google Scholar]
56. U. Thissen, R. Van Brakel, A. De-Weijer, W. Melssen and L. Buydens. (2003). “Using support vector machines for time series prediction,” Chemometrics and Intelligent Laboratory Systems, vol. 69, no. 1–2, pp. 35–49. [Google Scholar]
57. C. H. Wu, J. M. Ho and D. T. Lee. (2004). “Travel-time prediction with support vector regression,” IEEE Transactions on Intelligent Transportation Systems, vol. 5, no. 4, pp. 276–281. [Google Scholar]
58. A. Blanch and A. Aluja. (2013). “A regression tree of the aptitudes, personality, and academic performance relationship,” Personality and Individual Differences, vol. 54, no. 6, pp. 703–708. [Google Scholar]
59. Q. Chen, M. Liang, Y. Li, J. Guo, D. Fei et al. (2020). , “Mental health care for medical staff in China during the COVID-19 outbreak,” Lancet Psychiatry, vol. 7, no. 4, pp. e15–e16. [Google Scholar]
60. W. Cao, Z. Fang, G. Hou, M. Han, X. Xu et al. (2020). , “The psychological impact of the COVID-19 epidemic on college students in China,” Psychiatry Research, vol. 287, 112934. [Google Scholar]
61. A. Cornine. (2020). “Reducing nursing student anxiety in the clinical setting: An integrative review,” Nursing Education Perspectives, vol. 41, no. 4, pp. 229–234. [Google Scholar]
62. Y. Yang, W. Li, Q. Zhang, L. Zhang, T. Cheung et al. (2020). , “Mental health services for older adults in China during the COVID-19 outbreak,” Lancet Psychiatry, vol. 7, no. 4, e19. [Google Scholar]
63. J. Shigemura, R. J. Ursano, J. C. Morganstein, M. Kurosawa and D. M. Benedek. (2020). “Public responses to the novel 2019 coronavirus (2019-nCoV) in Japan: Mental health consequences and target populations,” Psychiatry and Clinical Neurosciences, vol. 74, no. 4, pp. 281–282. [Google Scholar]
64. B. Tang, N. L. Bragazzi, Q. Li, S. Tang, Y. Xiao et al. (2020). , “An updated estimation of the risk of transmission of the novel coronavirus (2019-nCoV),” Infectious Disease Modelling, vol. 5, pp. 248–255. [Google Scholar]
 | This work is licensed under a Creative Commons Attribution 4.0 International License, which permits unrestricted use, distribution, and reproduction in any medium, provided the original work is properly cited. |