DOI:10.32604/cmc.2021.014803
| Computers, Materials & Continua DOI:10.32604/cmc.2021.014803 | |
| Article |
Medical Image Compression Based on Wavelets with Particle Swarm Optimization
1Department of Computer Science and Artificial Intelligence, Faculty of Computer Science and Engineering, University of Jeddah, Jeddah, Saudi Arabi
2Department of Computer Science, Faculty of Computers and Information, Sohag University, Sohag, Egypt
3Department of Computer Science and Mathematics, Faculty of Science, South Valley University, Qena, Egypt
*Corresponding Author: Monagi H. Alkinani. Email: malkinani@uj.edu.sa
Received: 18 October 2020; Accepted: 08 November 2020
Abstract: This paper presents a novel method utilizing wavelets with particle swarm optimization (PSO) for medical image compression. Our method utilizes PSO to overcome the wavelets discontinuity which occurs when compressing images using thresholding. It transfers images into subband details and approximations using a modified Haar wavelet (MHW), and then applies a threshold. PSO is applied for selecting a particle assigned to the threshold values for the subbands. Nine positions assigned to particles values are used to represent population. Every particle updates its position depending on the global best position (gbest) (for all details subband) and local best position (pbest) (for a subband). The fitness value is developed to terminate PSO when the difference between two local best (pbest) successors is smaller than a prescribe value. The experiments are applied on five different medical image types, i.e., MRI, CT, and X-ray. Results show that the proposed algorithm can be more preferably to compress medical images than other existing wavelets techniques from peak signal to noise ratio (PSNR) and compression ratio (CR) points of views.
Keywords: Image compression; wavelets; Haar wavelet; particle swarm algorithm; medical image compression; PSNR and CR
Compressing patient’s medical images is a rising demand nowadays in medical organizations due to the needs to archive and transfer large numbers of high resolutions images. Indeed, maintaining those images costs organizations powerful servers, wide network bandwidth and backup storage devices. The problem arises here is concerning the nature of these data itself, medical images need special care when performing compression. Losing important medical details in images may affect medical diagnose for patients. Therefore, any improvement in image compression methods would help storing and transferring medical history properly.
Many compressing algorithms have been proposed in this context, some of them utilizes wavelet family transforms. Haar wavelet method is a member of the family, it is considered as a popular image compression method due to its simplicity comparing to others. Nonetheless, the main disadvantages of the Haar wavelet is features discontinuity that leads to difficulties for simulating continuous signals [1–3].
In this paper, a modified Haar wavelet (MHW) algorithm for medical images compression is introduced. The algorithm combines Haar wavelet with PSO as a threshold value selection method. This modification assists in compressing medical image to maintain its purity and preserve fine details while keeping compression ratio high.
The proposed algorithm begins by subdivide the input image into four frequency subbands: one approximation and three detail coefficients. Haar wavelet is modified for this task in order to work with  matrices instead of whole image and to keep the approximation subband unchanged. We get one approximation of low subbands for row and column filtering (LL), high subbands for row filtering and low subbands for column filtering (HL), low subbands for row filtering and high subbands for columns filtering (LH), and high subbands for row and column filtering (HH). To sum up, nine subbands are obtained by applying MHW on the details (LL–HL–LH–HH).
A threshold is utilized for reducing search space of the coefficients while nine thresholds assigned to their positions are selected to represent subbands (one for each subband). We use these thresholds as particle candidates for the PSO algorithm. PSO is updated by the global best position (gbest) for all details subband and local best position (pbest) for a subband. We developed the fitness value to terminate the PSO to reach a target threshold. The proposed algorithm is implemented using various types of medical images with different sizes, and it is compared with other existing wavelets techniques. The algorithm achieved better result from PSNR and CR point of views.
This work is organized into five sections: Section 1 introduced the work. In Section 2, related work is depicted. Section 3 describes the proposed algorithm. The performance evaluation is shown in Section 4. We provided the experimental results in Section 5. Finally, the conclusion is presented in Section 6.
Medical image compression techniques can be categorized into two main types depending on the redundancy removal way, namely Lossless et al. [4–6]. Lossless allows the original image to be reconstructed exactly from the compressed image with low compression rate [7]. In contrast, lossy image compression characterized by degrading image quality because it does not reconstruct exactly the original image [8].
Wavelet transform considers a well-known technique that can work as lossy or lossless compression based on calculating thresholds in the details subbands [9]. Several wavelet types like Haar, Coiflet, Symlets, Daubechies, Biorthogonal, and (5/3) and (9/7) lifting schemes can be used for medical images compression [10]. The performance of these algorithms varies depending on its ability to decompose signal into low and high frequency components where thresholding process takes place for compression.
Rao et al. [11] had evaluated comparison analysis of image compression techniques based on Haar wavelets. Their studies concentrated on relation between compression efficiency and short processing time in case of data transfer over the internet or any channel. Zanaty et al. [12] combined wavelets by a region growing technique for compressing region of interest. Mohamed et al. [13] integrated Haar wavelet with quad tree to enhance mammogram image compression. Umezu et al. [14] introduced Z-map models depending on irreversible compression algorithm using a two-dimensional Haar wavelet transform in order to resolve tight memory situation for an ordinary PC, see [15] for more mathematical theories. Nahar et al. [16] proposed double density wavelets transform (DDW) for image compression based on discrete wavelets transform (DWT) [17]. Priya et al. [18] compressed medical image based fuzzy segmentation applying a fuzzy C-means clustering into a region of interest (ROI) and non-region of interest (NROI). ROI is compressed using DWT coding while NROI is compressed using well-known context adaptive variable length decoder. Benyahia et al. [19] used wavelet packet coupled with the progressive coder SPIHT for developing compression techniques for medical images by preserving detailed structures to produce high quality images. Reisenhofer et al. [20] presented Haar wavelet algorithm based on perceptual similarity index. The algorithm uses similarity measures for full reference image to evaluate quality level assessment. Vasanth et al. [21] mixed Haar wavelet with Huffman encoding for image compression. Rao et al. [22] examined the performance of principle component analysis (PCA) and wavelet difference reduction (WDR) techniques when applied to x-ray and CT images. Agarwal et al. [23] reviewed various image compression using wavelet-based methods including subband coding (SBC), decoding for medical pitch (EHT) [24] and transform coding (IATC). More compression technique is stated in [25,26] for combinational hybrid compression algorithm of medical image in [27,28] and to analyzing the relation between resultant image details of different granularities.
From the stated methods, we have noted that there is no universal algorithm for providing an optimal compression. Each algorithm has its own specific drawbacks like compressing ratio, speed, image types, or memory usage. Therefore, effort is needed in order to overcome such drawbacks.
3 Modified Haar Wavelet with PSO
In this section, we describe the proposed algorithm for medical image compression. The novelty of this algorithm is the use of POS for the shrinkage of the transforming coefficients. Fig. 1 shows the proposed compression scheme. In the following subsections, the compression steps of the proposed algorithm are described. First, the modified Haar wavelet transform step is explained. Then, the thresholding process is addressed. Finally, using the POS is discussed.
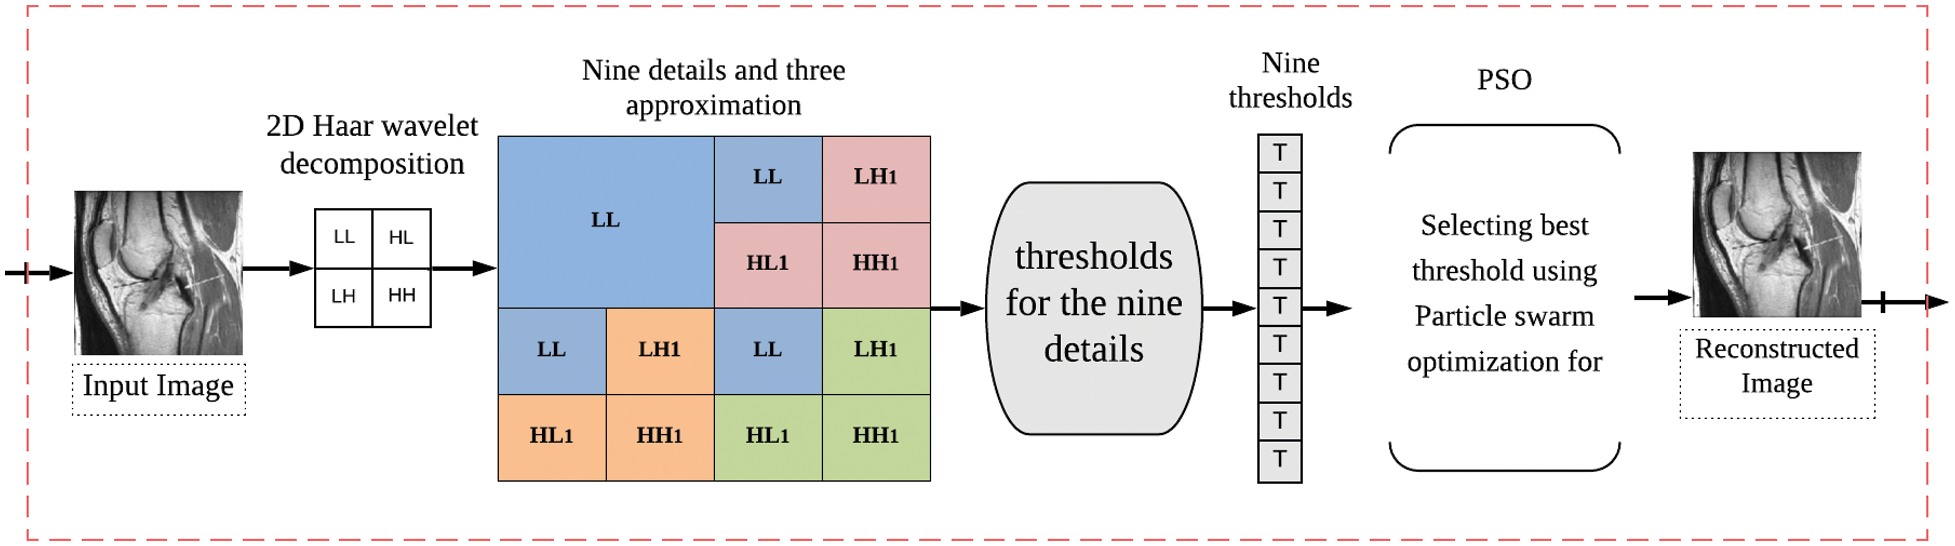
Figure 1: The proposed compression scheme
Haar wavelet transform is the simplest orthogonal wavelet transform, and it is computed by iterating difference and averaging between odd and even pixels of digital images. Haar wavelet transform can be utilized in various ways for compressing images by decomposing its matrix to sparser one [29–33]. In order to preserve more image quality and clarity, we modified Haar wavelet (MHW). MHW introduces a new transformation capable to achieve better compression results than the classical one in [34,35], and to reach better PSNR and CR values.
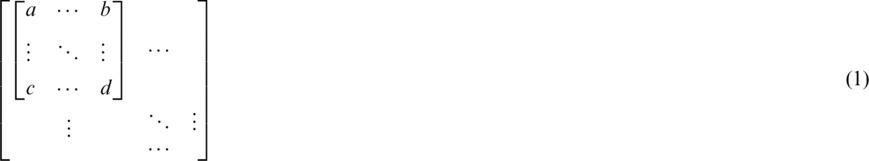
Instead of performing Haar wavelet levels on rows then perform the same step on resulting matrix (on columns) as what in [36–38], we make the one step transform just one time on all rows follow by one step transform on resulted columns as [39]. For that, we use MHW for dividing the original image of  dimensions into
  matrices and apply the transform as in Eqs. (1) and (2):
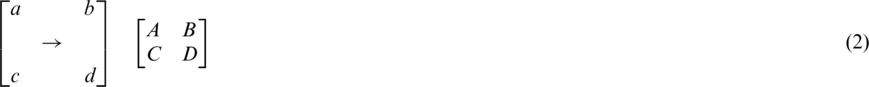
where values of A, B, C and D are calculated as follow:

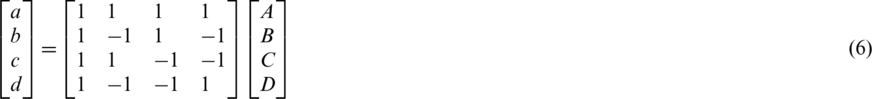
For reconstruction, we can gain a, b, c and d as follow:

Eq. (4) can be reformatted as:
In a similar way, the reconstruction equation:
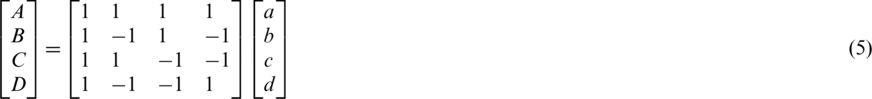
We use thresholding process in order to reduce searching space of coefficients. First, subbands coefficients are evaluated by applying MHW on the input image to obtain four subbands details (coefficients). This means that the positions in Eq. (1) are replaced by coefficients in Eq. (5) to become:
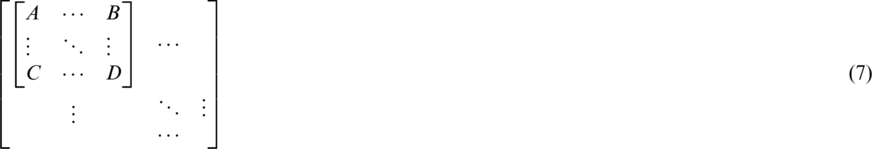
Redistributing the coefficients of this matrix to be:
where  , and
, and 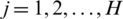 . In the four subbands, one is called approximation and three are called details (approximation LL—horizontal details LH—vertical details HL—diagonal details HH) as shown in Fig. 2.
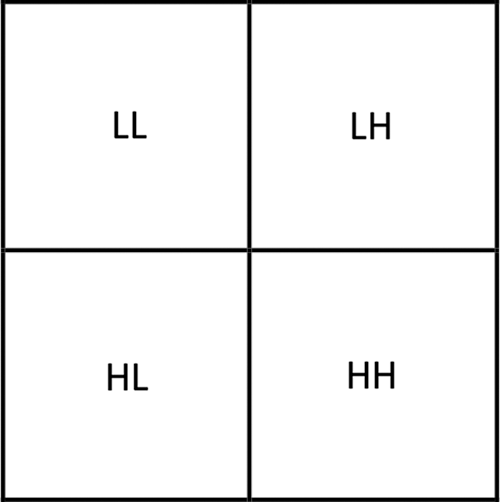
Figure 2: The matrix is subdivided into four subbands
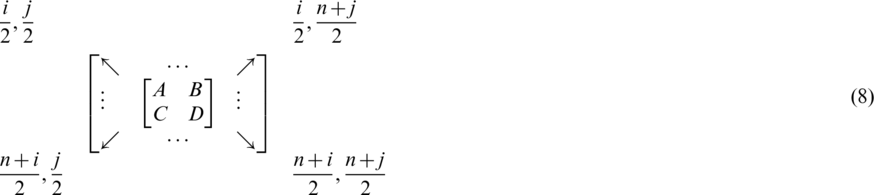
In order to reach optimal PSNR, MHW is applied again to LH, HL and HH subbands to get 12 subbands: three approximation, and nine details. The approximation subbands (LL) includes the important information (approximation) as shown in Fig. 3. The details are then employing the thresholding process and arranged to nine subbands (HL1, LH1, HH1, HL2, LH2, HH2, HL3, LH3, HH3) as follows:
Figure 3: The coefficients matrix consists of nine subbands
Secondly, we select an element xij for each subband of  dimensions and compute the corresponding threshold T using the following equation:

where  is mean of the detailed subband coefficients (consists of nine values) and
  is the coefficients standard deviation.
  is calculated in every detailed subband as:

Also,  is computed as:

3.3 Particle Swarm Optimization (PSO)
PSO has appeared as a rising algorithm for solving various optimization challenges iteratively [40–44]. In PSO, population is called a swarm and individuals are called particles. The movement of swarming particle depends on two components: A deterministic and stochastic component [45,46].
In our methods, the nine positions are the population assigned to particle values (i.e., a threshold value for a subband) as in Fig. 3. PSO estimates best achievable threshold for each subband. This step leads us to get best achievable PSNR for reconstructed image, and to get acceptable CR and MSE values, as well. The resultant nine subband details represent input particles candidates for the PSO algorithm. The largest value in the population is named as  global best,
  represents local best value for the input subband. The fitness value is evaluated by assigning a value to a particle’s position.
  is selected randomly from thresholds spaces of a subband, Particles are flying around in the search space and every particle redefines its position depending on the global best position
  , local best position
  and can be represented by the following formula:


where  and
and  represent the guided particle’s fitness value and the initial state of the particle (start by 0), respectively, while c1, c2 are learning factors equal to 2 [47,48].
The population is updated by  value for each iteration, and consequently
  and
and  are updated if
  is greater than
  . The process stops if the fitness function
  is smaller than a prescribe value where the best threshold is obtained for a subband:

where  successor value of pbest for iteration.
3.4 Overview of the Proposed Algorithm
The proposed algorithm starts by input a given image to MHW transformation. MHW works on detailed subbands instead of approximation subbands. Then, the subbands are reconstructed while thresholding process is completed; particle swarm optimization is used for thresholding details of subbands based on the fitness function. Briefly, the proposed algorithms can be described as the following steps:
1. Step 1. Applies MHW (Eq. (5)) on an original image to get four subbands (approximation LL—horizontal details LH—vertical details HL—diagonal details HH) as shown in Fig. 2.
2. Step 2. Applies MHW (Eq. (5)) again only on details of LH, HL, and HH as shown in Fig. 3.
3. Step 3. Uses threshold (Eq. (9)) for nine subbands (HL1, LH1, HH1, HL2, LH2, HH2, HL3, LH3, HH3).
4. Step 4. Finds input particles that consist of nine positions assigned to threshold values.
5. Step 5. Applies PSO (Eqs. (12) and (13)) on input particles for a subband.
6. Step 6. Updates the position and velocity (Eqs. (12)) until the result for the fitness function leads to best value. The processes are stop if the fitness function  (Eq. (14)) is smaller than the prescribe value.
7. Step 7. Updates the  by
by  and select an arbitrary threshold from the next subband.
8. Step 8. Repeats to reach 9th subband.
9. Step 9. Finds the best threshold  from the output nine thresholds
10. Step 10. Reconstructs the compressed image  (threshold matrix) assigned to the original image
  , where x and y are coordinates.
After reconstructing the subbands (thresholds matrix) by applying the transformation (Eq. (6)). We examine our algorithms performance. Various image similarity indexes were used like PSNR, MSE, CR, and percentage difference in order to prove efficiency of the proposed method.
MSE measures the error between two images. Root mean squared error or RMSE calculated using the square root of MSE. MSE can be evaluated for monochrome images by:

where W and H are dimensions of a reconstruction matrix.  and
and  represent original and compressed image pixels, respectively. Compression methods aim to minimize the MSE.
4.2 Peak Signal to Noise Ratio (PSNR)
PSNR represents the ratio between original signal variance and reconstruction error variance. PSNR is expressed in Decibel scale. The PSNR used as a measure of the reconstruction quality gained during image compression process. Compression methods aim to maximize PSNR values.

Assuming pixels are represented using eight bits while 255 represents the maximum pixel value of the image, PSNR values takes range between zero and infinity, infinity for perfect identical images and 0 for images that have no commonality.
4.3 Peak Signal to Noise Ratio (PSNR)
CR is defined as the ratio between the original image size and compressed image size.
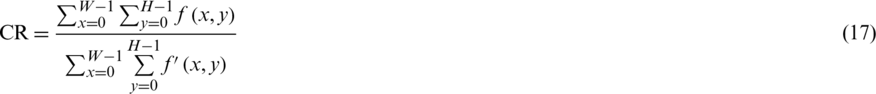
where  is compressed image, and
  represent original image.
4.4 Percentage Difference (PD)
The absolute value of the change in method results, divided by the average of them, then multiplied by 100. it is calculated for finding percentage differences between method performances.

5 Experiment Results and Discussion
In this section, various compressing methods are compared aiming to compress medical images. We experimentally study the performance of these methods, where the performance is assessed using a wide number of medical images of different sizes from MRI and CT types. To run this experiment, five different grey-scale medical images were used: MRI for posterior cruciate ligament ( ), CT horizontal view for (937
  937), CT vertical view for and neck (
 ), X-ray image for chest (
 ), and MRI for circulatory system (
 ). The test images are shown in Fig. 4. The images have been chosen carefully to help in distinguishing between the methods. The sharp edges in the posterior cruciate ligament image helps in demonstrating how various methods compress edges, whereas the fine details in and neck image helps in demonstrating how various methods preserve image clarity. The grey gradations in chest image provide insight into the amount of compressing that has been applied to images. We have implemented our proposed algorithm on a machine has processor Intel Core i7-4510U-CPU 2.00 GHz-internal memory 8.00 GB RAM. In the following subsections, the methods are evaluated both quantitatively and qualitatively.

Figure 4: Various testing images (a) horizontal view for the ( ), (b) vertical view for the and neck (
 ), (c) vertical view for the and neck (
 ), (d) chest view (
 ), (e) circulatory system (
 )
)
The images were compressed by existing Haar, Coiflet, Daubechies, Biorthogonal, Dmeyer, Symlets, and the proposed algorithm. Then, the inverse transformation was used to construct the final images (constructed image). All method outputs were compared quantitatively and qualitatively.
In this subsection, we use numerical indicators to evaluate the methods. Eqs. (16)–(18) were exploited for MSE, PSNR and CR, respectively. Various existing wavelets for images compression were compared. The results are computed by measuring the differences between original and compressed images. Tab. 1 shows the obtained performance of the methods.
Table 1: Results of using various transformations for the methods
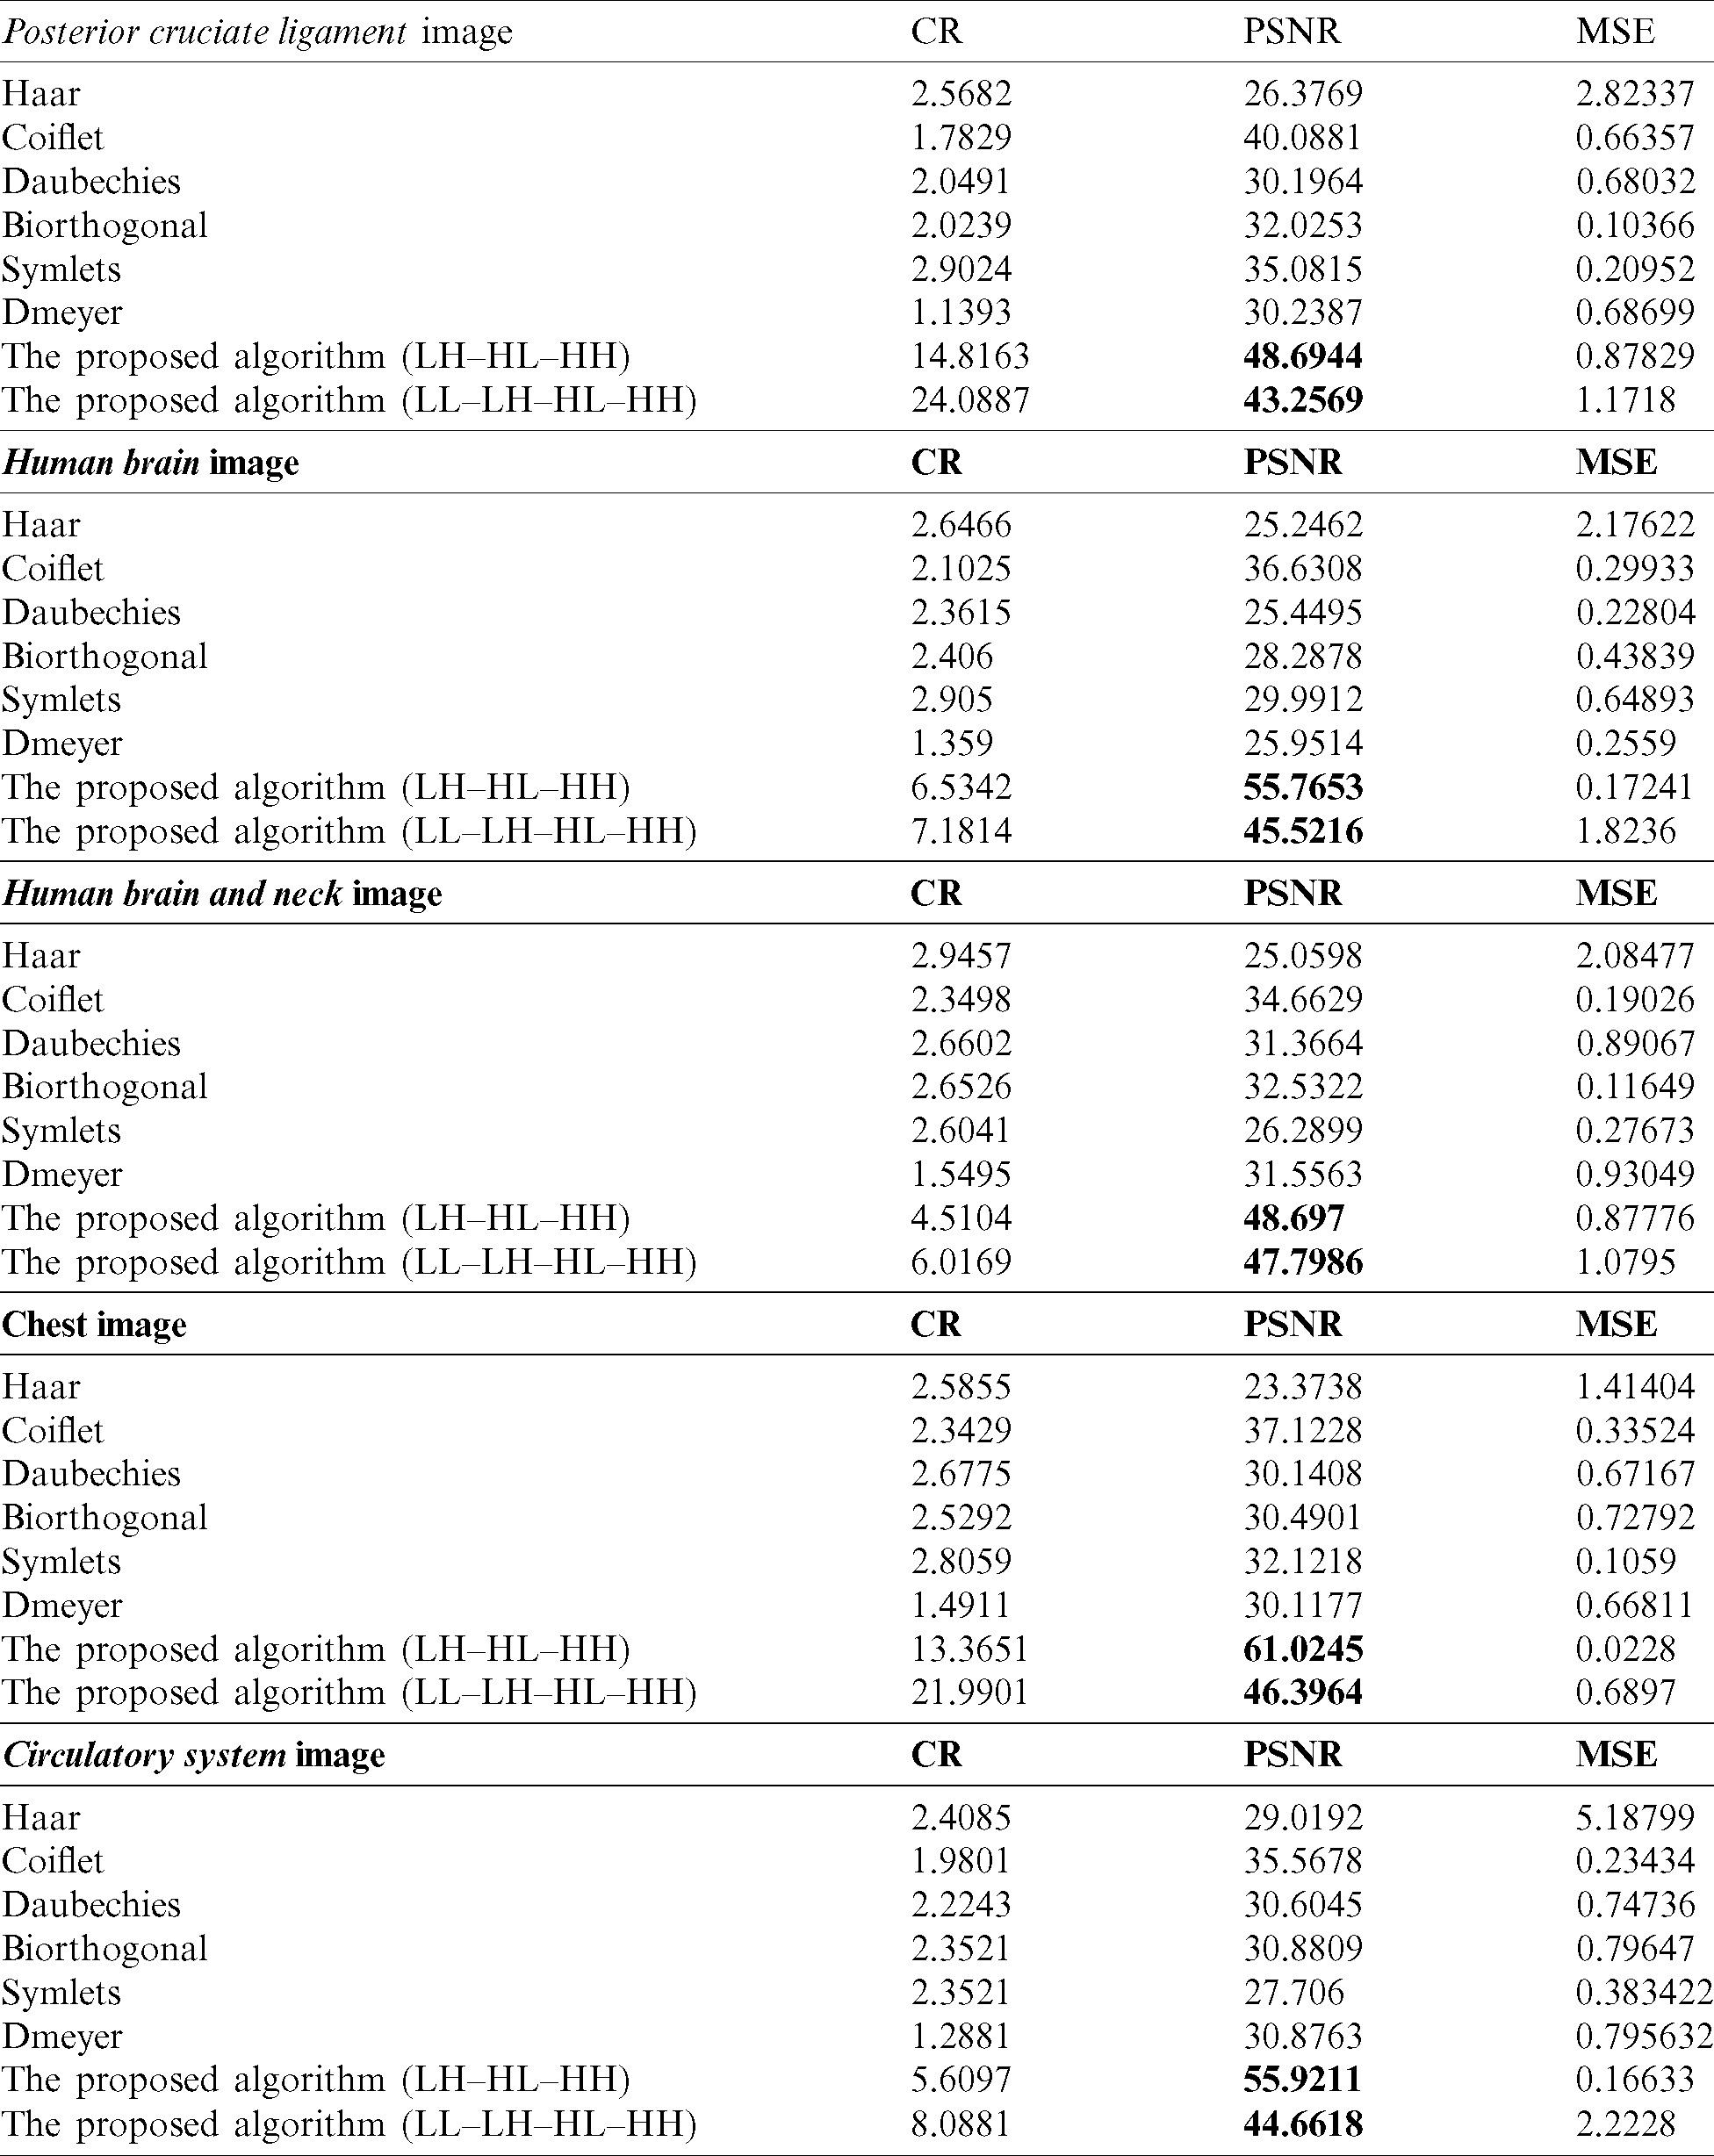
The proposed methods on the sub details (LH–HL–HH) and (LL–LH–HL–HH) gave better results than the existing wavelets like Haar, Coiflet, Daubechies, Biorthogonal, Dmeyer, and Symlets. The proposed methods are the best whether they are used for compressing MRI or CT types.
When we applied the proposed method (LH–HL–HH) to the MRI images posterior cruciate ligament and circulatory system, the results overcame the second best obtained (Coiflet) results by 17.67%, and 57.22%, respectively-from PSNR point of view. In case of the CT horizontal view for human brain and human brain and neck images, the method’s performance significantly exceeded (Coiflet) by 34.31%, and 28.81% respectively-from PSNR point of view. Moreover, when we applied the method to the X-ray image for the chest, it achieved 39.17% better than (Coiflet)-from PSNR point of view.
Similarly, when we applied the proposed method (LL–LH–HL-HH) to the MRI images posterior cruciate ligament and circulatory system, it overcame second best obtained results (Coiflet) by 7.32%, and 20.36%, respectively-from PSNR point of view. In case of the CT horizontal view for human brain and human brain and neck, the method’s performance exceeded (Coiflet) by 19.53%, and 27.48% respectively-from PSNR point of view. Moreover, when we applied the method to the X-ray image for the chest, it achieved 19.99% better than (Coiflet)-from PSNR point of view.
When we utilized Eq. (18) for finding the percentage differences among the method we noticed that (LH–HL–HH) achieved generally better percentages than (LL–LH–HL–HH). We believed that (LH–HL–HH) keeps the LL subband constant during the decompositions phase. A chart graph shows results of the various methods when compressing the various images, in Fig. 5.
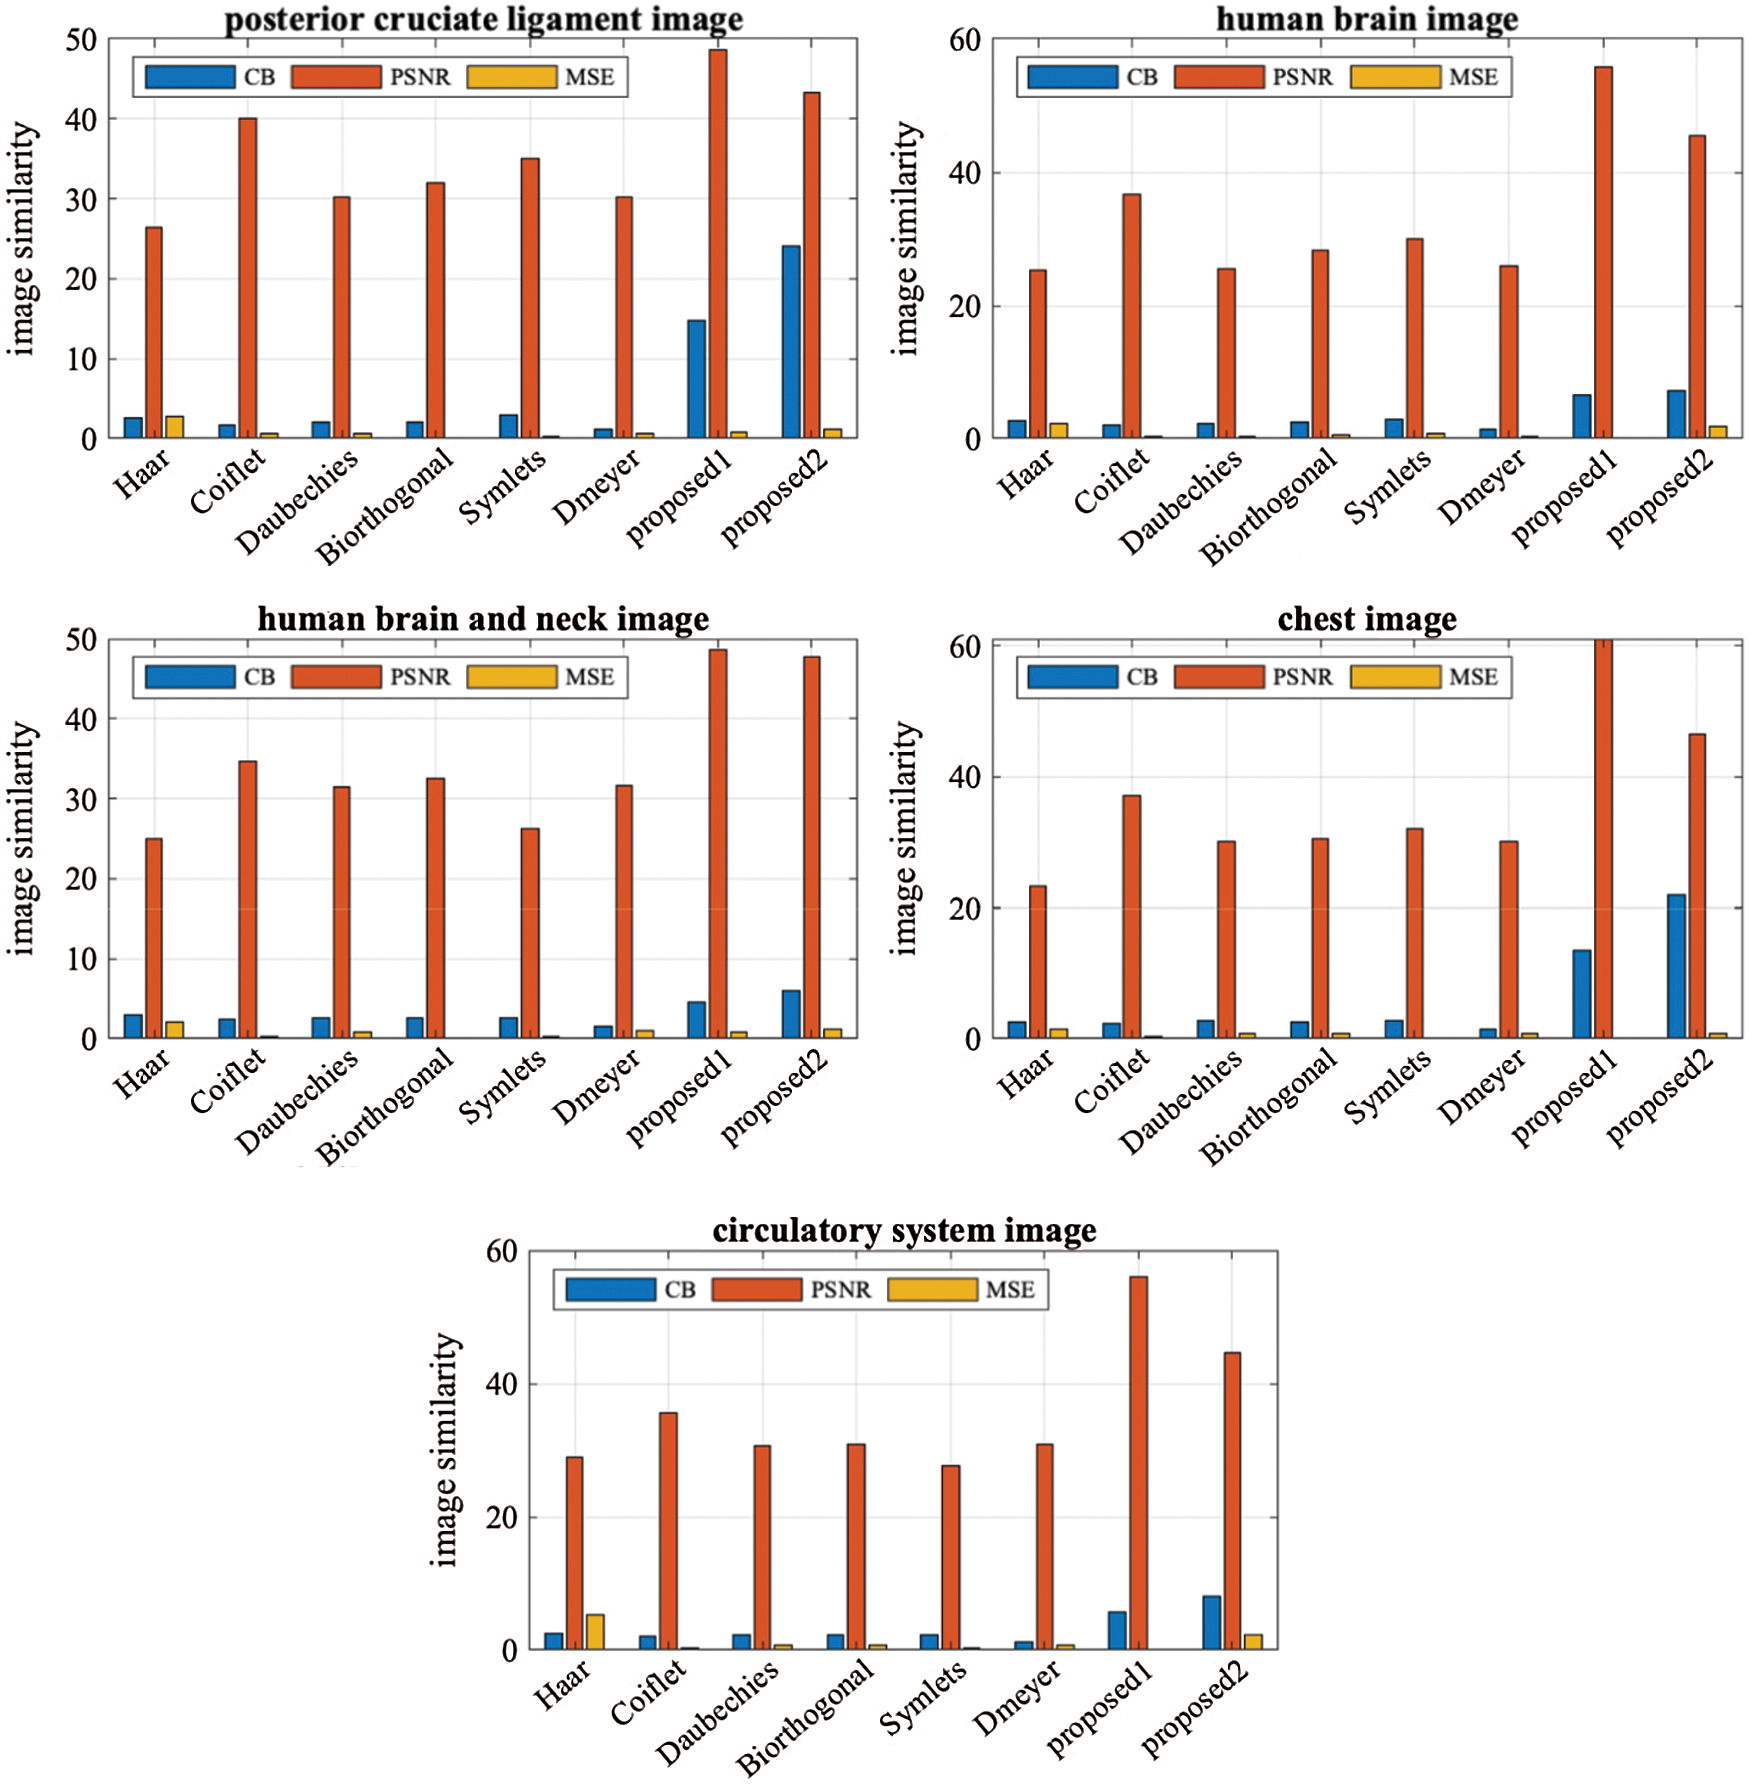
Figure 5: The performance graph for the methods with various testing images
In this subsection, a comparison between reconstructed images of the posterior cruciate ligament using various transforms are shown in Fig. 6. Reconstructed images of the human brain are shown in Fig. 7. Fig. 8 shows a comparison between reconstructed images of human brain and neck. A comparison between reconstructed images of the chest using various transforms are shown in Fig. 9. Fig. 10 shows comparisons between reconstructed images of circulatory system.
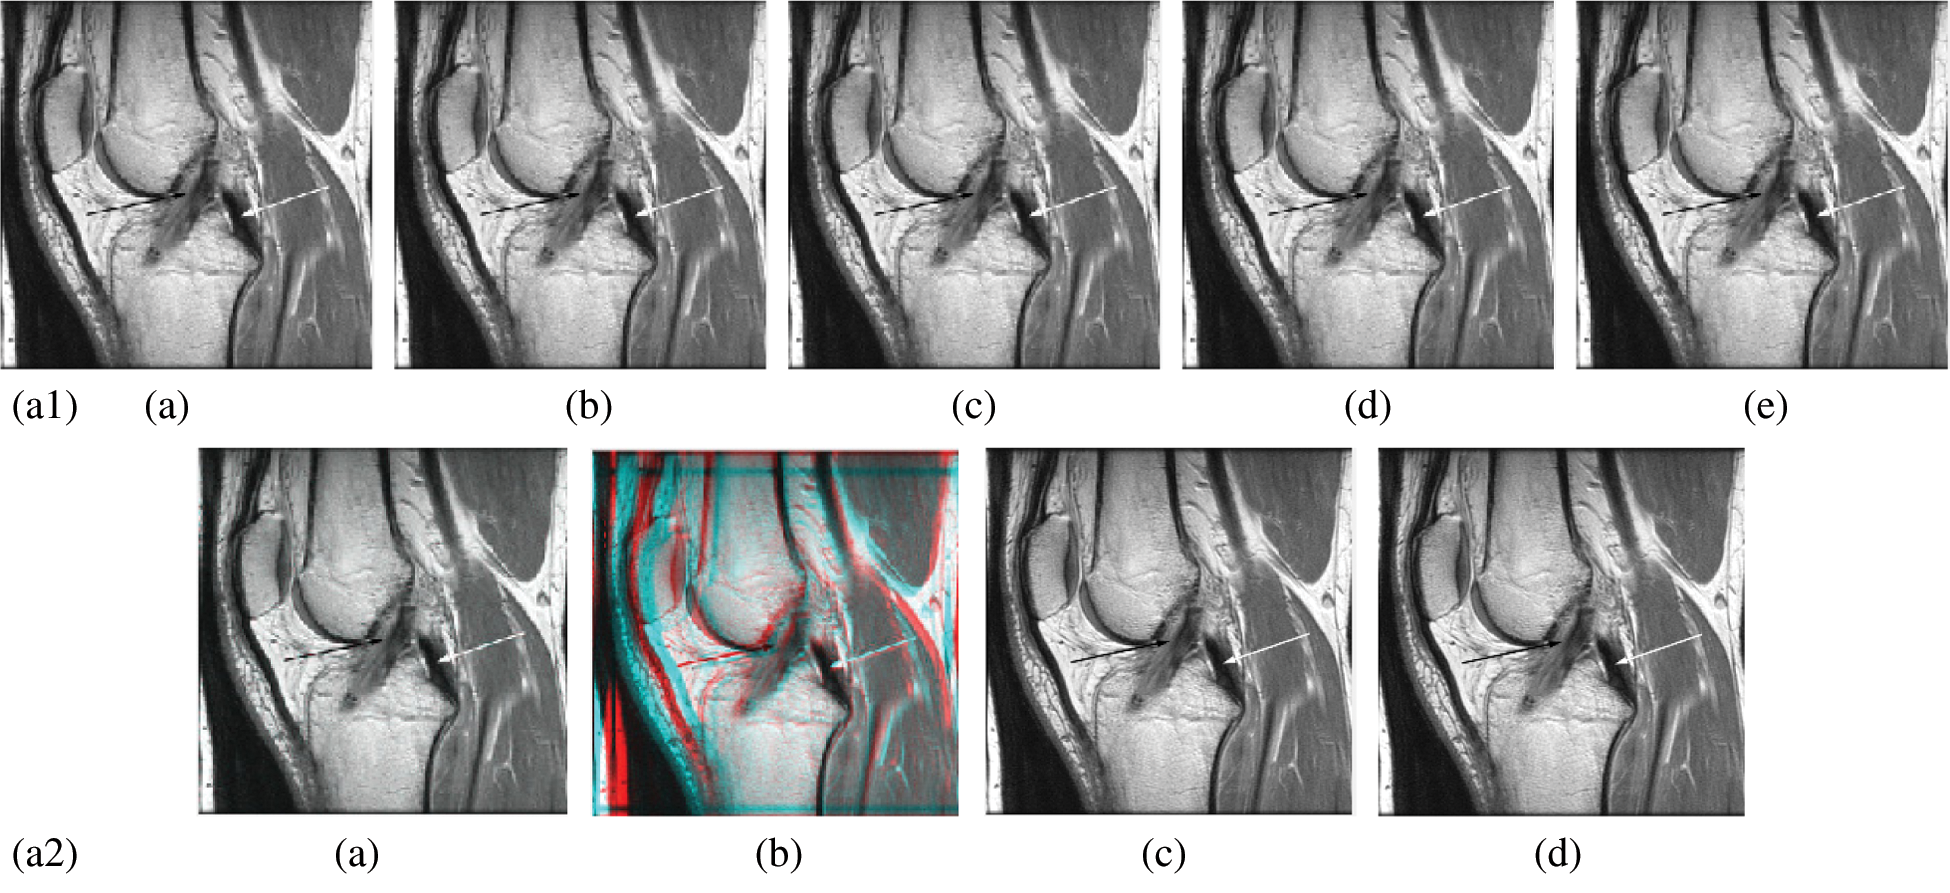
Figure 6: Reconstructed images of the MRI posterior cruciate ligament image. (a1) (a) Original image, (b) Haar wavelet, (c) Coiflet wavelet, (d) Db wavelet, (e) Bior wavelet, (a2) (a) Symlets wavelet, (b) Dmeyer wavelet, (c) Proposed 1 method 1, (d) Proposed method 2
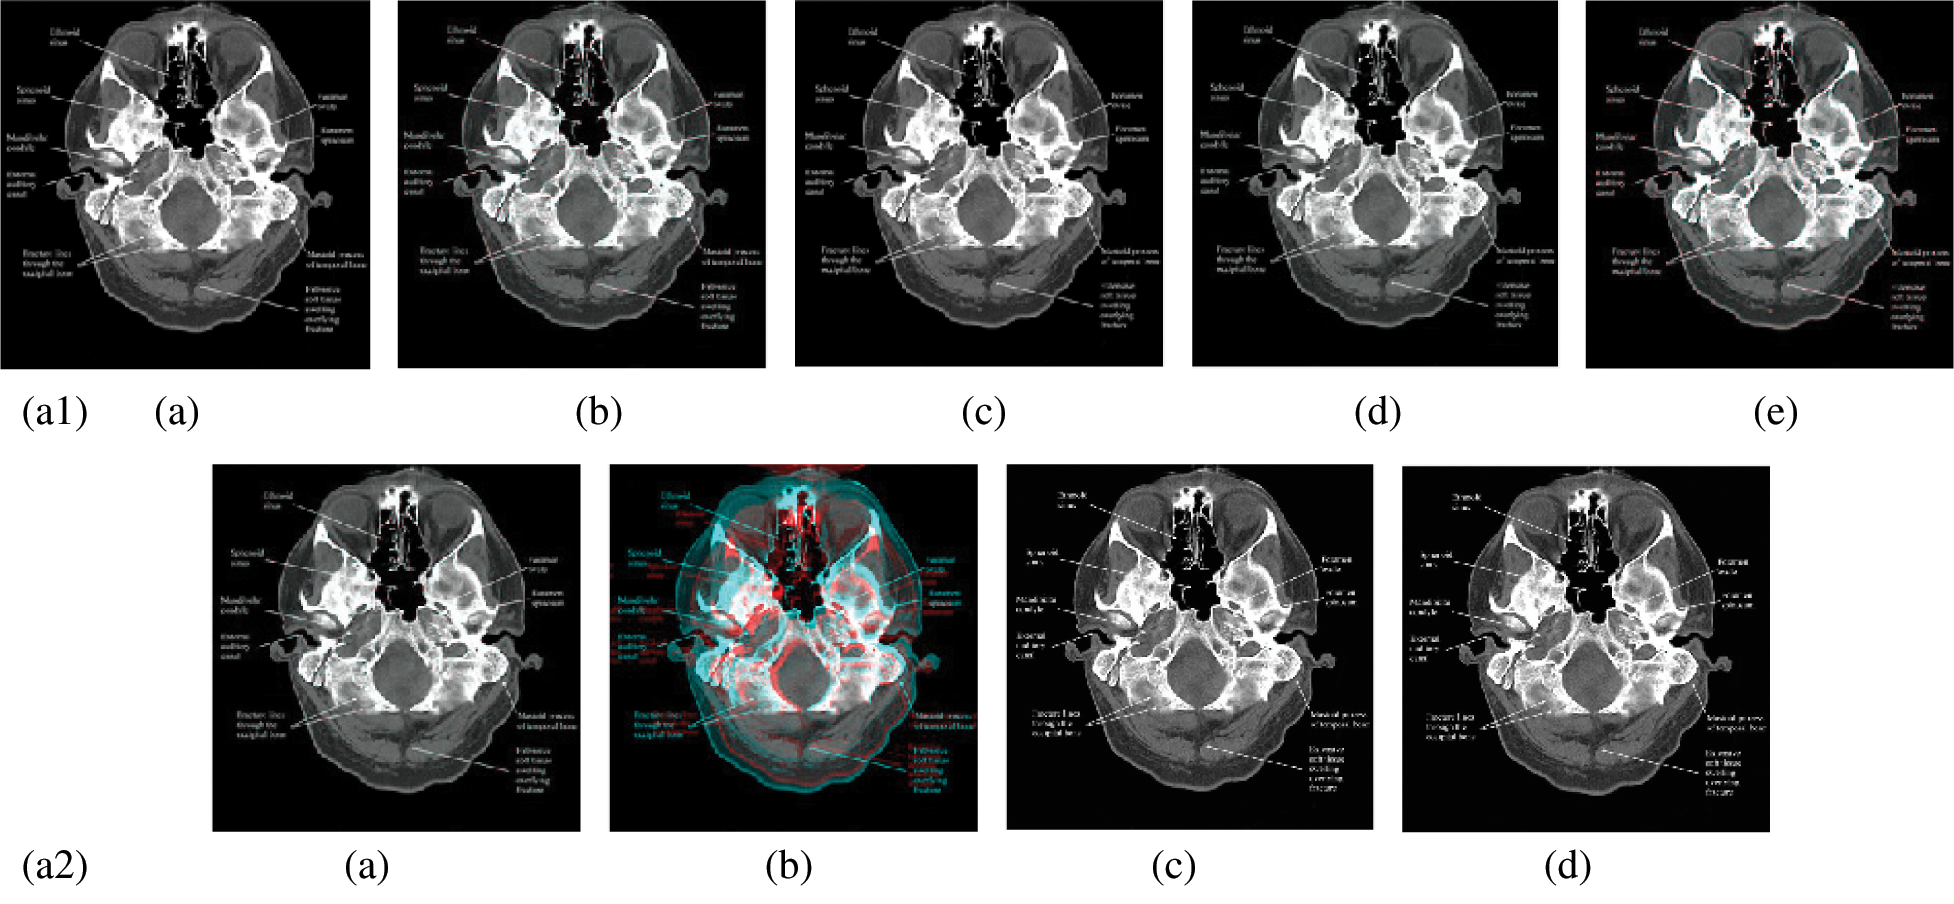
Figure 7: Reconstructed images of the CT horizontal view for the human brain image. (a1) (a) Original image, (b) Haar wavelet, (c) Coiflet wavelet, (d) Daubechies wavelet, (e) Bior wavelet, (a2) (a) Symlets wavelet, (b) Dmeyer wavelet, (c) Proposed method 1, (d) Proposed method 2
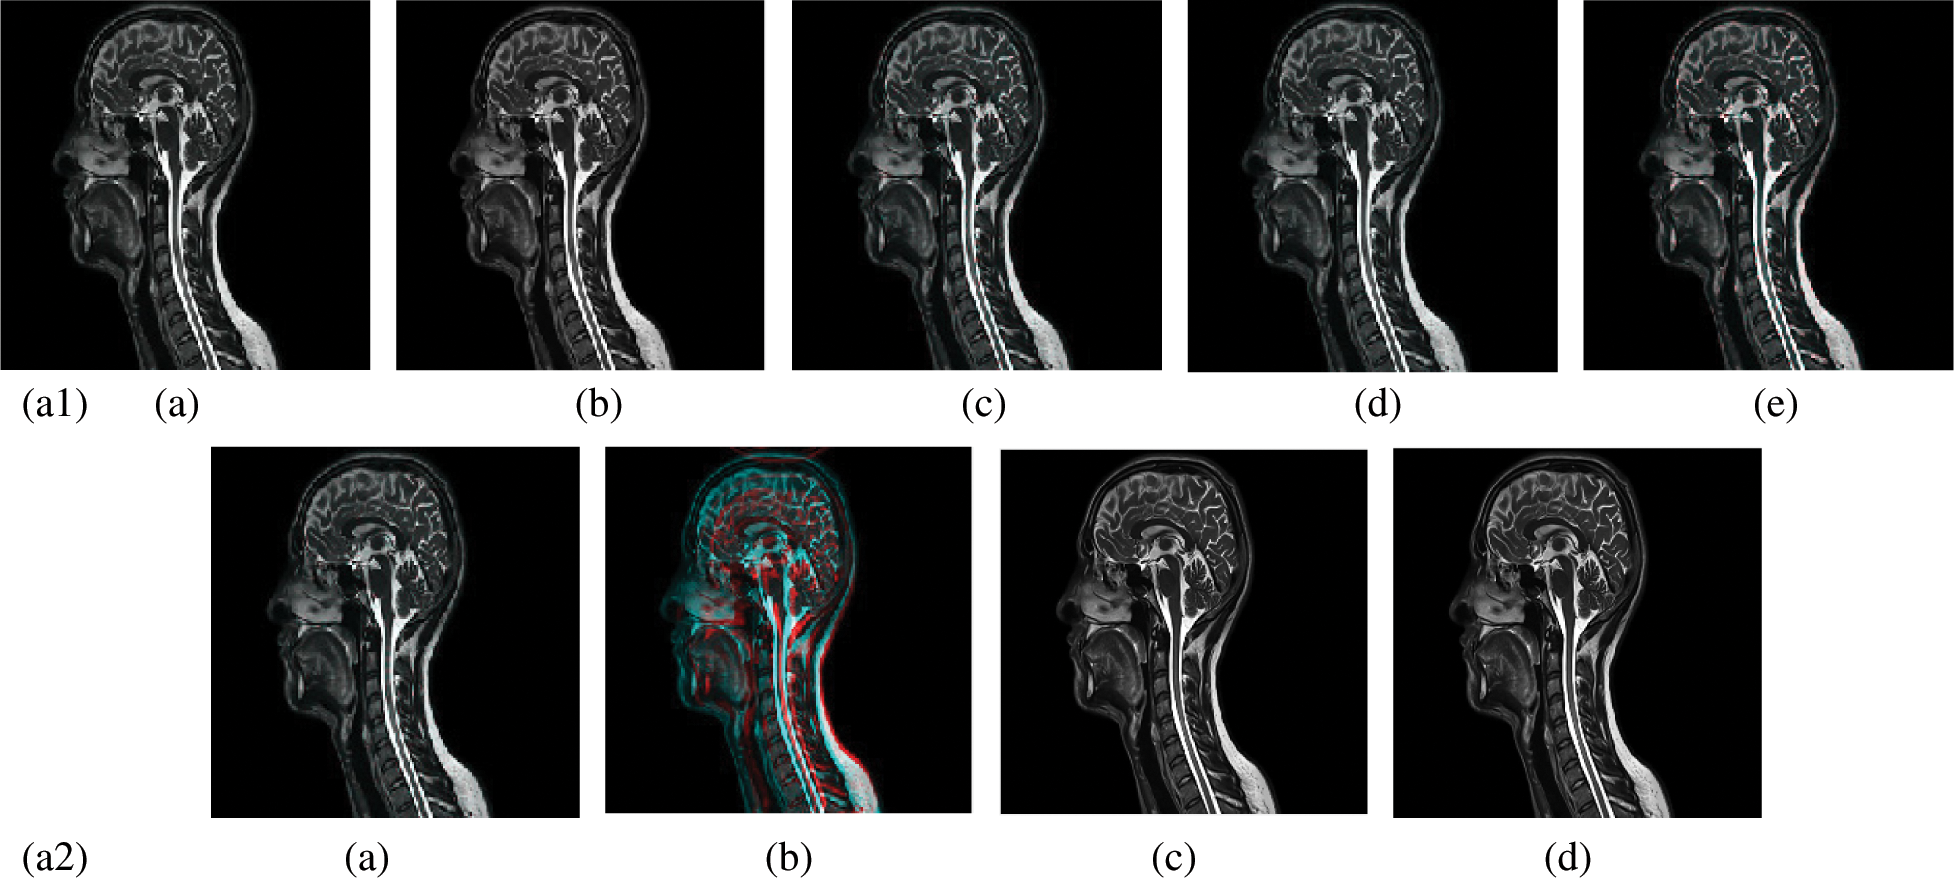
Figure 8: Reconstructed images of the CT vertical view for the and neck. (a1) (a) Original image, (b) Haar wavelet, (c) Coiflet wavelet, (d) Daubechies wavelet, (e) Bior wavelet, (a2) (a) Symlets wavelet, (b) Dmeyer wavelet, (c) Proposed method 1, (d) Proposed method 2
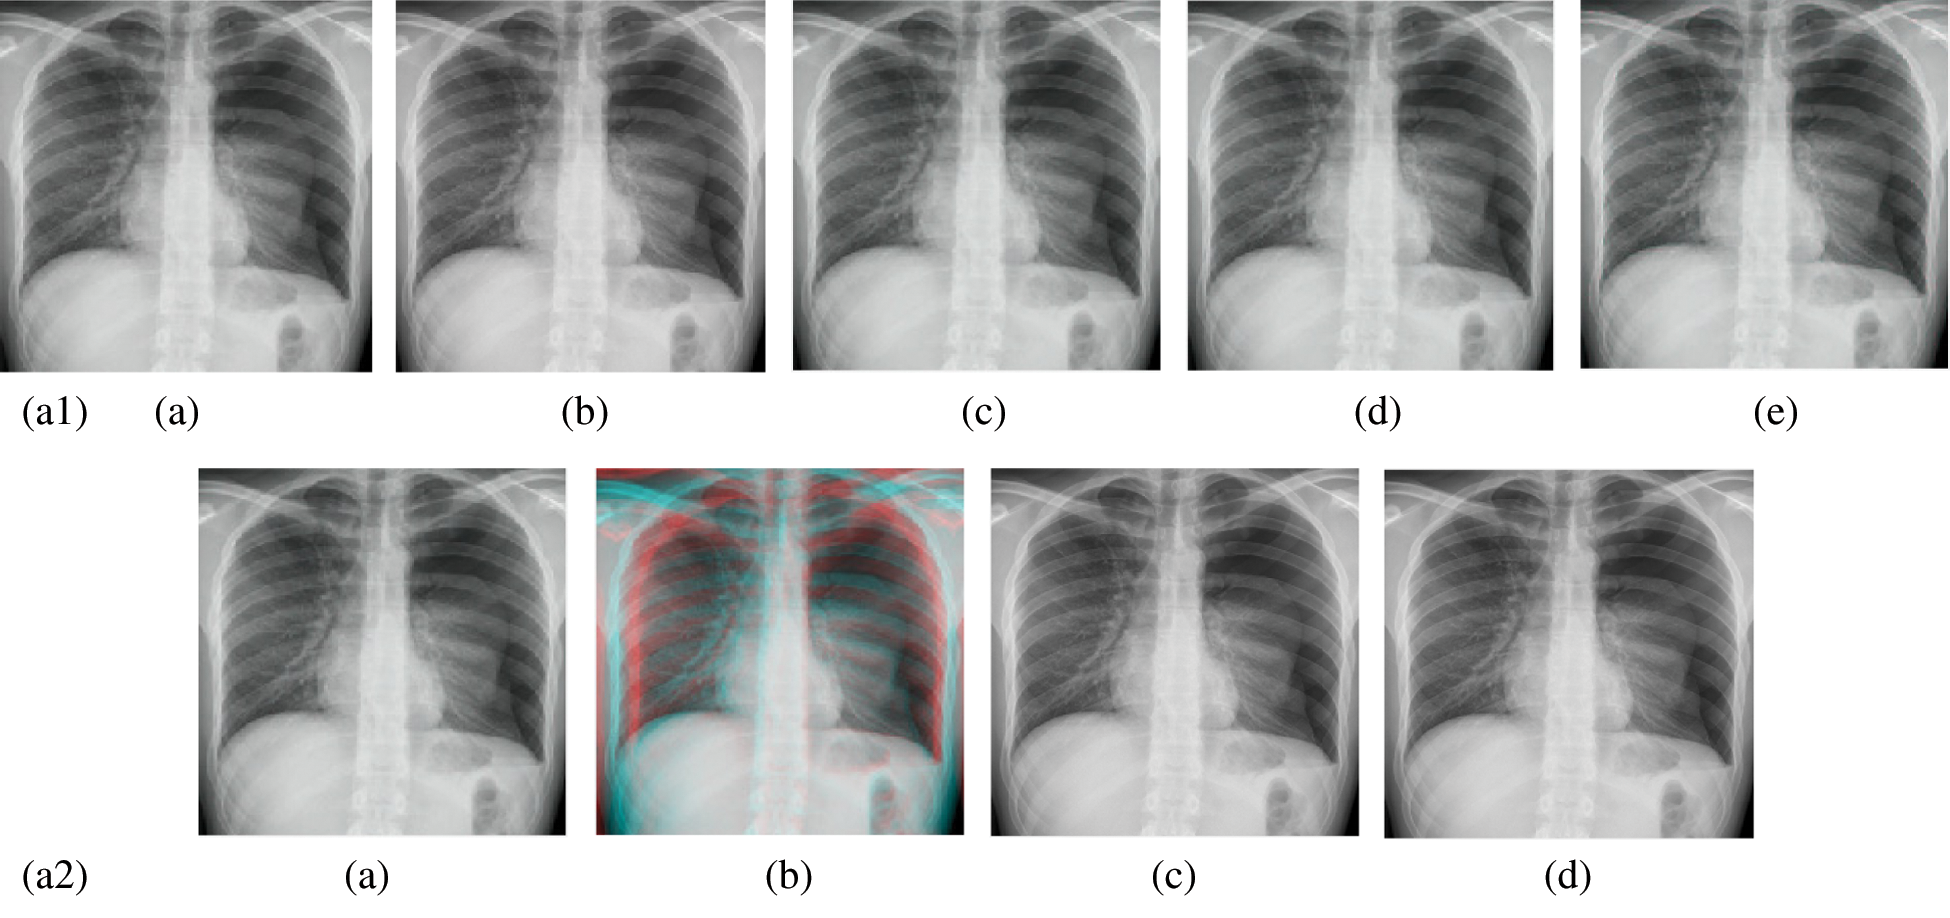
Figure 9: Reconstructed images of the X-ray chest image. (a1) (a) Original image, (b) Haar wavelet, (c) Coiflet wavelet, (d) Daubechies wavelet, (e) Bior wavelet, (a2) (a) Symlets wavelet, (b) Dmeyer wavelet, (c) Proposed method 1, (d) Proposed method 2
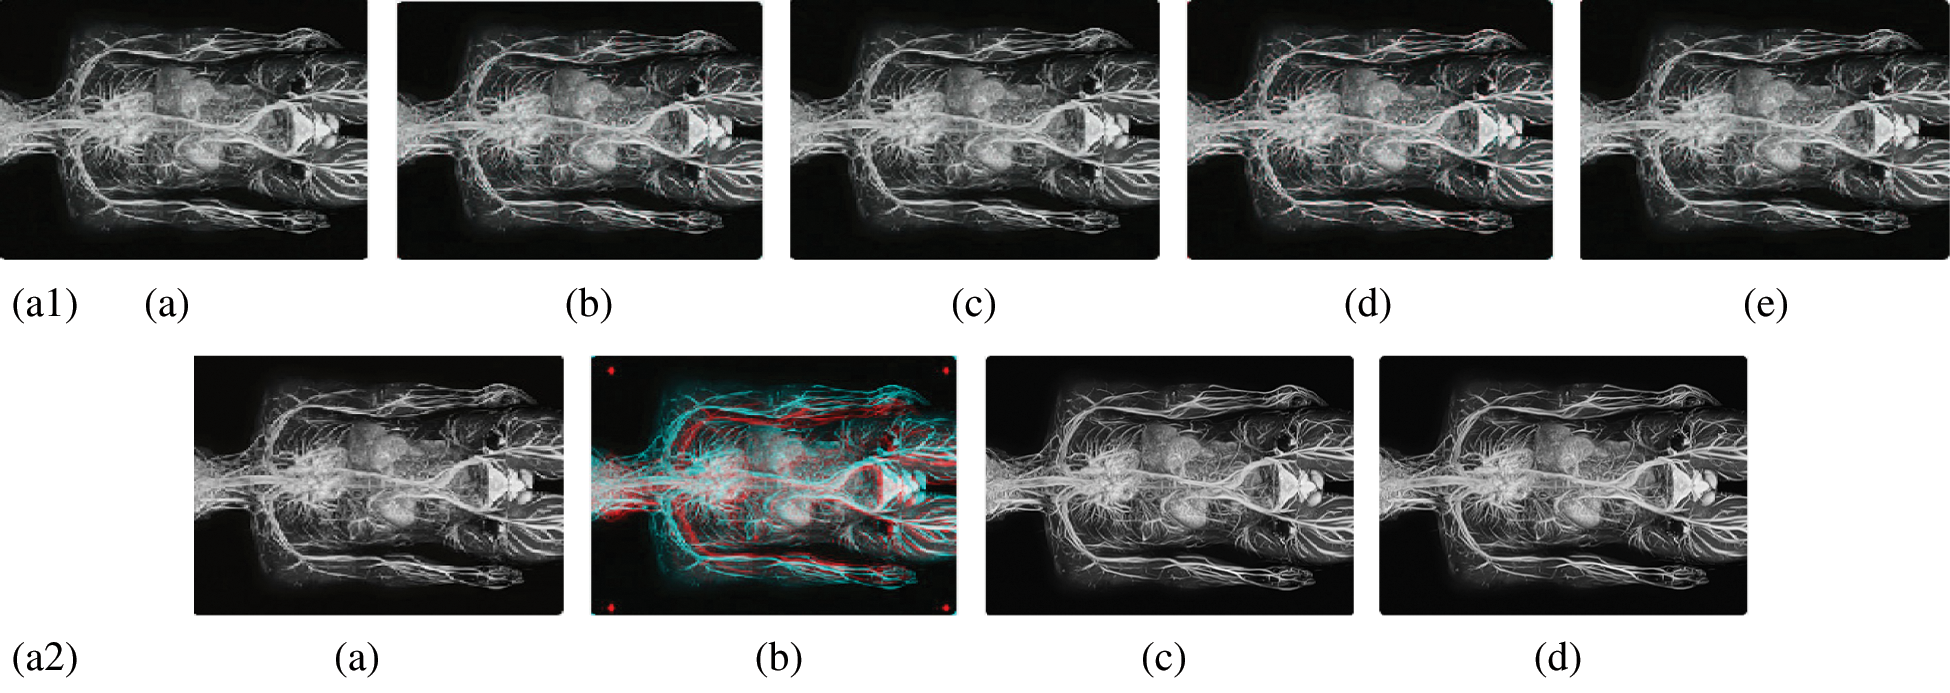
Figure 10: Reconstructed images of the MRI Circulatory system image. (a1) (a) Original image, (b) Haar wavelet, (c) Coiflet wavelet, (d) Daubechies wavelet, (e) Bior wavelet, (a2) (a) Symlets wavelet, (b) dmeyer wavelet, (c) Proposed method 1, (d) Proposed method 2
In this paper, we have introduced a novel algorithm based on merging wavelets and PSO to overcome the medical image compression problems like trade-off between CR and PSNR. Keeping CR high affects PSNR, and vice versa. The algorithm has been designed to keep the PSNR as high as possible using the PSO. It has been applied to challenging applications like MRI, CT, X-ray images in order to prove its efficiency. The output results were compared with the existing wavelets techniques like Haar, Coiflet, Daubechies, Biorthogonal, Dmeyer and Symlets. Applying the algorithm on (LH–HL–HH) keeps the LL subband constant during the decompositions, and that assists in achieving high compression.
The performance of the proposed algorithm has showed superiority in all tests over the existing wavelets even with high detailed images like circulatory system images, from PSNR point of view. PSNR and CR values were increased for horizontal view for the CT (brain image) and MRI image (posterior cruciate ligament), respectively. Compressing X-ray (chest view) overcame best existing methods by six times.
The PSNR value is enhanced, when applied the proposed algorithm only on the detailed subbands. That can give greater flexibility towards our target either to gain more cleared image (high PSNR value) or saving more space (high CR value).
Future research, it is possible to integrate intelligence techniques with the proposed algorithm to create a learning dictionary that accelerates and helps in the process of compressing images of a convergent nature, which may lead to continuous improvement of the values of image compression, purity and speed up the process as a whole.
Funding Statement: This work was funded by the University of Jeddah, Saudi Arabia, under Grant No. UJ-20-043-DR. The authors, therefore, acknowledge with thanks the University technical and financial support.
Conflicts of Interest: The authors declare that they have no conflicts of interest to report regarding the present study.
1. P. Raviraj and M. Y. Sanavullah. (2007). “The modified 2D-haar wavelet transformation in image compression,” Middle East Journal of Scientific Research, vol. 2, no. 2, pp. 73–78. [Google Scholar]
2. G. Horgan. (2006). “Wavelets for SAR image smoothing,” Photogrammetric Engineering & Remote Sensing, vol. 64, no. 12, pp. 1171–1177. [Google Scholar]
3. M. H. Alkinani and M. R. El-Sakka. (2017). “Patch-based models and algorithms for image denoising: A comparative review between patch-based images denoising methods for additive noise reduction,” EURASIP Journal on Image and Video Processing, vol. 1, pp. 58–72. [Google Scholar]
4. M. J. Weinberger, G. Seroussi and G. Sapiro. (2000). “The LOCO-I lossless image compression algorithm: Principles and standardization into JPEG-LS,” IEEE Transactions on Image Processing, vol. 2, no. 8, pp. 1309–1324. [Google Scholar]
5. S. A. Chouakri, O. Djaafri and A. Taleb-Ahmed. (2013). “Wavelet transform and Huffman coding-based electrocardiogram compression algorithm: Application to telecardiology,” in 24th Conf. on Computational Physics, vol. 454, pp. 1–16. [Google Scholar]
6. O. Khalifa. (2009). “Wavelet coding design for image data compression,” International Arab Journal of Information Technology, vol. 6, no. 2, pp. 118–127. [Google Scholar]
7. Y. L. Zhou, X. P. Fan, S. Q. Liu and Z. Y. Xiong. (2010). “Improved LZW algorithm of lossless data compression for WSN,” in 3rd Int. Conf. on Computer Science and Information Technology, vol. 4, pp. 523–527. [Google Scholar]
8. S. Sridhar, P. R. Kumar and K. V. Ramanaiah. (2014). “Wavelet transform techniques for image compression-an evaluation,” International Journal of Image, Graphics and Signal Processing, vol. 6, no. 2, pp. 54–67. [Google Scholar]
9. A. Ghorpade and P. Katkar. (2014). “Image compression using Haar transform and modified fast Haar wavelet transform,” International Journal of Scientific & Technology Research, vol. 3, no. 7, pp. 302–305. [Google Scholar]
10. P. Porwik and A. Lisowska. (2004). “The Haar wavelet transform in digital image processing: Its status and achievements,” Machine Graphics & Vision, vol. 13, no. 2, pp. 79–98. [Google Scholar]
11. V. R. Rao, R. K. Panakala and R. K. Pullakura. (2016). “Implementation of a 2D–DWT system architecture for JPEG2000 using MATLAB and DSP,” in Int. Conf. on Computation System and Information Technology for Sustainable Solutions, Bangalore, pp. 86–90. [Google Scholar]
12. E. A. Zanaty and S. M. Ibrahim. (2019). “Medical image compression based on combining region growing and wavelet transform,” International Journal of Medical Imaging, vol. 7, no. 3, pp. 57–65. [Google Scholar]
13. B. A. Mohamed and H. M. Afify. (2017). “Mammogram compression techniques using Haar wavelet and quad tree decomposition-based image enhancement,” Biomedical Engineering: Applications Basis and Communications, vol. 29, no. 5, pp. 1–7. [Google Scholar]
14. N. Umezu, K. Yokota and M. Inui. (2017). “2D wavelet transform data compression with error level guarantee for z-map models,” Journal of Computational Design and Engineering, vol. 4, no. 3, pp. 238–247. [Google Scholar]
15. A. Sengupta and D. Roy. (2017). “Mathematical validation of HWT based lossless image compression,” in IEEE Int. Sym. on Nano-electronic and Information Systems, Bhopal, pp. 20–22. [Google Scholar]
16. A. K. Nahar and A. S. Jaddar. (2018). “A compression original image based on the DDWT technique and enhancement SNR,” International Journal of Engineering Technology and Sciences, vol. 5, no. 3, pp. 73–89. [Google Scholar]
17. P. N. T. Ammah and E. Owusu. (2019). “Robust medical image compression based on wavelet transform and vector quantization,” Informatics in Medicine Unlocked, vol. 15, pp. 1–11. [Google Scholar]
18. C. Priya and C. Ramya. (2018). “Medical image compression based on fuzzy segmentation,” International Journal of Pure and Applied Mathematics, vol. 118, no. 20, pp. 603–610. [Google Scholar]
19. I. Benyahia, M. Beladgham and A. Bassou. (2018). “Evaluation of the medical image compression using wavelet packet transform and SPIHT coding,” International Journal of Electrical and Computer Engineering, vol. 8, no. 4, pp. 2139–2147. [Google Scholar]
20. R. Reisenhofer, S. Bosse, G. Kutyniok and T. Wiegand. (2018). “A Haar wavelet-based perceptual similarity index for image quality assessment,” Signal Processing: Image Communication, vol. 61, pp. 33–43. [Google Scholar]
21. P. Vasanth, S. Rajan and L. Fred. (2018). “Efficient oppositional based optimal Harr wavelet for compound image compression using MHE,” Biomedical Research, vol. 29, no. 10, pp. 2169–2178. [Google Scholar]
22. G. S. Rao, S. S. Rani and B. P. Rao. (2019). “Performance analysis of CT scan and X-Ray medical images compression using PCA and WDR techniques,” in Int. Conf. on Sustainable Computing in Science, Technology and Management (SUSCOMUniversity Rajasthan, Jaipur, India, pp. 537–545. [Google Scholar]
23. R. Agarwal, C. S. Salimath and K. Alam. (2019). “Multiple image compression in medical imaging techniques using wavelets for speedy transmission and optimal storage,” Biomedical and Pharmacology Journal, vol. 12, no. 1, pp. 183–198. [Google Scholar]
24. A. Ramachandran, E. K. Subramanian and J. Jegan. (2019). “An effective image matrix compression technique for medical pitch,” International Journal of Recent Technology and Engineering, vol. 7, no. 6S4, pp. 401–405. [Google Scholar]
25. P. M. Latha and A. A. Fathima. (2019). “Collective compression of images using averaging and transform coding,” Measurement, vol. 135, pp. 795–805. [Google Scholar]
26. C. Yang, Y. Zhao and S. Wang. (2019). “Deep image compression in the wavelet transform domain based on high frequency sub-band prediction,” IEEE Access, vol. 7, pp. 52484–52497. [Google Scholar]
27. C. Shi and L. Wang. (2019). “Remote sensing image compression based on adaptive directional wavelet transform with content-dependent binary tree codec,” IEEE Journal of Selected Topics in Applied Earth Observations and Remote Sensing, vol. 12, no. 3, pp. 934–949. [Google Scholar]
28. M. Heydaria, P. Cheraaqeea, A. Mansouria and A. Mahmoudi-Aznavehb. (2019). “A low complexity wavelet-based blind image quality evaluator,” Signal Processing: Image Communication, vol. 74, pp. 280–288. [Google Scholar]
29. T. Santhana and S. Gomathi. (2014). “Representing an image using a Haar wavelet transformation for human parts detection,” in Int. Conf. on Information Communication and Embedded Systems, Chennai, pp. 1–7. [Google Scholar]
30. F. Liu, M. Hernandez, V. Sanchez, M. W. Marcellin and A. Bilgin. (2017). “The current role of image compression standards in medical imaging,” Information, vol. 8, no. 4, pp. 1–26. [Google Scholar]
31. M. Abid, H. Abdal-Raheem and M. Salah. (2011). “Image compression using Haar and modified Haar wavelet transform,” Tikrit Journal of Engineering Sciences, vol. 18, no. 2, pp. 88–101. [Google Scholar]
32. F. Tabassum, M. I. Islam and M. R. Amin. (2015). “A simplified image compression technique based on Haar wavelet transform,” in Int. Conf. on Electrical Engineering and Information Communication Technology, Dhaka, pp. 1–9. [Google Scholar]
33. S. Tamboli and V. R. Udupi. (2013). “Image compression using Haar wavelet transform,” International Journal of Advanced Research in Computer and Communication Engineering, vol. 2, no. 8, pp. 3166–3170. [Google Scholar]
34. O. Kosheleva, V. Kreinovich and H. T. Nguyen. (2002). “On the optimal choice of quality metric in image compression,” in Proc. of the IEEE Southwest Sym. on Image Analysis and Interpretation, Sante Fe, NM, USA, pp. 116–120. [Google Scholar]
35. A. Gore and S. Gupta. (2015). “Full reference image quality metrics for JPEG compressed images,” AEU International Journal of Electronics and Communications, vol. 69, no. 2, pp. 604–608. [Google Scholar]
36. A. Bhardwaj and R. Ali. (2009). “Image compression using modified fast Haar wavelet transform,” World Applied Sciences Journal, vol. 7, no. 5, pp. 647–653. [Google Scholar]
37. K. H. Talukder and K. Harada. (2006). “A scheme of wavelet-based compression of 2D image,” in Proc. of the Int. MultiConf. of Engineers and Computer Scientists 2006, Hong Kong, pp. 531–536. [Google Scholar]
38. N. Sikka, S. Singla and G. Pal Singh. (2016). “Lossless image compression technique using Haar wavelet and vector transform,” in Int. Conf. on Research Advances in Integrated Navigation Systems, Bangalore, pp. 1–5. [Google Scholar]
39. E. A. Zanaty and S. M. Ibrahim. (2020). “High efficient Haar wavelets for medical image compression,” in Proc. of the Int. Conf. on Advanced Intelligent Systems and Informatics. Advances in Intelligent Systems and Computing, Cham: Springer, vol. 1058, pp. 547–557. [Google Scholar]
40. Z. H. Zhan, J. Zhang, Y. Li and Y. H. Shi. (2011). “Orthogonal learning particle swarm optimization,” IEEE Transactions on Evolutionary Computation, vol. 15, no. 6, pp. 832–847. [Google Scholar]
41. C. Li, S. Yang and T. T. Nguyen. (2012). “A self-learning particle swarm optimizer for global optimization problems,” IEEE Transactions on Systems, Man, and Cybernetics, Part B (Cybernetics), vol. 42, no. 3, pp. 627–646. [Google Scholar]
42. N. Zeng, Z. Wang, H. Zhang, K. E. Kim, Y. Li et al. (2019). , “An improved particle filter with a novel hybrid proposal distribution for quantitative analysis of gold immunochromatographic strips,” IEEE Transactions on Nanotechnology, vol. 18, no. 1, pp. 819–829. [Google Scholar]
43. N. Zeng, Z. Wang, B. Zineddin, Y. Li, M. Du et al. (2014). , “Image-based quantitative analysis of gold immunochromatographic strip via cellular neural network approach,” IEEE Transactions on Medical Imaging, vol. 33, no. 5, pp. 1129–1136. [Google Scholar]
44. N. Zeng, H. Qiu, Z. Wang, W. Liu, H. Zhang et al. (2018). , “A new switching-delayed-PSO-based optimized SVM algorithm for diagnosis of Alzheimer’s disease,” Neuro Computing, vol. 320, pp. 195–202. [Google Scholar]
45. Y. Wu, B. Jiang and N. Lu. (2019). “A descriptor system approach for estimation of incipient faults with application to high-speed railway traction devices,” IEEE Transactions on Systems, Man, and Cybernetics: Systems, vol. 49, no. 10, pp. 2108–2118. [Google Scholar]
46. Y. Wu, B. Jiang and Y. Wang. (2019). “Incipient winding fault detection and diagnosis for squirrel-cage induction motors equipped on CRH trains,” International Society of Automation Transactions, vol. 99, pp. 488–495. [Google Scholar]
47. H. Chen and J. Tian. (2011). “Using particle swarm optimization algorithm for image enhancement,” Uncertainty Reasoning and Knowledge Engineering, vol. 2, pp. 154–157. [Google Scholar]
48. M. Braik, A. Sheta and A. Ayesh. (2007). “Image enhancement using particle swarm optimization,” Proceedings of the World Congress on Engineering, vol. 1, pp. 978–988. [Google Scholar]
 | This work is licensed under a Creative Commons Attribution 4.0 International License, which permits unrestricted use, distribution, and reproduction in any medium, provided the original work is properly cited. |