DOI:10.32604/cmc.2021.014767
| Computers, Materials & Continua DOI:10.32604/cmc.2021.014767 | |
| Article |
Optimized Deep Learning-Inspired Model for the Diagnosis and Prediction of COVID-19
1MISR Higher Institute for Engineering and Technology, Mansoura, Egypt
2Faculty of Computers and Information, Cairo University, Cairo, Egypt
3VSB-Technical University of Ostrava, Czech Republic
*Corresponding Author: Aboul Ella Hassnien. Email: aboitcairo@cu.edu.eg
Received: 14 October 2020; Accepted: 12 December 2020
Abstract: Detecting COVID-19 cases as early as possible became a critical issue that must be addressed to avoid the pandemic’s additional spread and early provide the appropriate treatment to the affected patients. This study aimed to develop a COVID-19 diagnosis and prediction (AIMDP) model that could identify patients with COVID-19 and distinguish it from other viral pneumonia signs detected in chest computed tomography (CT) scans. The proposed system uses convolutional neural networks (CNNs) as a deep learning technology to process hundreds of CT chest scan images and speeds up COVID-19 case prediction to facilitate its containment. We employed the whale optimization algorithm (WOA) to select the most relevant patient signs. A set of experiments validated AIMDP performance. It demonstrated the superiority of AIMDP in terms of the area under the curve-receiver operating characteristic (AUC-ROC) curve, positive predictive value (PPV), negative predictive rate (NPR) and negative predictive value (NPV). AIMDP was applied to a dataset of hundreds of real data and CT images, and it was found to achieve 96% AUC for diagnosing COVID-19 and 98% for overall accuracy. The results showed the promising performance of AIMDP for diagnosing COVID-19 when compared to other recent diagnosing and predicting models.
Keywords: Convolutional neural networks; coronavirus disease 2019 (COVID-19); CT chest scan imaging; deep learning technique; feature selection; whale optimization algorithm
The current epidemic of coronavirus disease (COVID-19) [1] has spread extensively around the world. The World Health Organization (WHO) has declared that COVID-19 is an international pandemic [2,3]. To the date (November 15th, 2020), there have been 54,790,349 confirmed cases and 1,323,898 deaths worldwide [4]. COVID-19 is exceptionally contagious and easily transmitted between people via respiratory droplets. Its common symptoms for mild cases include shortness of breath, muscle pain, fever and sputum production, but it can also cause pneumonia and multi-organ failure in more severe cases [5–9]. The death rate/number of diagnosed cases recorded in March 2020 was as high as 4.5%. Many countries have been affected by widespread community transmission, meaning that individuals may become infected without directly contacting symptomatic persons or traveling to areas with outbreaks.
With the daily rapid growth in the number of newly confirmed and suspected cases, diagnosis has become a critical issue to aid containment of the disease, especially in countries suffering from a lack of resources or low detection rates [8]. Thus, healthcare workers need sensitive and specific diagnostic tools to identify cases of potential COVID-19. Several researchers [10–13] have attempted to develop models using artificial intelligence (AI) techniques to detect COVID-19 cases in order to contribute to disease containment before spreading. These models may assist clinicians in making appropriate recommendations for treatment. However, many limitations have been shown in these studies, including low accuracy and long execution times in diagnosing. Most of these models ignore the reverse transcription-polymerase chain reaction (RT-PCR) tests in their results even though different governments recommendation for COVID-19 diagnosis [14–16] state that they should be included as the most widely accepted standard test for diagnosing COVID-19. However, recent studies [12,13,17,18] have suggested that RT-PCR may only be 30 to 70% sensitive for acute infection. This would mean that up to seven patients out of ten with COVID-19 may obtain a negative PCR result.
On the other hand, other studies [12–14] have shown that chest computed tomography (CT) has a sensitivity of over 95%. Several radiologists have stated that supervised computer-aided CT diagnosis models are urgently needed to detect COVID-19 cases alongside RT-PCR tests. In this context, this paper proposes a deep learning inspired model for COVID-19 diagnosis and prediction (AIMDP) that can accurately detect early COVID-19 signs (features) from CT images with further evaluation from RT-PCR. The AIMDP model has three significant phases: segmentation, feature selection (FS) and classification. The segmentation phase implements a deep learning technology, i.e., convolutional neural networks (CNNs), to increase diagnosis speed and contribute to disease containment. To accurately detect the signs of COVID-19 in CT images, the FS phase utilizes the whale optimization algorithm (FSWOA) to select the most relevant patient features. The most common CT sign in COVID-19 is ground glass opacity (GGO), which indicates that the alveoli are full of liquids. This sign is shown in a CT image as a grey shadow. Other common signs for COVID-19 identified in CT scans are solid white consolidation (SWC) and a crazy-paving pattern (CPP). GGO is considered a first indication of COVID-19, followed by the other signs. In the most severe cases, SWC indicates that there is more liquid in the lungs.
On the other hand, the lung wall appears thicker in CT images when CPP is present. CPP indicates swelling in the lung walls, which leads to a more static wall image shown beside the smoky grey area caused by GGO. In the present study, the proposed AIMDP model was shown to have encouraging performance when applied to a real dataset with hundreds of CT scans.
Main Contributions of the Proposed AIMDP Model: AI techniques can help develop models to aid healthcare workers in diagnosing disease. The proposed AIMDP model utilizes different AI techniques to enhance the diagnostic function of the model as follows:
• First, a pre-processing phase is implemented only to consider the lung regions and remove the noise of non-lung regions to reduce the time needed to segment the whole image. In this phase, the image is also normalized and assigned a label for each patch/image to represent each feature detected.
• Second, a FS phase is used to select the minimum number of significant features for diagnosing COVID-19 using the WOA to optimize the results.
• Third, the classification phase includes different classifiers, and the model is used to select the most appropriate classifier based on the classification error obtained for each case.
• Fourth, although CT scans are highly sensitive to COVID-19, some COVID-19 signs may also be seen in other causes of viral pneumonia. That means that chest CT scan images may be sensitive but not specific for COVID-19. Thus, in the diagnosis and classification phase of AIMDP, further evaluation by lab tests (RT-PCR and complete blood count (CBC)) should be used to exclude other causes and accurately diagnose COVID-19 independently of CT images.
• Finally, the proposed AIMDP was compared with the other state-of-the-art techniques. The results revealed that AIMDP was superior to other recent diagnostic models in terms of the area under curve (AUC), positive predictive value (PPV), negative predictive value (NPV) and execution time.
This paper is structured as follows. Recent COVID-19 diagnostic models and representation of the WOA algorithm are presented in Section 2. Section 3 outlines the proposed artificial intelligence inspired model for COVID-19. The AIMDP model’s performance is evaluated in Section 4, showing the effect of implementing WOA in the proposed FSWOA and the CNNs in AIMDP. The results obtained are compared against those from the most recent diagnostic models. Conclusions, limitations and future work are discussed in Section 5.
This section reviews recent COVID-19 diagnostic models proposed and background of the WOA.
The rapid expansion of AI technology has led to its increasing use in the medical field, particularly for diagnosing and classification diseases, such as viral pneumonia and organ tumors. Recently, several researchers have focused on developing AI models for diagnosing and detecting COVID-19 to enhance the model’s performance in terms of accuracy (Tab. 1).
Table 1: Comparison of previous approaches for diagnosing and detecting COVID-19
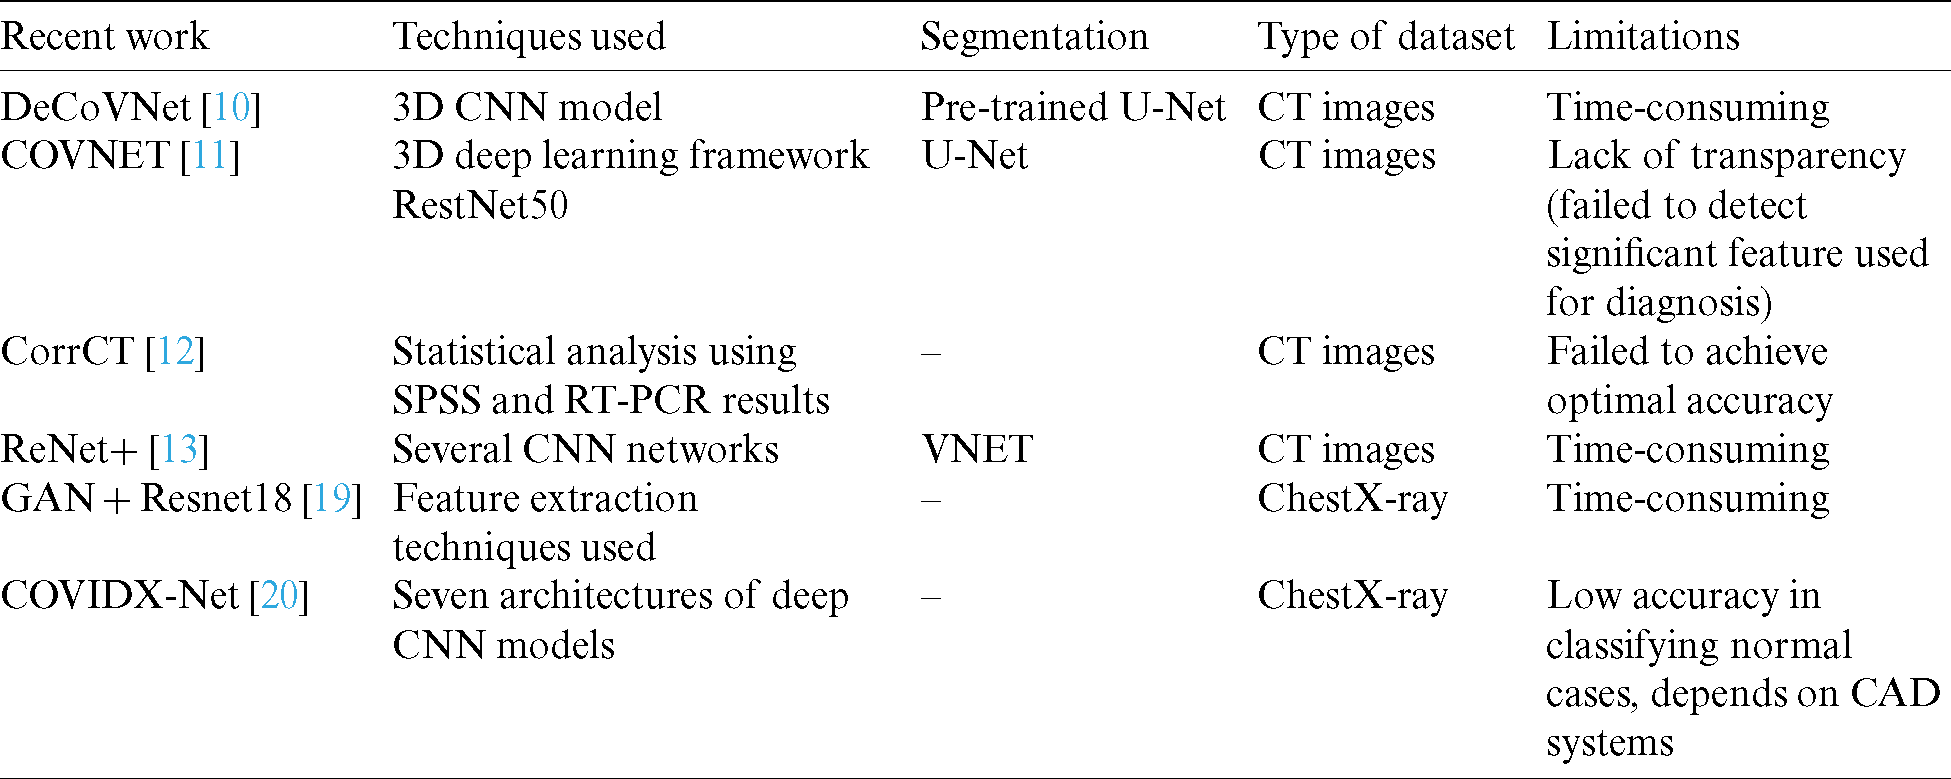
In [10], a deep 3D CNN model was presented, namely DeCoVNet, to distinguish COVID-19 from CT volume. However, this model’s main drawback was that the COVID-19 diagnosis implementation utilized a black box method as the algorithm relied on the deep learning technique. COVNET [11] also developed a framework to identify COVID-19 using CT, and its performance was validated. A 3D deep learning framework was proposed to identify COVID-19 using chest CT. A community-acquired pneumonia (CAP) evaluation was conducted to test the strength of the model. Yang et al. [12] studied the diagnostic value of using CT images compared with RT-PCR analysis for detecting COVID-19. They recommended that chest CT should be used for imaging and following COVID-19 cases. Jiang et al. [13] proposed a screening model using deep learning techniques to differentiate COVID-19 from influenza A in lung CT images. They used several CNN networks to categorize CT images and determine the probability of COVID-19 infection. Their results suggested that early identification of patients with COVID-19 was possible using deep learning technologies [19]. A location-attention mechanism was used in the classical ResNet for feature extraction. Another study [14] constructed a system based on deep learning to identify viral pneumonia by CT. Although all these proposed models were able to give acceptable outcomes, their execution included many lengthy procedures.
Moreover, deep learning methods for diagnosing are time-consuming and difficult for radiologists, especially when there are thousands of images to be processed. Models that depend on deep learning techniques generate black-box problems when diagnosing COVID-19. The proposed AIMDP model avoids these drawbacks by utilizing different AI techniques to enhance the model’s diagnosis and prediction function.
Whale Optimization Algorithm [WOA] WOA is one of the latest nature-inspired metaheuristic algorithms, first introduced by Mirjalili et al. [21]. In the algorithm, whales’ behavior (humpback) is simulated during prey hunting [22]. The humpback whales hunt a group of prey while they swim around the surface. The hunting process is modelled as follows. The whales start to spin around the prey in a circular motion, creating several bubbles (Fig. 1). This process is called the spiral bubble-net attacking method and is represented in the exploitation phase. However, the whale’s process for searching for prey is represented in the exploration phase. Each phase’s mathematical representation is shown below. Several whales use the spiral bubble-net attacking method for surrounding the prey and update their positions based on the prey’s optimal position. These actions [21] are described by (1) and (2).


where | | indicates the absolute value,  is the value of the current iteration,
  specifies the position vector,
  denotes the vector of optimal solutions achieved during past iterations, and C and
  are coefficient vectors calculated by (3) and (4), respectively.


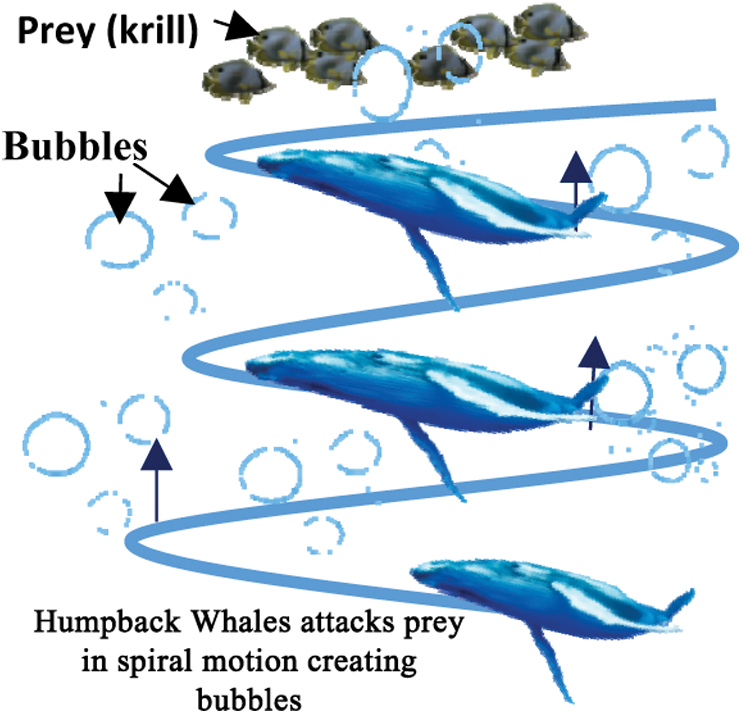
Figure 1: The spiral bubble-net is an attacking method of humpback whales
 is gradually reduced from 2 to 0 over the number of iterations and
  is a random vector ranging from 0 to 1. The position of each solution is updated in the exploitation phase of WOA. WOA can select either a spiral updating position or a shrinking encircling mechanism through the optimization process. On the other hand, to search for prey in the exploration phase, the following processes are implemented. First, the whales randomly search for the prey. Second, a random agent is chosen for managing the search. This search agent leads the search process, and other whales follow this agent and update their positions based on its position. To follow this search agent’s position, instead of following the optimum search agent selected, the following equations are used:


If  , then the search agent will be directed to a position far from the optimum search agent. In (5),
  is a randomly selected position for a solution from the existing population.
In each iteration, the agents’ positions are updated based on the  ’s value. This value is changed in each iteration, resulting in switching between exploitation and exploration. To change between the circular or spiral mechanism of hunting, the parameter D is used.
3 Proposed Artificial Intelligence Inspired Model for the Diagnosis and Prediction of COVID-19 Cases (AIMDP)
Different AI techniques are used in the proposed model based on their functionality in six main phases, as shown in Fig. 2. These phases are pre-processing, segmentation, feature selection, classification, diagnosis recommendation, and evaluation. The AIMDP is used to diagnose and predict whether patients have COVID-19 disease and distinguish it from other viral pneumonia by detecting the most relevant features using the FS and classification phases. The segmentation phase uses CNNs as a deep learning technology. Segmenting the CT images using CNNs before applying the FS process speeds up the diagnosis process, which aids disease containment. To accurately detect the signs of COVID-19 in CT images, the FS phase is based on FSWOA to select the most relevant lung features of COVID-19.
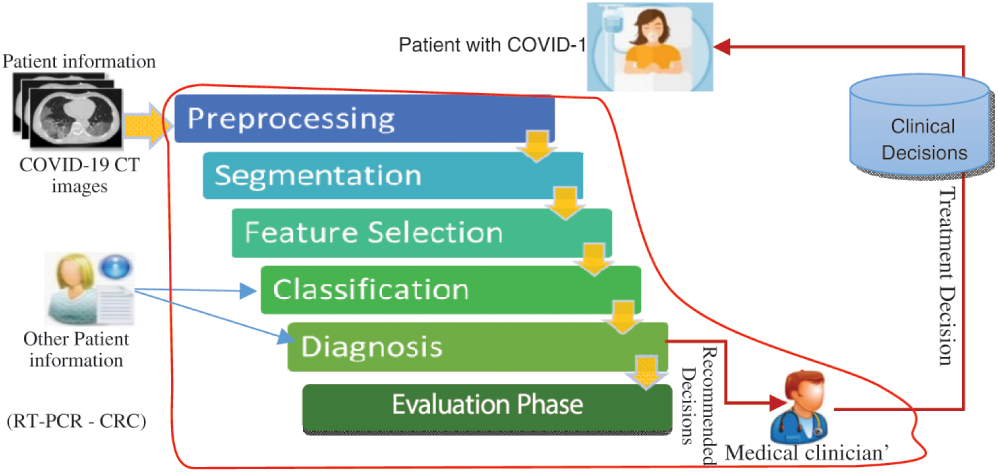
Figure 2: Flow diagram of the artificial intelligence inspired model for the diagnosis and prediction COVID-19 cases
A detailed overview of the proposed AIMDP model is shown in Fig. 3. The model starts with patient information input; this information contains the raw CT image data of suspected patients. The pre-processing phase handles any noise or missing data in the original dataset. Missing data are replaced statically with substituted values. A Gaussian function is used to reduce the noise by blurring the image. The CT images are then sorted into classes based on their features and attributes to extract the significant pulmonary region. A deep learning technology based on CNNs is used in the segmentation phase. CNN’s were initially proposed for image segmentation by Badrinarayanan et al. [23]. Different filters are applied in CNNs to capture the relevant features from an image using predefined parameters and learned weights at every level. In this phase, the following sequences of layers are presented: (1) The maximum pooling (Max Pool) layer is used to reduce the CT image features by summarizing the most stimulated occurrences of a part. (2) The convolution layer is used to convolve a kernel (filter) of weights to extract the features. (3) The pooling layer uses statistical data about the surrounding features to reduce the resolution. In this layer, the maximum pooling method is used to downsample the input features by using filters to detect the maximum number of regions to be applied to feature maps. In other words, it calculates the maximum value for each patch in the feature map. (4) The dense layer searches for specific patterns in pixel values and groups features with the same patterns in specific classes. This means that a dense layer classifies one object into two classes by generating the output (None, 2). To do so, the loss function is selected based on the number of classification categories, which is 2, and then uses the binary cross-entropy loss function. That is used to run the model by calculating the loss and gradient for each pixel and then implementing the back-propagation process. The segmentation phase is used to process the loaded CT images in a limited time for the early diagnosis of COVID-19. A sample of the CT image output from the AIMDP model is shown in Fig. 4.
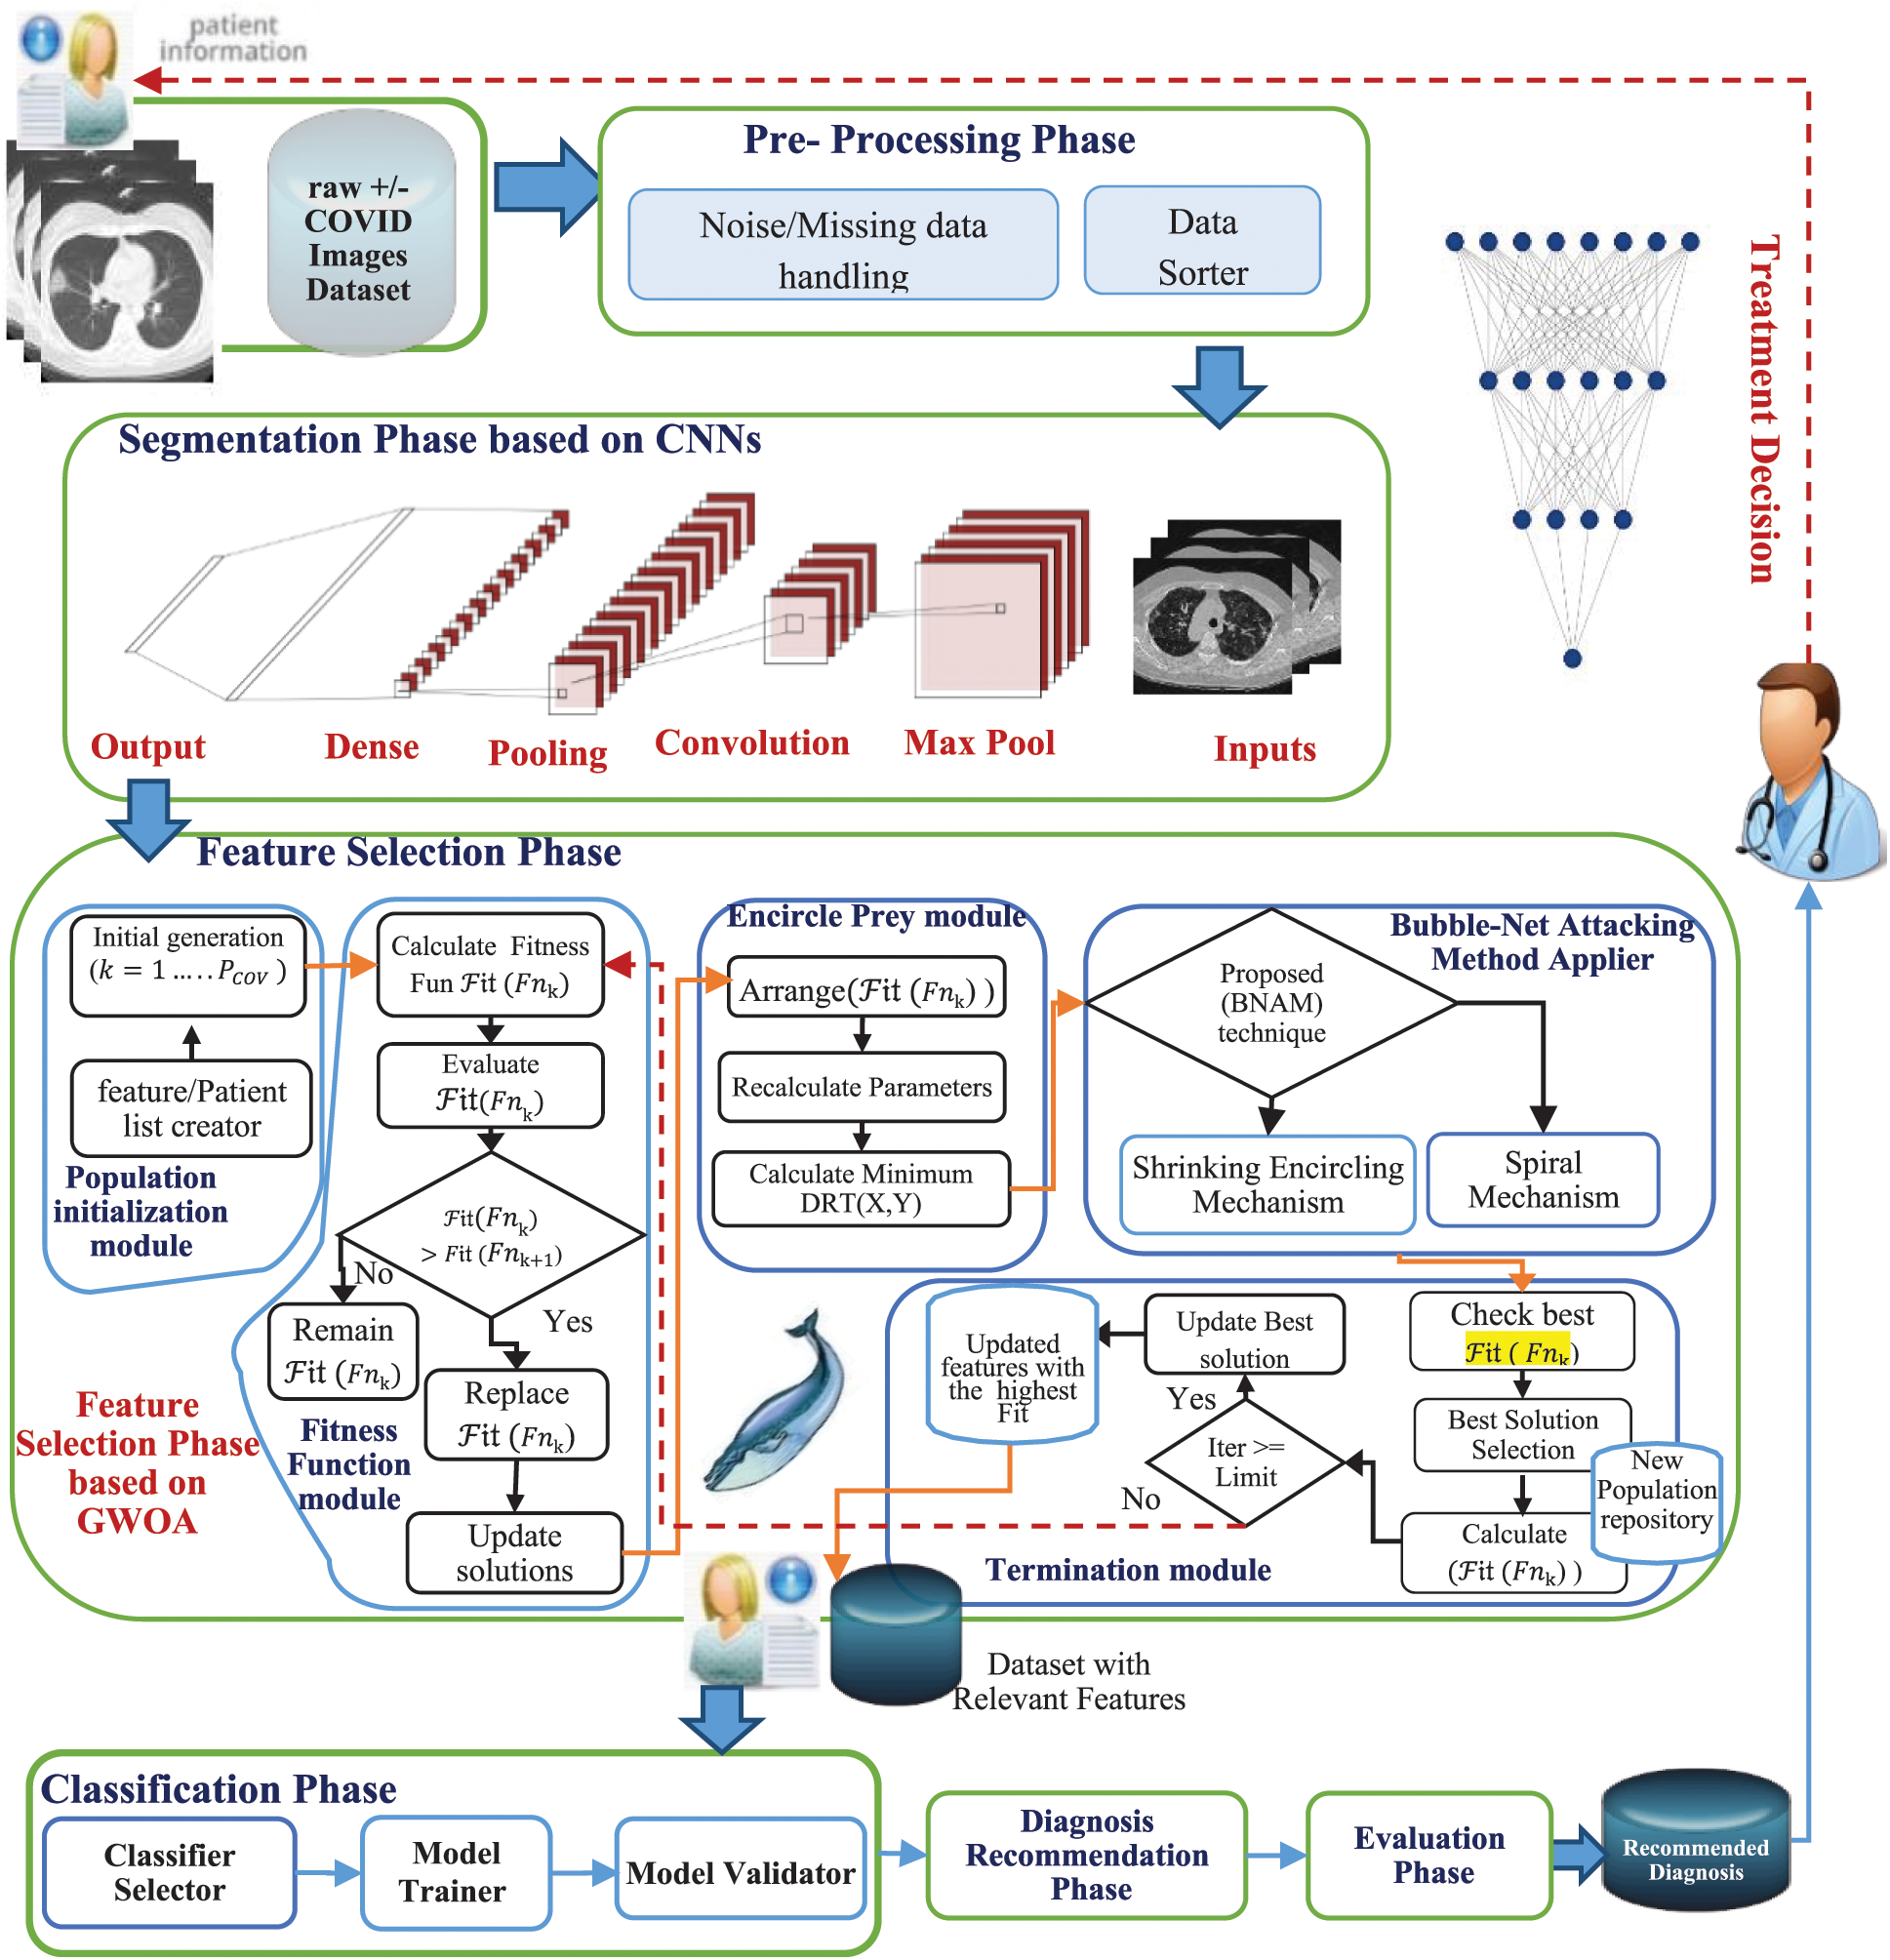
Figure 3: Proposed artificial intelligence model for diagnosing and predicting COVID-19 cases (AIMDP)
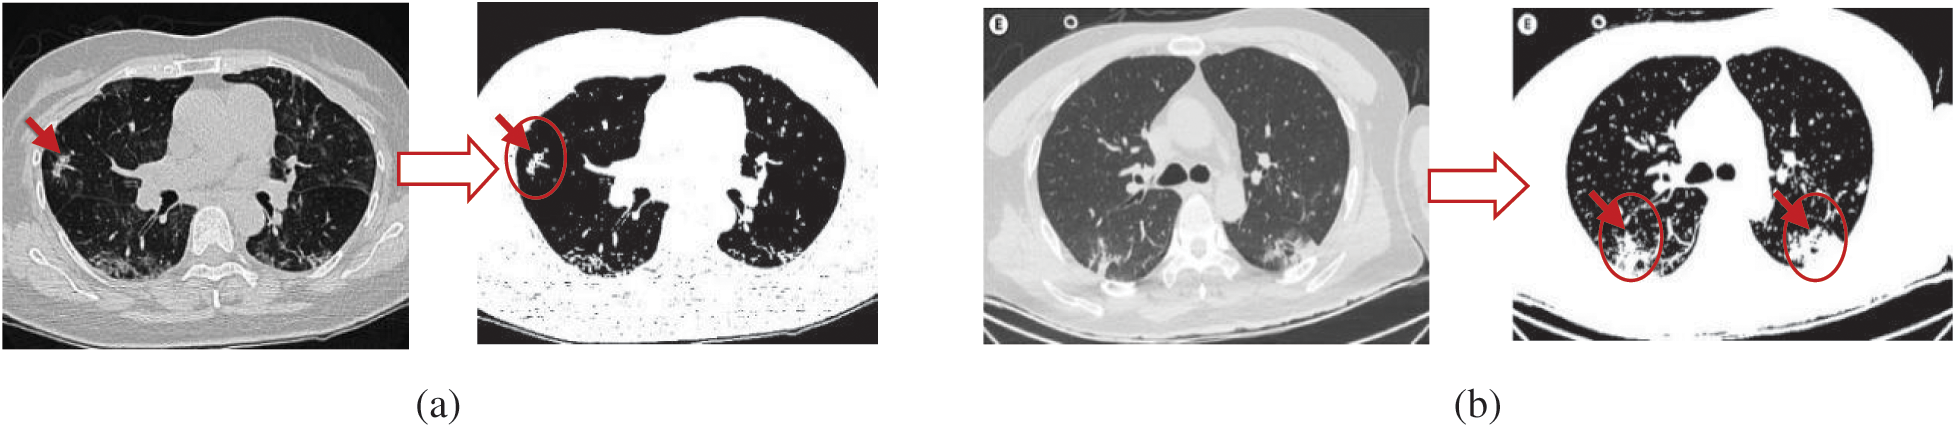
Figure 4: Examples of CT image output from the AIMDP model
The segmentation phase splits all CT images into patches, and then these patches are used as input to the trained CNN. Concurrently, a label is assigned to each patch to represent each feature detected, as shown in Algorithm 1. These labels are then collected to represent the CT key features found, e.g., GGO, SWC, CPP, pleural effusions, large lymph nodes, and lung cavities. The final results of the segmentation of the lung region are obtained by collecting these features. The augmentation is applied to the training data using Algorithm 1 (Fig. 5). The data are transformed into a NumPy array with size [X, Y, Z] for each segment.
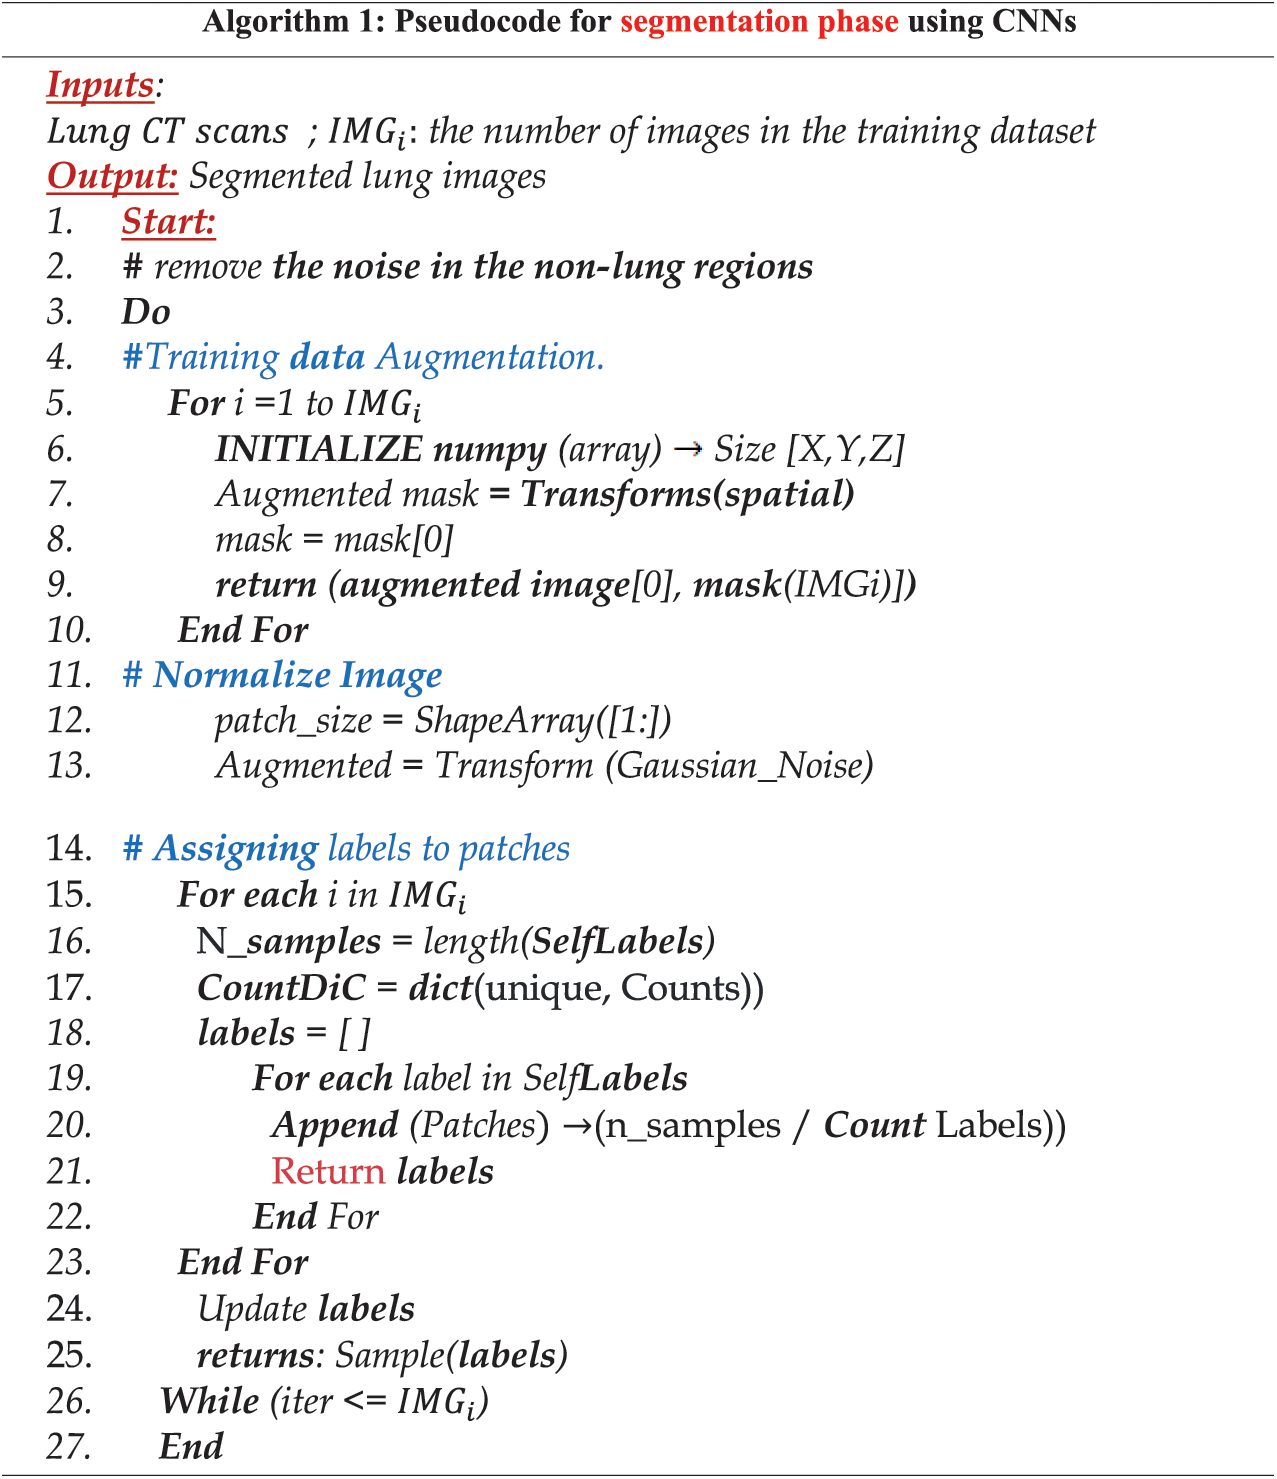
Figure 5: Pseudocode for the segmentation phase
Next, the patch size and masks are determined. For each CT image in the dataset, augmented images are created with their corresponding masks. Normalization is then implemented before applying CNNs to ensure that the input is within specific ranges and noise is removed. Finally, labels are assigned to the detected patches, as shown in Algorithm 1.
3.1 Feature Selection Phase Based on WOA (FSWOA)
Studies [24–30] have investigated various techniques for selecting the most significant features in different fields. The FS phase in AIMDP uses the WOA algorithm to select the most significant features from detailed patient information to distinguish COVID-19 disease from other vital phonemes. The FS phase consists of five modules: population initialization, fitness function, encircle prey, attacking method, and termination module.
In the population initialization module, a random initial generation of different whales (solutions) is created (where k is the number of initialized solutions, ranging from 1 to  ). Each solution denotes the number of features to target the most significant features. The use of an appropriate feature/patient list facilitates the searching process to find the best solution and optimize the accuracy of diagnosing COVID-19 disease. In the fitness function module, these agents (features) are transformed into conceivable solutions for a given fitness function, and the initial generation of WOA parameters is set. The fitness value for each solution (
 ) is calculated using several parameters, as shown below. Each solution is evaluated according to its fitness function values. The one replaces the solution with the smallest fitness value with the largest fitness value. WOA uses a fitness function that selects the minimum number of relevant features for a patient to achieve the optimal accuracy for diagnosing the virus. As mentioned later, the most common CT sign in COVID-19 is GGO, which indicates that the alveoli are full of liquids. This sign is shown in the CT images as a grey shadow. SWC is shown in more severe cases, indicating that there is more liquid in the lungs.
The CPP swelling makes the wall look thicker, causing some white lines and the blurred grey area caused by  . It is worth mention that some CT finding are usually not seen in COVID19, or seen less often, like Pleural Effusions (PE), Large Lymph Nodes (LLN) and Lung Cavities(LC) that can be devolved in other pneumonia. From these findings, a fitness function can be calculated as follows:

where  is the function used to indicate the probability of positivity of COVID19,

where  is the function used to indicate the probability of negativity of COVID19, the fitness function for every feature is estimated, as follows:

where Fnk is the fitness function calculated for the solution k and PCOV is the total number of features identified.  symbolizes the error rate of classification for a specified classier. The values of each calculated fitness function are then rearranged in descending order, by the search agents, in which the highest fitness function value is the first value, as shown in Fig. 3. The encircle prey module searches for the optimal solution in the best surrounding solution using the Distance Ratio Test (DRT) technique [31]. DRT is used to identify the accurate location of the solution during the search process. In the attacking method applier module, a Bubble-Net Attacking Method (BNAM) technique is used, first proposed by [31], to shift between different whales’ attacking methods based on prey’s location. Based on the solution’s location detected and other locations, BNAM selects the suitable mechanism for this location. It switches between the shrinking encircling and spiral mechanism. A predefined number of Maxit is determined to indicate the maximum iteration’s number to terminate the search process. In the termination module, if the search process exceeds this number, then the process is terminated. Moreover, the largest fitness function value is selected to be the optimum solution.
The selected features are passed to the classification phase [31,32], which uses additional data from RT-PCR and CBC, when needed, to accurately classify patients based on their viral pneumonia signs and features. The AIMDP model uses the classifier selector module to choose the classifier with the most accurate value for the tested case. The tested classifiers are SVM, naive Bayes (NB), and discriminant analysis (DA) to test the performance from different perspectives. The FSWOA phase delivers to the classifier the number of solutions. Each solution indicates a set of features. When the feature is selected, a value of one is assigned, whereas if the feature is not selected, a value of 0 is assigned. Therefore, WOA searches for the most robust set of features that achieves the highest accuracy with either the SVM, NB or DA classifier, and the fitness function is utilized. The classification outcome is estimated based on the values of optimum features obtained from a CT scan. If a case is suspected (not confirmed) as a COVID-19 case, further lab evaluations must be considered for accurate classification. The classification phase’s main goal is to differentiate COVID-19 patients from other infections. After classifying the data, the model is trained and validated in this layer. A confusion matrix is produced as a graphic form of performance. Each row refers to the instances in its real class, whereas each column refers to the instances in a predicted class. Based on this matrix, the sensitivity, specificity, accuracy, and F-measure are calculated to evaluate the classifier.
3.3 Diagnosis Recommendation Phase
In this phase, the performance of each classifier’s prediction is evaluated based on further evaluation from lab tests, e.g., RT-PCR and CBC, to exclude other causes and to accurately diagnosis COVID-19. The diagnosis phase uses CT chest scans to diagnose COVID-19 based on the relevant signs extracted. As mentioned before, GGO is usually the first sign of COVID-19 and can appear either in isolation or in combination with SWC or CPP. These features generally appear in multiple lobes in both lungs and the outer periphery of the lungs. In less severe and recovery cases of COVID-19, the signs may be isolated to just one lung section. The assumption is that these three signs are more likely to be recognized in COVID-19 than in other forms of viral pneumonia. Otherwise, the diagnosis cannot be made based on chest CT scan images alone. The diagnosing phase uses further evaluation from lab tests to exclude other causes and accurately diagnose COVID-19. The recommendations are then evaluated using different metrics in the evaluation phase, as shown in Fig. 6. Finally, the results are sent to the clinic, which has to deal with the challenge of increasing patient numbers and analyzing high-dimensional patient data to give a final decision for a specific patient. Fig. 6 shows a flowchart of our study implementation. Of 617 patients, 432 had relevant features after excluding 134 non-lung images. In total, 280 were used for training AIMDP and 134 for testing. If the diagnosis phase detected a COVID-19 case, the diagnosis process would be evaluated after checking that AIMDP finished the runs in the dataset used.
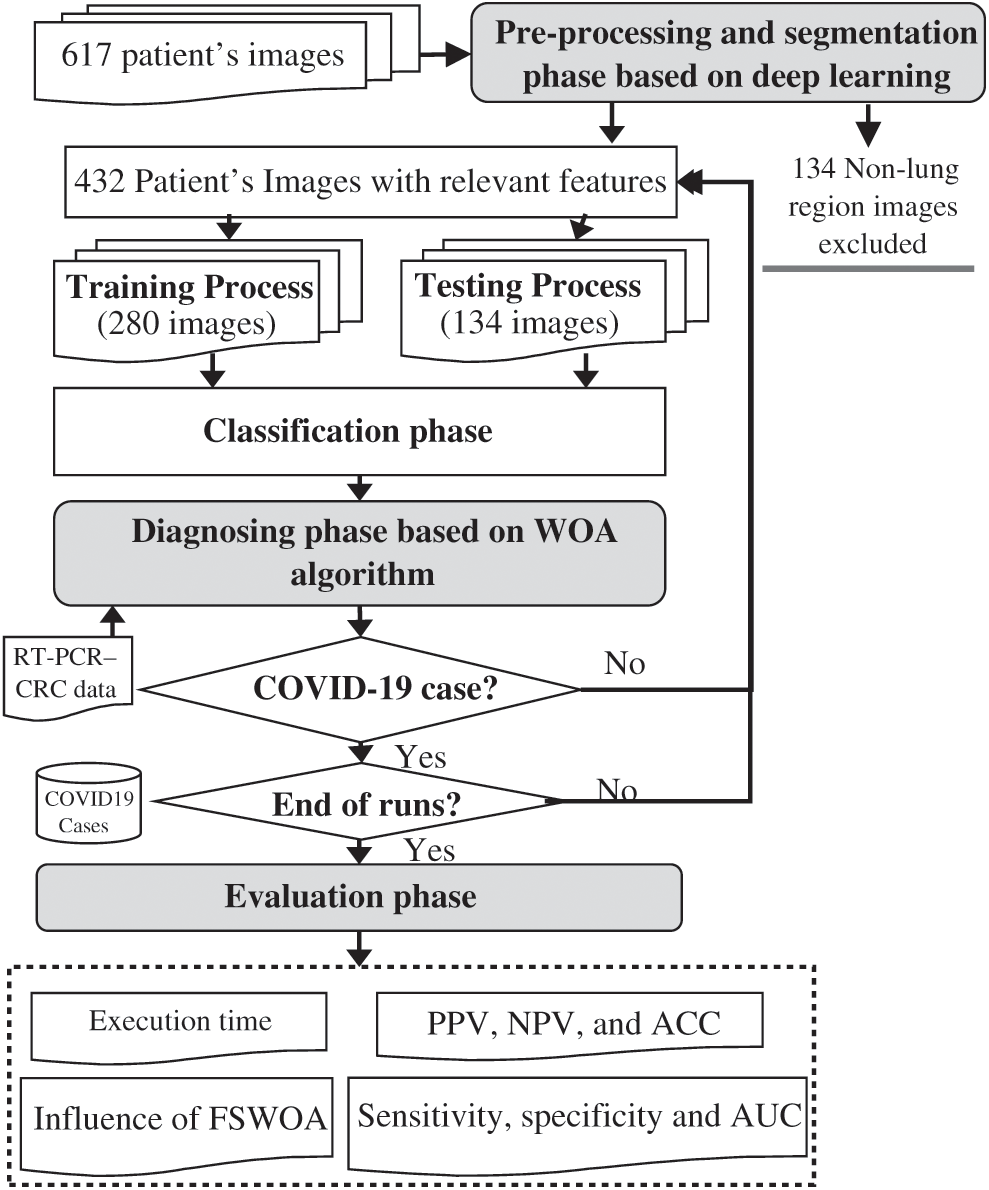
Figure 6: Flow diagram for the diagnosis process and evaluation phase
4 Overall Performance Evaluation
A set of simulated experiments were performed to evaluate the performance of the proposed AIMDP.
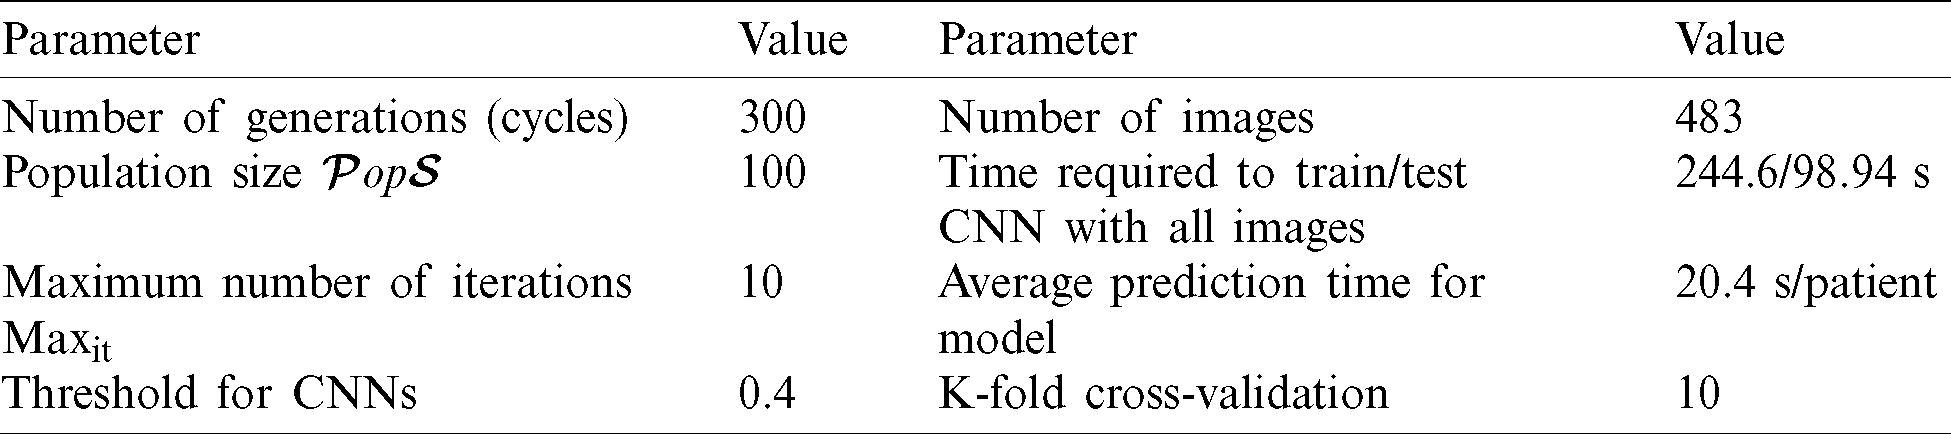
The methods were applied on a Windows 10 PC with an Intel(R) Core (TM) i7 CPU with 16 GB RAM and 2.81 GHz clock speed using MATLAB R2019a. Tab. 2 shows the evaluation parameters used in implementing the AIMDP model.
Table 2: Evaluation parameters for the AIMDP model
A total of 617 CT chest scans were collected from different resources: 134 non-lung region images were excluded from testing, 432 patients with COVID-19, 151 patients were infected with other viral pneumonia. The AIMDP model uses CNNs as a deep learning technology. The TensorFlow [33] framework is used, one of the most popular deep learning open source libraries. Fig. 7 shows a snapshot of the training process on TensorFlow. The CNNs was optimized by Adam optimizer [34] for weight updates.
Figure 7: Snapshot of the training process using TensorFlow
4.1 Performance Evaluation Measures
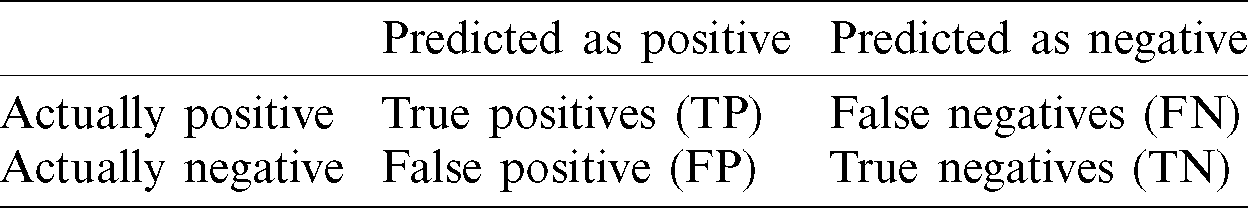
To evaluate the proposed models’ effectiveness, the F-measure (score), accuracy, precision, recall (sensitivity) and specific measures were considered [35,36]. Tab. 3 shows the confusion matrix used to evaluate the performance.

The essential measures of the performance were the true positive rate (TPR), true negative rate (TNR), positive predictive value (PPV) and negative predictive value (NPV), as defined as follows:


The F-measure (also known as the F-score) is a typical metric for data classification. It represents a harmonic mean between recall and precision

A binary result (TPR or TNR values) was considered insufficient to evaluate the performance of the diagnosis process. An area under curve - receiver operating characteristic (AUC-ROC) curve [37] was generated as a plot between the TPR ( ) and TNR (
 ) and used to evaluate the diagnostic performance. AUC can be calculated by integrating the areas of small trapezoidal sections under the ROC curve [37]. The following equation was used to calculate the FP percentage:

It is equivalent to 1–-specificity. The TP percentage is the recall, which is calculated by the formula:

4.2 Experiment 1: Evaluation of the Overall Performance of the AIMDP Model
To validate the efficiency of the AIMDP model, the overall precision, accuracy and sensitivity were calculated and the results compared to those obtained from DeConNet [10], COVNet [11], CorrCT [12] and ReNet+ [13] (Fig. 8). To verify the performance of AIMDP by comparison with other algorithms, the number of images and threshold values were set to be the same in all simulations. Fig. 8 demonstrates the significant superiority of AIMDP over the other models in terms of precision, accuracy and sensitivity.
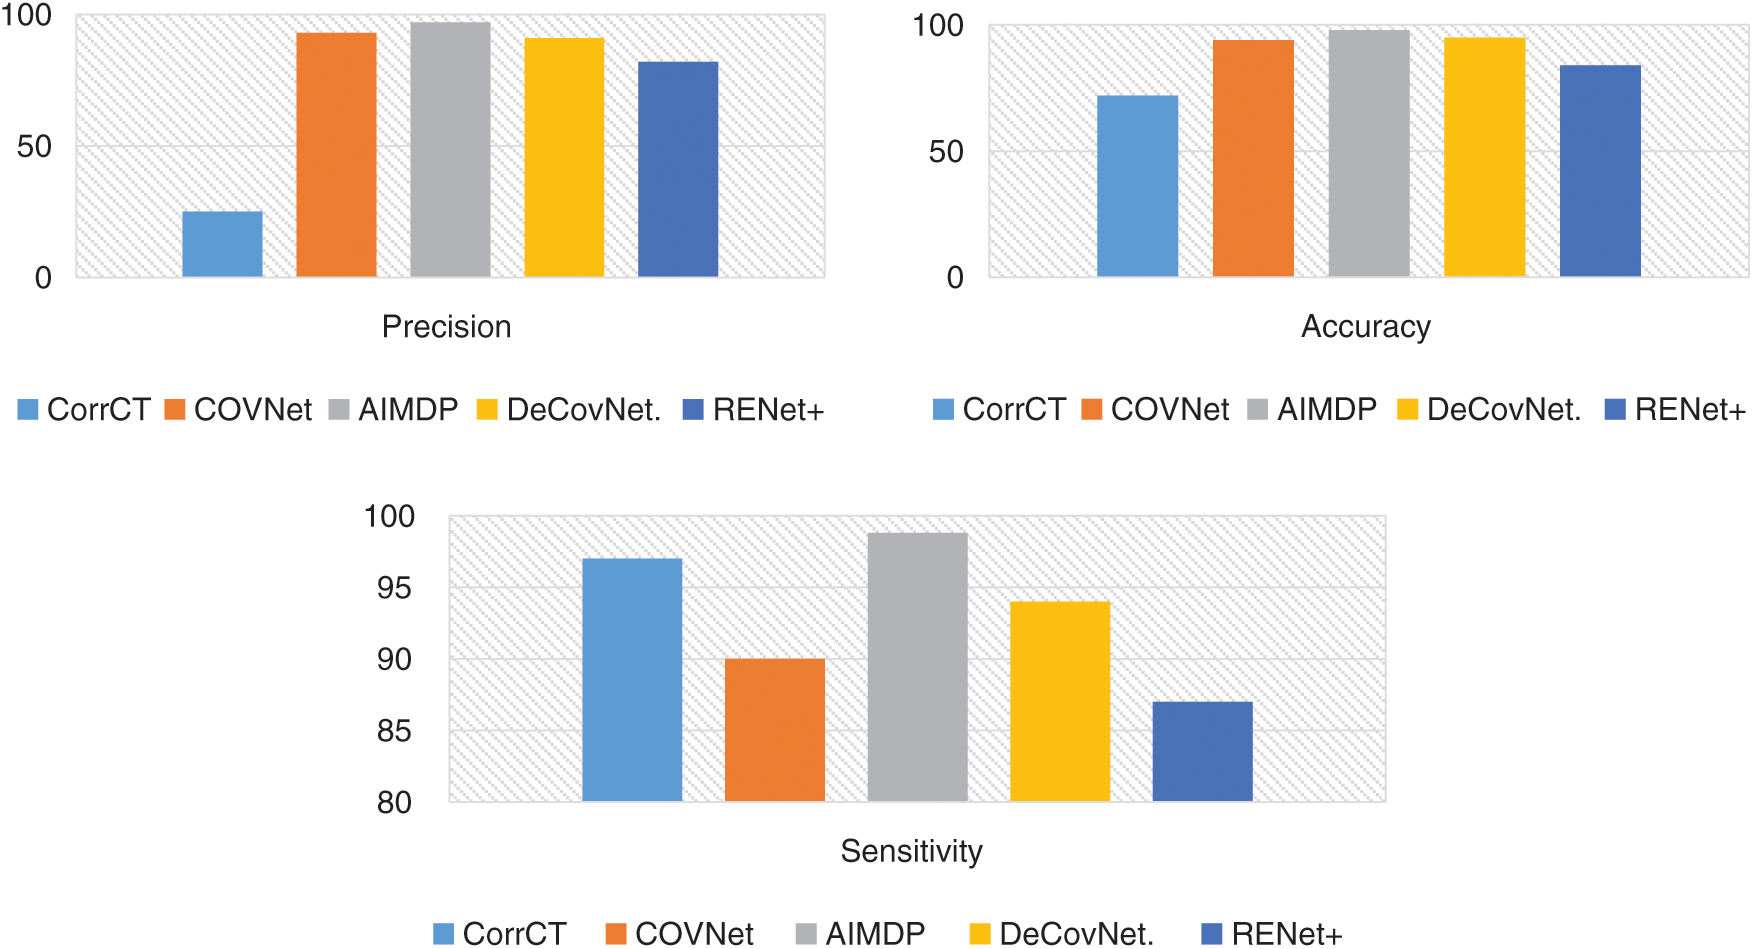
Figure 8: Overall precision, accuracy and sensitivity of the AIMDP model compared to other models
In addition, Fig. 9 shows that AIMDP had a lower execution time compared to DeConNet [10], COVNet [11], CorrCT [12] and ReNet+ [13]. This is due to complex processes included in their executions, which need a longer time. Moreover, the use of deep learning methods for diagnosis is often time-consuming. However, AIMDP only considers the lung regions and removes the noise in the non-lung regions in the pre-processing phase. Thus, it is not necessary to segment the whole image using CNNs.
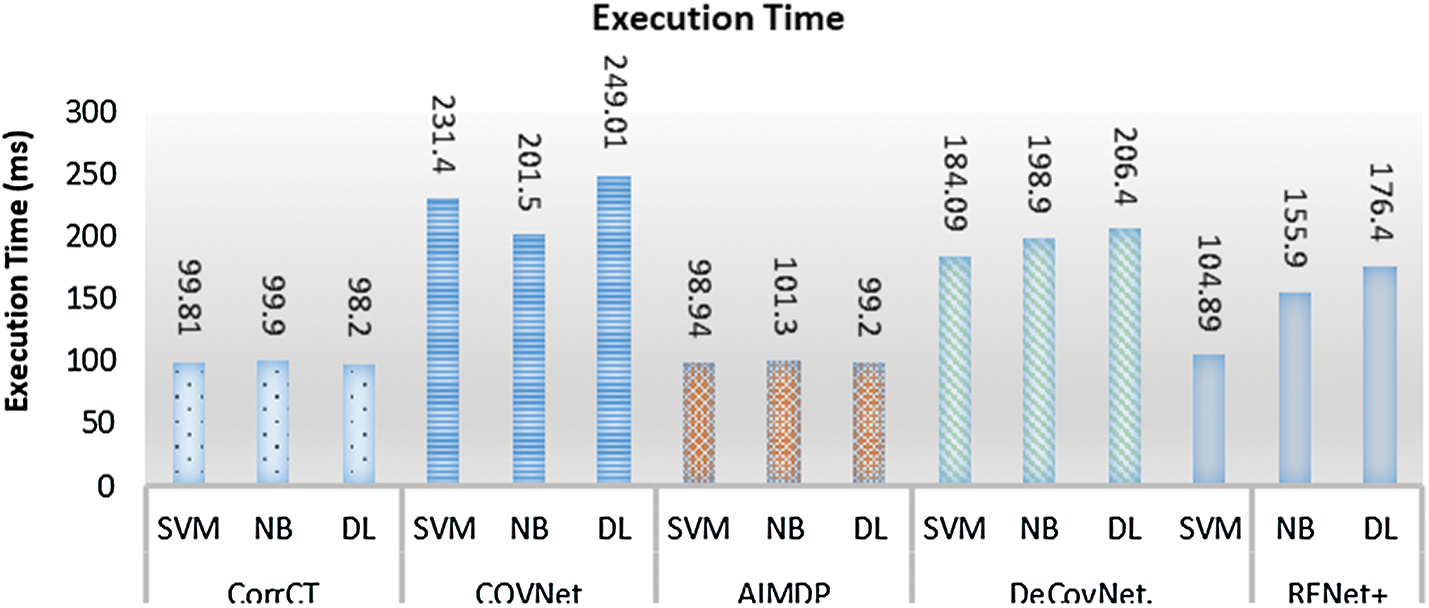
Figure 9: Execution time of AIMDP model compared to other models when using different classifiers
4.3 Experiment 2: Evaluation of PPPV, NPV and ACC for Different Thresholds
The main goal of this experiment was to test the influence of varying the probability threshold on the prediction and diagnosis process of AIMDP by calculating PPV (Eq. (13)), NPV (Eq. (14)) and overall accuracy (ACC) (Eq. (10)). Fig. 10 shows the diagnostic performance for COVID-19 cases after varying the probability threshold. When the threshold ranged from 0.25 to 0.5, the average values of ACC, NPV and PPV were 0.95, 0.97 and 0.87, respectively.
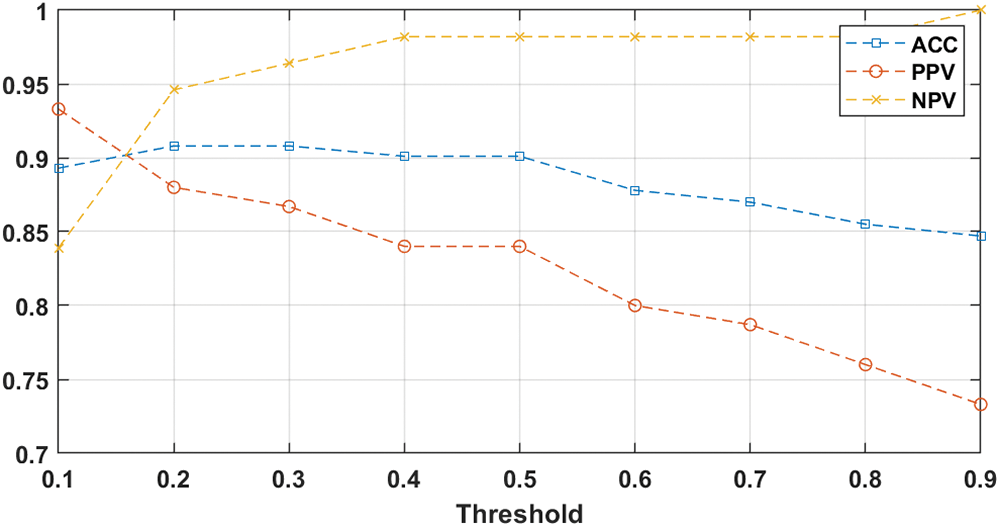
Figure 10: AIMDP diagnostic performance after changing the probability threshold
4.4 Experiment 3: Evaluation of the Influence of the FSWOA Module on AIMDP Performance
FS is the most critical phase in the AIMDP model. WOA is implemented in this phase AIMDP to decrease the number of non-significant features processed by the model and enhance its performance.
The effect of using FSWOA is shown in Fig. 11. The overall precision, recall and accuracy of the AIMDP model were tested with or without implementing the FSWOA module.
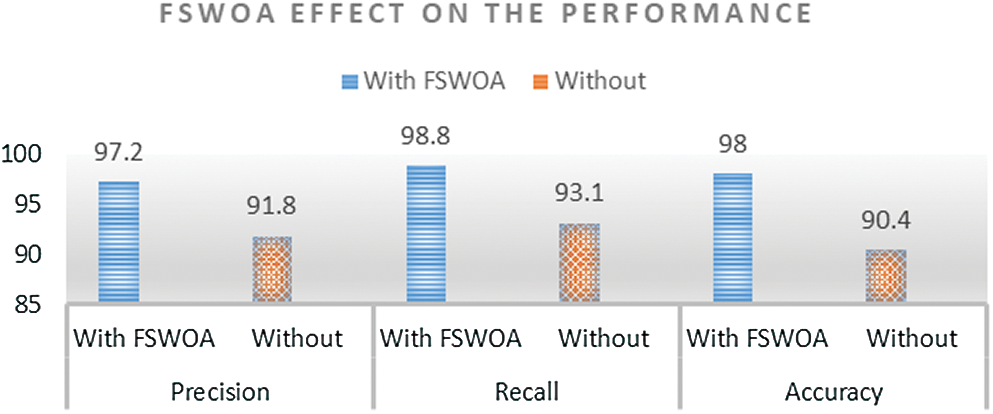
Figure 11: Overall precision, recall and accuracy of the AIMDP model with or without implementing the FSWOA module
The AIMDP model’s performance when using the FSWOA module was significantly better than without the module.
4.5 Experiment 4: Evaluation of the Diagnosis Phase
The performance of AIMDP for diagnosing COVID-19 patients and or other viral pneumonia patients was evaluated by plotting an AUC-ROC curve (Fig. 12). The sensitivity (Eq. (11)), specificity (Eq. (12)) and AUC for COVID-19 were 90%, 96%, 0.96, respectively. For other viral types of pneumonia, the equivalent values were 94%, 96% and 0.98, respectively.
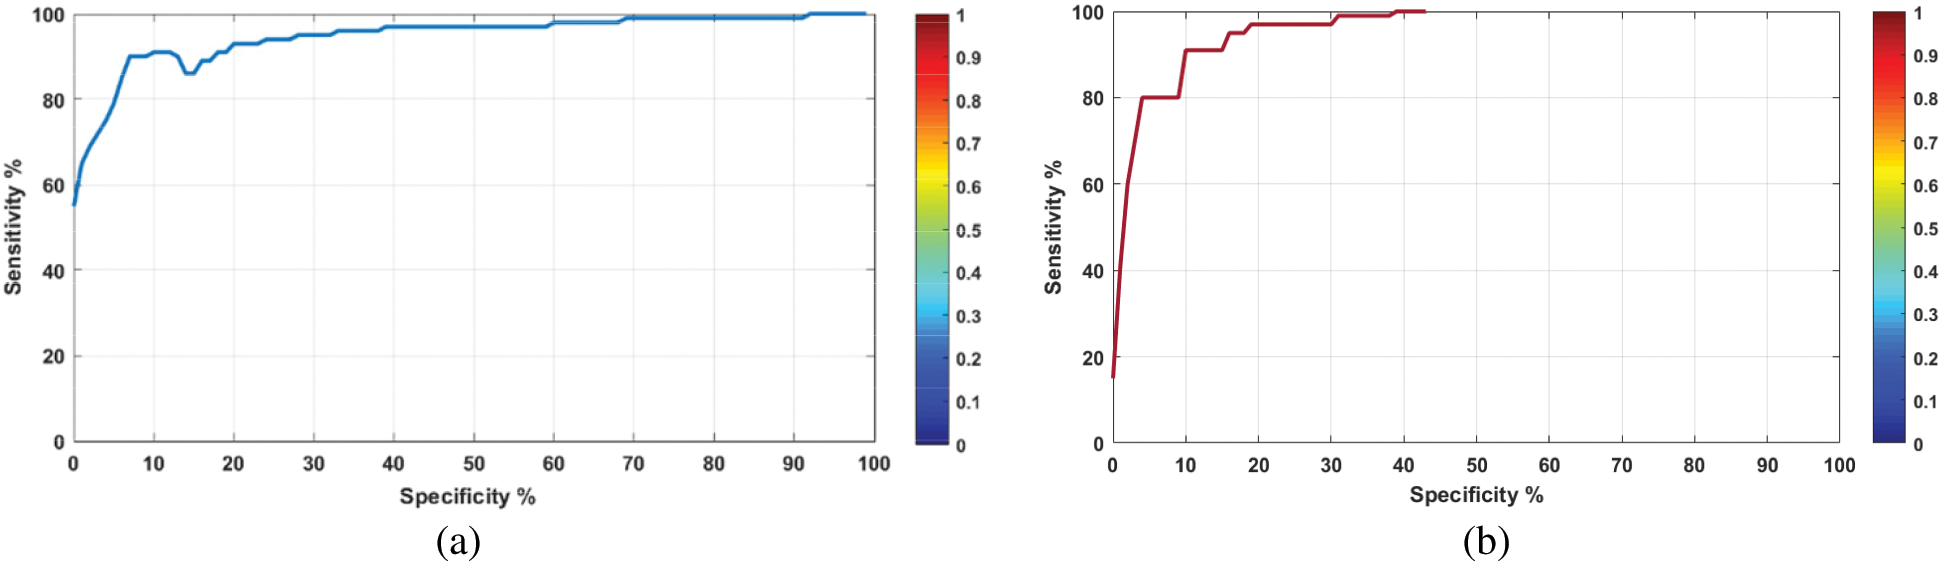
Figure 12: AUC-ROC curves of the diagnosing module in AIMDP using the testing set for (a) COVID-19 and (b) other viral pneumonias
Furthermore, the accuracy of the diagnosing phase in AIMDP was calculated and compared to that obtained from DeConNet [10], COVNet [11], CorrCT [12] and ReNet+ [13], as shown in Fig. 13.
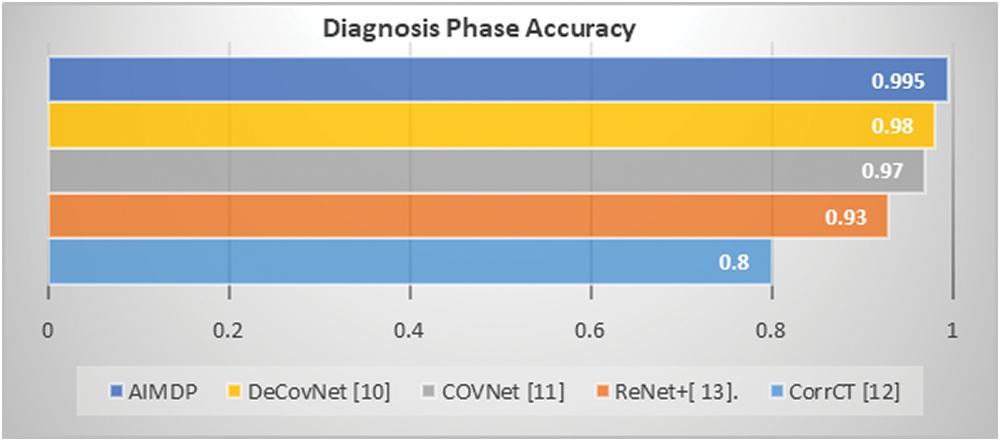
Figure 13: Accuracy of diagnosing phase in AIMDP compared to other models
The accuracy of each phase in the AIMDP model was also calculated separately (Tab. 4).
Table 4: Accuracy of each phase in AIMDP

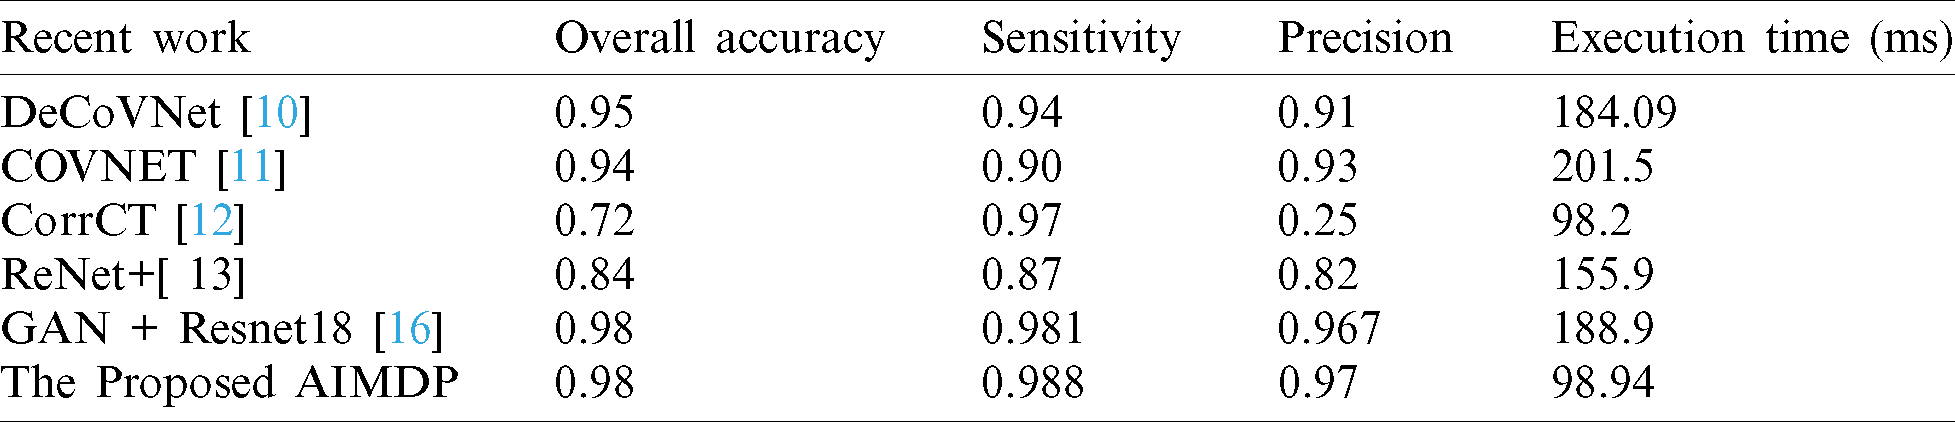
Tab. 5 shows a comparison of AIMDP with other state-of-the-art models in terms of the accuracy, precision, sensitivity and execution time.
Table 5: Comparison between AIMDP and other recent models
WHO has declared the COVID-19 outbreak as a pandemic capable of causing a large number of deaths worldwide. The accurate diagnosis of COVID-19 cases plays a critical role in inhibiting its spread. In our study, artificial intelligence techniques were implemented in a proposed model, named AIMDP, for COVID-19 diagnosis and prediction. CNN’s were used as a deep learning technology for segmenting chest CT images of patients suspected of having COVID-19. WOA was used in a FS phase to select the minimum set of relevant features for diagnosing COVID-19 to optimize the results. An intelligent classifier selector was implemented to select, from three different classifiers, the most appropriate classifier based on the classification error obtained for each case. An automatic diagnosing phase was implemented to differentiate COVID-19 cases from other viral pneumonia cases, using CT scan images with the most relevant signs of COVID-19 cases and further lab evaluation. Experiments were performed to evaluate the AIMDP model’s performance. The results demonstrated the promising performance of AIMDP for diagnosing COVID-19 compared to other recent diagnosing and predicting models. AIMDP achieved a high AUC and PPV, and low NPV and execution time compared to other models.
It should be mentioned that this study has some limitations. Firstly, only a limited number of image samples were used. Secondly, the CT datasets were generated from a single-center, resulting in a lack of standardization invalidation. In the future, it would be preferable to include CT images from multiple centers. In future work, we plan to assess whether the model can detect the severity of COVID-19 disease to guide appropriate treatment and isolation. We also intend to create a dataset of additional CT scans from different locations to evaluate the model’s performance.
Funding Statement: The authors received no specific funding for this study.
Conflicts of Interest: The authors declare that they have no interest in reporting regarding the present study.
1. A. E. Gorbalenya. (2020). “Severe acute respiratory syndrome-related coronavirus: The species and its viruses, a statement of the Coronavirus Study Group,” BioRxiv. [Google Scholar]
2. N. Zhu, D. Zhang, W. Wang, X. Li, B. Yang et al. (2020). , “A novel coronavirus from patients with pneumonia in China, 2019,” New England Journal of Medicine, vol. 382, pp. 727–733. [Google Scholar]
3. A. Abraich. (2020). “COVID-19: Statistical exploration,” . [Online]. Available: https://doi.org/10.13140/RG.2.2.27482.49604. [Google Scholar]
4. World Health Organization. (2020). “Coronavirus disease 2019 (COVID-19Situation report, 82,” . [Online]. Available: https://www.who.int/emergencies/diseases/novel-coronavirus-2019/situation-reports/ [Accessed 11 November 2020]. [Google Scholar]
5. Z. Y. Zu, M. D. Jiang, P. P. Xu, W. Chen, Q. Q. Ni et al. (2020). , “Coronavirus disease 2019 (COVID-19A perspective from China,” Radiology, vol. 296, no. 2, pp. 200490. [Google Scholar]
6. D. S. Hui, E. I. Azhar, T. A. Madani, F. Ntoumi, R. Kock et al. (2020). , “The continuing 2019-nCoV epidemic threat of novel coronaviruses to global health–-The latest 2019 novel coronavirus outbreak in Wuhan, China,” International Journal of Infectious Diseases, vol. 91, pp. 264–266. [Google Scholar]
7. T. C. COVID and R. Team, “Severe outcomes among patients with coronavirus disease 2019 (COVID-19)-United States, February 12–March 16, 2020,” Centers for Disease Control and Prevention, vol. 69. [Google Scholar]
8. D. K. Chu, Y. Pan, S. M. Cheng, K. P. Hui, P. Krishnan et al. (2020). , “Molecular diagnosis of a novel coronavirus (2019-nCoV) causing an outbreak of pneumonia,” Clinical Chemistry, vol. 66, no. 4, pp. 549–555. [Google Scholar]
9. P. Nardelli, J. C. Ross and R. S. J. Estépar. (2020). “Generative-based airway and vessel morphology quantification on chest CT images,” Medical Image Analysis, vol. 63, pp. 101691. [Google Scholar]
10. C. Zheng, X. Deng, Q. Fu, Q. Zhou, J. Feng et al. (2020). , “Deep learning-based detection for COVID-19 from chest CT using weak label,” medRxiv. [Google Scholar]
11. L. Li, L. Qin, Z. Xu, Y. Yin, X. Wang et al. (2020). , “Using artificial intelligence to detect COVID-19 and community-acquired pneumonia based on pulmonary CT: Evaluation of the diagnostic accuracy,” Radiology, vol. 296, no. 2, pp. 200905. [Google Scholar]
12. T. Ai, Z. Yang, H. Hou, C. Zhan, C. Chen et al. (2020). , “Correlation of chest CT and RT-PCR testing in coronavirus disease 2019 (COVID-19) in China: A report of 1014 cases,” Radiology, vol. 296, no. 2, pp. 200642. [Google Scholar]
13. X. Xu, X. Jiang, C. Ma, P. Du, X. Li et al. (2020). , “Deep learning system to screen coronavirus disease 2019 pneumonia. arXiv preprint, arXiv: 2002.09334. [Google Scholar]
14. V. M. Corman, O. Landt, M. Kaiser, R. Molenkamp, A. Meijer et al. (2020). , “Detection of 2019 novel coronavirus (2019-nCoV) by real-time RT-PCR,” Eurosurveillance, vol. 25, no. 3, pp. 2000045. [Google Scholar]
15. D. Ezzat, A. Hassanien and H. Ella. (2020). “An optimized deep learning architecture for the diagnosis of COVID-19 disease based on gravitational search optimization,” Applied Soft Computing, vol. 98, pp. 106742. [Google Scholar]
16. General Office of National Health Committee. (2020). “Notice on the issuance of a program for the diagnosis and treatment of novel coronavirus (2019-nCoV) infected pneumonia (trial sixth edition) (2020-02-18),” [Online] Available: http://www.nhc.gov.cn/yzygj/s7653p/202002/8334a8326dd94d329df351d7da8aefc2.shtml?from=timeline [Accessed Feb. 24, 2020]. [Google Scholar]
17. J. Lei, J. Li, X. Li and X. Qi. (2020). “CT imaging of the 2019 novel coronavirus (2019-nCoV) pneumonia,” Radiology, vol. 295, no. 1, pp. 200236. [Google Scholar]
18. Y. Yang, M. Yang, C. Shen, F. Wang, J. Yuan et al. (2020). , “Laboratory diagnosis and monitoring the viral shedding of 2019-nCoV infections,” MedRxiv. [Google Scholar]
19. N. E. Khalifa, M. H. Taha, A. E. Hassanien and S. Elghamrawy. (2020). “Detection of coronavirus (COVID-19) associated pneumonia based on generative adversarial networks and a fine-tuned deep transfer learning model using chest X-ray dataset. arXiv preprint, arXiv: 2004.01184. [Google Scholar]
20. E. E. D. Hemdan, M. A. Shouman and M. E. Karar. (2020). “COVIDX-Net: A framework of deep learning classifiers to diagnose COVID-19 in X-ray images. arXiv preprint, arXiv: 2003.11055. [Google Scholar]
21. S. Mirjalili and A. Lewis. (2016). “The whale optimization algorithm,” Advances in Engineering Software, vol. 95, pp. 51–67. [Google Scholar]
22. J. A. Goldbogen, A. S. Friedlaender, J. Calambokidis, M. F. Mckenna, M. Simon et al. (2013). , “Integrative approaches to the study of baleen whale diving behavior, feeding performance, and foraging ecology,” BioScience, vol. 63, no. 2, pp. 90–100. [Google Scholar]
23. V. Badrinarayanan, A. Kendall and R. Cipolla. (2017). “Segnet: A deep convolutional encoder-decoder architecture for image segmentation,” IEEE Transactions on Pattern Analysis and Machine Intelligence, vol. 39, no. 12, pp. 2481–2495. [Google Scholar]
24. J. Cheng, R. M. Xu, X. Y. Tang, V. S. Sheng and C. T. Cai. (2018). “An abnormal network flow feature sequence prediction approach for DDoS attacks detection in big data environment,” Computers Materials & Continua, vol. 55, no. 1, pp. 95–119. [Google Scholar]
25. M. Chung, A. Bernheim, X. Mei, N. Zhang, M. Huang et al. (2020). , “CT imaging features of 2019 novel coronavirus (2019-nCoV),” Radiology, vol. 295, no. 1, pp. 202–207. [Google Scholar]
26. S. M. Elghamrawy. (2016). “A knowledge management framework for imbalanced data using frequent pattern mining based on bloom filter,” in 11th Int. Conf. on Computer Engineering & Systems, Egypt, IEEE, pp. 226–231. [Google Scholar]
27. S. Elghamrawy. (2020). “Healthcare informatics challenges: A medical diagnosis using multi agent coordination-based model for managing the conflicts in decisions,” in Proc. Int. Conf. on Advanced Intelligent Systems and Informatics, Cham: Springer, pp. 347–357. [Google Scholar]
28. C. Huang, Y. Wang, X. Li, L. Ren, J. Zhao et al. (2020). , “Clinical features of patients infected with 2019 novel coronavirus in Wuhan, China,” Lancet, vol. 395, no. 10223, pp. 497–506. [Google Scholar]
29. J. F. Chan, S. Yuan, K. H. Kok, K. K. To, H. Chu et al. (2020). , “A familial cluster of pneumonia associated with the 2019 novel coronavirus indicating person-to-person transmission: A study of a family cluster,” Lancet, vol. 395, no. 10223, pp. 514–523. [Google Scholar]
30. S. M. Elghamrawy. (2020). “An H2O’s deep learning-inspired model based on big data analytics for coronavirus disease (COVID-19) diagnosis,” in Big Data Analytics and Artificial Intelligence Against COVID-19: Innovation Vision and Approach, Studies in Big Data. vol. 78. Cham: Springer Press, pp. 263–279. [Google Scholar]
31. S. M. Elghamrawy and A. E. Hassanien. (2019). “GWOA: A hybrid genetic whale optimization algorithm for combating attacks in cognitive radio network,” Journal of Ambient Intelligence and Humanized Computing, vol. 10, no. 11, pp. 4345–4360. [Google Scholar]
32. N. B. Abdel-Hamid, S. Elghamrawy, A. Eldesouky and A. Arafat. (2018). “A dynamic spark-based classification framework for imbalanced big data,” Journal of Grid Computing, vol. 16, no. 4, pp. 607–626. [Google Scholar]
33. X. Lu, L. Zhang, H. Du, J. Zhang, Y. Li et al. (2020). , “SARS-CoV-2 infection in children,” New England Journal of Medicine, vol. 382, no. 17, pp. 1663–1665. [Google Scholar]
34. D. P. Kingma and J. Ba. (2017). “Adam: A method for stochastic optimization,” arXiv preprint, arXiv: 14126980 Cs. [Google Scholar]
35. M. A. Mohammed, K. H. Abdulkareem, A. S. Al-Waisy, S. A. Mostafa, S. Al-Fahdawi et al. (2020). , “Benchmarking methodology for selection of optimal COVID-19 diagnostic model based on entropy and TOPSIS methods,” IEEE Access, vol. 8, pp. 99115–99131. [Google Scholar]
36. G. Pinter, I. Felde, A. Mosavi, P. Ghamisi and R. Gloaguen. (2020). “COVID-19 pandemic prediction for Hungary; a hybrid machine learning approach,” Mathematics, vol. 8, no. 6, pp. 890. [Google Scholar]
37. J. Davis and M. Goadrich. (2006). “The relationship between precision-recall and ROC curves,” in Proc. of the 23rd Int. Conf. on Machine Learning, pp. 233–240. [Google Scholar]
 | This work is licensed under a Creative Commons Attribution 4.0 International License, which permits unrestricted use, distribution, and reproduction in any medium, provided the original work is properly cited. |