DOI:10.32604/cmc.2021.014691
| Computers, Materials & Continua DOI:10.32604/cmc.2021.014691 | |
| Article |
Recognition and Detection of Diabetic Retinopathy Using Densenet-65 Based Faster-RCNN
1Department of Information Technology, College of Computer, Qassim University, Buraydah, Saudi Arabia
2Department of Computer Science, University of Engineering and Technology, Taxila, 47050, Pakistan
3Department of Software Engineering, University of Engineering and Technology, Taxila, 47050, Pakistan
*Corresponding Author: Tahira Nazir. Email: Tahira.nazir77@gmail.com
Received: 09 October 2020; Accepted: 22 November 2020
Abstract: Diabetes is a metabolic disorder that results in a retinal complication called diabetic retinopathy (DR) which is one of the four main reasons for sightlessness all over the globe. DR usually has no clear symptoms before the onset, thus making disease identification a challenging task. The healthcare industry may face unfavorable consequences if the gap in identifying DR is not filled with effective automation. Thus, our objective is to develop an automatic and cost-effective method for classifying DR samples. In this work, we present a custom Faster-RCNN technique for the recognition and classification of DR lesions from retinal images. After pre-processing, we generate the annotations of the dataset which is required for model training. Then, introduce DenseNet-65 at the feature extraction level of Faster-RCNN to compute the representative set of key points. Finally, the Faster-RCNN localizes and classifies the input sample into five classes. Rigorous experiments performed on a Kaggle dataset comprising of 88,704 images show that the introduced methodology outperforms with an accuracy of 97.2%. We have compared our technique with state-of-the-art approaches to show its robustness in term of DR localization and classification. Additionally, we performed cross-dataset validation on the Kaggle and APTOS datasets and achieved remarkable results on both training and testing phases.
Keywords: Deep learning; medical informatics; diabetic retinopathy; healthcare; computer vision
Diabetes, scientifically known as diabetes mellitus is an imbalance of metabolism that precedes to increase in the level of glucose in the bloodstream. According to an estimate provided in [1] about 415 million people are victimized by this sickness. Prolonged diabetes causes retinal complications which results in a medical condition called DR, which is one of the 4 main reasons for sightlessness all over the globe. More than 80% of people who are exposed to diabetes for a long time suffer from this medical condition [2]. The high level of glucose in circulating blood causes blood leaks and an increased supply of glucose to the retina. This often leads to abnormal lesions i.e., microaneurysms, hard exudates, cotton wool spots, and hemorrhages in the retina, thus causing vision impairment [3]. DR usually has no clear symptoms before the onset. The most common screening tool used for the detection of DR is retinal (fundus) photography.
For treatment purposes and avoiding vision impairment, the DR is classified in different levels concerning the severity of the disorder. According to the research of the early treatment of DR and international clinical DR, there are five levels of DR severity. In the zeroth level of DR severity, there is no abnormality. The first, second, third, and fourth levels are identified as the presence of mild- aneurysms, moderate non-proliferative Diabetic Retinopathy (NPDR), severe NPDR, and proliferative DR, respectively. Tab. 1 summarizes the five levels of DR severity with their respective fundoscopy observations.
Table 1: Severity levels of DR

For computerized identification of DR, initially, hand-coded key points were used to detect the lesions of DR [4–14]. However, these approaches exhibit low performance due to a huge change in color, size, intra-class variations, size, bright regions, and high variations among different classes. Moreover, the little signs other than microaneurysms, medical rule marks, and objects also contribute to the unpromising results of CAD solutions. Another reason for the degraded performance of automated DR, detection system is the involvement of non-affected regions with the affected area, which in turn gives a weak set of features. To achieve the promising performance of computer-based Diabetic retinal disease detection solutions, there must be an efficient set of key-points.
Object detection and classification in images using various machine learning techniques have been a focus of the research community [15,16]. Especially with the advent of CNN, various models have been proposed to accomplish the tasks of object detection and classification in the areas of computer vision (CV), speech recognition, natural language processing (NLP), robotics, and medicine [17–21]. Similarly, there are various examples of deep learning (DL) use in biomedical applications [22,23]. In this work, we have introduced the technique that covers the Data preparation, Recognition, and classification of DR from retinal images. In the first step, we have prepared our dataset with the help of ground truths. For detection and feature extraction, we have proposed a CNN algorithm named DenseNet-65 for images of size  pixels. We also present the performance comparison of our models in terms of accuracy with DenseNet-121, ResNet-50, and EfficientNet-B5. Moreover, we have compared our approach against the most recent techniques. Our analysis reveals that the introduced technique has the potential to correctly classify the images. The following are the main contributions of our work:
• The development of the annotations of the large dataset having images with a total of 88,704 images.
• We have introduced a customized Faster-RCNN with DenseNet-65 at the feature extraction level which can accurately increase the performance to locate the small objects while decreasing both training and testing time complexity. By removing the unnecessary layers, the Densenet-65 minimizes the loss of the bottom-level high-resolution key points and saves the data of small targeted regions, which are lost by repeated key points.
• To develop a technique for classifying DR images using DenseNet-65 architecture instead of hand-engineered features and reduce cost-effectiveness and the need for face-to-face consultations and diagnosis.
• Furthermore, we have compared the classification accuracy of the presented framework with other algorithms like AlexNet, VGG, GoogleNet, and ResNet-11. The results presented in this work show that DenseNet architecture performs well in comparison to the latest approaches.
The remaining manuscript is arranged as follows: In Section 2, we present the related work. This includes the work on the classification of DR images using handcrafted features and DL approaches. In Section 3, we present the proposed methodology of DR image classification using Custom Faster-RCNN. In Section 4, we present the results and evaluations of the introduced work. Finally, in Section 5 we conclude our work.
In history, several approaches have been introduced to correctly classify the images of normal retina and retina with DR. In [24], the authors propose a technique that uses mixture-models to dynamically threshold the images for differentiating exudates from the background. Afterward, edge detection is applied to classify cotton wool spots from the background texture. The proposed work presents a sensitivity of 100% and specificity of 90%. Authors in [25] present an algorithm that performs 2-step classification by combining four machine learning techniques, namely, k-nearest neighbors (KNN) [26] Gaussian mixture models (GMM) [27] support vector machines (SVM) [28], and the AdaBoost algorithm [29]. The authors report the sensitivity and specificity of 100% and 53.16%, respectively. Priya et al. [30] proposes a framework to categorize fundus samples into two classes: proliferative DR and non-proliferative DR. The proposed technique first extracts hand-engineered features of DR abnormalities, for instance, hemorrhages, hard exudates, and swollen blood vessels. These hand-engineered features are then used to train a hybrid model of probabilistic neural networks (PNN), SVM, and Bayesian classifiers. The accuracy of each model is computed separately, i.e., 89.6%, 94.4%, and 97.6% for PNN, SVM, and Bayesian classifiers, respectively. In [31], the authors propose a technique that is designed using the idea of a visual descriptor word bag. The proposed algorithm in the initial stage detects the points of interest based on hand-engineered features. Secondly, the feature vectors of these detected points are consumed to construct the dictionary. Finally, the algorithm classifies whether the input image of the human retina contains hard exudates using SVM.
With the introduction of DL, a focus is on introducing methods for classifying DR images through employing deep neural networks as a replacement for hand-coded key points. The related work of approaches to categorizing normal and DR retinas utilizing DL methodologies is discussed in Tab. 2.
Table 2: A comparison of the diabetic retinopathy severity levels

The presented work comprises of two main parts. The first is ‘dataset preparation’ and the second is Custom ‘Faster-RCNN builder’ for localization and classification.
The first module develops the annotations for DR lesions to locate the exact region of the lesion. While the second Component of the introduced framework builds a new type of Faster-RCNN. This module comprises two sub-modules in which the first one is a CNN framework and the other is the training component, which performs training of Faster-RCNN through employing the key points computed from the CNN model. Faster-RCNN accepts two types of input, image sample and location of the lesion in the input image. Fig. 1 shows the functionality of the presented technique. At first, an input sample along with the annotation’s bounding box (bbox) is passed to the nominated CNN model. The bbox recognizes the region of interest (ROI) in CNN key points. With these bboxes, reserved key points from training samples are nominated. Based on the computed features, the Faster-RCNN trains a classifier and generate a regressor estimator for given regions. The Classifier modules assign predicted class to object and the regressor component learns to determine the coordinates of potential bbox to locate the location of the lesion in each image. Finally, accurateness is estimated for each unit as per metrics employed in the CV field.
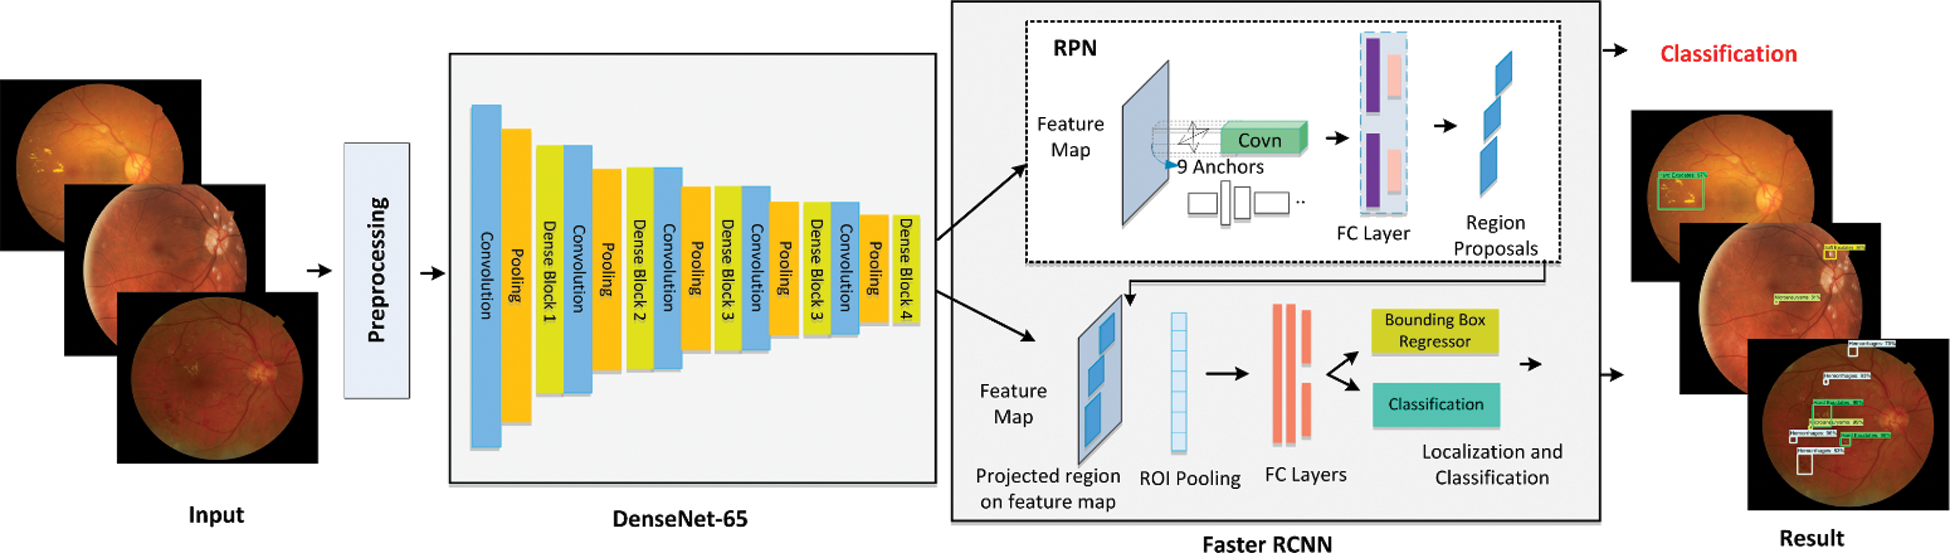
Figure 1: Architecture of custom faster-RCNN model
Like any other real-world dataset, our data contains various artifacts, such as noise, out of focus images, underexposed or overexposed images. This may lead to poor classification results. Therefore, we perform data pre-processing on the samples beforehand inputting them to CNNs.

where  represents the variance, x and y represent the distance from the origin in the horizontal and vertical axes. G(x, y) is the output of Gaussian filter. Afterward, we subtract the local average color from the blurred image using Eq. (2).

where,  , I(x, y), and
  represent the contrast corrected image, the original image and original image convolved with Gaussian filter, respectively.
Second, the removal of regions which have no information. In the original dataset, there are certain areas in the image that if removed do not affect the output. Therefore, we crop these regions from the input image. The process of cropping images not only enhances the performance of the classification but also assist in reducing the computations.
The location of DR lesions of every sample is necessary to detect the diseased area for the training procedure. In this work, we have used the LabelImg tool to generate the annotations of the retinal samples and have manually created a bbox of every sample. The dimensions of the bbox and associated class for each object are stored in XML files, i.e., xmin, ymin, xmax, ymax, width, and height. The XML files are utilized to generate the CSV file, train. record file is created from the CSV file which is later employed in the training procedure.
Faster-RCNN [19] algorithm is an extended form to already existing approaches, i.e., R-CNN [21] and Fast-RCNN [20] which employed Edge Boxes [41] technique to generate region proposals for possible object areas. However, the functionality of Faster-RCNN is changed from [21] as it utilizes Region Proposal Network (RPN) to create region proposals directly as part of the framework. It means that Faster-RCNN uses RPN as an alternative to the Edge Boxes algorithm. The computational complexity of Faster-RCNN for producing region proposals is considerably less than the edge box technique. Concisely, the ranking of anchor boxes is finalized by RPN which shows the most expected anchor boxes containing regions of interest (ROIs). So, in Faster-RCNN, region proposal generation is quick and is better attuned to input samples. Two types of outputs are generated by the Faster-RCNN: (i) Classification that shows the class associated with each object (ii) Coordinates of bbox.
3.4 Custom Feature Faster-RCNN Builder
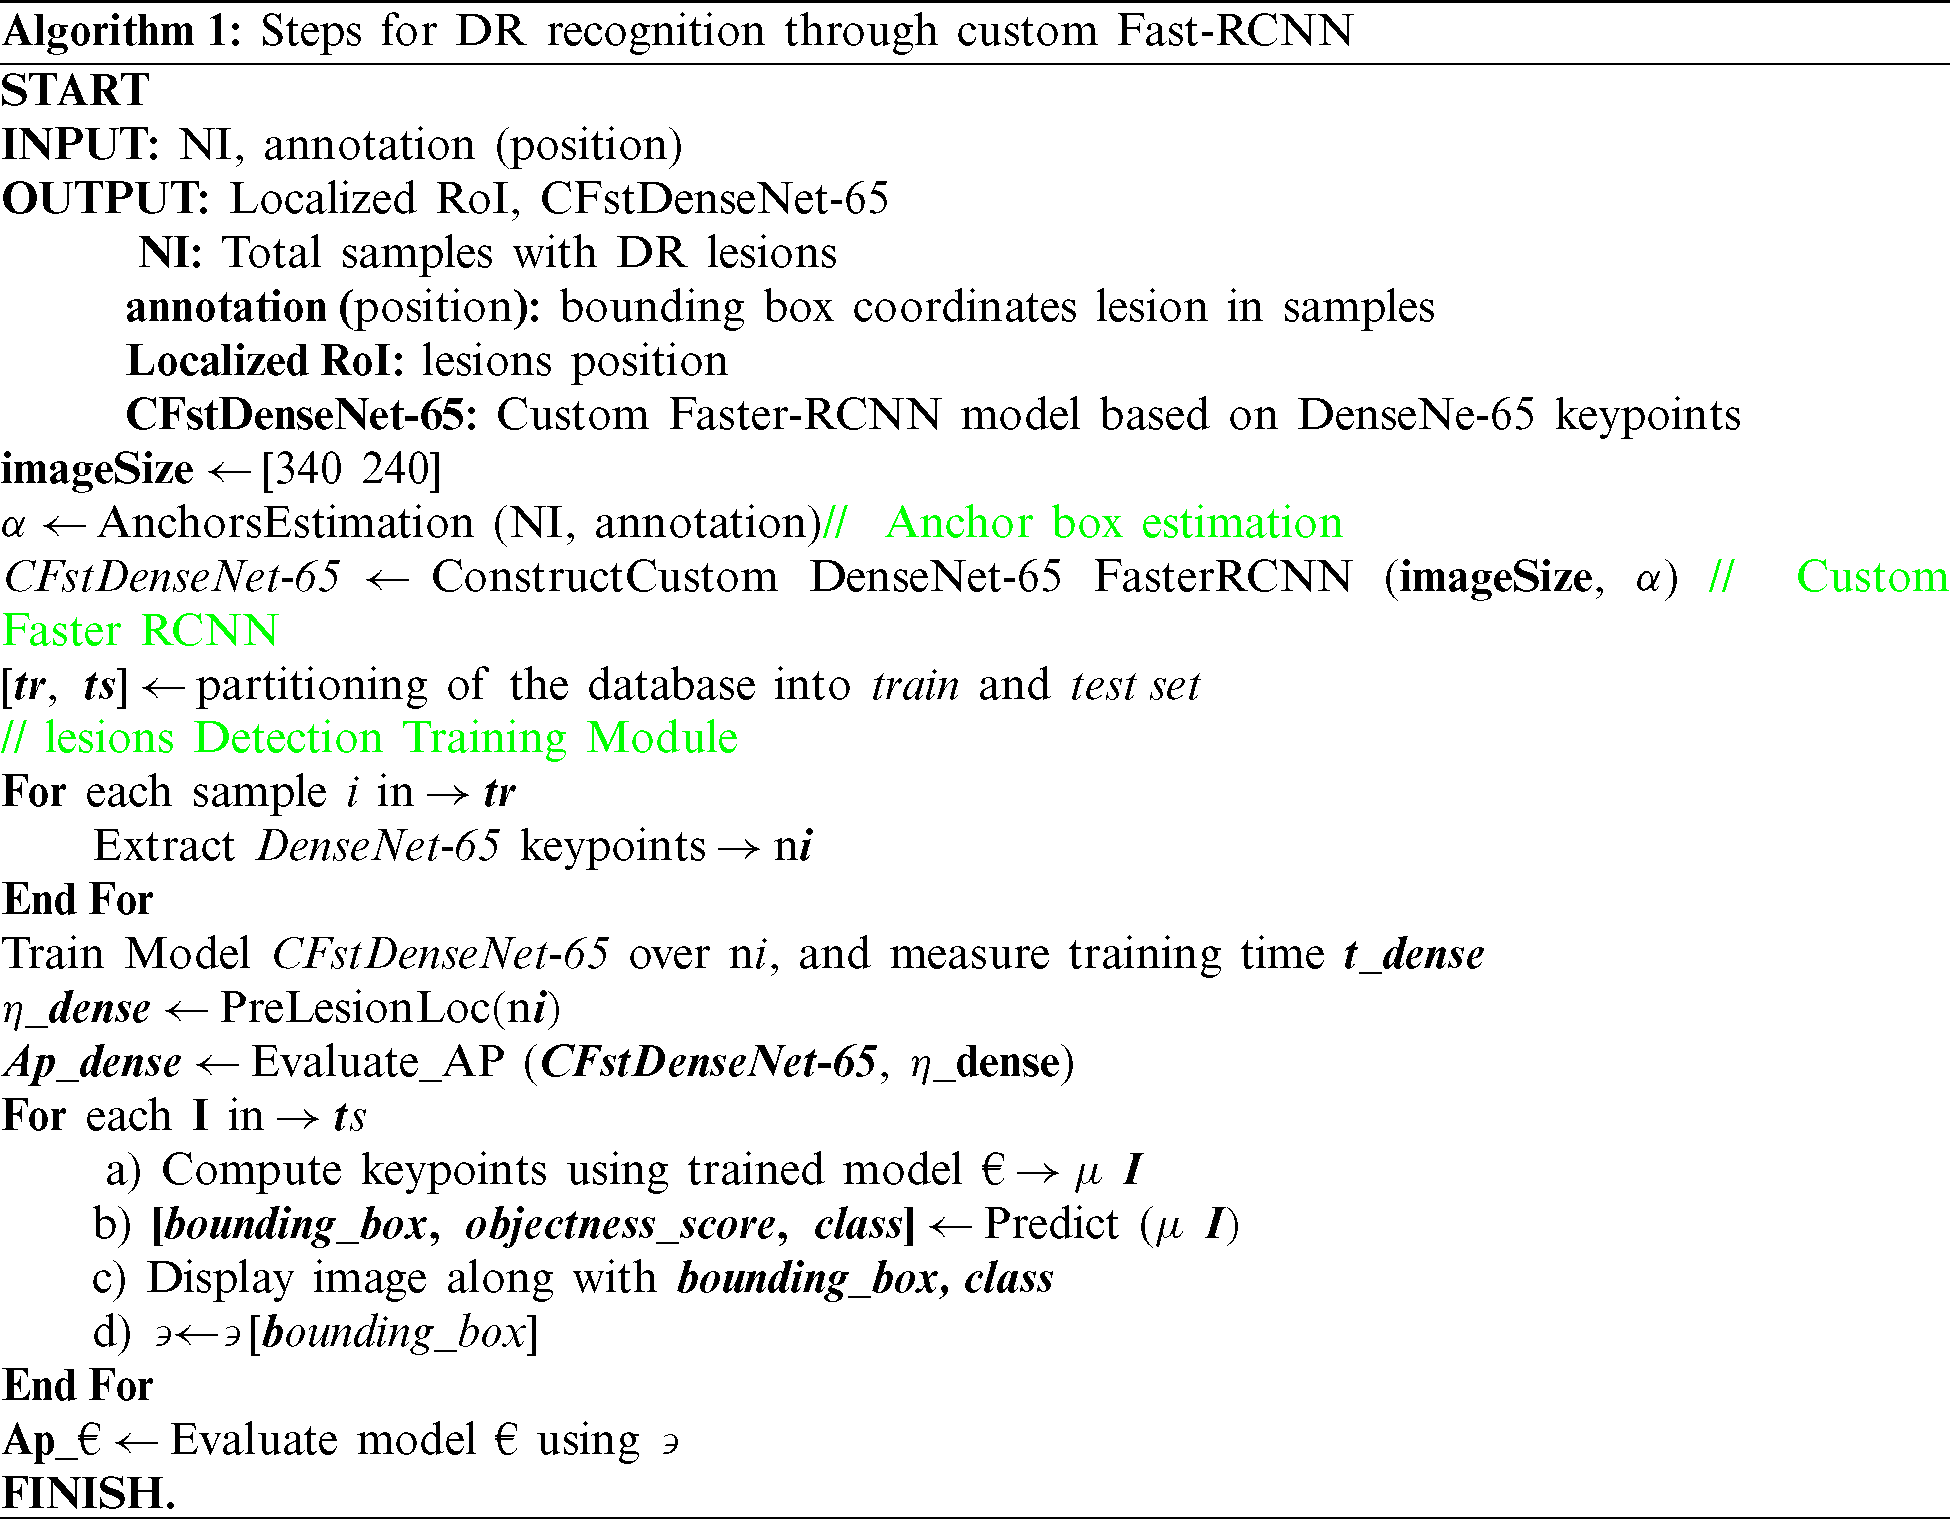
A CNN is a special type of NN that is essentially developed/evolved to perceive, recognize, and detect visual attributes from 1D, 2D, or ND matrices. In the presented work, image pixels are passed as input to the CNN framework. We have employed DenseNet-65 as a feature extractor in the Faster-RCNN approach. DenseNet [42] is the latest presented approach of CNN, in which the present layer relates to all preceding layers. DenseNet comprises a set of dense blocks which are sequentially interlinked with each other with extra convolutional and pooling layers among successive dense blocks. DenseNet can present the complex transformations which result in improving the issue of the absence of the target’s position information for the top-level key points to some degree. DenseNet minimizes the number of parameters which makes them cost-efficient. Moreover, DenseNet assists the key points propagation process and encourages their reuse which makes them more suitable for lesion/digit classification. So, in this paper, we have utilized the denseNet-65 as a feature extractor for Faster-RCNN. The architectural description of DenseNet is given in Tab. 4 that demonstrates the name of layers through which the key points are selected for advance processing by Faster-RCNN. It also represents the query sample size to be readjusted before computing key points from the allocated layer. The training parameters for customized Faster-RCNN are shown in Tab. 3. The detailed flow of our presented approach is shown in Algorithm 1.
Table 3: Training parameters of the proposed method
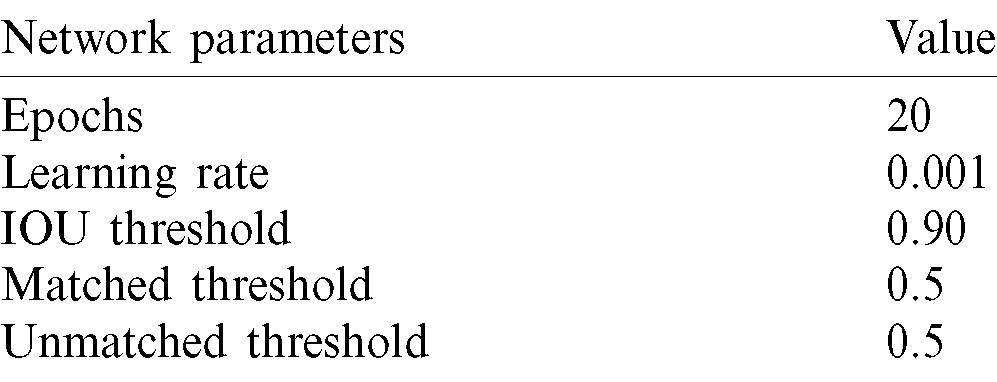
Table 4: Structure of DenseNet-65

The main process of lesion classification through Faster-RCNN can be divided into four steps. Firstly, the input sample along with annotation is given to the denseNet-65 to compute the feature map, then, the calculated key points are used as input to the RPN component to obtain the features information of the region proposals. In the third step, the ROI pooling layer produces the proposal feature maps by using the calculated feature map and proposals from convolutional layers and the RPN unit, respectively. In the last step, the classifier unit shows the class associated with each lesion while the bbox generated by the bbox regression is used to show the final location of the identified lesion.
The proposed method is assessed employing the Intersection over Union (IOU) as described in Fig. 2a. X shows the ground truth rectangle and Y denotes the estimated rectangle with Dr lesions.
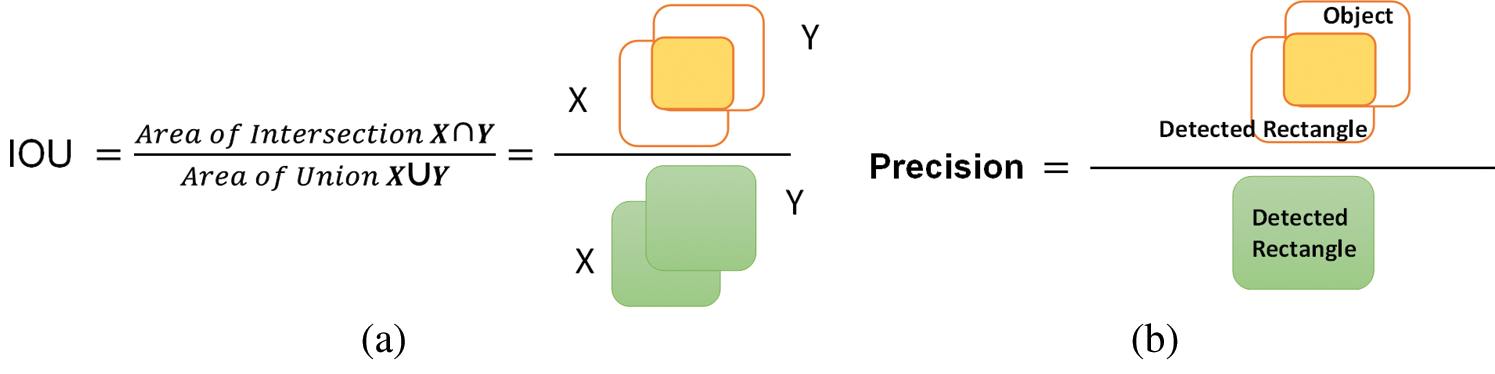
Figure 2: (a) IOU venn diagram, (b) geometrical representation of precision
The first decision for lesions being identified when the value of IOU is greater than 0.5, or not is determined when the value is less than 0.5. The Average Precision (AP) is mostly employed in evaluating the precision of object detectors i.e., R-CNN, SSD, and YOLO, etc. The geometrical explanation of precision is shown in Fig. 2b. In our framework of the detection of DR lesions, AP depends upon the idea of IOU.
The Densenet-65 has two potential difference from traditional DenseNet: (i) Densenet-65 has less number of parameters from the actual model as instead of 64, it has 32 channels on the first convolution layer, and the size of the kernel is  instead of
  (ii) the number of layers within each dense block is attuned to deal with the computational complexity. Tab. 4 describes the structure of the proposed DenseNet-65 model.
The Dense block is the important component of DenseNet-65 as shown in Fig. 3, in which  represents the features maps (FPs) of the L −1 layer. The size of the FPs is s and the number of channels is denoted by k0. A non-linear transformation H(.), that contains the different operations, i.e., Batch Normalization Layer (BN), Rectified linear unit (Relu) activation function, a
  convolution layer (ConvL) used for the reduction of several channels, and
  ConvL used for feature restructuring. The dense connection is represented by a long-dashed arrow that joins the L −1 layer to the L layer and creates concatenation with the results of H(.). Finally,
 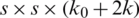 is the output of the L + 1 layer.
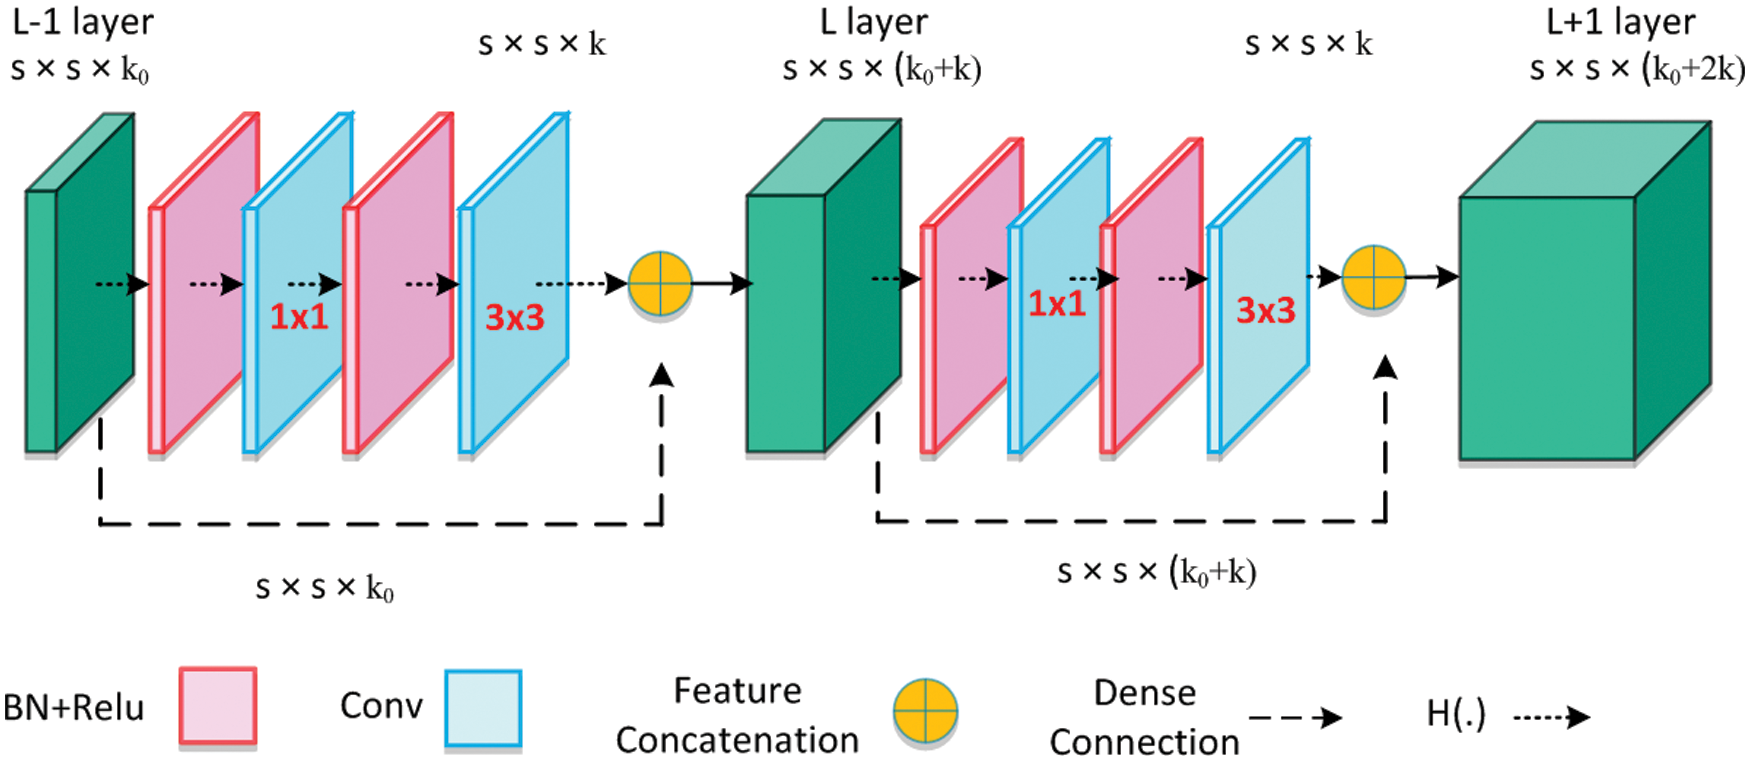
Figure 3: Architecture of dense block
After multiple dense connections, the number of FPs will rise significantly, the transition layer (TL) is added to decrease the feature dimension from the preceding dense block. The structure of TL is shown in Fig. 4, which comprises of BN and a  ConvL (decreases the number of channels to half) followed by a
  average pooling layer that decreases the size of FPs. Where t shows the total channels and average pooling is denoted by the pool.
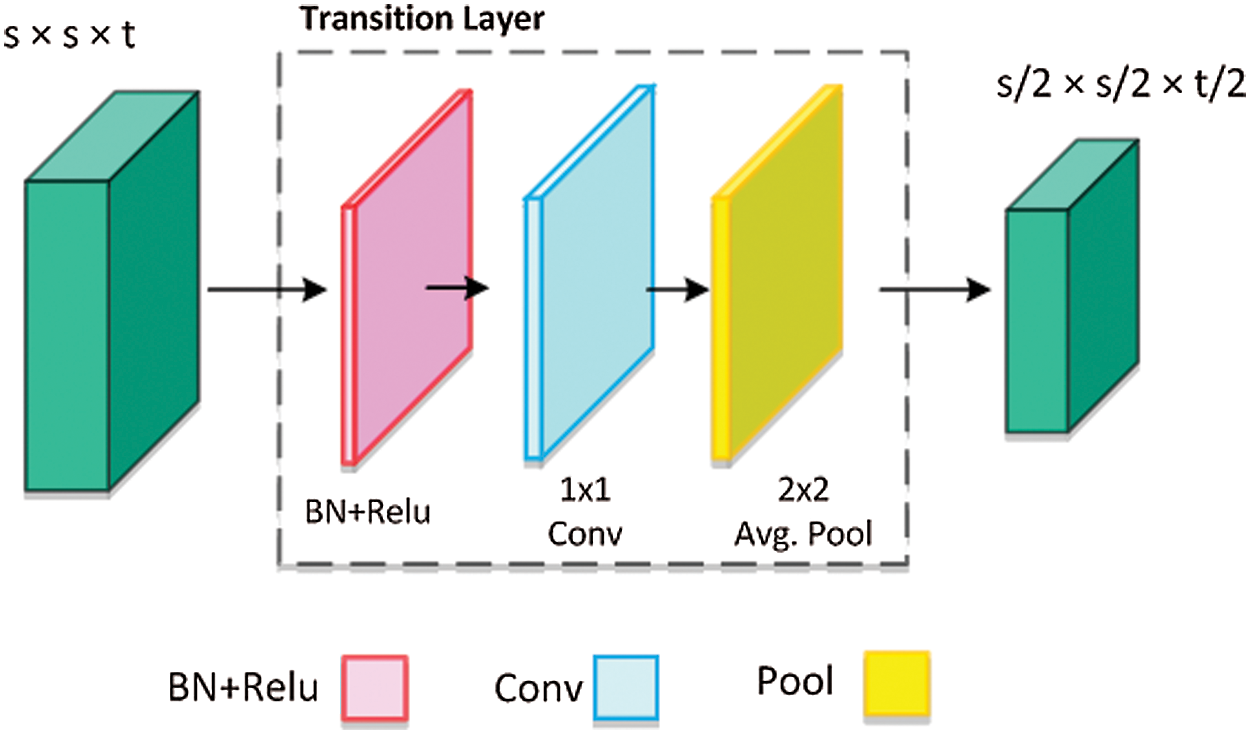
Figure 4: Architecture of transition layer
Faster-RCNN is a deep-learning-based technique which is not dependent on methods like the selective search for its proposal generation. Therefore, the input sample with annotation is given as input to the network, on which it directly computes the bbox to show the digit location and associated class.
In this method, we employ the DR images database provided by Kaggle. There are two sets of training images with a total of 88704 images. A label.csv file is provided that contains the information regarding the severity level of DR. The samples in the database are collected using various cameras in multiple clinics, over time. The sample images of five classes from the Kaggle database are shown in Fig. 5.
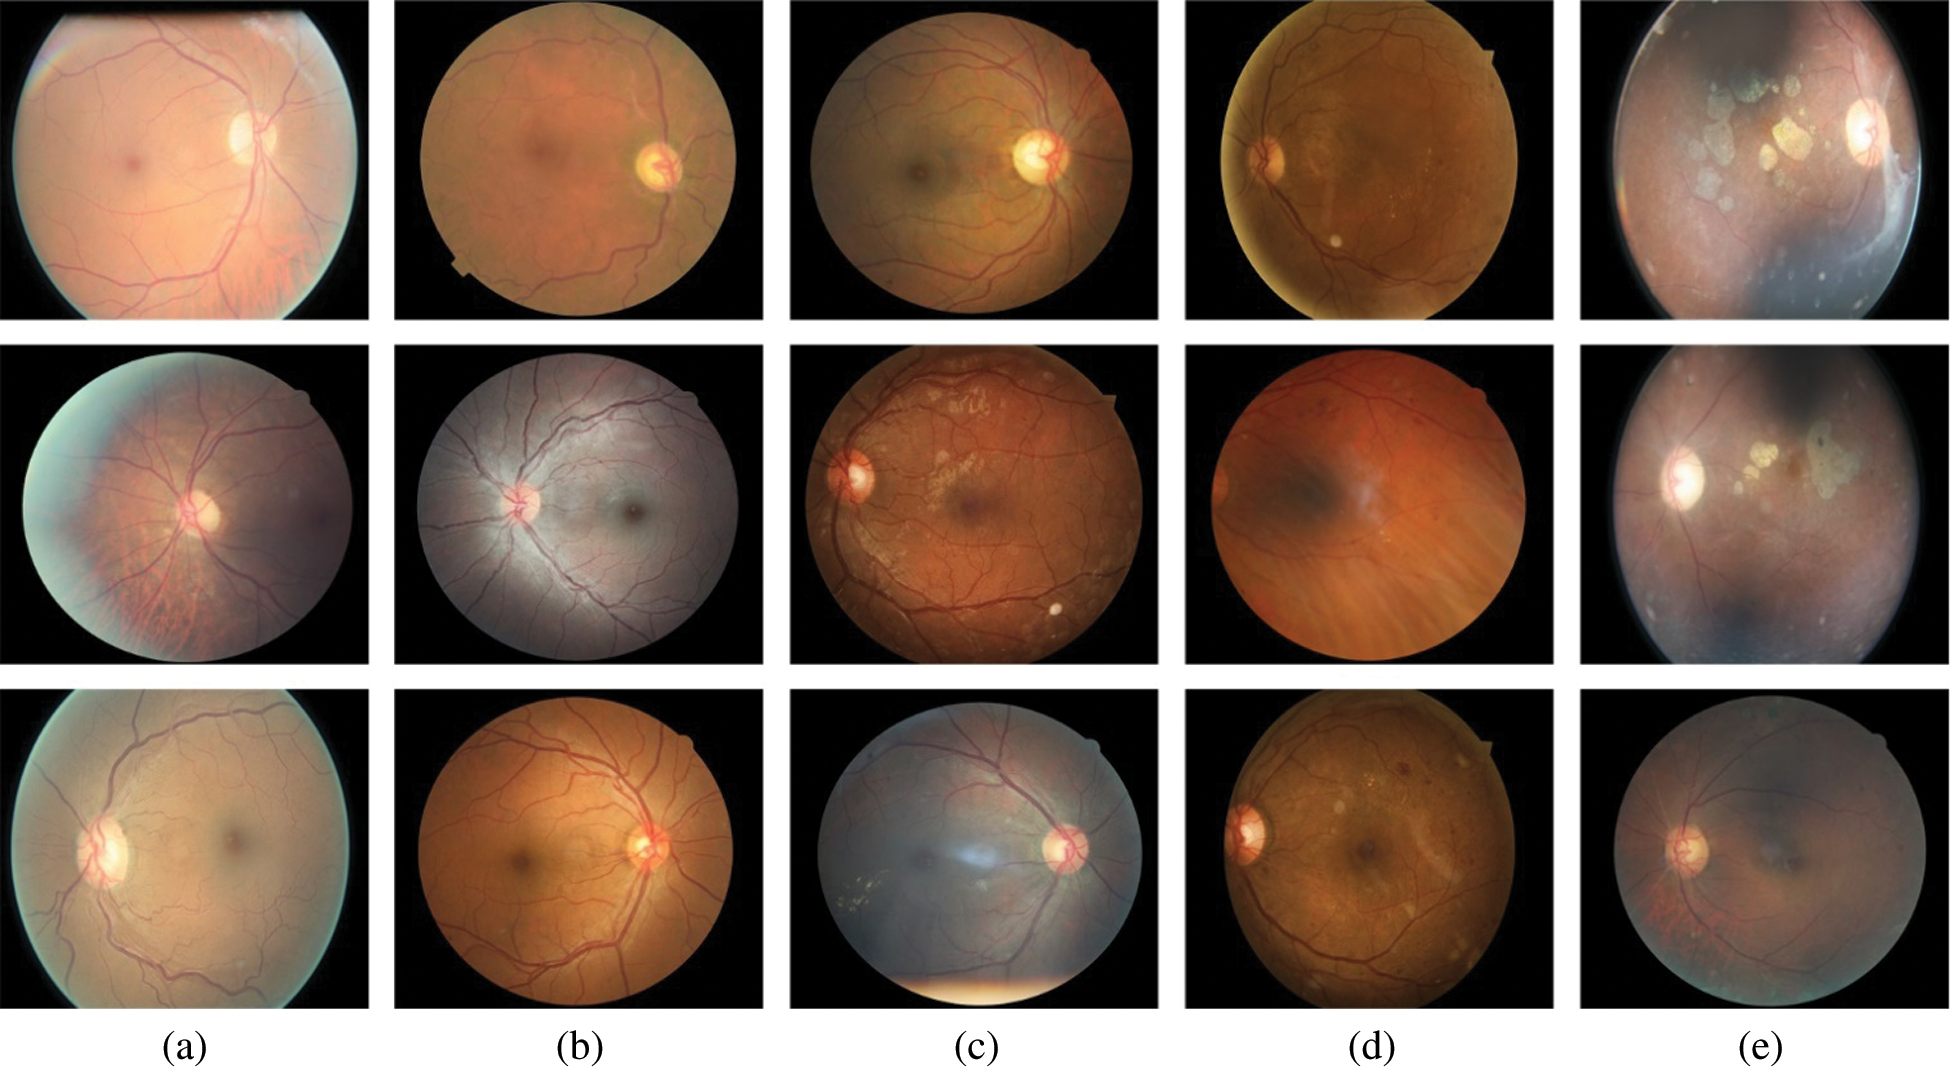
Figure 5: Sample images from Kaggle dataset; (a) no DR, (b) mild, (c) moderate, (d) severe, and (e) proliferative
4.2 Evaluation of DenseNet-65 Model
The detection accuracy of proposed DenseNet-65 method is compared with base models, i.e., DenseNet-65, ResNet, EfficientNet-B5, AlexNet, VGG, and GoogleNet.
In this part, we show the simulation results of the ResNet, DenseNet-65, and EfficientNet-B5. The results are presented in terms of accuracy for DR image classification. Tab. 5 presents the comparison of the 3 models used in this work for the classification of DR images in terms of trainable parameters, total parameters, loss, and model accuracy. As presented in Tab. 5, DenseNet-65 has a significantly small number of total parameters, whereas the EfficientNet-B5 has the highest number of model parameters. This is because the architecture of DenseNet does not solely rely on the power of very deep and wide networks, rather, they make efficient reuse of model parameters, i.e., no need to compute redundant feature maps. Therefore, resulting in a significantly small number of total model parameters. For instance, the architecture of DenseNet under consideration in this work is DenseNet-65, i.e., 65 layers deep. Similarly, the ResNet used in this work has 50 layers, however, the number of parameters is still significantly higher than that of DenseNet-65.
Table 5: Comparison table of various characteristics of the 3 methods used in our work for the classification of DR images. Please note that Densenet-65 is the best choice in terms of trainable parameters and classification accuracy
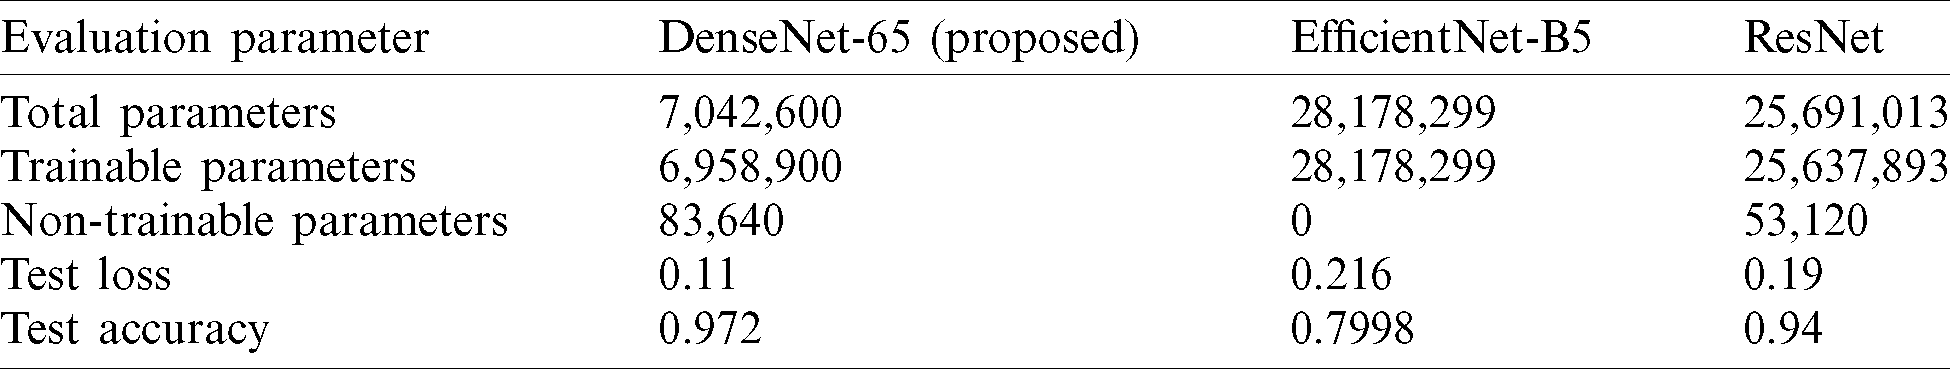
The number of trainable parameters of DenseNet-65 is small, i.e., 6, 958, 900, as compared to the trainable parameters of ResNet and EficientNet-B5. Consequently, the training time for the former deep network, i.e., DenseNet-65, is short as compared to the later methods, i.e., ResNet and EfficientNet-B5.
Our analysis reveals that the classification performance of the DenseNet-65 is higher than the other methods as shown in Tab. 6. DenseNet-65 correctly classifies 95.6% of the images that represent the human retinas suffering from DR. Contrary, the classification accuracy of the ResNet and EfficientNet-B5 is 90.4% and 94.5%, respectively. Moreover, the techniques in [36] and [43] are economically complex and may not perform well under the presence of bright regions, noise, or light variations in retinal images. Our method has overcome the existing problems by employing an efficient network for feature computation and can show complex transformations that make it robust to post-processing attacks.
Table 6: Comparison table of our work with several approaches using different architectures presented in the history for the classification of DR images

4.3 Localization of DR Lesions Using Custom Faster-RCNN
For localization of the DR signs, the diseased areas are declared a positive example while the remaining healthy parts are known as a negative example. The correlated area is categorized by a threshold score IOU, which was set to 0.5, less than this score, considering the area as background or negative. Likewise, the value of IOU more than 0.5 the areas are classified as lesions. The localization outcome of Custom Faster-RCNN as shown in Fig. 6 having to evaluate retinal samples over a confidence value. The evaluation results exhibit a greater value which is higher than 0.89 and up to 0.99.
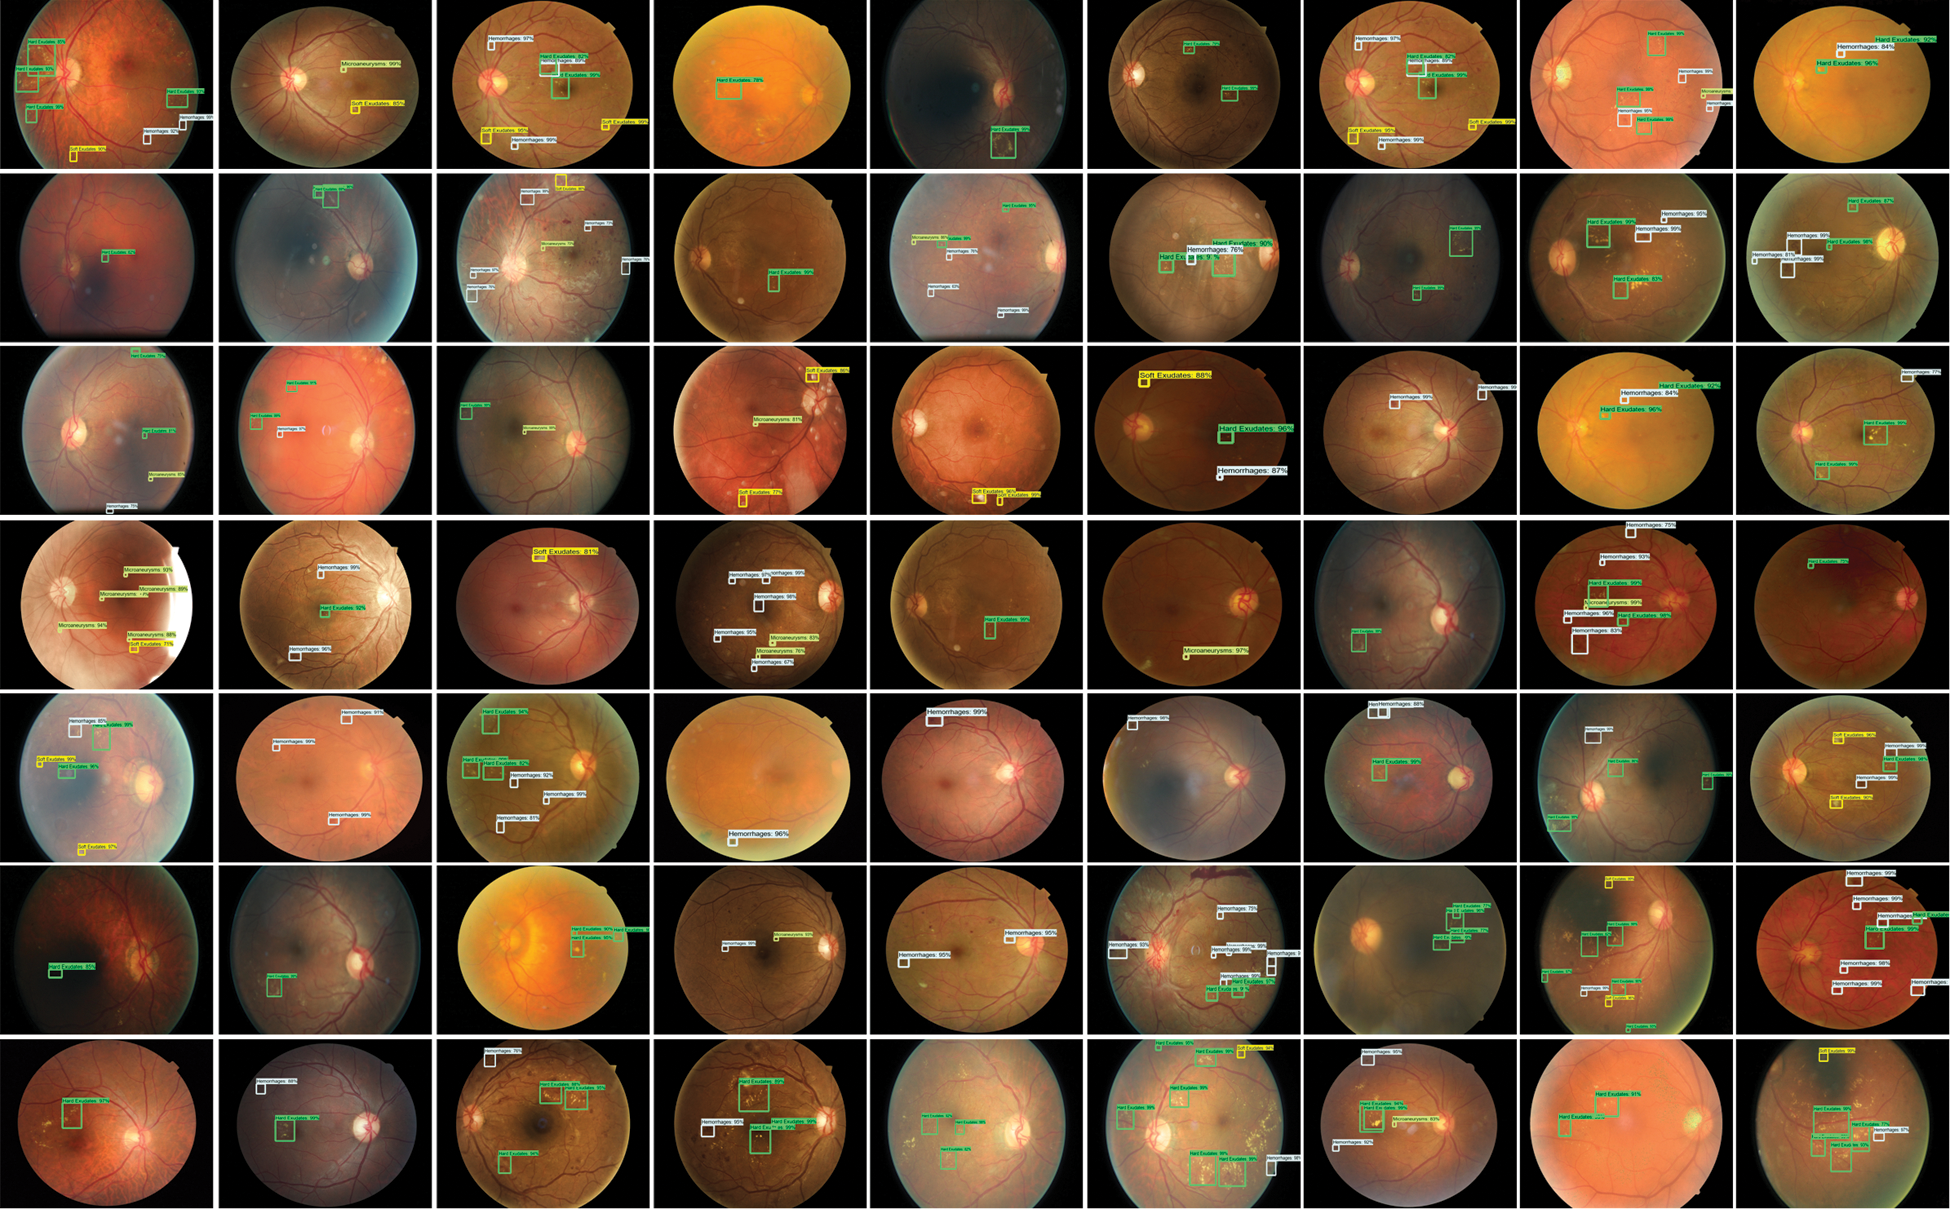
Figure 6: Test results of custom Faster-RCNN for detection of DR lesions
The presented methodology results are analyzed by employing the mean IOU and precision over all samples of the test database. Tab. 7 demonstrates that the introduced framework achieved average values of mean IOU as 0.969 and a precision of 0.974. Our presented method exhibits better results because of the precise localization of lesions by utilizing Custom Faster RCNN based on DenseNet-65.
Table 7: Performance of proposed method over Kaggle database

The stage-wise results of the introduced framework are analyzed through the experiments. Faster-RCNN precisely localized and classify the lesions of the DR. The classification results of DR in terms of accuracy, precision, recall, F1-score, and error-rate are presented in Tab. 8. According to the results, it can be determined that the introduced methodology attained remarkable results in terms of accuracy, precision, recall, and F1-score and shown a lower error rate. The presented technique attained an average value of accuracy, precision, recall, F1-score, and the error rate is 0.972, 0.974, 0.96, 0.966, and 0.034 respectively. The correctness of DenseNet-65 keypoints computation that shows each class in a viable manner is the reason for good classification. Moreover, a little association among the No and Mild DR classes is found, however, still, both are recognizable. So, because of efficient keypoints computation, our method shows the latest DR classification performance that exhibits the robustness of the presented network. The confusion metrix is shown in Fig. 7.
Table 8: Stage-wise performance of the presented methodology

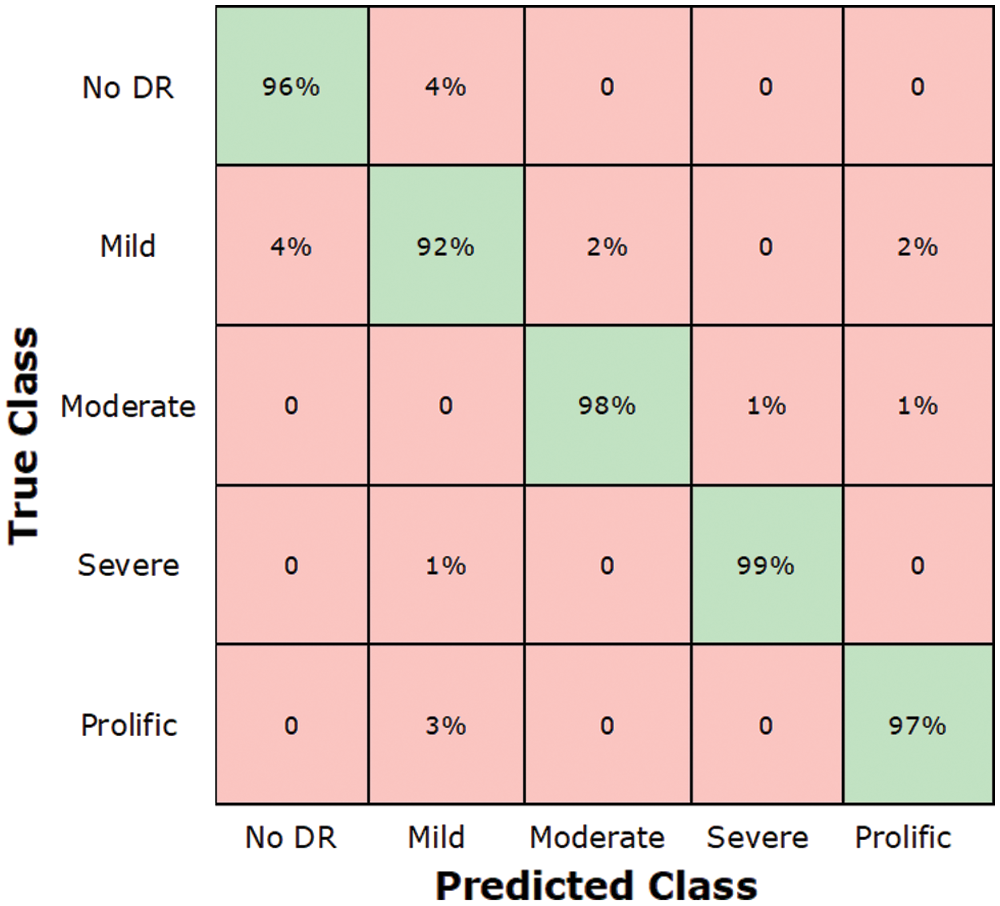
Figure 7: Test results of custom faster
In the present work, we reported results by running a computer simulation 10 times. In each run, we randomly selected data with a ratio of 70% to 30% for training and testing, respectively. The average results in form of performance evaluation metrics were then considered.
In Tab. 9, we present an evaluation of the proposed approaches for DR classification with the methods presented in Xu et al. [32], Li et al. [33], Zhang et al. [36], Li et al. [40] and Wu et al. [44] and Pratt et al. [45], and these techniques are capable to classify DR from retinal images. However, requires intense training and exhibits lower accuracy for training samples with the class imbalance problem. Our method has acquired the highest average accuracy of 97.2% that signifies the reliability of the introduced solution against other approaches.
Table 9: Comparison of the introduced framework with the latest approaches

The proposed method achieved the average accuracy of 97.2%, while the comparative approaches attained the average accuracy of 84.735%, we can say that our technique gave a 12.46% performance gain. Furthermore, the presented approach can simply be adopted or run-on CPU or GPU based systems and every sample test time is 0.9 s which is faster than the other method’s time. Our analysis shows that the proposed technique can correctly classify the images.
To more assess the presented approach, we present the validation of the cross dataset, which means we trained our method on the Kaggle database, and testing is performed on the APTOS-2019 dataset [46] by “Asia Pacific Tele-Ophthalmology Society.” The dataset contains 3662 retinal samples combined from several clinics under diverse image capturing environments utilizing fundus photography from Aravind Eye Hospital in India. This dataset consists of five classes same as in the Kaggle dataset.
We have plotted the box plot for evaluation of cross dataset in Fig. 8, the accuracy of test and train is spreading across the number line into quartiles, median, whisker, and outliers. According to the figure, we attained an average accuracy of 0.981% for training and 0.975% for testing which exhibits that our proposed work outperforms the unknown samples as well. Therefore, it can be concluded that the introduced framework is robust to DR localization and classification.

Figure 8: Cross dataset validation results: Train over Kaggle dataset and test over APTOS-2019
In this work, we introduced a novel approach to accurately identify the different levels of the DR by using a custom Faster-RCNN framework and have presented an application for lesion classification as well. More precisely, we utilized DenseNet-65 for computing the deep features from the given sample on which Faster-RCNN is trained for DR recognition. The proposed approach can efficiently localize retinal images into five classes. Moreover, our method is robust to various artifacts, i.e., blurring, scale and rotational variations, intensity changes, and contrast variations. Reported results have confirmed that our technique outperforms the latest approaches. In the future, we plan to enhance our technique to other eye-related diseases.
Acknowledgement: We would like to thank the Deanship of Scientific Research, Qassim University for funding the publication of this project.
Funding Statement: The authors received no specific funding for this study.
Conflicts of Interest: The authors declare that they have no conflicts of interest to report regarding the present study.
1. N. H. Cho, J. E. Shaw, S. Karuranga, Y. Huang, J. D. Da Rocha Fernandes et al. (2018). , “IDF diabetes atlas: Global estimates of diabetes prevalence for 2017 and projections for 2045,” Diabetes Research and Clinical Practice, vol. 138, pp. 271–281. [Google Scholar]
2. O. Faust, R. Acharya, E. Y. K. Ng, K. H. Ng and J. S. Suri. (2012). “Algorithms for the automated detection of diabetic retinopathy using digital fundus images: A review,” Journal of Medical Systems, vol. 36, no. 1, pp. 145–157. [Google Scholar]
3. X. Wang, Y. Lu, Y. Wang and W. B. Chen. (2018). “Diabetic retinopathy stage classification using convolutional neural networks,” in 2018 IEEE Int. Conf. on Information Reuse and Integration, Salt Lake City, UT, USA, pp. 465–471. [Google Scholar]
4. L. Jiao, F. Zhang, F. Liu, S. Yang, L. Li et al. (2019). , “A survey of deep learning-based object detection,” IEEE Access, vol. 7, pp. 128837–128868. [Google Scholar]
5. B. V. Krishna and T. Gnanasekaran. (2019). “Unsupervised automated retinal vessel extraction framework using enhanced filtering and hessian based method with hysteresis thresholding,” Journal of Medical Imaging and Health Informatics, vol. 9, no. 5, pp. 1000–1010. [Google Scholar]
6. G. T. Zago, R. V. Andreão, B. Dorizzi and E. O. T. Salles. (2020). “Diabetic retinopathy detection using red lesion localization and convolutional neural networks,” Computers in Biology and Medicine, vol. 116, no. 103537, pp. 1–12. [Google Scholar]
7. M. M. Khansari, W. D. O’Neill, R. D. Penn, N. P. Blair and M. Shahidi. (2019). “Detection of subclinical diabetic retinopathy by fine structure analysis of retinal images,” Journal of ophthalmology, vol. 2019, no. 3, pp. 1–6. [Google Scholar]
8. M. Leeza and H. Farooq. (2019). “Detection of severity level of diabetic retinopathy using bag of features model,” IET Computor Vision, vol. 13, no. 5, pp. 523–530. [Google Scholar]
9. S. Qummar, F. G. Khan, S. Shah, A. Khan, S. Shamshirband et al. (2019). , “A deep learning ensemble approach for diabetic retinopathy detection,” IEEE Access, vol. 7, pp. 150530–150539. [Google Scholar]
10. X. Zeng, H. Chen, Y. Luo and W. Ye. (2019). “Automated diabetic retinopathy detection based on binocular siamese-like convolutional neural network,” IEEE Access, vol. 7, pp. 30744–30753. [Google Scholar]
11. S. Bourouis, A. Zaguia and N. Bouguila. (2018). “Hybrid statistical framework for diabetic retinopathy detection,” in Int. Conf. Image Analysis and Recognition, Povoa de Varzim, Portugal, pp. 687–694. [Google Scholar]
12. H. S. Sandhu, N. Eladawi, M. Elmogy, R. Keynton, O. Helmy et al. (2019). , “Automated diabetic retinopathy detection using optical coherence tomography angiography: A pilot study,” British Journal of Ophthalmology, vol. 102, no. 11, pp. 1564–1569. [Google Scholar]
13. P. Costa, T. Araújo, G. Aresta, A. Galdran, A. M. Mendonça et al. (2019). , “EyeWes: Weakly supervised pre-trained convolutional neural networks for diabetic retinopathy detection,” in 2019 16th Int. Conf. on Machine Vision Applications, Tokyo, Japan, pp. 1–6. [Google Scholar]
14. M. D. Abràmoff, Y. Lou, A. Erginay, W. Clarida, R. Amelon et al. (2016). , “Improved automated detection of diabetic retinopathy on a publicly available dataset through integration of deep learning,” Investigative Ophthalmology & Visual Science, vol. 57, no. 13, pp. 5200–5206. [Google Scholar]
15. M. Jones and P. Viola. (2003). “Fast multi-view face detection,” Mitsubishi Electric Research Laboratories, vol. 3, no. 14, pp. 2. [Google Scholar]
16. W. Cheung and G. Hamarneh. (2009). “n-SIFT: n-dimensional scale invariant feature transform,” IEEE Transactions on Image Processing, vol. 18, no. 9, pp. 2012–2021. [Google Scholar]
17. A. Krizhevsky, I. Sutskever and G. E. Hinton. (2012). “ImageNet classification with deep convolutional neural networks,” in Advances in Neural Information Processing Systems. Lake Tahoe, NV, pp. 1097–1105. [Google Scholar]
18. H. Jiang and E. Learned-Miller. (2017). “Face detection with the faster R-CNN,” in 2017 12th IEEE Int. Conf. on Automatic Face & Gesture Recognition, Washington, DC, USA, pp. 650–657. [Google Scholar]
19. S. Ren, K. He, R. Girshick and J. Sun. (2015). “Faster R-CNN: Towards real-time object detection with region proposal networks,” in Advances in Neural Information Processing Systems, Montreal, Quebec, Canada, pp. 91–99. [Google Scholar]
20. R. Girshick. (2015). “Fast R-CNN,” in Proc. of the IEEE Int. Conf. on Computer Vision, pp. 1440–1448. [Google Scholar]
21. R. Girshick, J. Donahue, T. Darrell and J. Malik. (2014). “Rich feature hierarchies for accurate object detection and semantic segmentation,” in Proc. of the IEEE Conf. on Computer Vision and Pattern Recognition, pp. 580–587. [Google Scholar]
22. L. Yang, Y. Zhang, J. Chen, S. Zhang and D. Z. Chen. (2017). “Suggestive annotation: A deep active learning framework for biomedical image segmentation in,” in Int. Conf. on Medical Image Computing and Computer-Assisted Intervention, Quebec City, Canada, pp. 399–407. [Google Scholar]
23. R. Zemouri, N. Zerhouni and D. Racoceanu. (2019). “Deep learning in the biomedical applications: Recent and future status,” Applied Sciences, vol. 9, no. 8, pp. 1526–1565. [Google Scholar]
24. C. I. Sánchez, N. García, A. Mayo, M. I. López and R. Hornero. (2019). “Retinal image analysis based on mixture models to detect hard exudates,” Medical Image Analysis, vol. 13, no. 4, pp. 650–658. [Google Scholar]
25. S. Roychowdhury, D. D. Koozekanani and K. K. Parhi. (2013). “DREAM: Diabetic retinopathy analysis using machine learning,” IEEE Journal of Biomedical and Health Informatics, vol. 18, no. 5, pp. 1717– 1728. [Google Scholar]
26. W. J. Hwang and K. W. Wen. (1998). “Fast KNN classification algorithm based on partial distance search,” Electronics Letters, vol. 34, no. 21, pp. 2062–2063. [Google Scholar]
27. C. E. Rasmussen. (2000). “The infinite gaussian mixture model,” in Advances in Neural Information Processing Systems, Cambridge, MA: MIT Press, pp. 554–560. [Google Scholar]
28. M. A. Hearst, S. T. Dumais, E. Osuna, J. Platt and B. Scholkopf. (1998). “Support vector machines,” IEEE Intelligent Systems and their Applications, vol. 13, no. 4, pp. 18–28. [Google Scholar]
29. T. Hastie, S. Rosset, J. Zhu and H. Zou. (2009). “Multi-class adaboost,” Statistics and its Interface, vol. 2, no. 3, pp. 349–360. [Google Scholar]
30. R. Priya and P. Aruna. (2013). “Diagnosis of diabetic retinopathy using machine learning techniques,” ICTACT Journal on Soft Computing, vol. 3, no. 4, pp. 563–575. [Google Scholar]
31. A. Rocha, T. Carvalho, H. F. Jelinek, S. Goldenstein and J. Wainer. (2012). “Points of interest and visual dictionaries for automatic retinal lesion detection,” IEEE Transactions on Biomedical Engineering, vol. 59, no. 8, pp. 2244–2253. [Google Scholar]
32. K. Xu, D. Feng and H. Mi. (2017). “Deep convolutional neural network-based early automated detection of diabetic retinopathy using fundus image,” Molecules, vol. 22, no. 12, pp. 2054. [Google Scholar]
33. X. Li, T. Pang, B. Xiong, W. Liu, P. Liang et al. (2017). , “Convolutional neural networks-based transfer learning for diabetic retinopathy fundus image classification,” in 2017 10th Int. Congress on Image and Signal Processing, BioMedical Engineering and Informatics, Shanghai, China, pp. 1–11. [Google Scholar]
34. D. Zhang, W. Bu and X. Wu. (2017). “Diabetic retinopathy classification using deeply supervised resnet,” in 2017 IEEE SmartWorld, Ubiquitous Intelligence & Computing, Advanced & Trusted Computed, Scalable Computing & Communications, Cloud & Big Data Computing, Internet of People and Smart City Innovation (SmartWorld/SCALCOM/UIC/ATC/CBDCom/IOP/SCI), San, Francisco, CA, USA, pp. 1–6. [Google Scholar]
35. S. Wan, Y. Liang and Y. Zhang. (2018). “Deep convolutional neural networks for diabetic retinopathy detection by image classification,” Computers & Electrical Engineering, vol. 72, pp. 274–282. [Google Scholar]
36. W. Zhang, J. Zhong, S. Yang, Z. Gao, J. Hu et al. (2019). , “Automated identification and grading system of diabetic retinopathy using deep neural networks,” Knowledge-Based Systems, vol. 175, pp. 12–25. [Google Scholar]
37. J. D. Bodapati, N. Veeranjaneyulu, S. N. Shareef, S. Hakak, M. Bilal et al. (2020). , “Blended multi-modal deep convnet features for diabetic retinopathy severity prediction,” Electronics, vol. 9, no. 6, pp. 914. [Google Scholar]
38. S. Kathiresan, A. R. W. Sait, D. Gupta, S. K. Lakshmanaprabu, A. Khanna et al. (2020). , “Automated detection and classification of fundus diabetic retinopathy images using synergic deep learning model,” Pattern Recognition Letters, vol. 133, pp. 210–216. [Google Scholar]
39. J. De La Torre, A. Valls and D. Puig. (2020). “A deep learning interpretable classifier for diabetic retinopathy disease grading,” Neurocomputing, vol. 396, pp. 465–476. [Google Scholar]
40. T. Li, Y. Gao, K. Wang, S. Guo, H. Liu et al. (2019). , “Diagnostic assessment of deep learning algorithms for diabetic retinopathy screening,” Information Sciences, vol. 501, pp. 511–522. [Google Scholar]
41. C. L. Zitnick and P. Dollár. (2014). “Edge boxes: Locating object proposals from edges,” in European Conf. on Computer Vision, Zurish, Switzerland, pp. 391–405. [Google Scholar]
42. Y. Wang, H. Li, P. Jia, G. Zhang, T. Wang et al. (2019). , “Multi-scale densenets-based aircraft detection from remote sensing images,” Sensors, vol. 19, no. 23, pp. 5270. [Google Scholar]
43. A. M. Pour, H. Seyedarabi, S. H. A. Jahromi and A. Javadzadeh. (2020). “Automatic detection and monitoring of diabetic retinopathy using efficient convolutional neural networks and contrast limited adaptive histogram equalization,” IEEE Access, vol. 8, pp. 136668–136673. [Google Scholar]
44. Z. Wu, G. Shi, Y. Chen, F. Shi, X. Chen et al. (2020). , “Coarse-to-fine classification for diabetic retinopathy grading using convolutional neural network,” Artificial Intelligence in Medicine, vol. 108, pp. 101936. [Google Scholar]
45. H. Pratt, F. Coenen, D. M. Broadbent, S. P. Harding and Y. Zheng. (2016). “Convolutional neural networks for diabetic retinopathy,” Procedia Computer Science, vol. 90, pp. 200–205. [Google Scholar]
46. Kaggle. (2019). “APTOS 2019 blindness detection,” . [Online]. Available: https://www.kaggle.com/c/apt-os2019-blindness-detection. [Google Scholar]
 | This work is licensed under a Creative Commons Attribution 4.0 International License, which permits unrestricted use, distribution, and reproduction in any medium, provided the original work is properly cited. |