DOI:10.32604/cmc.2021.014642
| Computers, Materials & Continua DOI:10.32604/cmc.2021.014642 | |
| Article |
Real-Time Anomaly Detection in Packaged Food X-Ray Images Using Supervised Learning
1Department of Computer Science, Kyonggi University, Suwon-si, 16227, Korea
2Department of IT Contents, Hanshin University, Osan-si, 18101, Korea
3Department of Computer Software Engineering, Soonchunhyang University, Asan-si, 31538, Korea
4R&D Center, XAVIS Co. Ltd, Seongnam-si, 13202, Korea
*Corresponding Author: Min Hong. Email: mhong@sch.ac.kr
Received: 05 October 2020; Accepted: 22 December 2020
Abstract: Physical contamination of food occurs when it comes into contact with foreign objects. Foreign objects can be introduced to food at any time during food delivery and packaging and can cause serious concerns such as broken teeth or choking. Therefore, a preventive method that can detect and remove foreign objects in advance is required. Several studies have attempted to detect defective products using deep learning networks. Because it is difficult to obtain foreign object-containing food data from industry, most studies on industrial anomaly detection have used unsupervised learning methods. This paper proposes a new method for real-time anomaly detection in packaged food products using a supervised learning network. In this study, a realistic X-ray image training dataset was constructed by augmenting foreign objects with normal product images in a cut-paste manner. Based on the augmented training dataset, we trained YOLOv4, a real-time object detection network, and detected foreign objects in the test data. We evaluated this method on images of pasta, snacks, pistachios, and red beans under the same conditions. The results show that the normal and defective products were classified with an accuracy of at least 94% for all packaged foods. For detecting foreign objects that are typically difficult to detect using the unsupervised learning and traditional methods, the proposed method achieved high-performance real-time anomaly detection. In addition, to eliminate the loss in high-resolution X-ray images, the false positive rate and accuracy could be lowered to 5% with patch-based training and a new post-processing algorithm.
Keywords: Deep-learning; anomaly detection; packaged food X-ray detection; foreign substances detection; abnormal data augmentation
Anomaly detection, a method that detects abnormal data from normal data, has long been a challenge in the field of computer vision. Among the various applications of anomaly detection [1,2], industrial anomaly detection aims to find defects that rarely occur in products. This is difficult because if defects are not accurately detected, they can cause considerable damage to the factory. Defective products occurring in industry appear in various forms. For example, part of the product may be damaged or missing, or the product may contain foreign objects. This study focused on foreign objects found in food. Food contamination can be classified into four main types: chemical contamination, microbial contamination, physical contamination, and allergenic contamination. Among them, physical contamination occurs when food comes into contact with foreign objects during food delivery and/or packaging and can cause serious issues such as broken teeth or choking. The physical contaminants that can be found in food include jewelry, hair, plastic, bones, stones, pest bodies, and cloth. Additionally, if there are problems with the food factory premises or equipment, items such as flaking paint or loose screws may also enter food. Physical contaminants may even carry harmful bacteria, which poses an even greater risk. Therefore, foreign objects must be removed from food. Skilled technical workforce were initially employed to monitor products and detect foreign objects. However, such a method was inefficient because it was prone to human error and was time-consuming and exerting. Thus, it was necessary to develop technology that could automatically and accurately find foreign objects in food. To this end, methods for detecting foreign objects with a single X-ray image have been developed [3–5]. However, these methods are generally aimed at detecting foreign objects that are clearly visible in relatively simple food X-ray images. In recent years, methods using deep learning have shown very good results in various areas of computer vision, solving problems that could not be resolved with existing algorithms. Popular deep learning-based methods include supervised learning, unsupervised learning, and reinforcement learning. In the field of anomaly detection, many studies have used unsupervised learning, which does not require abnormal data and can learn only with normal data [6–9]. These studies are often performed with datasets that are not used in the field, such as CIFAR-10 [10] and MNIST [11]. However, food factory images always have the same background, and the shape of each product is somewhat consistent. In addition, defective product images are slightly different from the images in commonly used datasets because they differ from normal products only in a very small part. Because the difference between normal data and abnormal data is very small, segmentation methods that can consider small features in pixel units are more popular than classification methods that considers the whole image. Existing unsupervised learning methods have been popular because it is considerably difficult to obtain defective product or abnormal data from the food industry. However, if solely abnormal data could be obtained, supervised learning methods would perform much better. Given sufficient data, supervised learning methods have proven to be effective in image classification, image segmentation, and object detection, subject to availability of data [12–14]. In this study, we propose a method to accurately detect defective products through supervised learning with a very small amount of industrial abnormal data. In this study, we aimed to detect stone, metal pieces, and glass fragments in the packaged foods of pasta, pistachios, snacks, and red beans. The data used in this study have not been utilized by any previous studies. Because supervised learning networks require training data, we augmented X-ray image training data in a cut-paste manner. The test data were constructed from defective product X-ray images collected in the field. We used our training data to train YOLOv4 [15], an object detection network capable of real-time detection. By predicting the test data with the learned YOLOv4, normal and defective products were classified with at least 94% accuracy for all foods. In addition, we were able to improve accuracy and false positive rate (FPR) with our own post-processing algorithm and a training method optimized for high-resolution images.
The contributions of this study can be summarized as follows:
1. We proposed a method that can accurately detect and classify foreign object using a supervised learning method with a small set of abnormal data.
2. Anomaly detection was performed on a new real-world dataset that had not been studied before.
3. A training dataset was constructed by augmenting X-ray images, which are difficult to acquire, in a cut-paste manner.
4. By using patch-based training, we could improve detection performance and predict any size of high-resolution image. Moreover, our post-processing algorithm was able to improve accuracy.
To reduce human effort, a method that automatically detects foreign objects in packaged food is required [16,17]. In early research, there were many studies on rule-based algorithms using X-ray imaging. Reference [18] presented a method for detecting foreign objects in food products using grating-based multi-modal X-ray imaging. Wood chips, insects, and soft plastics, which were not commonly detected by grating-based multi-modal X-ray imaging, could be detected through their X-ray image enhancing method. In [3], machine vision was used to automate fish bones detection, which was previously conducted by human touch and vision. These studies did not perform well when the foreign object to be detected was thin or had a low density. In addition, expensive equipment was required for each of these methods, and only limited types of food could be detected. In other words, these methods cannot be applied to the packaged foods that we aimed to detect. In this study, we performed foreign object detection in completely different food items than those studied previously, and we propose a method that can detect various foreign objects in various foods using deep learning. In addition, while previous studies could not detect foreign objects in food if it was larger than the X-ray equipment, our proposed method can detect foreign objects with identical performance capacity regardless of size if patch-based training is performed.
2.2 Unsupervised Learning Methods
In anomaly detection studies using deep learning, unsupervised learning methods are generally more popular than supervised learning because it is difficult to collect abnormal data due to the scarcity [19,20]. Among unsupervised learning methods, one class classification (OCC) learns the distribution of features of a normal image and judges all data that do not follow that distribution as abnormal [21–23]. However, many studies have used the MNIST [11], CIFAR-10 [10], and ImageNet [24] datasets, which have very different features for each class. For example, if a wolf image is entered into a deep learning network that only trains on tiger images, it will be judged as abnormal because the appearances of the wolf and tiger are very different. However, there are many cases in industry where normal and abnormal cases are judged to be similar. Products in industry have only slight differences, and it is difficult to distinguish between them using OCC because all other parts are similar. Therefore, in industrial anomaly detection, one class segmentation (OCS) is widely used [25,26]. In OCS, generative deep learning networks, such as the autoencoder [27], variational autoencoder [28], and generative adversarial network (GAN) [29] are used [30–33]. OCS trains with normal product images as input and output of the neural network so that the network learns to reconstruct a normal product image. When an abnormal product image is entered as input to the trained network, the image is reconstructed similar to a normal product. Then, the difference between the reconstructed image and input image is converted into an anomaly score, and anomaly detection is performed with an appropriate threshold value. Likewise, defective food products containing foreign objects can be considered similar because of the small difference from normal food products. However, anomaly detection is more difficult because it includes a gray-scale image, not an RGB image. In [34], anomaly detection was performed on industrial datasets using various OCS methods, but their performances varied for each product type. This means that OCS methods do not exhibit the same detection performance on all packaged foods. Therefore, OCS methods were not suitable for our data because we aimed to detect foreign objects efficiently in any food item. In addition, OCS methods could not be used for our food data due to their poor reconstruction performance.
2.3 Supervised Learning Methods
2.3.1 Image Classification and Image Segmentation
Currently, most computer vision studies apply deep learning as a supervised learning method except for anomaly detection. Having already advanced to a high level, supervised learning networks generally show satisfactory performance on any sufficiently large dataset. Supervised learning is generally widely used for image classification, object detection, and image segmentation. Assuming that an image classification network [12–14] is used in our study, we can perform binary classification into a normal class and defective class. However, this is practically impossible because it is very difficult to obtain data corresponding to the defective class. Furthermore, as mentioned in Section 2.2, because most image classification networks extract features from whole images, it is difficult to distinguish between normal and defective food products. Moreover, as an image undergoes a number of convolution and pooling layers in a neural network, the foreign object parts become increasingly small; thus, there is a high probability that information of the foreign object may gradually disappear. Foreign objects in food can also be detected pixel-wise using image segmentation networks [35,36]. Similar to the case of image classification, however, they are difficult to train due to the lack of defective food product data; even if there are sufficient defective food product data, the process of directly labeling the boundaries of very small foreign objects in pixel units is time-consuming. For these reasons, image classification and image segmentation were not suitable for our packaged food data.
Object detection allows for the localization of an object in an image and the classification of multiple objects [37,38]. There are two reasons for using an object detection network to detect foreign objects in this study. First, object detection networks do not consider only the features of the entire image, as in image classification; these networks also consider the features of each part of an image to find where the object of interest is likely located. In a packaged food product, a foreign object is differently shaped than the food. Second, labeling in object detection is simple. Unlike segmentation annotation, only a bounding box must be drawn at the location of the foreign object. Note that object detection usually detects multiple objects and classifies each of them, but it is also possible to detect only one object by training the network as such. We judged that the detecting the existence of a foreign object itself is more important than knowing the type of foreign object. Accordingly, this study aimed to detect all types of foreign object as a single class. Object detection networks are classified as one-stage [39,40] or two-stage detectors [41,42]. However, recent studies have proposed one-stage detector-based networks with better performance and faster speed than two stage detector-based ones [43,44]. Accuracy is an essential factor in industrial anomaly detection. However, networks with slow speeds cannot be used in the field. Therefore, one-stage detectors with high speed are more suited to our research even though their performance is relatively lower than that of two-stage detectors. One-stage detector-based networks include YOLO [41], SSD [37], and EfficientDet [43]. Among the various one-stage detector-based networks, few have real-time capabilities. Here, real-time refers to approximately 30 frames per second (FPS) or higher. On the COCO [45] dataset, EfficientDet-D7 [43] showed state-of-the-art performance, but due to the high computational cost, it recorded 6.5 FPS, which is very slow. SSD [37] and networks that use similar methods [42,46] have relatively poor performance. Reference [41] proposed YOLOv1, a one-stage detector with very high speed and competitive performance compared to two-stage detectors at that time. Since then, YOLOv2 [47], YOLOv3 [48], and YOLOv4 [15] have been proposed and developed. EfficientDet ranges from D0 to D7 depending on the size of input image and depth of network. Among these, the real-time methods reach D2. Comparing the real-time performance of EfficientDet-D2 and YOLOv4, YOLOv4, which has a two-fold difference in speed but offers similar performance, is more advantageous in the field. In our study, the YOLOv4 network was the most suitable among object detection networks.
2.3.3 Anomaly Detection Data Augmentation
Training supervised learning networks requires a considerable amount of data. In particular, object detection requires at least thousands of object images per class. However, abnormal data are insufficient in the field. To date, data augmentation has supplemented training data that are insufficient in most supervised learning networks by using algorithms such as random crop, random rotation, horizontal flip, blurring, and elastic deformation on the original data. This augmentation changes the shape of the original image and increases the size of the original dataset by several times. Among the traditional data augmentation methods, those that change the texture of the image result in a difference between the original image and augmented image. Because packaged food images captured by X-ray equipment are always taken under the same conditions, changing the texture of the image is not suitable. In addition, data augmentation methods that transform the image do not change the texture of the image. In industrial anomaly detection, however, abnormal data are very scarce; thus, even if the data are augmented by the transformation augmentation method, there will be insufficient data to train the network. Furthermore, because a foreign object in an image does not change, the features of the objects learned by the network are always similar. As such, existing data augmentation methods may cause network performance degradation, and we must apply a method that can augment realistic data very similar to the test data without changing the texture. Various studies have been conducted to generate realistic fake data for anomaly detection [49–51]. Reference [49] proposed a method of augmenting real normal data using an adversarial autoencoder (AAE) instead of the aforementioned simple algorithm. The AAE, which learned the latent space of the training data, generated data similar to the training data by sampling images within the latent space distribution range of the training data. Reference [50] proposed a method to derive the learning data necessary for OCC in a well-trained autoencoder in almost every epoch. In [51], AnoGen was used to provide realistic data for validating and testing machine learning models. References [49–51] used a latent space, but because defective food images are similar to normal food images, these methods are not suitable for our study because the latent spaces are similar.
2.3.4 Object Detection Data Augmentation
In the field of object detection, various data augmentation methods have been proposed for learning objects [52–54]. For example, a multi-scale strategy [52], patch cropping [53], and random erasing [54] have been applied to original images to vary their spatial structures. However, these methods have a disadvantage in that it is difficult to change the visual content and context of objects. Recently, several augmented object detection datasets using a cut-paste approach have been proposed [55–57]. For example, data was augmented by shooting a background scene with no objects and attaching objects to be detected [56]. In [56], a dataset was augmented in a cut-paste manner and trained on Faster R-CNN [38] and VGG-16 [57]. For detection on real images, it showed competitive performance with a model trained on human-curated datasets. When data augmentation is performed in a cut-paste manner, a large amount of data containing various foreign objects can be augmented from high-resolution X-ray images without damaging them. In this study, training data required for supervised learning were augmented in a cut-paste manner. Packaged food X-ray images have a more common, uniform background than the images considered in [55–57]. Fig. 1 shows X-ray images of packaged foods used as background in our study compared to the background images used in [56]. Because the intensity of radiation is constant in X-ray equipment, the background does not vary and is always constant. In addition, because packaged food is always packaged similarly, its shape is also constant. Our data can be considered simpler than the data used in [55–57] because the background and packaged foods are always similar and uniform in the X-ray images. Moreover, the foreign objects that we aim to detect are much smaller than the objects in [55–57] and are more difficult to detect because they are highly similar to the background. Moreover, detection with a one-channel grayscale image is more difficult compared to detection with a three-channel RGB image. We created the boundary that occurs when we paste objects on the background using few algorithms. In addition, by utilizing the features of X-ray, the thickness and density of foreign objects can be learned in various ways. Fig. 2 illustrates the process of augmenting packaged food X-ray data in a cut–paste manner.
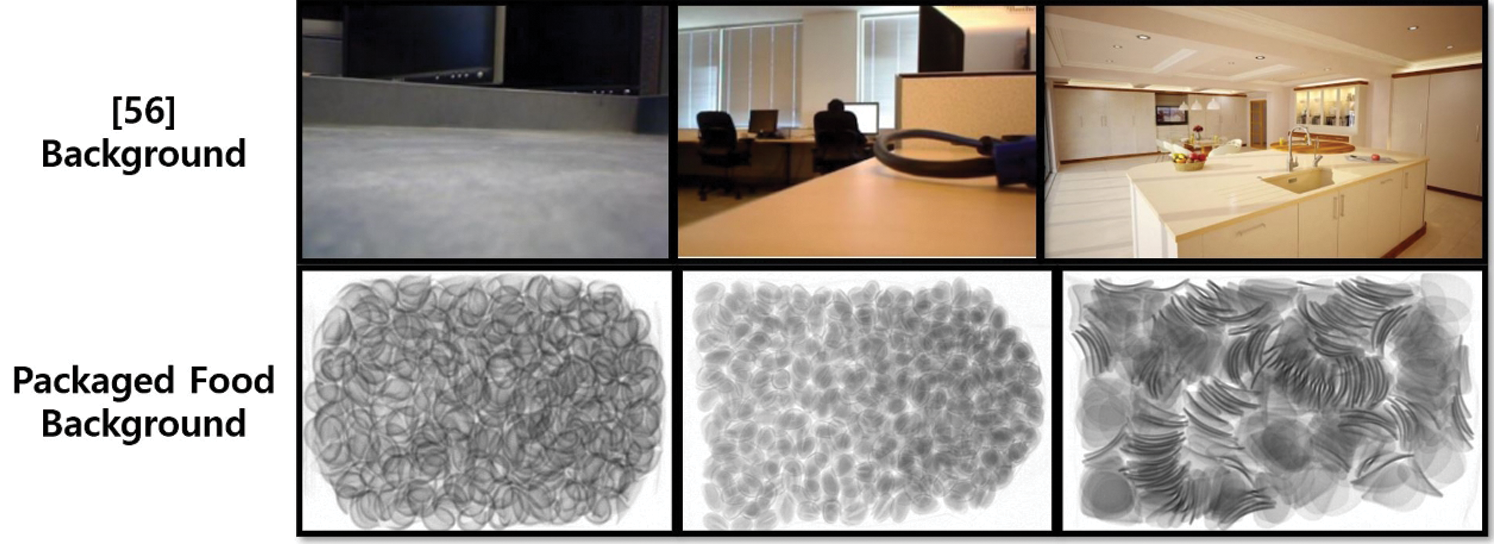
Figure 1: Background comparison of packaged food data and data in [56]
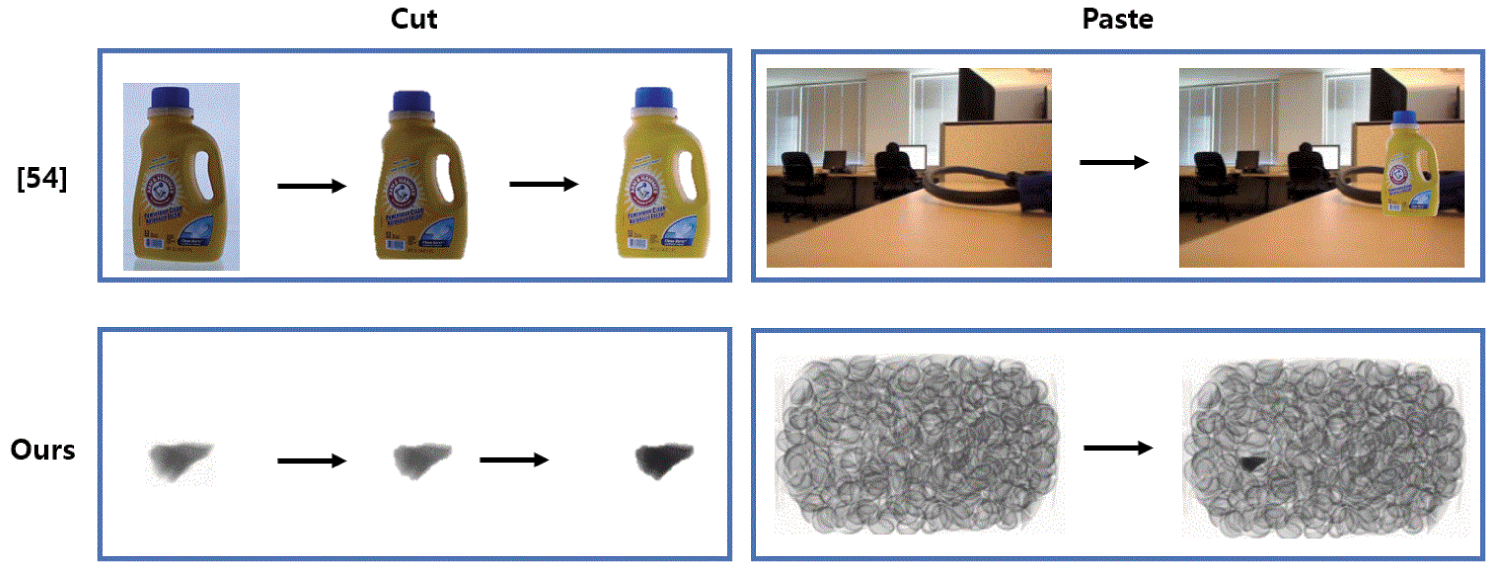
Figure 2: Cut-paste data augmentation process
When training a deep learning network, an increase in the size of the input image increases the computational cost exponentially. In addition, a small batch size is necessary due to insufficient memory capacity, which greatly delays the training and prediction time of the network. Thus, in general, regardless of image size, it is resized to a specific size in the network and then trained [12,13,29,35]. However, there is a high possibility that important information in the original image will be lost in the process of resizing. In particular, very small objects in the image are lost as they pass through the layers of the deep learning network. Reference [58] showed that the network performance can be improved by resolution scaling that increases the size of the input image. Because foreign objects in packaged food are very small, it is very important to maintain the image size. Among the various methods for learning a network while maintaining the size of the input image, dividing the image into small pieces and training it in units of patches is effective [59–61]. In [59], high-resolution images were trained in tens of thousands of patch units to segment retina vessels. In [60], to learn the characteristic patterns of animals, small patches on the bodies of animals were cut out and trained. In [61], anomaly detection and segmentation of MVTec [34] data in patch units was performed using Patch SVDD, which is an extension of Deep SVDD [23]. However, the size of patch used in [59–61] is extremely small for object detection. The study most similar to ours was presented in [62]. In [62], YOLOv3 [48] was trained by splitting one input image into six patches to prevent loss when had high-definition image captured in a driving system was resized. As a result, it was possible to further reduce the FPR for small objects. Similar to our study [62], high-resolution food images were each cut into four patches. However, there were many cases where the network makes incorrect judgements at the edge of an image. We applied a post-processing algorithm to address this limitation so that the accuracy could be further improved alongside FPR. In addition, an experiment was conducted using YOLOv4, which is more advanced than the YOLOv3 learned in [62].
3.1 Types of Food and Foreign Objects
Various types of foreign objects are found in food, including glass fragments, stones, metal pieces, insects, and vinyl. Among them, vinyl, flies, and wood chips are difficult to detect, even with human eyes [63]. Therefore, an automatic detection technology that saves human effort is required. Accordingly, our study aimed to detect stones, metal pieces, and glass fragments that could be identified by human eyes and to classify them as defective food products. In this study, foreign objects were detected in packed pasta, pistachios, snacks, and red beans. Fig. 3 shows the types of packaged food, and Fig. 4 shows three types of foreign objects that we attempted to detect in these packaged foods.
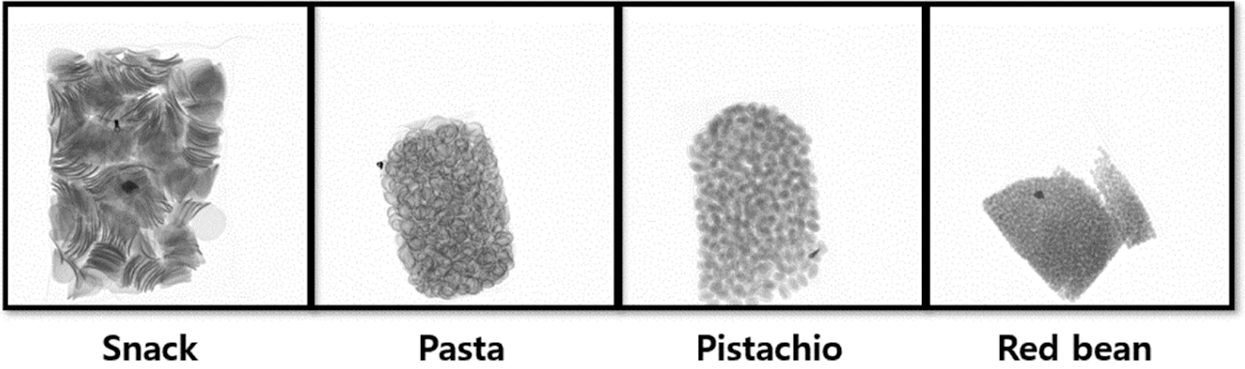
Figure 3: Types of packaged food captured by X-ray equipment
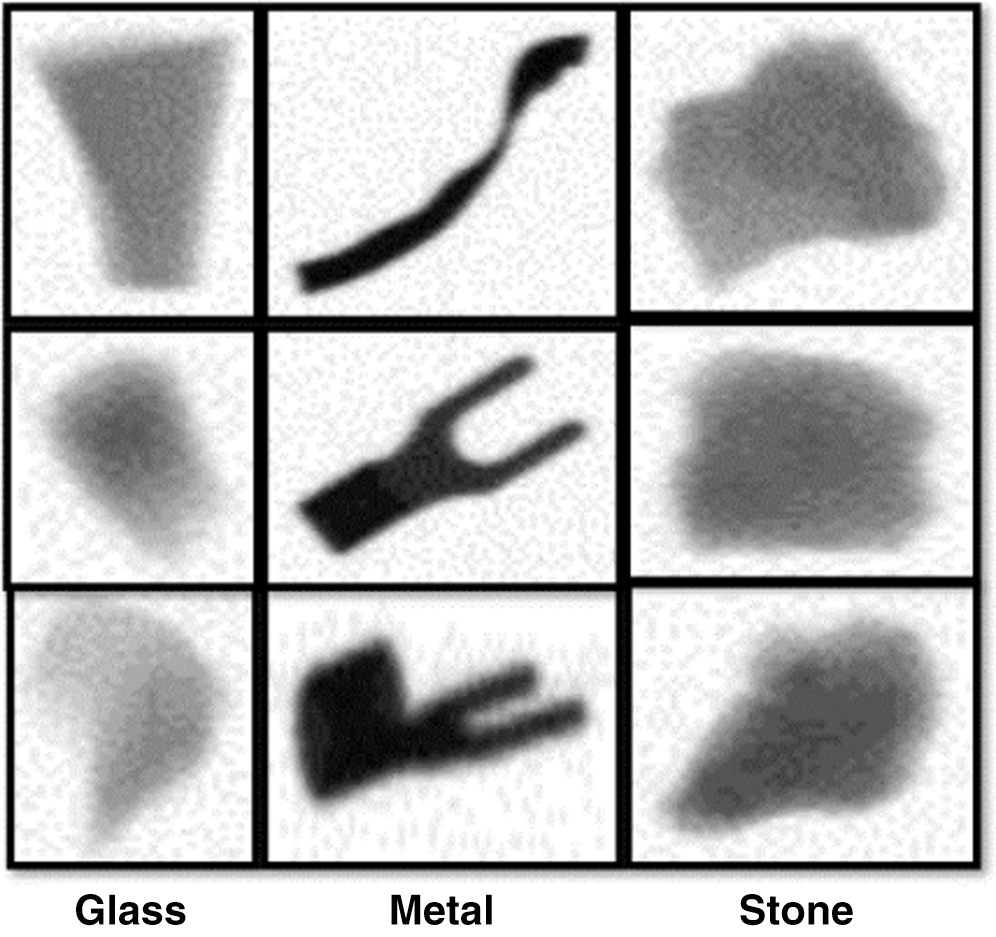
Figure 4: Types of foreign object captured by X-ray equipment
The difficulty of detection depends on the characteristics of the food. This is because different foods have different thicknesses and densities in X-ray images. In the process of packaging, foods overlap with each other inside the packaging, and thin foods may appear thick. Snacks and pasta are grains of food in the form of ovals. In the wrapping paper, the grains can be laid horizontally or vertically. Vertically stacked granules in X-ray can appear to be thick. However, because red beans and pistachios have spherical shapes, they show the same thickness in an X-ray image from any angle. Therefore, pasta and snacks are relatively more difficult to detect foreign objects than pistachios and red beans. Fig. 5 shows enlarged images of each type of food.
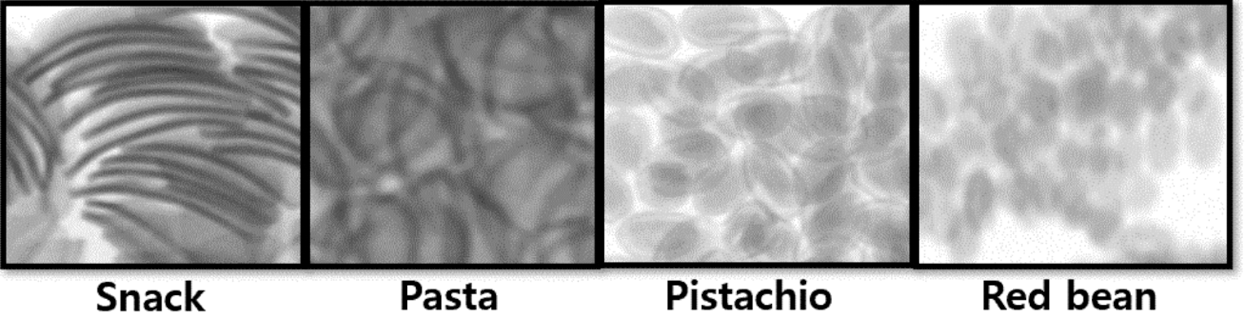
Figure 5: Enlarged views of each packaged food in X-ray images
We considered metal, stone, and glass as types of foreign object, as shown in Fig. 4, ranging from high to low density. Metal pieces have a high density, but because their shapes are diverse, a variety of metal pieces are required to implement a universal network. Glass fragments are generally not dense; thus, when their thickness is low, they appear faint, similar to vinyl. Stones have a mid-range density, but most of them are very small, making them difficult to detect. Fig. 6 shows the foreign objects contained in each food. It is the most difficult to detect stone and glass fragments in pasta and snacks with relatively difficult conditions.
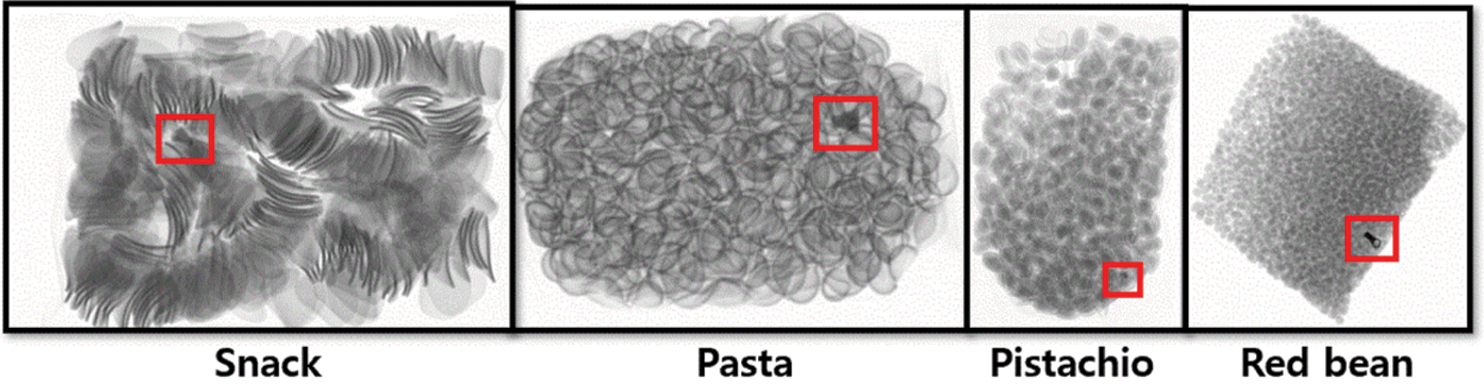
Figure 6: Foreign objects contained in each food
3.2 X-Ray Images of Packaged Food
X-ray images of packaged foods were captured by X-ray equipment [64]. With X-ray equipment, it is possible to capture images according to the size of the food, but the width and length of the image can be expanded as much as possible. Because the X-ray equipment only takes an image of one type food, there are no data on two food types in one image. The captured packaged food X-ray images were  (
(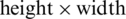 ) pixels. Then, we padded them to square images of
  . The captured X-ray images were one-channel grayscale images in .bmp format. Blurring was applied as an image pre-processing technique to remove noise. Finally, the one-channel grayscale images were converted to three-channel images to improve performance. Details on this procedure are provided in Section 3.5. Fig. 7 shows the overall process of capturing X-ray images of the packaged foods and their pre-processing.
Figure 7: Pre-processing of packaged food X-ray data
Among the supervised learning methods, the detection of foreign objects with an object detection network requires many training data. However, in industrial anomaly detection, it is difficult to obtain images of defective food product. Therefore, we augmented the data in a cut–paste, as in [55–57]. This requires a background image with no object and an object image to be pasted onto the background. In our study, the normal data are X-ray images of packaged food containing no foreign objects, and the abnormal data are images of packaged food containing foreign objects.
Therefore, the background images are regular packaged food images, and the object images are images showing only the foreign objects without packaged food. In [55–57], segmented objects attached to a background were filmed under different lighting. The difference in brightness between the background and object creates a sense of difference. To eliminate this for foreign objects, we imaged foreign objects and packaged foods under the same conditions with X-ray equipment so that the backgrounds of foreign objects and packaged foods have the same roughness. In this way, it is possible to generate images as close as possible to defective food data in the real-world. We captured 500 images of each food product to create various backgrounds. Fifty foreign objects to be pasted on the background were photographed for each type.
Fig. 8 shows the whole process by which we augmented the training data in a cut-paste manner. The augmentation process consists of three steps. The first step involves extracting only the food mask to paste foreign objects from the X-ray area, as illustrated in Fig. 9. First, one image is randomly selected from 500 normal packaged food images, and binarization is performed with a threshold value of 200. Because there are many holes in the binarized image, a dilate operation is applied twice to eliminate them, followed by an erode operation. Finally, to create more diverse backgrounds, a random flip is applied to the food images. Through this process, the mask of the packaged food area is obtained from the image. The second step is the segmentation of foreign objects, as illustrated in Fig. 10. First, one of the three foreign object types is selected at random, and then one of the 50 foreign objects corresponding to the selected type is also randomly selected. Then, blurring is applied to remove noise, followed by binarization with a threshold value of 200. Next, the mask to be segmented is obtained by applying the erode operation once.
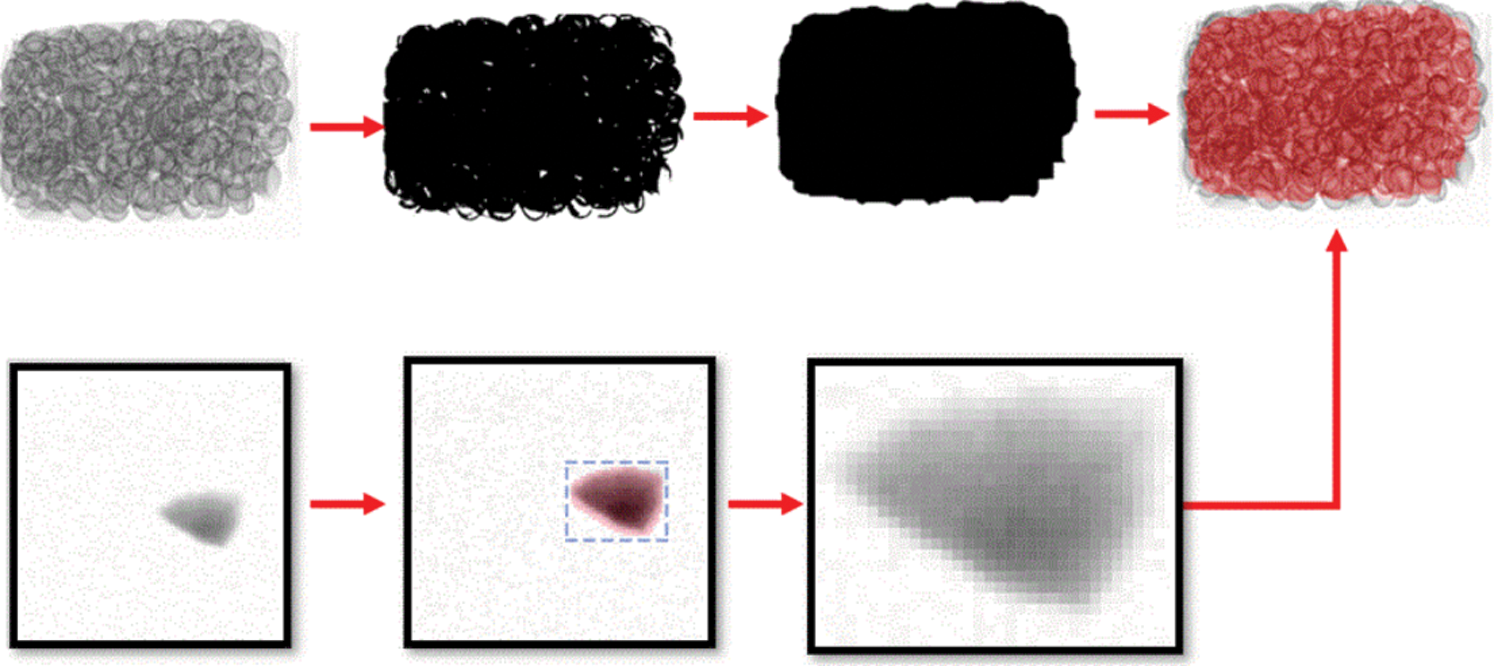
Figure 8: Cut-paste data augmentation process for packaged food X-ray images
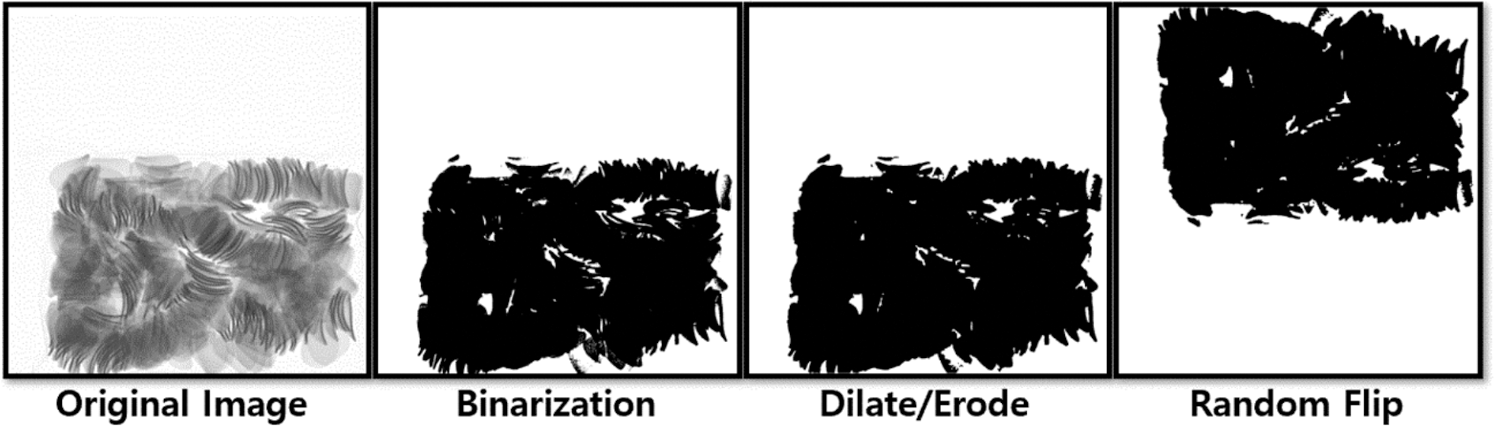
Figure 9: Process of extracting food area from normal X-ray food image
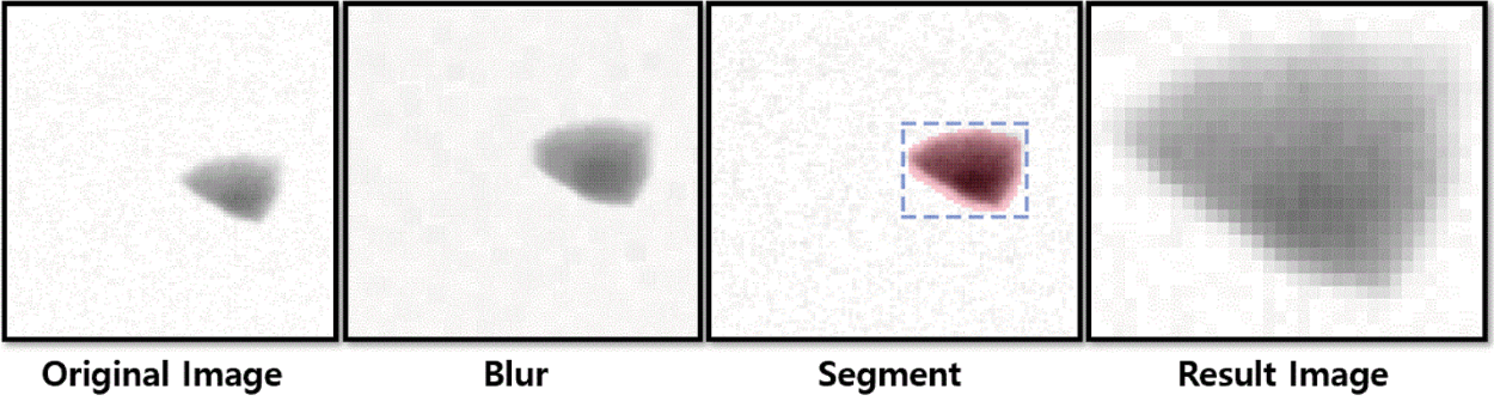
Figure 10: Foreign object segmentation process
To make various shapes, random rotation and flip are applied to the foreign object mask. Finally, the foreign object area corresponding to the mask is segmented. The third step is to attach the divided foreign objects to the packaged food image. Foreign objects are attached at random locations within the packaged food masks. As we have seen in [55–57], when an object is attached to the background, a sense of heterogeneity occurs at the boundary. This is because when attached to the background, the background pixel is replaced with the object pixel. Because we imaged the object and background under the same conditions, there is much less disparity. However, if the pixels of the foreign object are simply replaced with the pixels of the background, some sense of foreignness occurs. For this, we propose an X-ray image-specific method. X-ray images express the relative degree of radiation attenuation, which can be expressed through Eq. (1).

where I0 represents the X-ray background. Usually the background is white with a value of 255 because there is nothing present. u is the attenuation coefficient or density of a particular object. e is a natural constant, and T is the thickness of a particular material. When a material is captured with X-ray equipment, the background becomes inversely proportional to the thickness and density of the material, and the final brightness value is indicated as I0. Therefore, the higher the density of a specific material, the lower the brightness. Even if a specific material has a low density but is thick, it can appear to have a high density. If two materials are superimposed on such an X-ray image, it can be expressed as Eq. (2).

In terms of packaged food and a foreign object, u1 is the density of the packaged food; T1 is the thickness of the packaged food; u2 is the density of the foreign object, and T2 is the thickness of the foreign object. Eq. (2) can be converted into Eqs. (3) and (4).


In the end, in the X-ray image, the pixels of the foreign object in the packaged food are equal to the product of the brightness of the food and brightness of the foreign object. In other words, the X-ray image of a packaged food containing a foreign object at the same location can be considered the same as the X-ray image of a packaged food augmented with a foreign object. We could make the segmented foreign object similar to the real data by multiplying the food mask instead of replacing it. Because significant noise occurs in an X-ray image, it cannot be said that the image is exactly the same. Here, we multiply the entire segmented foreign object by a random real number between 0.5 and 1.5. We must change the brightness of the foreign object because it can make the thickness of the foreign object very diverse. We made annotations based on the location and size of foreign objects in each food. At this time, all kinds of foreign objects were defined as one class because it enables is the detection of similar foreign objects besides glass, metal, and stone. If anything that appears to be a foreign object in the packaged food is found, it is classified as a defective food product. At that moment, it is unnecessary to know the type of foreign object. If each foreign object is defined as a class, several problems may arise. Because glass and stone are similar in shape, a trained network can misrepresent glass as stone or viceversa.
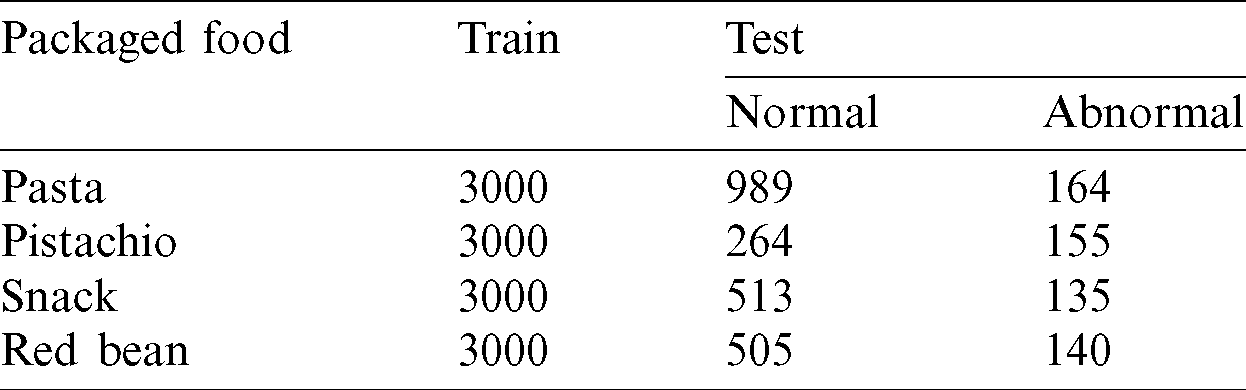
All augmented images were used as training and validation data. We augmented 3000 training data per food item. Separately, 100 data were augmented and used as validation data. For the test data, X-ray images of actual defective food products were directly collected. For anomaly detection, it is important to detect abnormal data efficiently as well as to detect normal data correctly. Therefore, the composition of our test data was different from that in other deep learning methods [6,7]. Accordingly, we additionally collected normal data for each food in the test dataset. Tab. 1 describes the packaged food dataset constructed in this study.
Table 1: Packaged food X-ray dataset
For the detection method to be used in a factory, accurate performance and high speed are important. To this end, we used an object detection network called YOLO [41]. YOLO is the most representative network among one-stage detectors, offering overwhelming speed with high accuracy. In addition, it is highly suitable for use in the field because it shows high speed even on a single GPU, and detection methods that are GPU-intensive are a burden in factories. YOLO divides one image into certain grids, predicts coordinates, and classifies images in each grid using one neural network. Owing to continuous research [15,41,47,48], YOLO has been upgraded from v1 to v4. Currently, YOLOv1 and YOLOv2 are not often used due to their low performance compared to state-of-the-art networks [15,43,46]. YOLOv4 [15] is better than YOLOv3 [48] in terms of performance, but because YOLOv3 is known to be faster than YOLOv4, it is more beneficial to adopt a faster network. Therefore, we conducted our tests on both YOLOv4 and YOLOv3. As discussed in Section 3.4, the training dataset does not contain normal food data. Unlike YOLOv1, YOLOv3 and YOLOv4 predict an objectiveness score for each bounding box, where an objectiveness score of 0 represents background where there is no object for each part of the image. This means that an objectiveness score of 0 is learned for the parts of the defective food images not including foreign objects. Accordingly, normal food data can be viewed as images in which all parts have an objectiveness score of 0. In the defective food data, the background is overwhelmingly larger than the foreign object; thus, sufficient learning is performed on the part where the objectiveness score is 0. Therefore, normal food data with only background were not included in the training data. In YOLOv3, the feature extractor was changed from Darknet-19 to Darknet-53, and multi-scale training was performed. Fig. 11 shows the basic structure of YOLOv3.
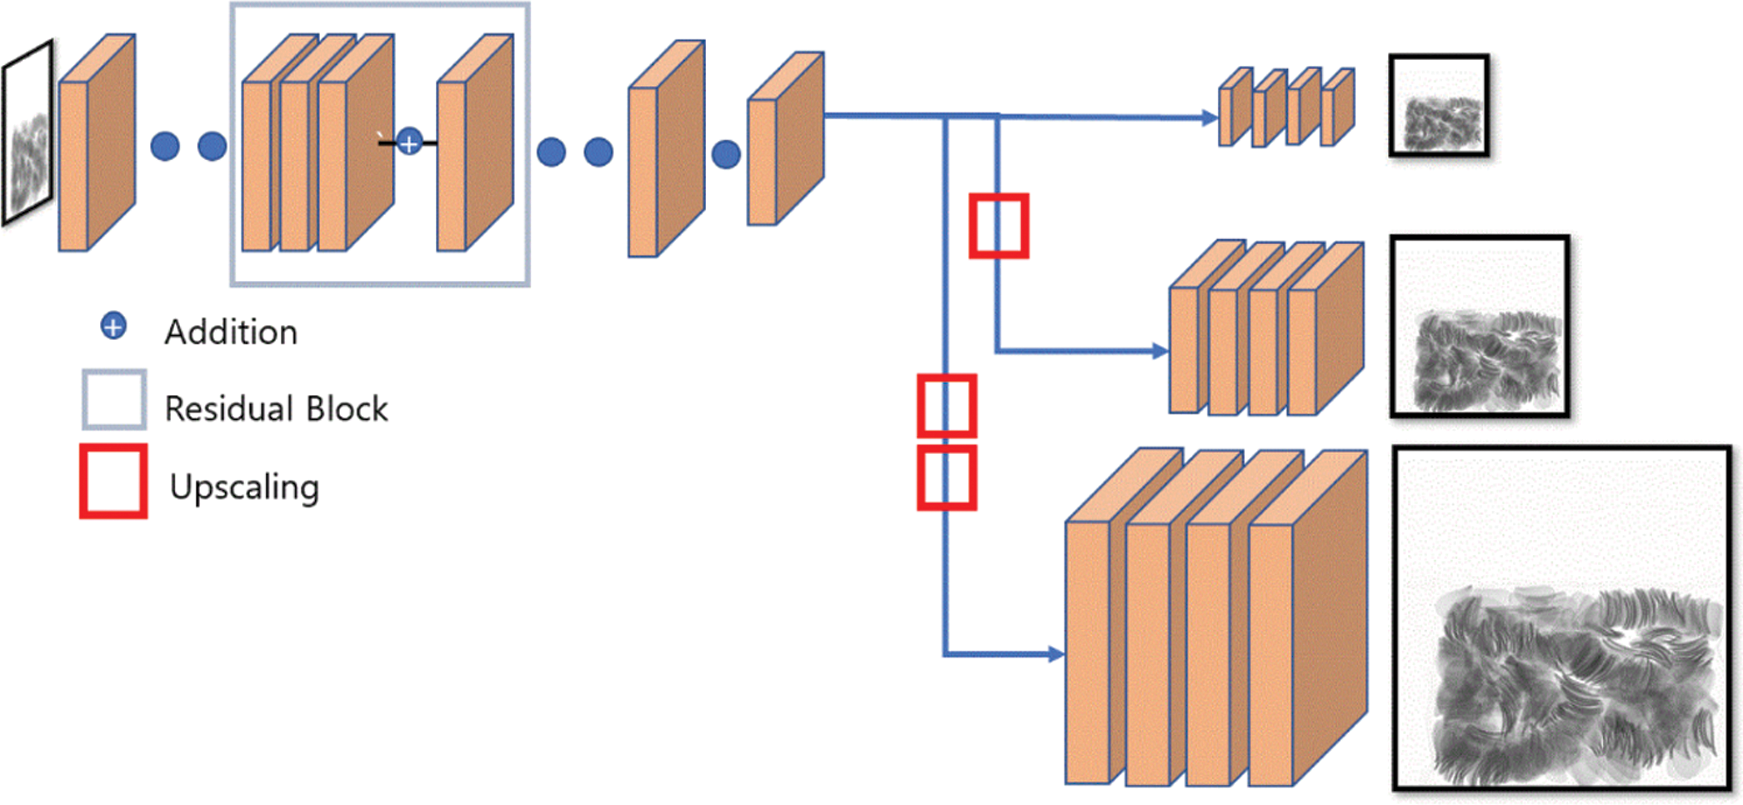
Figure 11: Basic architecture of YOLOv3
Because YOLOv3 cannot efficiently detect small objects, YOLOv4 has an increased image resolution to compensate for this limitation, and convolution layers are added to increase the receptive field. In addition, bag of freebies (BOF) and bag of specials (BOS) were added based on algorithms in other studies, which helped improve its performance. In addition, YOLOv4 changed the feature extractor in YOLOv3 from Darknet-53 to CSPDarkNet-53. Tab. 2 lists the details of YOLOv3 and YOLOv4. Fig. 12 illustrates the process of training on foreign objects in the YOLO network.
Table 2: Details of YOLOv3 and YOLOv4
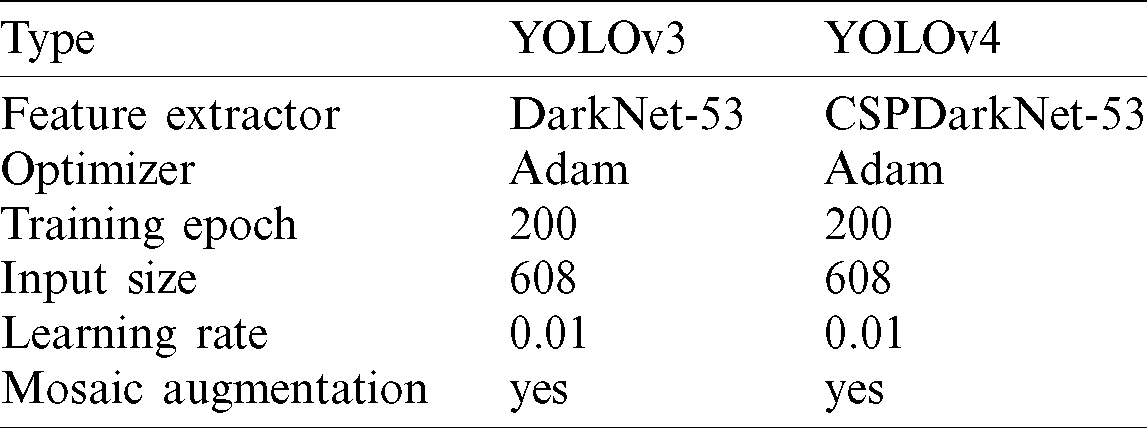
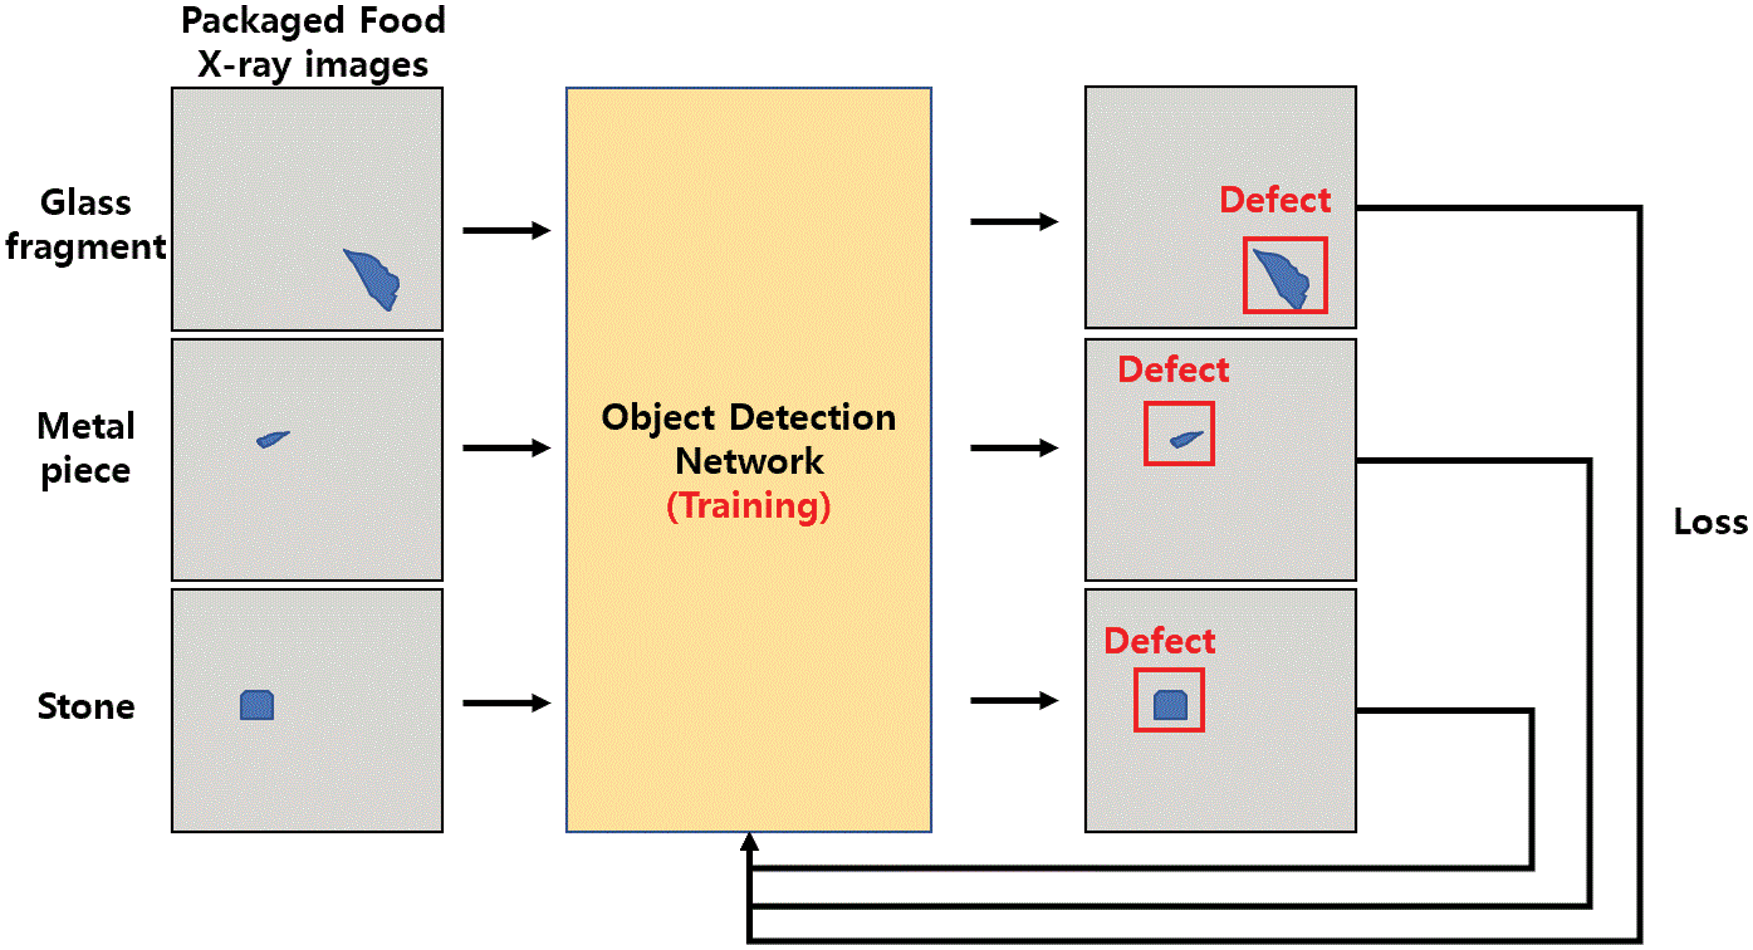
Figure 12: Training process of YOLO networks
It is generally known that better performance can be achieved if transfer learning is used. Transfer learning with weights trained with ImageNet [24] in the feature extractor of YOLOv4 and YOLOv3 results in better performance. Therefore, we merged three identical one-channel grayscale X-ray images into a three-channel X-ray image to enable transfer learning. The input size of YOLOv4 was set to 608 horizontally and vertically, and those of YOLOv3 were each set to 416. The batch size was set to 1. Data augmentation used in YOLOv3 and YOLOv4 was not used except for mosaic augmentation. Other settings were the same as in [15,48]. In general, factories often produce only one type of product. Therefore, we trained separate networks for each food data type separately.
The input images were resized when entering the YOLOv4 network. Because low-resolution images are problematic due to the large loss of data, high-resolution images were used because small foreign objects become smaller. The images detected had a resolution of  pixels, but images with higher resolution can be sufficiently detected depending on the food type. A higher resolution leads to a lower model performance. To this end, we cropped and learned high-resolution X-ray images in patches as the input size of the network, as with the method in [62]. However, when cropped to a patch, the object may be cut off. We left all cropped objects larger than 100 pixels. Thus, training and prediction were possible with an image of any resolution and in a network of the same size. Fig. 13 shows the resized training process and training process by cropping an image into patches. When the network makes predictions, similar to when training, the test image is split into patch units and recombined after the prediction is made. However, because patch-based training predicts as many patches as possible, there is a disadvantage that the inference time of one sheet is slowed by the number of patches. The packaged food data are made up of four
  608 patches. Accordingly, the training data as well as the training time and prediction time are increased fourfold. Food is often cut in cropped images. Cut foods that are visible at the edges of the image can look similar to foreign objects. In [62], the high-definition image was cropped into patches, trained, and predicted, but it can be seen that false detections are made at the edge. In this study, prediction at the edge was removed through a post-processing algorithm. Because the four patches have many overlapping parts, even if the prediction at the edge is removed, it is possible to predict normally because the intact object exists in another patch. This was possible because the object to be detected was a small foreign object.
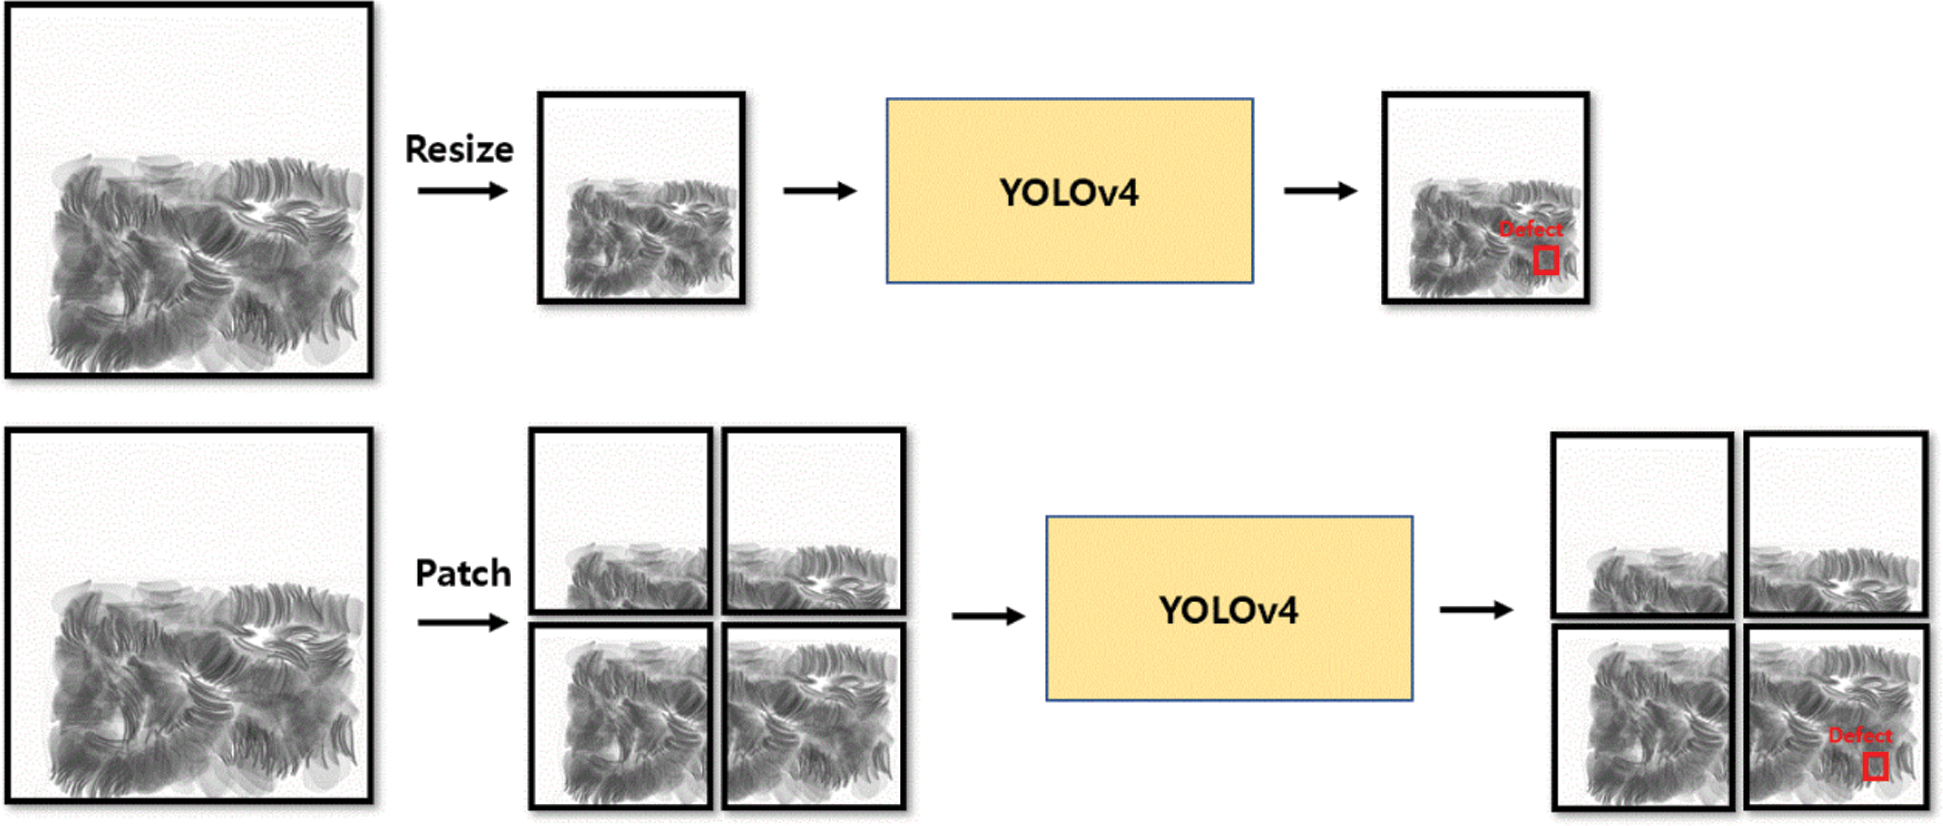
Figure 13: Difference between resized and patch-based training
In general, an object detection network conducts performance evaluation based on the number of correctly detected objects in a test image and the result of classifying the object class. However, in this study, the performance was evaluated on a different basis. As mentioned previously, all types of foreign objects were classified as a single class because it is unnecessary to classify the types of objects. The only important factor to ensure is that foreign objects are not detected in normal food images and are detected in defective food images. Thus, if a foreign material was not detected in a normal food image, it was classified as a true positive (TP); if a foreign material was detected in a normal food image, it was classified as a false positive (FP); if a foreign material was detected in a defective food image, it was classified as a true negative (TN); if no foreign material was detected in a defective food image, it was classified as a false negative (FN). The classification results were expressed as a confusion matrix, and the precision, recall, FPR, and accuracy were evaluated accordingly.
4 Experiment Results and Discussion
In industrial anomaly detection, FPR is the most important performance indicator [3,4]. FPR is the rate at which a defective food product is incorrectly predicted as a normal food product. In industry, misclassifying a normal product as defective is acceptable to some extent. This is because the cost incurred by discarding the product can be covered. However, if a defective product is classified as normal, it will be sent directly to the consumer, which can cause harm to them.
The testing was conducted on a GeForce GTX 2080Ti GPU on a 16.04 LTS Ubuntu operating system. For Cuda, version 10.0 was used, and for Cudnn, version 3.7.5 was used. The Pytorch framework was used for the deep learning network.
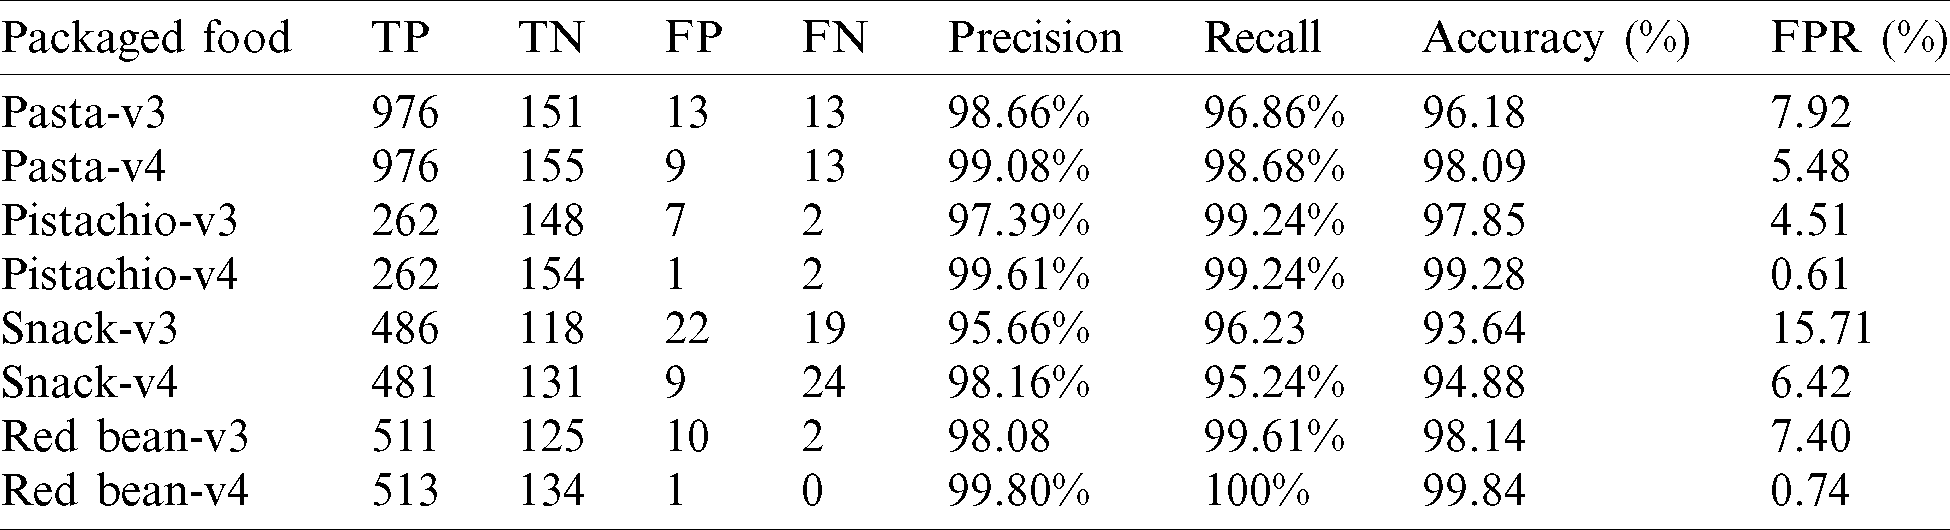
We trained and compared YOLOv3 [48] and YOLOv4 [15] on our augmented training data, and the results are listed in Tab. 3. First, a high accuracy was achieved for all foods using YOLOv3; precision and recall are also high. This means that the augmented training dataset is similar to the test data collected in the real world. In addition, the similar performance for all food types indicates that the proposed method is universally applicable. Based on these results, the proposed method will be able to detect foreign objects efficiently in other packaged foods and classify them as defective food products. However, it can be seen that most of the FPRs exceed 5%. In particular, the FPR for the snacks is 15.71%, which is the most difficult packaged product to evaluate. In industry, it is important to maintain the FPR below 1%. YOLOv3 certainly performs well, but its FPR requires further improvement. As mentioned in Section 3.5, YOLOv4 was able to detect small objects better by increasing the size of the input image and changing the network to CSPDarkNet-53. As a result of training YOLOv4 under the same conditions, the performance improved significantly compared to YOLOv3. In particular, the FPR decreased dramatically. For pistachios and red beans, it can be seen that the FPR was reduced to less than 1%, so that it can be applied in real-world scenarios. In addition, the FPR was also reduced for pasta and snacks, and in particular, it was approximately 9% for snacks. In our experimental environment, the inference time of YOLOv4 was 50 FPS, which is sufficient for real-time application.
Table 3: Performance evaluation results on YOLOv3 and YOLOv4
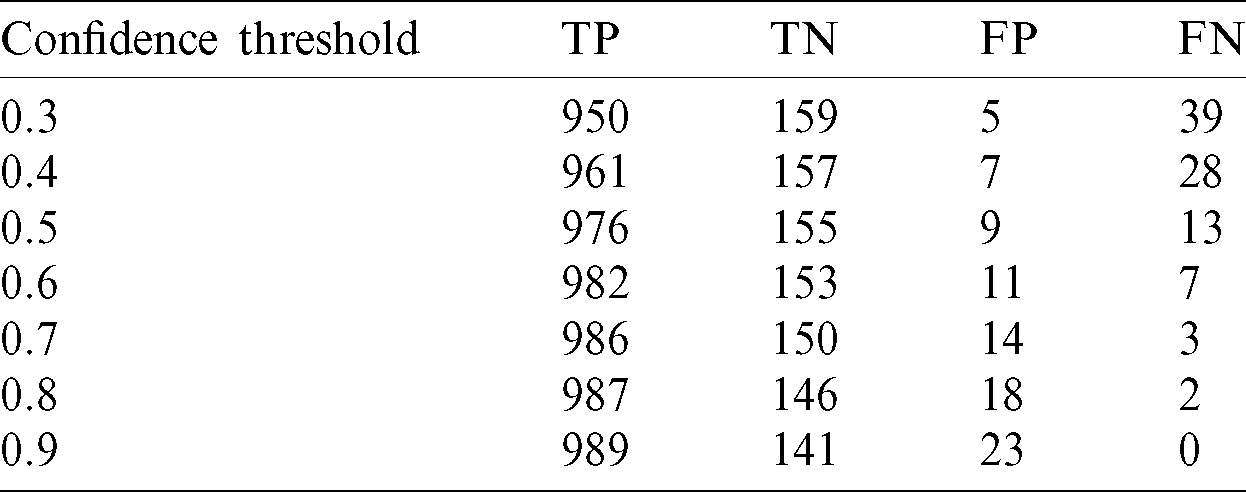
When predicting with the trained YOLOv4, the detection range can be changed through the confidence threshold. The confidence threshold is the threshold of the objectiveness score predicted by the model. In this study, all objectiveness scores above 0.5 were set to be printed out. However, FNs can be lowered further by adjusting the confidence threshold. Tab. 4 lists the experimental results when changing the confidence threshold for pasta. By varying the confidence threshold from 0.3 to 0.9, it can be seen that the FPs decreased to 5 when the confidence threshold was 0.3, while contrarily, FPs increased to 39 when the confidence threshold was 0.9. There was a trade-off between FPs and FNs according to the confidence threshold, and it is important to find an appropriate value. Decreasing FPs is acceptable, but several many FNs are not acceptable. Therefore, it was decided to fix the confidence threshold at 0.5, where FNs and FPs are balanced.
Table 4: Confidence threshold test results for pasta data
4.3 Patch-Based Training Results
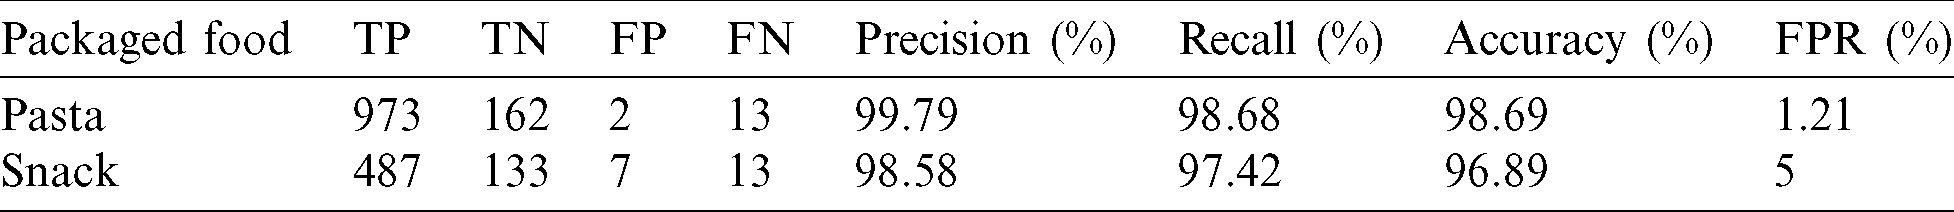
YOLOv4 has been shown to detect foreign objects in packaged foods efficiently. The FPR of pistachios and red beans was sufficiently low to be applied in the field, but the FPR of snacks and pasta was insufficient. We performed patch-based training on pasta and snacks, excluding pistachios and red beans, which showed satisfactory performance. Because one image is cut into four patches, the training data size increased to 12000. As a result of patch-based training, images can be learned without loss, resulting in more accurate results, and the prediction results are listed in Tab. 5. For pasta, the FPR decreased by 4.27%. In addition, the FPR decreased by 1.42% for snacks, proving that patch-based training is effective.
Table 5: Patch-based training results for pasta and snack
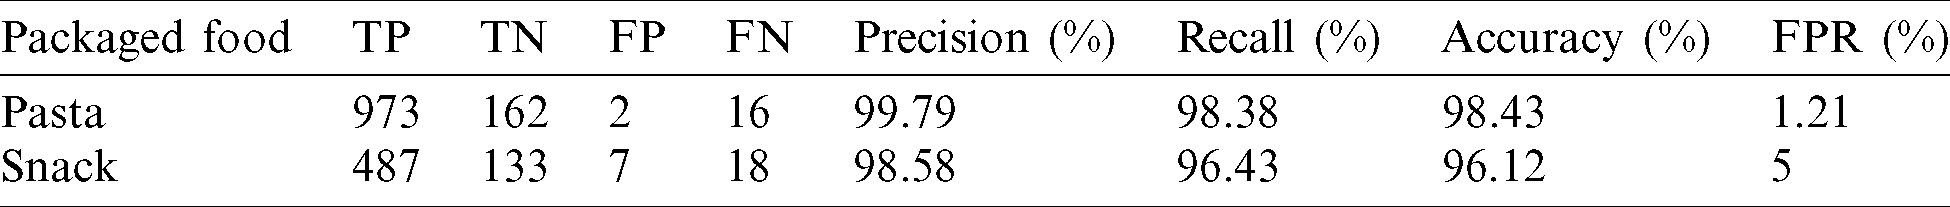
When we augmented the data for patch-based training, we removed the foreign objects with cut areas less than 100. Thus, as shown in Fig. 14, the model detected the edge as a foreign object, similar to the training data. That is, the parts of the food cut from the edges in normal food products were incorrectly predicted as foreign objects. Most of the false negatives in Tab. 5 were detected at the edges of normal images. Therefore, we conducted another experiment to apply a post-processing algorithm that removes all objects detected at the edge, and the results are listed in Tab. 6. Through the post-processing algorithm, it was possible to reduce the FNs and improve the accuracy slightly. The accuracy for pasta improved by 0.26%, and that for snacks improved by 0.77%. The performances for pistachios and red beans can also be improved with patch-based training, but it was not applied due to its slow speed.
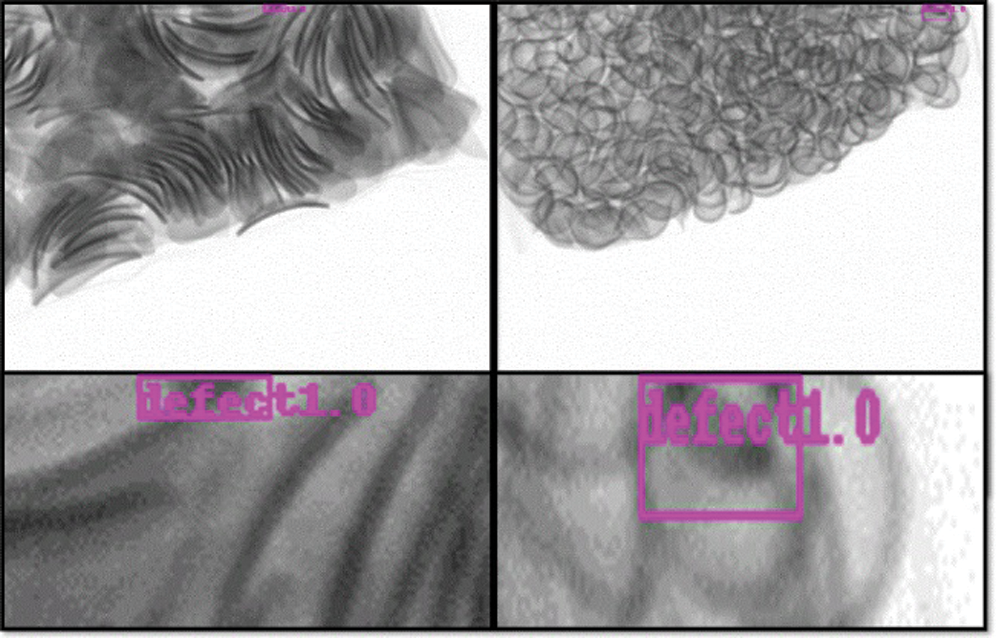
Figure 14: Errors detected at the edges of image when using the patch-based training model
Table 6: Post-processing after patch-based prediction results
We proposed a real-time anomaly detection method for packaged food X-ray images using a supervised learning network. To acquire defective food product data, which is difficult to obtain, a training dataset was constructed using X-Ray data augmentation., foreign objects were pasted using composition by reflecting X-ray characteristics. As a result, realistic defective food images could be augmented. With the augmented data, 3,000 training data were built, and test data were collected directly. By training YOLOv4, the accuracy was at least 94% for all foods. In addition, patch-based training was applied to reduce the loss in high-resolution images, and the accuracy was further improved through post-processing algorithms. The performance on test data shows that our augmented training dataset is highly similar to real data in the field. Furthermore, our method will perform similarly for other types of food.
The study has some limitations. Currently, the YOLOv4 used in this study can achieve 50 FPS. However, in the case of patch-based training, its prediction is approximately four times slower. In addition, because more patches are augmented for high-resolution images, a method to speed up the prediction is required. Moreover, a complex image lowers the performance. The proposed method may yield a low performance when used for food with complex structure, and thus, a deeper and larger model than CSPDarkNet-53 may be required. Three types of foreign objects were included in our training dataset, but various other foreign objects, such as insects and hair, were not considered. Therefore, it is necessary to build a dataset containing more diverse types of foreign object.
Funding Statement: This research was supported by Basic Science Research Program through the National Research Foundation(NRF) of Korea funded by the Ministry of Education(grant number 2020R1A6A1A03040583, Kangjik Kim, www.nrf.re.kr) and this research was also supported by the Soonchunhyang University Research Fund.
Conflicts of Interest: The authors declare that they have no conflicts of interest to report regarding the present study.
1. H. Yu, L. Sun and F. Zhang. (2019). “A robust bayesian probabilistic matrix factorization model for collaborative filtering recommender systems based on user anomaly rating behavior detection,” KSII Transactions on Internet and Information Systems, vol. 13, no. 9, pp. 4684–4705. [Google Scholar]
2. X. Liu, J. Ren, H. He, Q. Wang and S. Sun. (2020). “A novel network anomaly detection method based on data balancing and recursive feature addition,” KSII Transactions on Internet and Information Systems, vol. 14, no. 7, pp. 3093–3115. [Google Scholar]
3. D. Mery, I. Lillo, H. Leobel, V. Riffo, A. Soto et al. (2011). , “Automated fish bone detection using X-ray imaging,” Journal of Food Engineering, vol. 105, no. 3, pp. 485–492. [Google Scholar]
4. E. R. Davies. (2000). “Application to food production,” in Image Processing for the Food Industry, 1st ed., vol. 37. London, England: World Scientific, pp. 185–206. [Google Scholar]
5. M. Graves and B. Batchelor. (2003). “X-ray bone detection in further processed poultry production,” in Machine Vision for the Inspection of Natural Products, 1st ed., vol. 1. London, England: Springer, pp. 421–449. [Google Scholar]
6. M. Sabokrou, M. Fayyaz, M. Fathy, Z. Moayedd and R. Klette. (2018). “Deep-anomaly: Fully convolutional neural network for fast anomaly detection in crowded scenes,” Computer Vision and Image Understanding, vol. 172, pp. 88–97. [Google Scholar]
7. L. Ruff, R. A. Vandermeulen, N. Gornitz, A. Binder, E. Muller et al. (2020). , “Deep semi-supervised anomaly detection,” in 8th Int. Conf. on Learning Representations, Addis Ababa, Ethiopia. [Google Scholar]
8. S. Pidhorskyi, R. Almohsen, D. A. Adjeroh and G. Doretto. (2018). “Generative probabilistic novelty detection with adversarial autoencoders,” in Annual Conf. on Neural Information Processing Systems 2018, Montreal, Canada, pp. 6823–6834. [Google Scholar]
9. S. Choi and S. Y. Chung. (2020). “Novelty detection via blurring,” in 8th Int. Conf. on Learning Representations, Addis Ababa, Ethiopia. [Google Scholar]
10. Y. Abouelnaga, O. S. Ali, H. Rady and M. Moustafa. (2016). “CIFAR-10: KNN-based ensemble of classifiers,” in Int. Conf. on Computational Science and Computational Intelligence, Las Vegas, Nevada, USA, pp. 1192–1195. [Google Scholar]
11. M. Fatahi. (2014). “Mnist handwritten digits,” . [Online]. Available: https://www.researchgate.net/profile/Mazdak_Fatahi/publication/273124795_MNIST_handwritten_digits_Description_and_using/links/54f7e82f0cf28d6dec9f6d2d/MNIST-handwritten-digits-Description-and-using.pdf. [Google Scholar]
12. K. M. He, X. Y. Zhang, S. Q. Ren and J. Sun. (2016). “Deep residual learning for image recognition,” in Conf. on Computer Vision and Pattern Recognition, Las Vegas, Nevada, USA, pp. 770–778. [Google Scholar]
13. C. Szegedy, W. Liu, Y. Jia, P. Sermanet, S. Reed et al. (2015). , “Going deeper with convolutions,” in 28th IEEE Conf. on Computer Vision and Pattern Recognition, Boston, MA, USA, pp. 1–9. [Google Scholar]
14. M. Tan and Q. V. Le. (2019). “EfficientNet: Rethinking model scaling for convolutional neural networks,” in 36th Int. Conf. on Machine Learning, Long Beach, California, USA, pp. 6105–6114. [Google Scholar]
15. A. Bochkovskiy, C. Y. Wang and H. Y. M. Liao. (2020). “YOLOv4: Optimal speed and accuracy of object detection,” arXiv preprint arXiv:2004.10934. [Google Scholar]
16. R. P. Haff and N. Toyofuku. (2008). “X-ray detection of defects and contaminants in the food industry,” Sensing and Instrumentation for Food Quality and Safety, vol. 2, pp. 262–273. [Google Scholar]
17. H. Hou and F. Wu. (2019). “Comparison research on X-ray image quality defects detection algorithm in semiconductor manufacturing,” in 2019 IEEE Int. Conf. on Smart Manufacturing, Industrial & Logistics Engineering, Hangzhou, China, pp. 40–47. [Google Scholar]
18. H. Einarsdottir, M. J. Emerson, L. H. Clemmensen, K. Scherer, M. Bech et al. (2016). , “Novelty detection of foreign objects in food using multi-modal X-ray imaging,” Food Control, vol. 67, pp. 39–47. [Google Scholar]
19. G. Pang, C. Shen, L. Cao and A. V. D. Hengel. (2020). “Deep learning for anomaly detection: A review,” arXiv preprint arXiv:2007.02500. [Google Scholar]
20. R. Chalapathy and S. Chawla. (2019). “Deep learning for anomaly detection: A survey,” arXiv preprint arXiv: 1901. 03407. [Google Scholar]
21. D. Zimmerer, S. A. A. Kohl, J. Petersen, F. Isensee and K. H. Maier-Hein. (2018). “Context-encoding variational autoencoder for unsupervised anomaly detection,” arXiv preprint arXiv: 1812.05941v1. [Google Scholar]
22. R. Chalapathy, A. K. Menon and S. Chawla. (2018). “Anomaly detection using one-class neural networks,” arXiv preprint arXiv: 1802. 06360. [Google Scholar]
23. L. Ruff, R. Vandermeulen, N. Goernitz, L. Deecke, S. A. Siddiqui et al. (2018). , “Deep one-class classification,” in 35th Int. Conf. on Machine Learning, Stockholm, Sweden, vol. 80, pp. 4393–4402. [Google Scholar]
24. J. Deng, W. Dong, R. Socher, L. J. Li, K. Li et al. (2009). , “ImageNet: A large-scale hierarchical image database,” in 2009 IEEE Conf. on Computer Vision and Pattern Recognition, Miami, FL, USA, pp. 248–255. [Google Scholar]
25. D. Carrera, F. Manganini, G. Boracchi and E. Lanzarone. (2017). “Defect detection in SEM images of nanofibrous materials,” IEEE Transactions on Industrial Informatics, vol. 13, no. 2, pp. 551–561. [Google Scholar]
26. V. Sharan, P. Gopalan and U. Wieder. (2018). “Efficient anomaly detection via matrix sketching,” in 32nd Conf. on Neural Information Processing Systems, Montreal, Canada. [Google Scholar]
27. C. Baur, S. Denner, B. Wiestler, S. Albarqouni and N. Navab. (2019). “Deep autoencoding models for unsupervised anomaly segmentation in brain MR images: A comparative study,” in Brainlesion: Glioma, Multiple Sclerosis, Stroke and Traumatic Brain Injuries, Shenzhen, China, pp. 161–169. [Google Scholar]
28. D. P. Kingma and M. Welling. (2014). “Auto-encoding variational bayes,” in 2nd Int. Conf. on Learning Representations, Banff, AB, Canada. [Google Scholar]
29. I. J. Goodfellow, J. P. Abadie, M. Mirza, B. Xu, D. Warde-Farley et al. (2014). , “Generative adversarial nets,” in Advances in Neural Information Processing Systems, Montreal, Canada, pp. 2672–2680. [Google Scholar]
30. T. Schlegl, P. Seebock, S. M. Waldstein, U. Schmidt-Erfurth and G. Langs. (2017). “Unsupervised anomaly detection with generative adversarial networks to guide marker discovery,” in 25th Int. Conf. on Information Processing in Medical Imaging, Boone, North Carolina, USA, pp. 146–157. [Google Scholar]
31. C. Aytekin, X. Y. Ni, F. Cricri and E. Aksu. (2018). “Clustering and unsupervised anomaly detection with l2 normalized deep auto-encoder representations,” in 2018 Int. Joint Conf. on Neural Networks, Rio, Brazil, pp. 1–6. [Google Scholar]
32. P. Bergmann, S. Lowe, M. Fauser, D. Sattlegger and C. Steger. (2019). “Improving unsupervised defect segmentation by applying structural similarity to autoencoders,” in 14th Int. Joint Conf. on Computer Vision, Prague, Czech, pp. 372–380. [Google Scholar]
33. S. Akcay, A. Atapour-Abarghouei and T. P. Breckon. (2018). “GANomaly: Semi-supervised anomaly detection via adversarial training,” in Asian Conf. on Computer Vision, Perth, Australia, pp. 622–637. [Google Scholar]
34. P. Bergmann, M. Fauser, D. Sattlegger and C. Steger. (2019). “MVTec AD–-a comprehensive real-world dataset for unsupervised anomaly detection,” in IEEE/CVF Conf. on Computer Vision and Pattern Recognition, Long Beach, California, USA, pp. 9592–9600. [Google Scholar]
35. O. Ronneberger, P. Fischer and T. Brox. (2015). “U-Net: Convolutional networks for biomedical image segmentation,” in 18th Int. Conf. on Medical Image Computing and Computer-Assisted Intervention, Munich, Germany, pp. 234–241. [Google Scholar]
36. J. Long, E. Shelhamer and T. Darrell. (2015). “Fully convolutional networks for semantic segmentation,” in 28th IEEE Conf. on Computer Vision and Pattern Recognition, Boston, MA, USA, pp. 3431–3440. [Google Scholar]
37. W. Liu, D. Anguelov, D. Erhan, C. Szegedy, S. Reed et al. (2016). , “SSD: Single shot multi box detector,” in 14th European Conf. on Computer Vision, Amsterdam, Netherland, pp. 21–37. [Google Scholar]
38. S. Ren, K. He, R. Girshick and J. Sun. (2015). “Faster R-CNN: Towards real-time object detection with region proposal networks,” in Advances in Neural Information Processing Systems 28, Montreal, Quebec, Canada, pp. 91–99. [Google Scholar]
39. J. Dai, Y. Li, K. He and J. Sun. (2016). “R-FCN: Object detection via region-based fully convolutional networks,” in Advances in Neural Information Processing Systems, Barcelona, Spain, pp. 379–387. [Google Scholar]
40. K. He, G. Gkioxari, P. Dollar and R. Girshick. (2017). “MASK R-CNN” in IEEE Int. Conf. on Computer Vision, Venice, Italy, pp. 2980–2988. [Google Scholar]
41. J. Redmon, S. T. Divvala, R. Girshick and A. Farhadi. (2016). “You only look once: Unified, real-time object detection,” in 2016 IEEE/CVF Conf. on Computer Vision and Pattern Recognition, Las Vegas, Nevada, USA, pp. 779–788. [Google Scholar]
42. T. Y. Lin, P. Goyal, R. Girshick, K. He and P. Dollar. (2017). “Focal loss for dense object detection,” in IEEE Int. Conf. on Computer Vision, Venice, Italy, pp. 2999–3007. [Google Scholar]
43. M. Tan, R. Pang and Q. V. Le. (2020). “EfficientDet: Scalable and efficient object detection,” in 2020 IEEE/CVF Conf. on Computer Vision and Pattern Recognition, Virtual, June 14–19, pp. 10778–10787. [Google Scholar]
44. X. Du, T. Y. lin, P. C. Jin, G. Ghiasi, M. X. Tan et al. (2020). , “SpineNet: Learning scale-permuted backbone for recognition and localization,” in 2020 IEEE/CVF Conf. on Computer Vision and Pattern Recognition, Virtual, June 14–19, pp. 11589–11598. [Google Scholar]
45. T. Y. Lin, M. Maire, S. Belongie, L. Bourdev and R. Girshick. (2014). “Microsoft COCO: Common objects in context,” in 13th European Conf. on Computer Vision, Zurich, Switzerland, pp. 740–755. [Google Scholar]
46. S. Zhang, L. Wen, X. Bian, Z. Lei and S. Z. Li. (2018). “Single-shot refinement neural network for object detection,” in 2018 IEEE Conf. on Computer Vision and Pattern Recognition, Salt Lake, UT, USA, pp. 4203–4212. [Google Scholar]
47. J. Redmon and A. Farhadi. (2017). “YOLO9000: Better, faster, stronger,” in 2017 IEEE Conf. on Computer Vision and Pattern Recognition, Honolulu, HI, USA, pp. 6517–6525. [Google Scholar]
48. J. Redmon and A. Farhadi. (2018). “YOLOv3: An incremental improvement,” arXiv preprint arXiv: 1804. 02767. [Google Scholar]
49. S. K. Lim, Y. Loo, N. T. Tran, N. M. Ceung, C. Roig et al. (2018). , “DOPING: Generative data augmentation for unsupervised anomaly detection with GAN,” in IEEE Int. Conf. on Data Mining, Singapore, pp. 1122–1127. [Google Scholar]
50. K. Babaei, Z. Chen and T. Maul. (2018). “Data augmentation by autoencoders for unsupervised anomaly detection,” arXiv preprint arXiv: 1808. 07632. [Google Scholar]
51. N. Laptev. (2018). “AnoGen: Deep anomaly generator,” Outlier Detection De-Constructed (ODD) Workshop 2018, London, UK, August 20, . [Online]. Available: https://research.fb.com/wp-content/uploads/2018/11/AnoGen-Deep-Anomaly-Generator.pdf. [Google Scholar]
52. B. Singh, M. Najibi and L. S. Davis. (2018). “SNIPER: Efficient multi-scale training,” in Annual Conf. on Neural Information Processing Systems, Montreal, Canada, pp. 9333–9343. [Google Scholar]
53. R. Takahashi, T. Matsubara and K. Uehara. (2018). “RICAP: Random image cropping and patching data augmentation for deep CNNs,” in The 10th Asian Conf. on Machine Learning, Beijing, China, pp. 786–798. [Google Scholar]
54. Z. Zhong, L. Zheng, G. Kang, S. Li and Y. Yang. (2020). “Random erasing data augmentation,” in The 34th AAAI Conf. on Artificial Intelligence, New York, NY, USA, pp. 13001–13008. [Google Scholar]
55. N. Dvornik, J. Mairal and C. Schmid. (2018). “Modeling visual context is key to augmenting object detection datasets,” in 15th European Conf. on Computer Vision, Munich, Germany, pp. 375–391. [Google Scholar]
56. D. Dwibedi, I. Misra and M. Hebert. (2017). “Cut, paste and learn: surprisingly easy synthesis for instance detection,” in IEEE Int. Conf. on Computer Vision (ICCV 2017Venice, Italy, pp. 1310–1319. [Google Scholar]
57. K. Simonyan and A. Zisserman. (2015). “Very deep convolutional networks for large-scale image recognition,” in 3rd IAPR Asian Conf. on Pattern Recognition, Kuala Lumpur, Malaysia, pp. 730–734. [Google Scholar]
58. Y. Huang, Y. Cheng, A. Bapna, O. First, D. Chen et al. (2019). , “GPipe: Efficient training of giant neural networks using pipeline parallelism,” in Annual Conf. on Neural Information Processing Systems, Vancouver, BC, Canada, pp. 103–112. [Google Scholar]
59. L. Li, M. Verma, Y. Nakashima, H. Nagahara and R. Kawasaki. (2020). “IterNet: Retinal image segmentation utilizing structural redundancy in vessel networks,” in IEEE Winter Conf. on Applications of Computer Vision, USA: Snowmass Village, Co, pp. 3645–3654. [Google Scholar]
60. S. Orhan and Y. Bastanlar. (2018). “Training CNNs with image patches for object localisation,” Electronics Letters, vol. 54, no. 7, pp. 424–426. [Google Scholar]
61. J. Yi and S. Yoon. (2020). “Patch SVDD: Patch-level SVDD for anomaly detection and segmentation,” arXiv preprint arXiv: 2006.16067. [Google Scholar]
62. M. Rowe, N. Krishnamurthi and P. Ma. (2018). “Patch-based real time road object detection using YOLOv3,” Stanford University, CA, . [Online]. Available: https://cs230.stanford.edu/projects_fall_2018/reports/12418781.pdf. [Google Scholar]
63. T. Abe and E. Brainard. (2009). “Detection for foreign bodies in meat and meat products,” in 55th Int. Congress of Meat Science and Technology, Copenhagen, Denmark. [Google Scholar]
64. H. C. Kim, D. H. Ryu, T. G. Jeong, D. Y. Jo and H. J. Noh. (2015). X-ray apparatus for detecting a flaw of small sized article continuously. United States: Patent Application Publication. [Google Scholar]
 | This work is licensed under a Creative Commons Attribution 4.0 International License, which permits unrestricted use, distribution, and reproduction in any medium, provided the original work is properly cited. |