DOI:10.32604/cmc.2021.014498
| Computers, Materials & Continua DOI:10.32604/cmc.2021.014498 | |
| Article |
Deep Learning and Holt-Trend Algorithms for Predicting Covid-19 Pandemic
1Community College of Abqaiq, King Faisal University, Al Hofuf, Saudi Arabia
2Department of Quantitative Methods, School of Business, King Faisal University, Al Hofuf, Saudi Arabia
3Deanship of E-Learning and Distance Education, King Faisal University, Al Hofuf, Saudi Arabia
4Department of Computer Sciences and Information Technology, Albaha University, Al Bahah, Saudi Arabia
5Department of Computer Science and Information, Taibah University, Madinah, Kingdom of Saudi Arabia
*Corresponding Author: Theyazn H. H. Aldhyani. Email: taldhyani@kfu.edu.sa
Received: 24 September 2020; Accepted: 22 November 2020
Abstract: The Covid-19 epidemic poses a serious public health threat to the world, where people with little or no pre-existing human immunity can be more vulnerable to its effects. Thus, developing surveillance systems for predicting the Covid-19 pandemic at an early stage could save millions of lives. In this study, a deep learning algorithm and a Holt-trend model are proposed to predict the coronavirus. The Long-Short Term Memory (LSTM) and Holt-trend algorithms were applied to predict confirmed numbers and death cases. The real time data used has been collected from the World Health Organization (WHO). In the proposed research, we have considered three countries to test the proposed model, namely Saudi Arabia, Spain and Italy. The results suggest that the LSTM models show better performance in predicting the cases of coronavirus patients. Standard measure performance Mean squared Error (MSE), Root Mean Squared Error (RMSE), Mean error and correlation are employed to estimate the results of the proposed models. The empirical results of the LSTM, using the correlation metrics, are 99.94%, 99.94% and 99.91% in predicting the number of confirmed cases in the three countries. As far as the results of the LSTM model in predicting the number of death of Covid-19, they are 99.86%, 98.876% and 99.16% with respect to Saudi Arabia, Italy and Spain respectively. Similarly, the experiment’s results of the Holt-Trend model in predicting the number of confirmed cases of Covid-19, using the correlation metrics, are 99.06%, 99.96% and 99.94%, whereas the results of the Holt-Trend model in predicting the number of death cases are 99.80%, 99.96% and 99.94% with respect to the Saudi Arabia, Italy and Spain respectively. The empirical results indicate the efficient performance of the presented model in predicting the number of confirmed and death cases of Covid-19 in these countries. Such findings provide better insights regarding the future of Covid-19 this pandemic in general. The results were obtained by applying time series models, which need to be considered for the sake of saving the lives of many people.
Keywords: Deep learning algorithm; holt-trend; prediction Covid-19; machine learning
The Covid-19 pandemic is currently regarded as a threat to global health. Coronaviruses comprise a large number of virus species that may cause diseases in animals and humans. A number of coronaviruses are known to cause respiratory infections in humans, ranging from common colds to more severe diseases such as Middle East Respiratory Syndrome (MERS) and other Severe Acute Respiratory Syndromes (SARS). The recently discovered disease known as Covid-19 is an infectious disease that has spread throughout the world [1]. The emergence of the disease was not known prior to its outbreak in Wuhan, China, in December 2019. Fig. 1 shows how SARS-CoV, SARS-CoV2, and Covid-19 can be transmitted from various animals, such as camels, pigs, cows, rats, and bats, to humans. The most common symptoms of Covid-19 are fever, fatigue, and dry cough. Some patients may experience pain, nasal congestion, coldness, sore throat, or diarrhea. These symptoms are usually mild but develop gradually. Some people become infected with the virus without showing any symptoms or without feeling sick. Most people (80%) are likely to recover from the disease without the need for any special treatment. Approximately one in six people infected with Covid-19 develop severe symptoms. People can be infected with Covid-19 via physical contact with other infected people. The disease can be transmitted from one person to another via the small droplets that become airborne when an infected person coughs or sneezes. These droplets fall on objects and surfaces surrounding the infected person. People who touch these objects or surfaces and then touch their eyes, nose, or mouth can become infected with Covid-19. People can also develop Covid-19 if they breathe these airborne droplets. Therefore, it is important to keep a distance of nearly one meter (3 feet) from sick people.
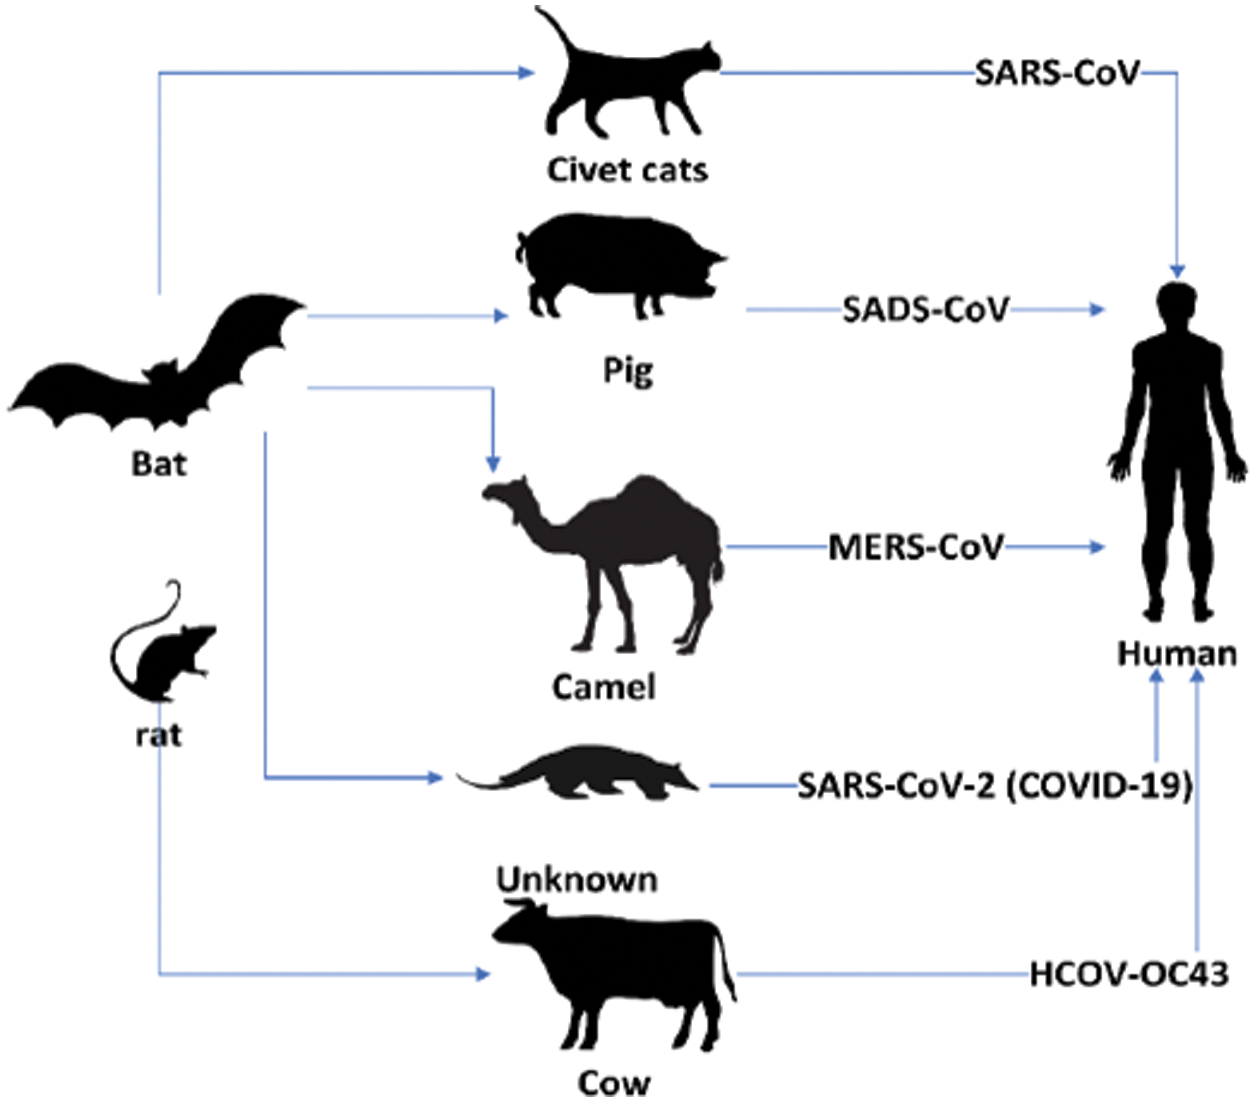
Figure 1: Covid-19 transmission from animals
This health crisis has led to significant economic repercussions due to shocks to supply and demand that differ from previous crises. Policies are needed to help economies overcome the pandemic while maintaining the integrity of the network of economic and financial relations between workers and businesses, lenders and borrowers, and suppliers and end-users so that activity can recover once the outbreak ends. The aim is to prevent such a temporary crisis from causing permanent harm to people and companies due to job loss and bankruptcy. Deaths caused by the outbreak of Covid-19 have increased at an alarming rate, while the disease continues to spread throughout many large countries. The highest priority should be to maintain people’s health and safety as much as possible. Countries can help by increasing spending to fight the virus and improve their health care systems, including spending on personal protective equipment, testing, diagnostic tests, and increasing the number of beds in hospitals. Since a vaccine has not yet been found, countries have taken actions to curb its spread. The economic impact was considerable in the countries that were most affected by the outbreak. For example, in China, activity in the manufacturing and service sectors fell sharply in February. While the fall in activity in the manufacturing sector is comparable to the beginning of the global financial crisis, the decline in the service sector appears to be greater due to the significant impact of social distancing [2].
Machine learning, deep learning, and traditional statistical models can be used to model and forecast Covid-19. In this study, we developed models that can predict the spread of Covid-19 with a high degree of accuracy. The main contribution of this paper is the use of the LSTM and Holt-Trend models to effectively predict the numbers of confirmed cases and deaths in Saudi Arabia, Italy, and Spain. The results of time series models to predict the spread of Covid-19 based on real-time data gathered from the WHO were more satisfactory. The main contributions of the present research are as follows:
1. To present the advanced time series model, namely, the LSTM deep learning model to predict the spread of Covid-19 in Saudi Arabia, Italy, and Spain.
2. To validate the proposed system and examine the reliability of the LSTM model for predicting the spread of Covid-19.
Researchers have used search queries to monitor health care systems [3–10]. Social media has also been used to predict the spread of diseases [11]. Google is one of the most used search engines for finding information about specific diseases [12,13]. From January 2004, the adjusted total search volume of data obtained from a geographic region carries a significant pattern that can help to identify many issues [14]. A number of researchers have used Google Trends to identify epidemics of infectious diseases such as influenza, chickenpox [15], and gastroenteritis [16]. Google Trends data have been utilized to predict suicide risk at a population-wide level. A number of researchers have developed models for predicting the spread of infectious diseases. Internet search queries have been utilized to predict the spread of infectious disease [17–22]. Internet search data are considered crucial for analyzing and predicting new epidemics, as most people around the world use the internet to find information on current events. According to Towers et al., internet search data can be utilized to develop an epidemic detection and surveillance system [23]. For instance, Huang et al. have proposed a generalized additive model to predict the outbreak of hand, foot, and mouth disease with search internet queries; the results of the model showed that it can detect the disease before it spreads. Big data surveillance tools have the benefit of accessibility and can detect infectious disease trends before health officials can [24]. Furthermore, social media is considered a source of information for predicting and analyzing outbreaks. Tenkanen et al. [24] reported that social media generates big data, which is relatively easy to collect and can be used freely, as the data are generated continuously in real time and with rich content [25]. Twitter data can be used to predict mental illness [26] and infectious epidemics [27–29] that can be utilized for predictions in a variety of other scientific fields [30–33]. Shin et al. [26] created an LSTM model to predict infectious disease outbreaks using Twitter data. They identified a strong relationship between Twitter data and infectious diseases and concluded that it would be possible to develop surveillance systems to predict infectious disease outbreaks using Twitter data. These studies used deep learning algorithms to predict infectious disease outbreaks [34,35]. Deep learning algorithms can be used to analyze big data [36]. A deep learning algorithm is a more powerful algorithm that can predict patterns in big data, and the results of deep learning are really satisfactory [36–38]. According to Xu et al. [33], deep learning algorithms perform better than other models, such as the generalized linear model (GLM), the least absolute shrinkage and selection operator model, and the autoregressive integrated moving average (ARIMA) model. Aldhyani et al. [39] proposed an adaptive network fuzzy inference system (ANFIS) to predict the incidence of chronic diseases using Google Trends data. Aldhyani et al. [40] presented soft clustering to apply machine learning algorithms and classify chronic diseases. The objective of the present research is to build an advanced time-series model that can predict the spread of Covid-19.
This section presents the proposed method for predicting the spread of Covid-19. Fig. 2 displays the overall framework of the proposed model. This research includes real-time data on three countries (collected from the WHO), which were used to test the model. The min–max normalization algorithm was used to normalize the data. The deep learning and Holt-Trend models were used to predict the number of confirmed cases and deaths.
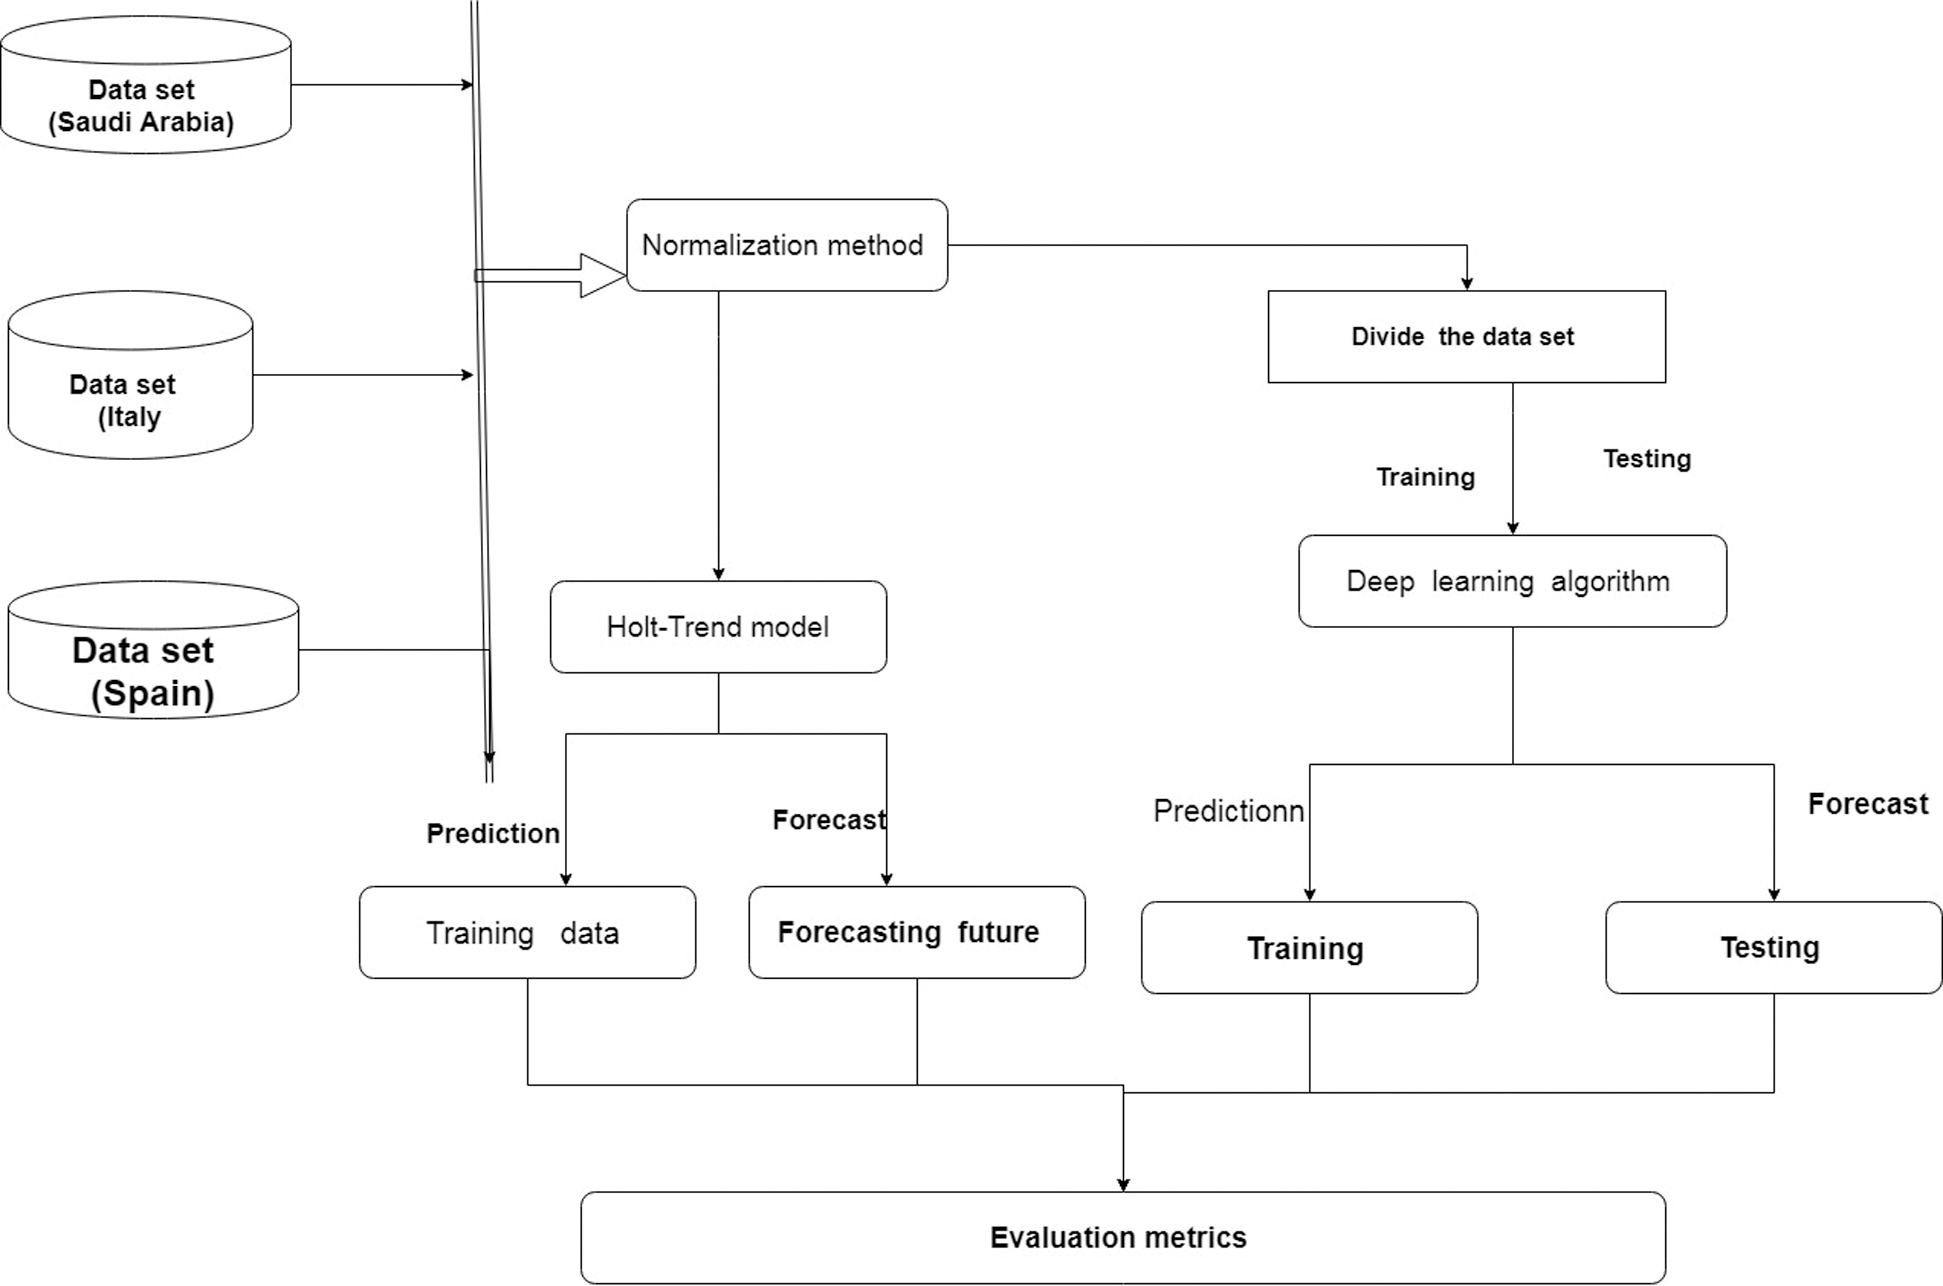
Figure 2: Framework of proposed model
Saudi Arabia, Italy, and Spain are the three countries we examined. Data for 85 days (between 21 January 2020 and 15 April 2020) were used. Confirmed cases were used to predict the future spread of Covid-19. Tab. 1 summarizes the real dataset, which comprises daily collected data [41].
Table 1: Summarize the real dataset

The min-max method was employed in MATLAB to scale the data. This method transformed data within a range of 0 to 1 scales.

where xmin is the minimum of the data and xmax is the maximum of the data. Newminx is the minimum number 0, and Newmaxx is the maximum number 1.
This section presents the models used to predict the numbers of confirmed cases and deaths in Saudi Arabia, Italy, and Spain.
2.3.1 Recurrent Neural Network (RNN)
Recurrent neural networks (RNNs) were designed in 1980 [42–44]. RNN algorithms consist of a hidden layer, an input layer, and an output layer. They have a chain-like structure for repeating cells, which are used to store significant information from previous process steps.
The hidden layer is represented by ht from input xt to output yt. Furthermore, RNNs have a recurrent loop, which loops back to the past to express that the output is not only a function of new input but also a function of the past hidden layer, and in this way, the network keeps growing. RNNs are capable of addressing the issue to explode and vanish gradient by using a loop, which allows information to persist. RNNs support the process of cell state, which helps to transmit information between cells with yt data and embeds on top of them all.
Fig. 3 displays a chunk of a neural network; xt is the input, and yt value is the output. If we loop the figure, the look value helps the information to pass from one step of the network cell to the next network cell. The loops create the RNN type of ambiguous object; as we know, RNNs are totally different from normal neural networks. An RNN comprises multiple copies of the same network in which each network passes message to a successor. Cell states within networks function much like conveyor belts; they transmit information through the entire chain. The cells have gates, which contain sigmoid functions; the output gate value and yt are subject to multiplication. The sigmoid function can take values between 0 and 1; a value of 0 refers to transition information, whereas the value refers to 1 as close to the entire information.
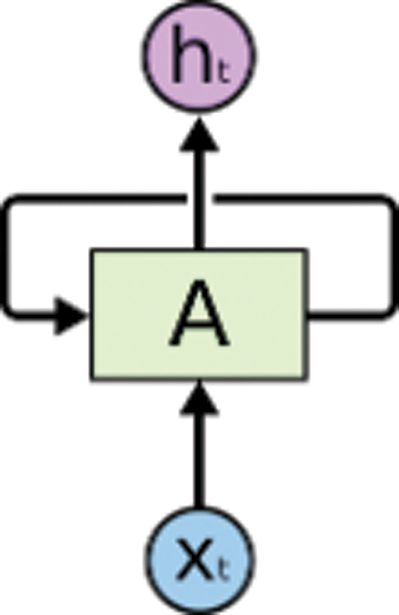
Figure 3: Chunk of a neural network
Fig. 4 shows an unrolled loop; the RNN is presented as a sequence and list. Let us consider the hidden layer yt at time step t. The LSTM cell needs to decide the cell status


where ht is the hidden layer corresponding to xt, ht −1 is the hidden state of the RNN, xt is the input data, and Ot is the output value. Whereas W, U, and V are the weight vectors of the neural networks, the bias vector of the neural network is represented by b. In order to transfer the value from the hidden layer to the output, the activation function is used. The structure of the long short-term memory cell is shown in Fig. 2. It contains a forget gate (ft), an input gate (it), an input modulation gate (mt), an output gate (Ot), a memory cell (ct), and a hidden state (ht). These gates are computed as follows:


where xt is the training input data, W and U are parameters used to adjust the weight matrices, and ht −1 is the previous hidden layer in the long short-term memory network. In order to transfer the data from input to output by the logistic sigmoid function. The hyperbolic tangent function is based on the  function, and b is the bias vector of training data. We computed the memory cell (ct) and the hidden state (ht) with the equations


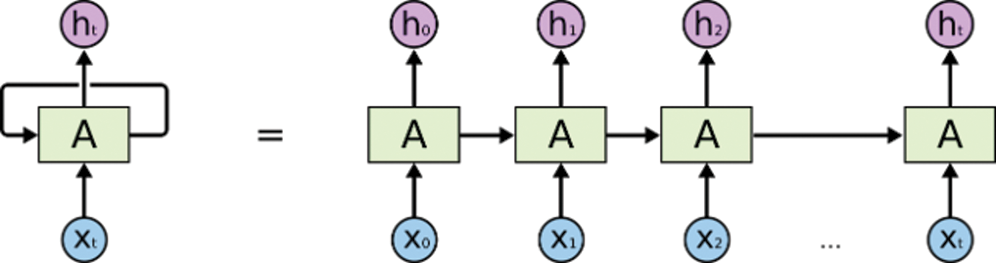
Figure 4: Displays of an unrolled loop of an RNN
Fig. 6 shows the flow steps of the LSTM model used to predict the spread of Covid-19. Tab. 2 demonstrates the significant parameters of the LSTM algorithm. Note that the parameters are significant, thus obtaining better predictions.
Table 2: Parameters of the LSTM algorithm

Exponential smoothing models are among the most important prediction approaches and are widely used in industry and commerce. The exponential smoothing method is a generalization of the moving average technique. Exponential smoothing models use stationary time-series data. The idea behind exponential smoothing is to smooth original time-series data to forecast future values. Holt-Trend Exponential Smoothing (HTES) model is similar to weighted exponential smoothing. However, it uses a trend estimator that changes over time:


where  and Ft+m is a forecast future value;
  indicates an estimate at the level of the series at time series t, and bt indicates an estimate at the trend level at time series t. The Holt-Trend Exponential smoothing method has two smoothing constants denoted by
  and
and  . There are two estimators:
  and bt −1; t −1 refers to the estimate of the level of the time series constructed at time t −1 (this is typically called the level component); bt −1 refers to the estimate of the growth rate of the time series constructed at time bt −1 (this is typically called the trend component). Fig. 5 demonstrates the Holt-Trend algorithm steps to predict the spread of Covid-19; Pi is the prediction output and fi is the forecasted future value.
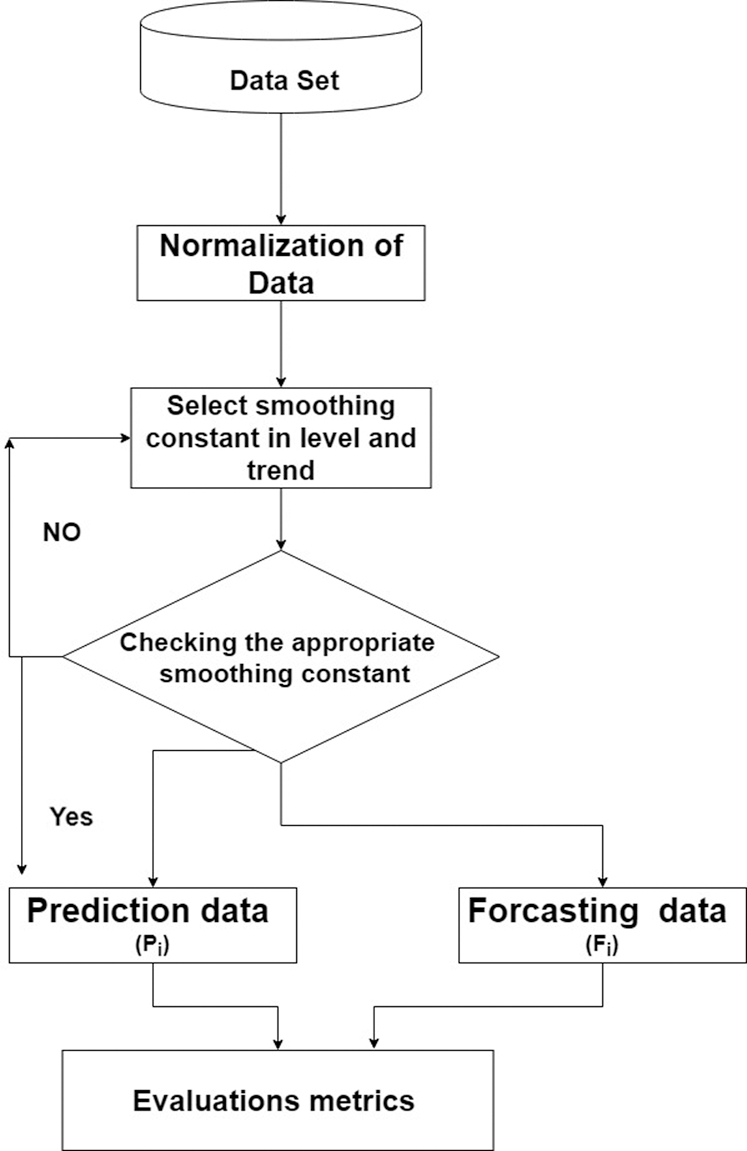
Figure 5: Flow steps of the Holt-Trend model
To evaluate the performance of the LSTM and the Holt-Trend model, mean squared error (MSE), root-mean-square error (RMSE), and mean error metrics were applied. These standard metrics have the capability to find prediction errors made by the LSTM and Holt-Trend models.

where xt is the observed response,  is the estimated response, and N is the total number of observations.

where xt is the observed response,  is the estimated response, and N is the total number of observations.

where xt is the observed response and  is the estimated response.

where r is Pearson’s correlation coefficient, x is the input value in the first set of training data, y is the input value of the second set of training data, and n is the total of simple input data.
Our analyses used WHO data for 55 days (21 January 2020 to 15 April 2020). The min–max method was applied for normalization purposes. Saudi Arabia, Spain, and Italy were used to test and evaluate the proposed model. Two advanced time series models were applied to predict confirmed cases and deaths. Two experiments, which are described below, were conducted in a specific environment in MATLAB 2018 to obtain the prediction results.
3.1 Analysis of the LSTM Model
In this section, we evaluate the performance of the LSTM deep learning approach. The deep learning algorithm is proposed, and the real dataset was divided into 80% training and 20% testing. Whereas the training data are considered self-similar predictions, the testing predicted and validated the proposed model. Evaluation metrics (MSE, RMSE, mean error, and R-values) were employed to examine and evaluate the LSTM model. Tab. 3 summarizes the results. The results of applying the LSTM model to Saudi Arabia were 0.00132, 0.0363, 0.00023, and 0.0370 with respect to MSE, RMSE, mean error, and standard deviation, respectively, in the training data; the testing results were  ,
,  , mean
  , and standard deviation
  .
.
Table 3: Results of LSTM to predict confirmed cases of Covid-19

As shown in Tab. 3, the results obtained from applying the LSTM model to Italy are the training data, and the prediction results were 0.0028, 0.01676, 2.0558e −05, and 0.0169 in terms of MSE, RMSE, mean error, and standard deviation, respectively. Note that the LSTM’s performance was higher and the prediction errors were very high compared with the Saud Arabia data. To validate and test the proposed model, we created 20 tests, and the results were as follows:  ,
,  , mean
  , and
, and  . Similarly, the LSTM model was applied to the Spain dataset. The performance of the LSTM to predict the confirmed cases in Spain are the training 0.00020, 0.01426, 3.5212e −05, and 0.01441. As for the testing, the results were the following:
  ,
,  , mean
  , and
, and  . The prediction is very low. This indicates that the LSTM model is more efficient and effective. To handle Covid-19, find out the number of confirmed cases that will be discovered in the future.
Figs. 6a–6c provide graphical information about the performance of the LSTM model; it shows that the training and testing are suitable for the regression line, which indicates that the proposed model is appropriate for predicting cases of Covid-19. The percentage value of R is very high between the observation value and the output value. The empirical results of the validation process of the LSTM model further indicate that the constructed model can achieve equally impressive performance. Tab. 4 illustrates the prediction results of the LSTM for the number of deaths in Saudi Arabia, Italy, and Spain. To validate the proposed model, we divided the data into training and testing, while the testing considered forecasting future values.

Figure 6: Scatter plot for flow in the validation confirmed cases in (a) Saudi Arabia, (b) Italy, and (c) Spain
Table 4: Results of the LSTM’s predictions of Covid-19 deaths

The prediction results obtained from the LSTM when predicting deaths in Saudi Arabia were 0.00605, 0.0778, 0.00023, and 0.082 with respect to MSE, RMSE, mean error, and standard deviation, respectively; in training, the performance of the proposed model for forecasting the number of deaths was as follows:  ,
,  ,
,  , and
, and  . The accuracy of the proposed model was similar when predicting the number of deaths in Italy:
  ,
,  , mean
  .5161e −05, and
  in the training data; however, the results of the proposed model in testing data were 0.09302, 0.305, 0.2991, and 0.0660 with respect to MSE, RMSE, mean error, and standard deviation error, respectively. The prediction results of the LSTM when predicting the number of deaths in Spain were 0.00047, 0.02178, 0.000170, and 0.0222. The results from the test dataset were 0.01355, 0.1164, 0.0364, and 0.1125. Figs. 7a–7c are regression plots showing the correlation between the observation data of the number of deaths and the prediction output. The graphical representation shows that the training and testing data fit the regression line, which indicates that the proposed model is appropriate for predicting the number of covid-19 deaths. The percentage value of correlation metrics is very high between the observation of the number of deaths and the output value. The empirical results of the validation process of the LSTM model further indicated that the constructed model can achieve equally impressive performance even if some parameters, such as the number of units or the number of input variables, have been changed. Tab. 4 shows the number of deaths obtained from the LSTM model in the testing phase. The testing phase is used to predict unseen data; the prediction results are closer to the observation data.
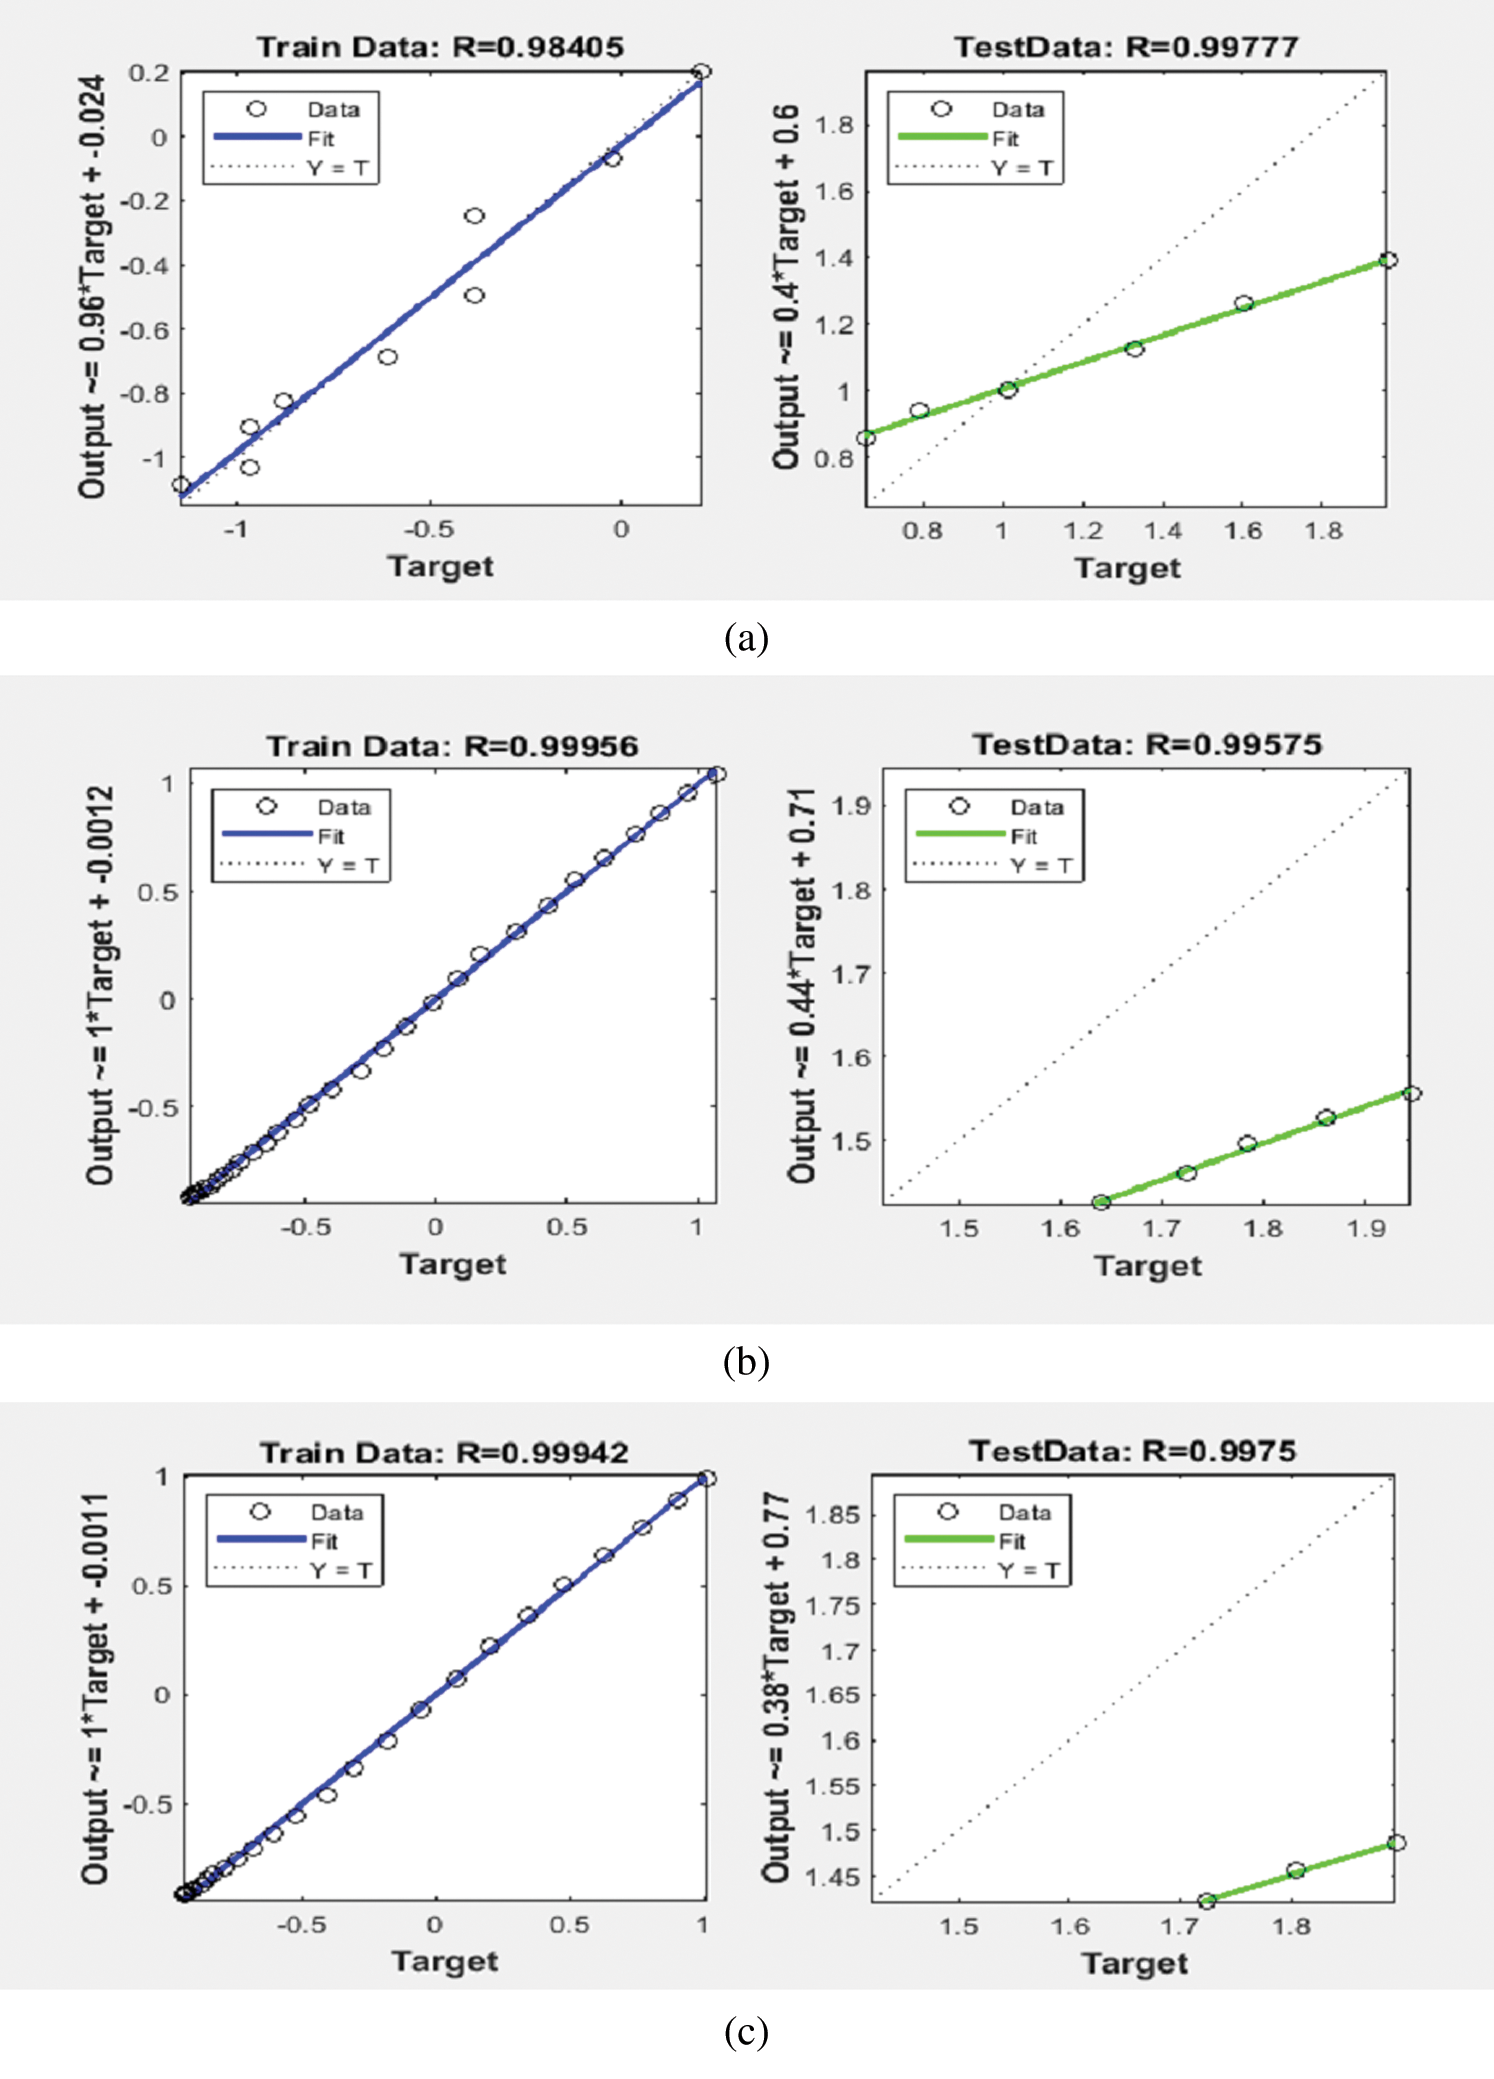
Figure 7: Scatter plots for flow in the validation death cases in (a) Saudi Arabia, (b) Italy, and (c) Spain
3.2 Analysis of the Holt-Trend Model
The Holt-Trend model is an exponential smoothing model used to predict trend data. The Holt-Trend model has two smoothing constants, one for the level and one for the trend. In these experiments, we took different parameters for the level and the trend to obtain higher predictions. The level (alpha) parameter values were 0.1, 0.5, and 0.15; the trend (beta) parameter value was 0.20. The MSE metric was used to measure the best parameters; these were  and
and  because the prediction errors were the lowest according to the standard evaluation metrics.
Tab. 5 shows the results of the Holt-Trend model’s predictions of the number of confirmed cases in the three countries. For Saudi Arabia, the results were as follows: 0.007, 0.085, and 0.0377. For Italy, the results were as follows:  .8378e −04,
  , and mean
  ; note that the prediction errors are much lower. For Spain, the results were as follows: 5.1711e −04, 0.0227, and 0.0085. The parameter values of
 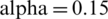 and
and  were more suitable for predicting the number of confirmed cases of Covid-19. Note that the correlation between the observed number of confirmed cases in Saudi Arabia and the prediction was 99.64%; for Italy it was 99.96%, and for Spain it was 99.94%. Overall, the Holt-Trend model has the ability to predict the numbers of confirmed cases of Covid-19 with greater accuracy. In this section, the focus is on predicting the future values for the number of confirmed cases in the three countries. We forecasted future values at intervals of one month from 15-4-2020 to 15-05-2020. The Holt-Trend model was applied to forecast future values by using observation data collected from the WHO. Figs. 8a–8c demonstrate the performance of the Holt-Trend model; the trend is going up, which indicates that the number of confirmed cases will increase. Figs. 9a–9c illustrate the prediction performance of the Holt-Trend model. It indicates that the trend is going up, which indicates that the number of confirmed cases will increase.
Table 5: Results of Holt-Trend to predict confirmed cases of COVID-19


Figure 8: Performance of the Holt-Trend model to forecast the number of confirmed cases for (a) Saudi Arabia, (b) Italy, and (c) Spain

Figure 9: Scatter plots for flow in the validation confirmed cases in (a) Saudi Arabia, (b) Italy, and (c) Spain
In this section, the Holt-Trend model is applied to predict the number of deaths in the three countries. The Holt-Trend model depends on two constant values for the level and the trend.  and
and  were selected for the same reasons as above.
Tab. 6 shows the results of the Holt-Trend model for predicting the number of deaths in three countries. For Saudi Arabia, they were as follows: 0.0030, 0.0546, and 0.0248. For Italy, the results were as follows:  .6995e −04,
 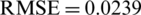 , and mean
  ; note that the prediction errors were much lower. For Spain, they were as follows: 9.3129e −04, 0.0304, and 0.0145. The parameter values of
  and
and  were more suitable for the prediction of the number of Covid-19 deaths. Figs. 10a–10c show scatterplots of correlation and time-series analysis that were applied to assess the association between the observation data and the prediction output. Cross-correlation results were obtained as product-moment correlations between the observed data and the prediction output. The time dependence between two variables was termed lag, which indicates the degree and direction of association between the observed values and the prediction values. The correlation between the observed number of deaths in Saudi Arabia and the prediction was 99.80%; for Italy it was 99.96%, and for Spain it was 99.93%. Overall, the Holt-Trend model has the ability to predict the number of Covid-19 deaths with greater accuracy.
Table 6: Results of the Holt-Trend model for predicting Covid-19 deaths

Figure 10: Scatterplot for the flow in the validation of death cases in (a) Saudi Arabia, (b) Italy, and (c) Spain
In this section, we focused on predicting the future values of the number of deaths in the three countries. We forecasted future values at a time interval of one month from 15-4-2020 to 15-05-2020. The Holt-Trend model was applied to forecast future values by using data from the WHO. Figures demonstrate the performance of the Holt-Trend to forecast the future values; the trend is going up, which indicates that the number of confirmed cases will increase. Figs. 11a–11c illustrate the prediction performance of the Holt-Trend model when forecasting the number of confirmed cases in the future. The trend is going up, which suggests that the number of confirmed cases will increase.
Figure 11: Performance of the Holt-Trend to forecast the number of deaths for (a) Saudi Arabia, (b) Italy and (c) Spain
This study applied deep learning and the Holt-Trend model to predict the risk of Covid-19 outbreaks based on real-time data collected from the WHO. The main objective of the proposed model is to predict the number of future cases and deaths. The proposed models can be used to estimate the future risk of Covid-19 outbreaks. Max–min normalization was applied to save the range of data. The algorithms were applied to predict the number of Covid-19 cases and deaths. For the LSTM algorithm, the data were divided into 80% training (used for self-prediction) and 20% testing (used for validation and future forecasting). The statistical Holt-Trend model was applied to predict the number of cases and deaths. To validate the model, we forecasted future values over a period of 30 days. The prediction results demonstrated that the LSTM and Holt-Trend models can be effectively employed to predict Covid-19 outbreaks by using real-time data gathered from the WHO. Comparative predicted results between the LSTM and Holt-Trend models were presented. The proposed models showed effective performance according to the MSE, RMSE, mean error, and correlation of increment performance measures. In addition, the LSTM and Holt-Trend models are more satisfying to predict Covid-19 cases. One limitation of this study was the lockdown. We could not meet with medical 525 experts due to the quarantine, so we collected the data from the WHO. In future work, we will use Google search terms to predict Covid-19 cases.
Funding Statement: The authors received no specific funding for this study.
Conflicts of Interest: The authors declare that they have no conflicts of interest to report regarding the present study.
1. M. A. Mohammed, K. H. Abdulkareem, A. S. Al-Waisy, S. A. Mostafa, S. Alfahdaw et al. (2020). , “Benchmarking methodology for selection of optimal Covid-19 diagnostic model based on entropy and TOPSIS methods,” IEEE Access, vol. 8, pp. 99115–99131. [Google Scholar]
2. M. Loey, F. Smarandache and M. Khalifa. (2020). “The lack of chest Covid-19 x-ray dataset: A novel detection model based on gan and deep transfer learning,” Symmetry, vol. 12, no. 14, pp. 1–19. [Google Scholar]
3. M. J. Michael. (2010). “Internet monitoring of suicide risk in the population,” Affective Disorders, vol. 122, no. 3, pp. 277–279. [Google Scholar]
4. H. Sueki. (2013). “The effect of suicide-related internet use on users’ mental health: A longitudinal study,” Crisis: The Journal of Crisis Intervention and Suicide Prevention, vol. 34, no. 5, pp. 348–353. [Google Scholar]
5. H. Sueki, N. Yonemoto, T. Takeshima and M. Inagaki. (2014). “The impact of suicidality-related internet use: A prospective large cohort study with young and middle-aged internet users,” Plos One, vol. 9, no. 4, pp. e94841. [Google Scholar]
6. H. Sueki. (2011). “Does the volume of internet searches using suicide-related search terms influence the suicide deathrate: Data from 2004 to 2009 in Japan,” Psychiatry Clinical Neuroscience, vol. 65, no. 4, pp. 392–394. [Google Scholar]
7. J. F. Gunn and D. Leste. (2013). “Using google searches on the internet to monitor suicidal behavior,” Affective Disorders, vol. 148, no. 2–3, pp. 411–412. [Google Scholar]
8. A. C. Yang, S. J. Tsai, N. E. Huang and C. K. Peng. (2011). “Association of internet search trends with suicide death Itaipei city, Taiwan, 2004–2009,” Affective Disorders, vol. 132, no. 1–2, pp. 179–184. [Google Scholar]
9. U. S. Tran, R. Andel, T. N. krotenthaler, B. Till, V. A. Gross et al. (2017). , “Low validity of google trends for behavioral forecasting of national suicide rates,” PLoS ONE, vol. 12, no. 8, pp. e0183149. [Google Scholar]
10. L. Kristoufek, H. S. Moat and T. Preis. (2016). “Estimating suicide occurrence statistics using google trends,” EPJ Data Science, vol. 32, no. 5, pp. 1–32. [Google Scholar]
11. S. X. Jiang, M. Coffee, A. Bari, J. Wang, X. Jiang et al. (2020). , “Towards an artificial intelligence framework for data-driven prediction of coronavirus clinical,” Computers Materials & Continua, vol. 63, no. 1, pp. 537–551. [Google Scholar]
12. A. F. Dugas, Y. H. Hsieh, S. R. Levin, J. M. Pines, D. P. Mareiniss et al. (2012). , “Google flu trends: Correlation with emergency department influenza rates and crowding metrics,” Clinical Infectious Diseases, vol. 54, no. 4, pp. 463–469. [Google Scholar]
13. J. Ginsberg, M. H. Mohebbi, R. S. Patel, L. Brammer, M. S. Smolinski et al. (2009). , “Detecting influenza epidemics using search engine query data,” Nature, vol. 457, pp. 1012–1014. [Google Scholar]
14. K. M. Bakker, M. E. M. Bakker, B. Helm and T. Stevenson. (2014). “Digital epidemiology reveals global childhood disease seasonality and the of immunization,” Preceding National Academy of science, vol. 113, no. 24, pp. 6689–6694. [Google Scholar]
15. C. Pelat, C. Turbelin, A. B. Hen, A. Flahault and A. J. Valleron. (2009). “More diseases tracked by using google trends,” Emerging Infectious Diseases, vol. 15, no. 8, pp. 1327–1328. [Google Scholar]
16. Y. Zhang, G. Milinovich, Z. Xu, H. Bambrick, K. Mengersen et al. (2017). , “Monitoring pertussis infections using internet search queries,” Scientific Report, vol. 57, no. 7, pp. 10437. [Google Scholar]
17. F. Rohart, G. J. Milinovich, S. M. R. Avril, K. A. Gao, S. Tong et al. (2016). , “Disease surveillance based on internet-based linear models: An australian case study of previously unmodeled infection diseases,” Scientific Report, vol. 6, no. 38522, pp. 1–11. [Google Scholar]
18. V. Lampos, A. Miller, S. Crossan and C. Stefansen. (2015). “Advances in nowcasting influenza-like illness rates using search query logs,” Scientific Report, vol. 5, no. 12760, pp. 1–10. [Google Scholar]
19. S. Cho, C. H. Sohn, M. W. Jo, S. Y. Shin, J. H. Lee et al. (2013). , “Correlation between national influenza surveillance data and google trends in South Korea,” Plos One, vol. 8, no. 12, pp. e81422. [Google Scholar]
20. Y. Teng, D. Bi, G. Xie, Y. Jin, Y. Huang et al. (2017). , “Dynamic forecasting of zika epidemics using google trends,” Plos One, vol. 12, no. 1, pp. e0165085. [Google Scholar]
21. A. F. Dugas, M. Jalalpour, Y. Gel, S. Levin, F. Torcaso et al. (2013). , “Influenza forecasting with google flu trends,” Plos One, vol. 8, no. 2, pp. e56176. [Google Scholar]
22. S. Towers, S. Afzal, S. Bernal, G. Bliss, N. Brown et al. (2015). , “Mass media and the contagion of fear the case of ebola in America,” Plos One, vol. 10, no. 16, pp. e0129179. [Google Scholar]
23. D. C. Huang and J. F. Wang. (2018). “Monitoring hand, foot and mouth disease by combining search engine query data and meteorological factors,” Science of the Total Environment, vol. 15, no. 612, pp. 1293–1299. [Google Scholar]
24. H. Tenkanen, D. Minin, E. Heikinheimo, V. Hausmann, A. Herbst et al. (2017). , “Instagram, flickr, or twitter: Assessing the usability of social media data for visitor monitoring in protected areas,” Scientific Report, vol. 7, no. 17615, pp. 1–11. [Google Scholar]
25. A. G. Reece, A. J. Reagan, K. L. Lix, P. S. Dodds, C. M. Danforth et al. (2017). , “Forecasting the onset and course of mental illness with twitter data,” Scientific Report, vol. 7, no. 13006, pp. 1–10. [Google Scholar]
26. S. Y. Shin, D. W. Seo, J. An, H. Kwak, S. H. Kim et al. (2016). , “High correlation of middle east respiratory syndrome spread with google search and twitter trends in Korea,” Scientific Report, vol. 6, no. 32920, pp. 1–10. [Google Scholar]
27. N. Thapen, D. Simmie, C. Hankin and C. Gillard. (2016). “Detecting and forecasting epidemics using novel data-analytics for enhanced response,” Plos One, vol. 11, no. 5, pp. e0155417. [Google Scholar]
28. C. Allen, M. H. Tsou, A. Aslam, A. Nagel and J. M. Gawron. (2016). “Applying GIS and machine learning methods to twitter data for multiscale surveillance of influenza,” Plos One, vol. 11, no. 7, pp. e0157734. [Google Scholar]
29. S. Volkova, E. Ayton, K. Porterfield and C. D. Corley. (2017). “Forecasting influenza-like illness dynamics for military populations using neural networks and social media,” Plos One, vol. 12, no. 12, pp. e0188941. [Google Scholar]
30. T. Simon, A. Goldberg, A. L. Daniel, D. Leykin and B. Adini. (2014). “Twitter in the cross fire the use of social media in the westgate mall terror attack in Kenya,” Plos One, vol. 9, no. 8, pp. e104136. [Google Scholar]
31. F. Xia, X. Su, W. Wang, C. Zhang, Z. Ning et al. (2011). , “Bibliographic analysis of nature based on twitter and facebook altmetrics data,” Plos One, vol. 11, no. 12, pp. e0165997. [Google Scholar]
32. R. Patel, M. Belousov, M. Jani, N. Dasgupta, C. Winakor et al. (2018). , “Frequent discussion of insomnia and weight gain with glucocorticoid therapy an analysis of twitter posts,” Digital Medicine, vol. 1, no. 20177, pp. 1–7. [Google Scholar]
33. Q. Xu, Y. R. Gel, R. L. L. Ramirez, K. Nezafati, Q. Zhang et al. (2017). , “Forecasting influenza in Hong Kong with google search queries and statistical model fusion,” PLoS ONE, vol. 12, no. 5, pp. e0176690. [Google Scholar]
34. F. He, Z. J. Hu, W. C. Zhang, L. Cai, G. Cai et al. (2017). , “Construction and evaluation of two computational models for predicting the incidence of influenza in nagasaki prefecture,” Japan Scientific Report, vol. 7, no. 7192, pp. 1–10. [Google Scholar]
35. M. M. Najafabadi, F. Villanustre, T. M. Khoshgoftaar, N. Seliya and R. Wald. (2015). “Deep learning applications and challenges in big data analytics,” Big Data, vol. 2, no. 1, pp. 2–21. [Google Scholar]
36. A. Janowczyk and A. Madabhushi. (2016). “Deep learning for digital pathology image analysis: A comprehensive tutorial with selected use cases,” Pathol Information, vol. 7, no. 29, pp. 7–29. [Google Scholar]
37. A. Esteva, B. Kuprel, R. A. Novoa, J. Ko, S. M. Swetter et al. (2017). , “Dermatologist-level classification of skin cancer with deep neural networks,” Nature, vol. 542, pp. 115–118. [Google Scholar]
38. D. Bychkov, N. Linder, R. Turkki, S. Nordling, P. E. Kovanen et al. (2018). , “Deep learning based tissue analysis predicts outcome in colorectal cancer,” Scientific Report, vol. 8, no. 3395, pp. 1–11. [Google Scholar]
39. T. H. Aldhyani, A. S. Alshebami and M. Y. Alzahrani. (2020). “Soft computing model to predict chronic diseases,” Information Science and Engineering, vol. 36, no. 2, pp. 365–376. [Google Scholar]
40. T. H. Aldhyani, A. S. Alshebami and M. Y. Alzahrani. (2020). “Soft clustering for enhancing the diagnosis of chronic diseases over machine learning algorithms,” Healthcare Engineering, vol. 2020, no. 4984967, pp. 16. [Google Scholar]
41. I. Priyadarshini, P. Mohanty, R. Kumar, L. H. Son, H. T. M. Chau, et al. (2020). “Analysis of outbreak and global impacts of the Covid-19,” Healthcare, vol. 8, no. 2, pp. 148. [Google Scholar]
42. T. H. H. Aldhyani, M. Alrasheedi, A. A. Alqarni, M. Y. Alzahrani and A. M. Bamhdi. (2020). “Intelligent hybrid model to enhance time series models for predicting network traffic,” IEEE Access, vol. 8, pp. 130431–130451. [Google Scholar]
43. M. A. Mohammed, K. H. Abdulkareem, S. A. Mostafa, K. A. Ghani, M. S. Maashi et al. (2020). , “Voice pathology detection and classification using convolutional neural network model,” Applied Science, vol. 10, no. 11, pp. 3723. [Google Scholar]
44. J. P. Subathra, M. A. Mohammed, M. S. Maashi, B. G. Zapirain, B. Sairamya et al. (2020). , “Detection of focal and non-focal electroencephalogram signals using fast walsh-hadamard transform and artificial neural network,” Sensors, vol. 20, no. 17, pp. 4952. [Google Scholar]
 | This work is licensed under a Creative Commons Attribution 4.0 International License, which permits unrestricted use, distribution, and reproduction in any medium, provided the original work is properly cited. |