DOI:10.32604/cmc.2021.014259
| Computers, Materials & Continua DOI:10.32604/cmc.2021.014259 | |
| Article |
Modeling the COVID-19 Pandemic Dynamics in Iran and China
1School of Finance, Shanghai Lixin University of Accounting and Finance, Shanghai, China
2Department of Statistics, Yazd University, Yazd, Iran
*Corresponding Author: Zubair Ahmad. Email: z.ferry21@gmail.com
Received: 09 September 2020; Accepted: 21 November 2020
Abstract: The epidemic outbreak COVID-19 was first detected in the Wuhan city of China and then spread worldwide. It is of great interest to the researchers for its high rate of infection spread and its significant number of fatalities. A detailed scientific analysis of this phenomenon is yet to come. However, it is of interest of governments and other responsible institutions to have the right facts and figures to take every possible necessary action such as an arrangement of the appropriate quarantine activities, estimation of the required number of places in hospitals, assessment of the level of personal protection, and calculating the rate of isolation of infected persons, among others. In this article, we compare the COVID-19 pandemic dynamics between the two most affected Asian countries Iran and mainland China. We provide a convenient method of data comparison that can be helpful for both governmental and private organizations to arrange the appropriate quarantine activities. Furthermore, a statistical model is suggested to provide the best characterization of the COVID-19 daily deaths data of Iran and China. By analyzing daily death events, we observed that the proposed model provides a better description of the COVID-19 events, and therefore, can be used as a good candidate model for predicting them.
Keywords: Coronavirus COVID-19 pandemic; China; Iran; mathematical modeling; statistical methods
The coronavirus disease 2019 (shortly known as COVID-19) is an infectious disease caused by severe acute respiratory syndrome coronavirus 2 (SARS-CoV-2) see [1]. This disease was first observed on 31 December 2019 in Wuhan city, Hubei province of China, and then spread globally. Some efforts to compare the epidemic dynamics in Italy and mainland China have been done in [2]. A comparison of the COVID-19 pandemic dynamics between the USA and South Korea is provided in [3]. Whereas, a comparison of the COVID-19 pandemic development between Italy and other countries has been presented in [4]. For further detail, we refer to [5–13].
In the current time, it is of significant concern to study more about COVID-19 and provide a comparison in different countries as much as possible, particularly, comparison of other countries with mainland China. In this article, an effort has been made to compare the COVID-19 pandemic outbreak of China and Iran, which are the most affected countries in the Asian region.
Here, we present a simple method to compare the pandemic dynamics of Iran and China, which shows the total number of cases, totally recovered, total deaths, and total active cases from the epidemic. The COVID-19 daily cases and daily deaths of Iran and China are presented in Fig. 1. From Fig. 1, it is clear that the number of daily cases and daily deaths in Iran are increasing over time. Furthermore, a detailed description of the total number of cases, total recovered, total deaths, and total active cases from the COVID-19 epidemic pandemic are provided in Fig. 2. The percentage of the total COVID-19 epidemic pandemic events for Iran and China are displayed in Fig. 3.
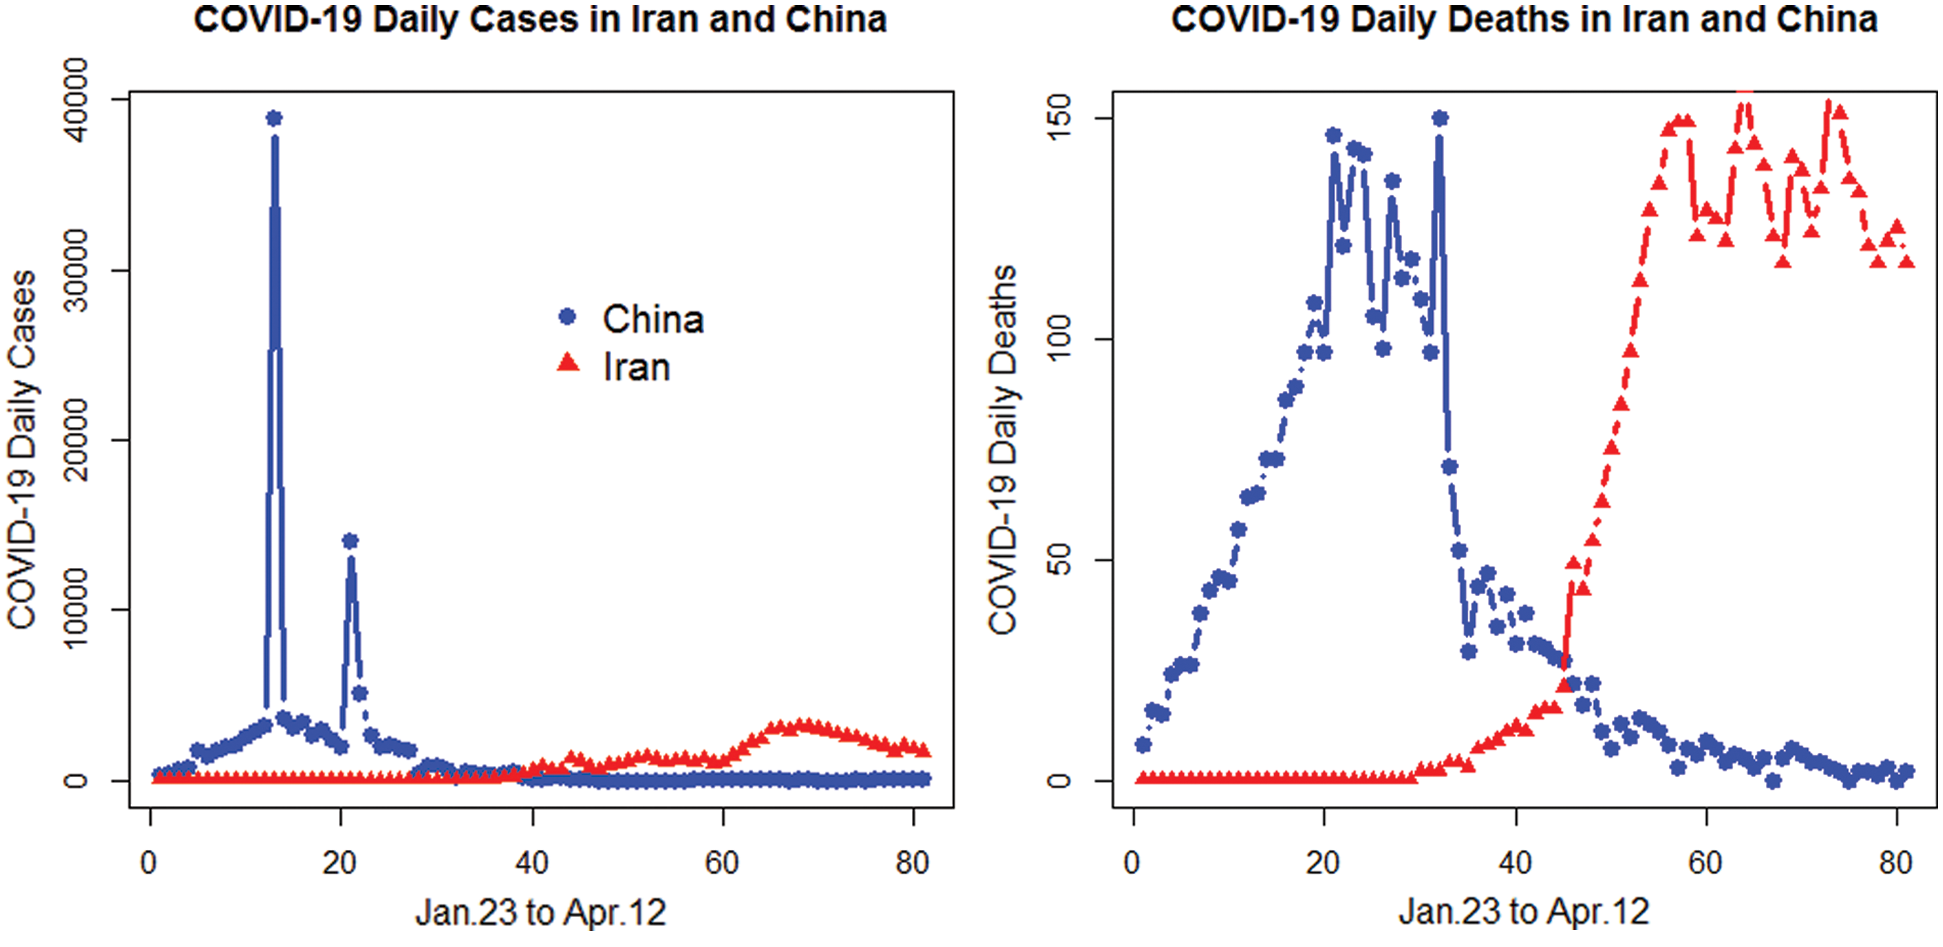
Figure 1: Plots for the COVID-19 daily cases and daily deaths in Iran and China
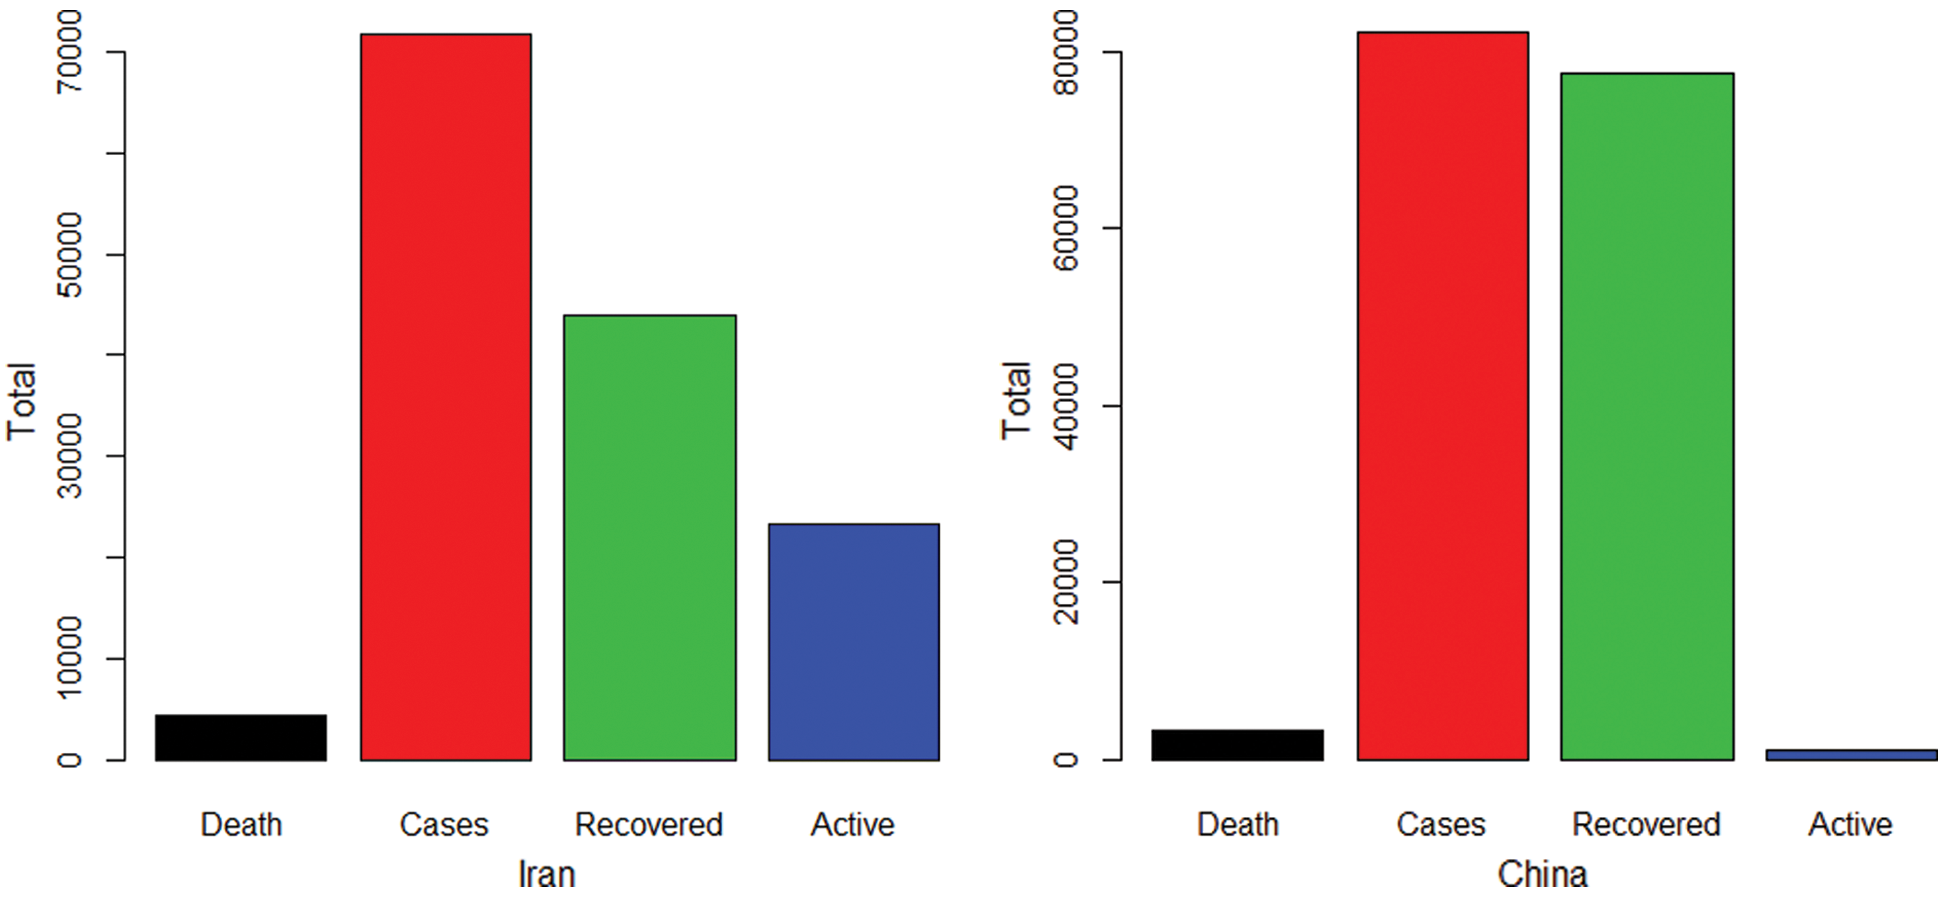
Figure 2: Plots for the COVID-19 total deaths (TD), total number of cases (TC), total recovered (TR), and total active cases (TAC) in Iran and China
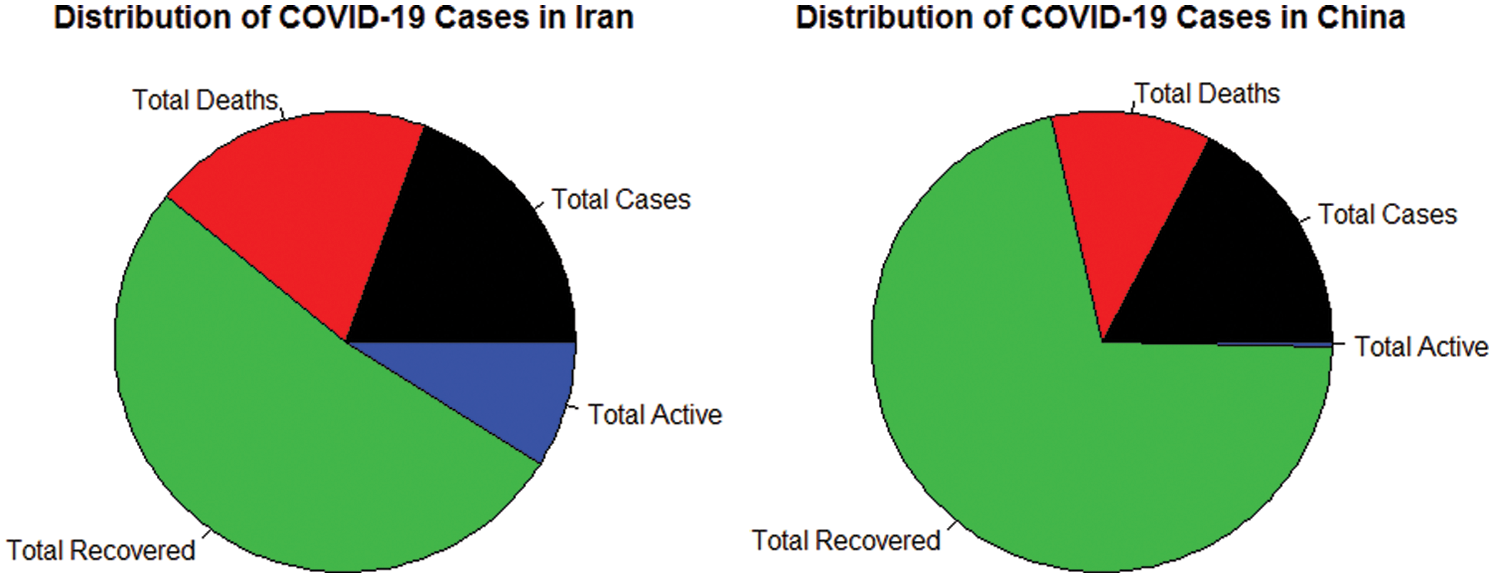
Figure 3: The percentage of the total COVID-19 epidemic pandemic events for Iran and China
The newly infected, newly recovered cases along with the outcome cases (recovery or deaths) in Iran are presented in Fig. 4.
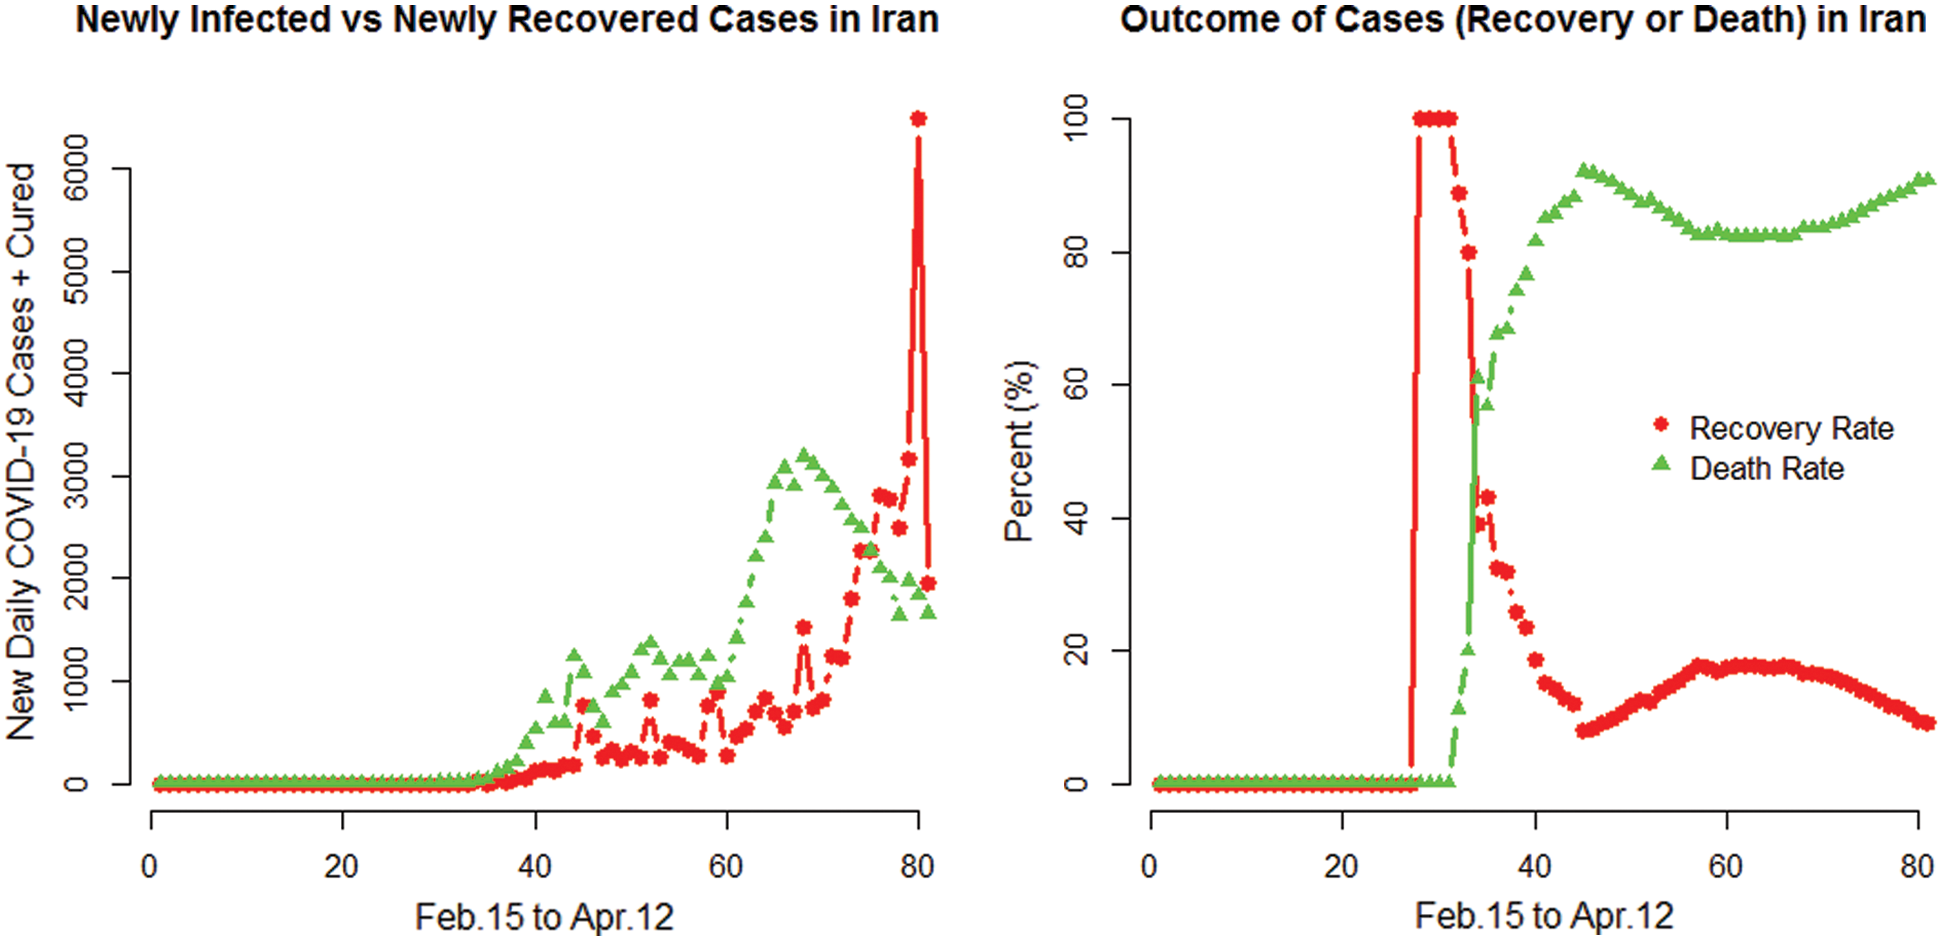
Figure 4: Plots for the COVID-19 newly infected and newly recovered cases along with the outcome cases in Iran
The newly infected and newly recovered cases along with the outcome cases (recovery or deaths) in China are presented in Fig. 5.
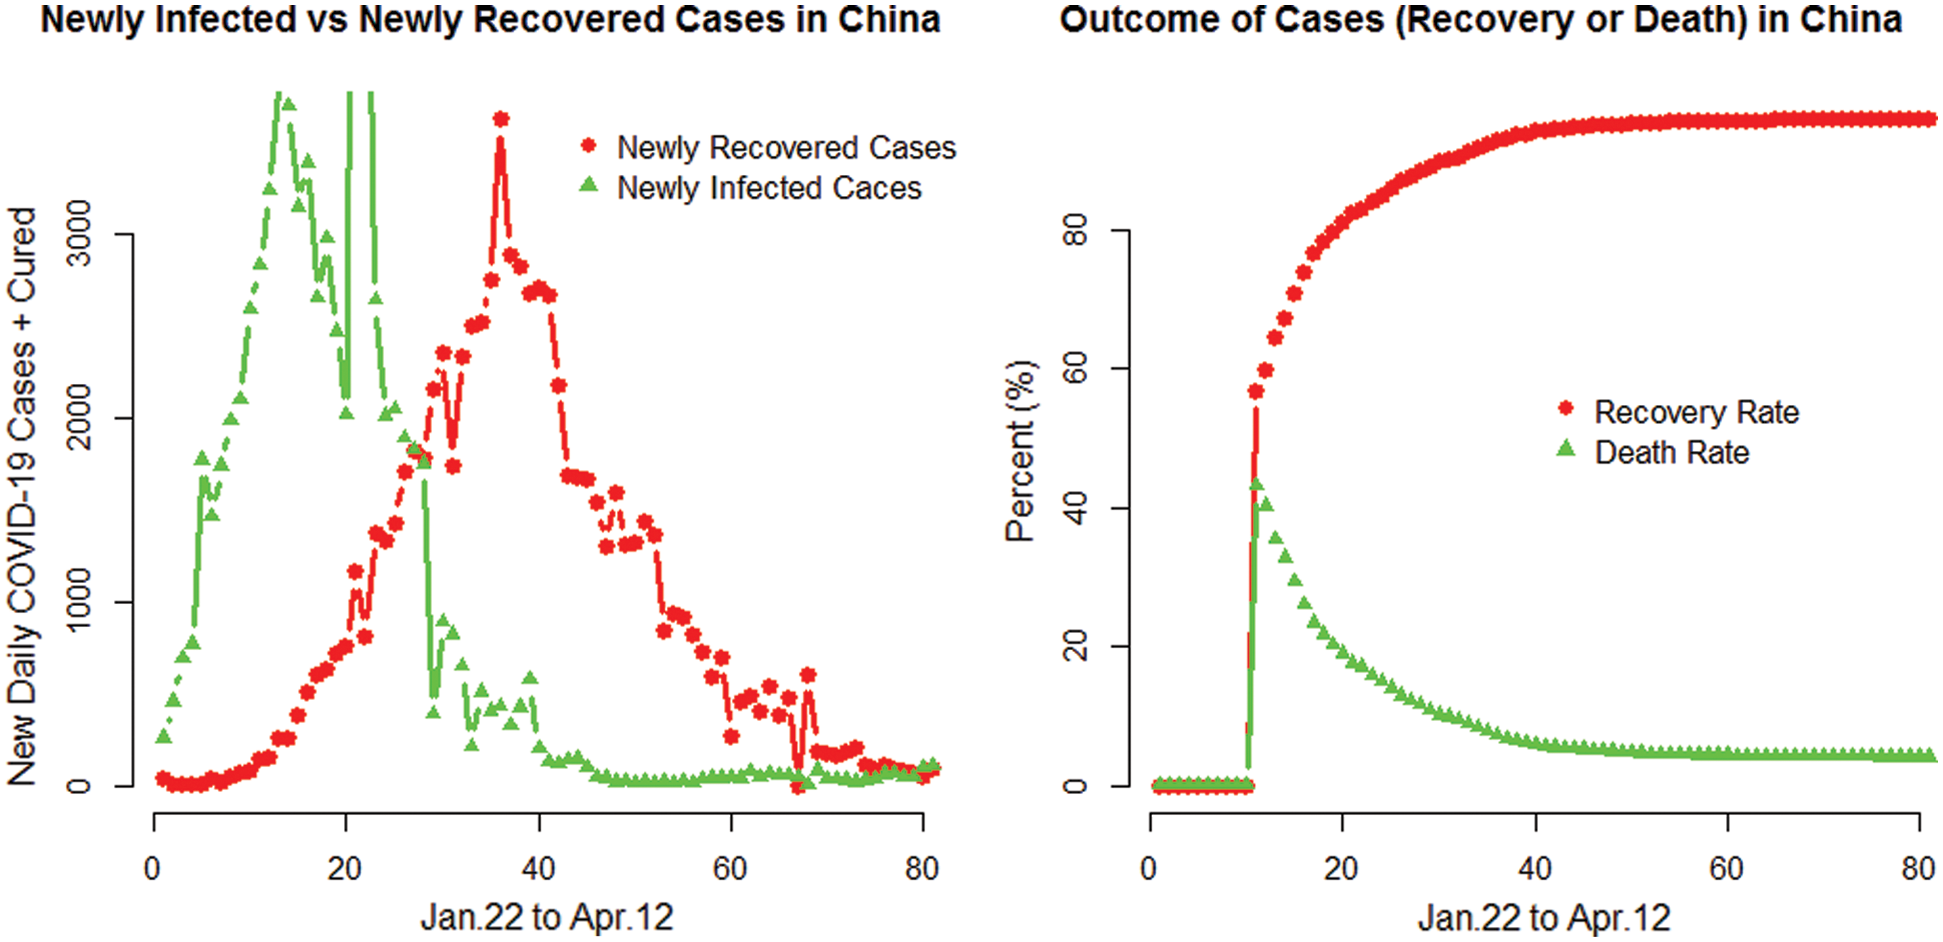
Figure 5: Plots for the COVID-19 newly infected and newly recovered cases along with the outcome cases in China
2 Proposed Family of Statistical Models
Recently, attempts have been made to propose new families of probability distributions that extend well-known families of distributions, and at the same time provide great distributional flexibility in modeling data in practice, particularly, in biological studies and environmental sciences, among others. Mainly the proposed families are introduced based on, but not limited to, the following four approaches (i) transformation method, (ii) composition of two or more distributions, (iii) compounding of distributions, and (iv) finite mixture of distributions see [14]. One such method is the T-X family approach introduced in [15]. For a brief review of the contributed work based on the T-X family approach, we refer to [16].
In this article, we use the T-X family method to propose a new class of statistical models. Let  be the distribution function of the baseline random variable may depend on the parameter vector
  . Then, a random variable say X is said to follow a new generalized-X (NG-X) family of distributions, if its cumulative distribution function (cdf) is given by

The density function corresponding to Eq. (1) is

The expression provided in Eq. (2) will be most tractable when the cdf  and the pdf
  have simple analytic expressions. Hereafter, a random variable X with density function given in Eq. (2) is denoted by
  . The primary aim of this article is to propose a new class of statistical distributions to provide a better description of the COVID-19 daily deaths data of Iran and China.
The two-parameter Weibull distribution  has pdf, cdf, survival function (sf), hazard rate function (hrf), and cumulative hazard rate function (chrf) are given by
  ,
,  ,
,  and
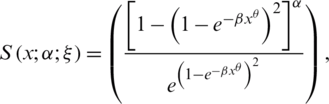
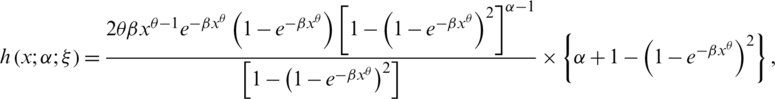
and  , respectively. Then, the cdf and pdf of the new generalized-Weibull (NG-Weibull) distribution are given by
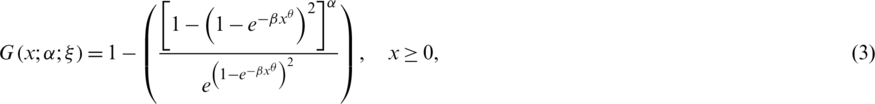
and
respectively.
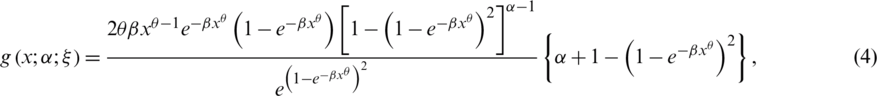
For different values of the model parameters, plots for the density function of the NG-Weibull model are sketched in Fig. 6.
Figure 6: Plots for the density function of the NG-Weibull distribution
For x > 0 the sf, hrf and chrf of the NG-Weibull distribution are given by
and
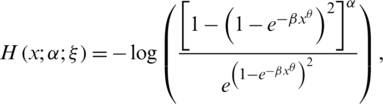
respectively.
In this section, we discuss some of the properties of the NG-X family.
This subsection deals with the discussion about the identifiability of the NG-X distributions. Let  and
and  be the two parameters having distribution functions
  and
and  , respectively. From the definition of identifiability, we have
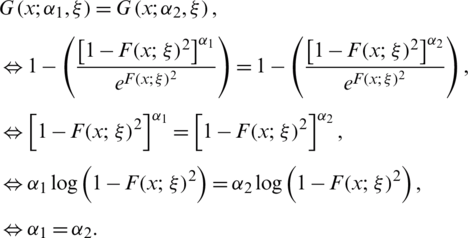
Hence the parameter  is identifiable.
The quantile function of the NG-X distributed random variable can be obtained by inverting 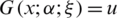 , in Eq. (1), we obtain

where, t is the solution of  , and u has the uniform distribution on the interval (0, 1).
The effects of the shape parameters on the Skewness and Kurtosis can be detected using the quantile measures. Here, we obtain the Skewness and Kurtosis measures of the proposed family using Eq. (5). The Bowleys Skewness measure is given by
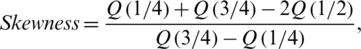
whereas, the Moor’s Kurtosis measure is
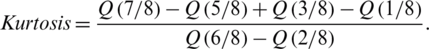
Plots of the Skewness and Kurtosis of the NG-Weibull distribution are presented in Fig. 7.
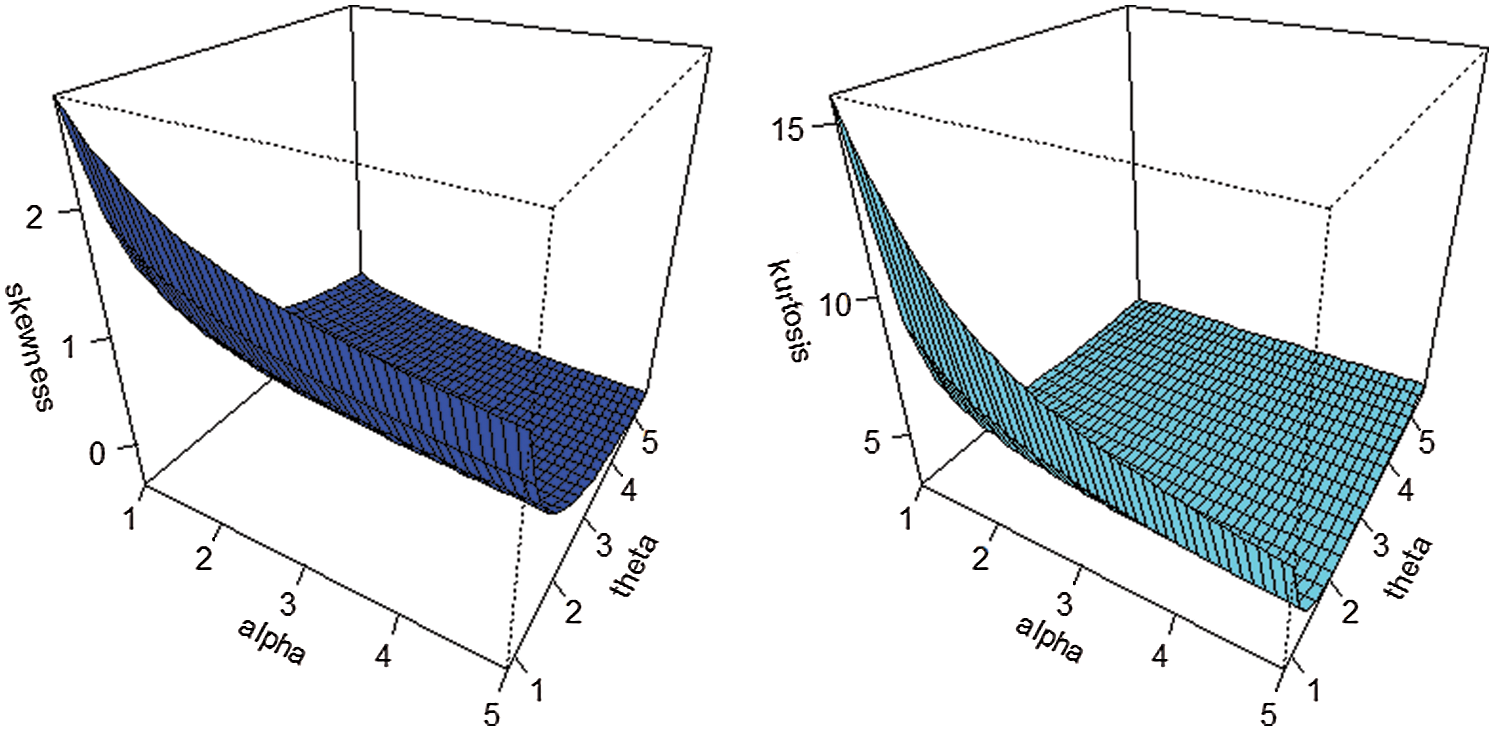
Figure 7: Plot of the NG-Weibull Skewness and Kurtosis for  and different values of
  and
and 
Here, we derive some kinds of moments for the NG-X family. For the sake of simplicity, we omit dependency of  and
and  on the parameters
  , and use
  and
and  . The density function provided in Eq. (2) can be represented as follows:

By using the density and distribution functions of the Weibull model in Eq. (6), we obtain

where 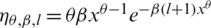 . For any positive integer r, the rth moment of the NG-Weibull distribution is given by

On using Eq. (7) in Eq. (8), we get the rth moment of the NG-Weibull distribution. For  we get the first four moments of the NG-X distributions. Plots for the mean and variance of the NG-Weibull distribution are displayed in Fig. 8.
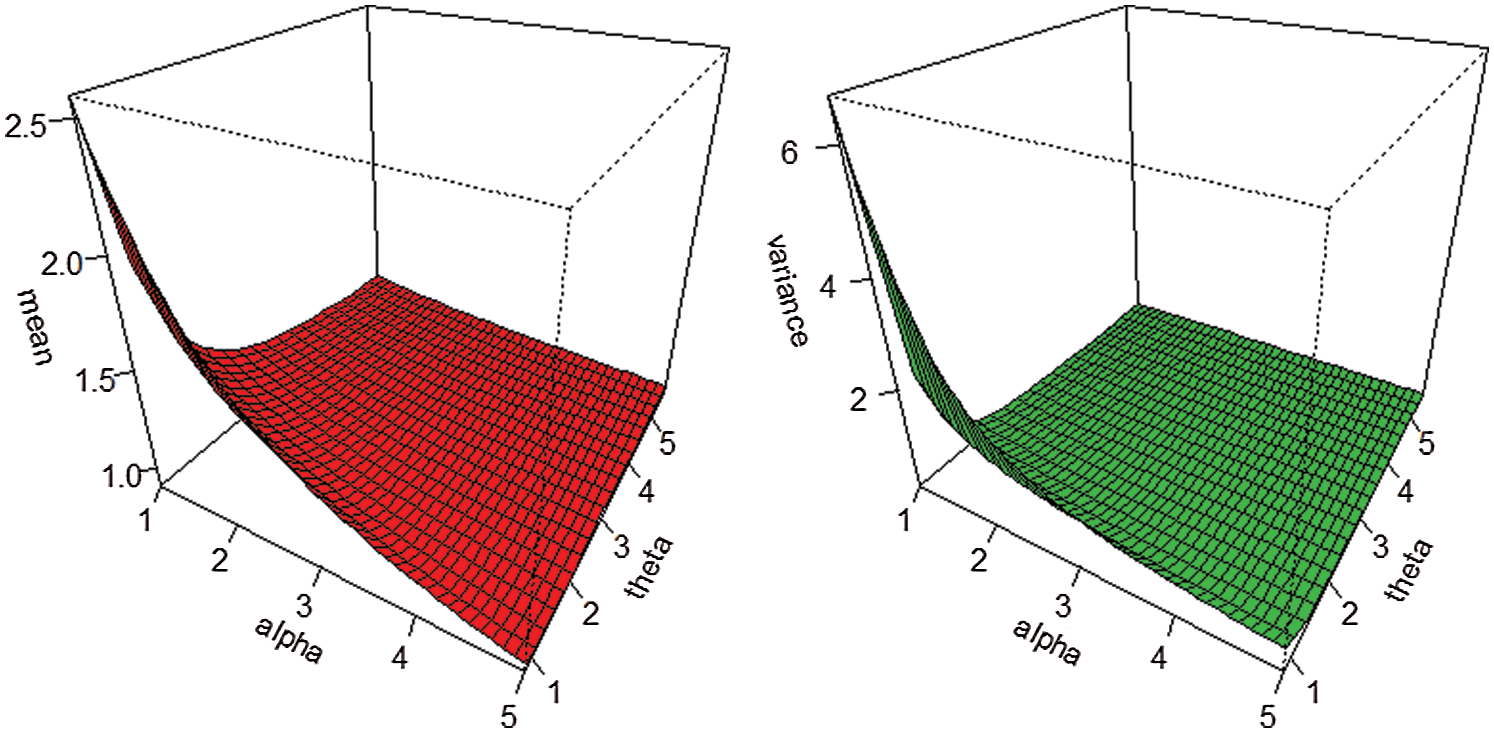
Figure 8: Plots of the NG-Weibull mean and variance for  and different values of
  and
and 
Furthermore, with t > 0, we have the following result

where 
Several crucial conditional moments can be obtained using the integral  for various values of r. For any t > 0, The rth conditional moment of X is given by
The mean deviations of X about the mean, say  is given by
where 
The mean deviations of X about the median, say M is given by
The residual life parameters can also be determined using
 and
and  , for several values of r. In particular, the mean residual life is defined as
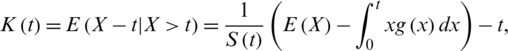
and the variance residual life is given by

The mean reversed residual life is defined as
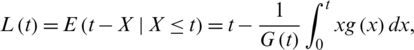
and the variance reversed residual life is defined as

5 Modeling the COVID-19 Daily Deaths in Iran and China
As we stated above that a brief statistical analysis of the COVID-19 events is yet to come. However, now it is immediately needed to propose a suitable model to provide a better description of the COVID-19 events such as daily cases, total cases, daily deaths, total deaths, etc., to get a reliable estimate of the quarantine activities.
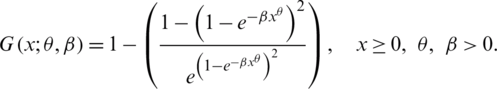
In this section, we model the COVID-19 daily death data that have occurred in Iran and China up to April 12, 2020. The proposed NG-Weibull distribution is applied to this data compared to another prominent extension of the Weibull model called the new flexible extended-Weibull (NFE-Weibull) distribution. The distribution function of the NFE-Weibull is given by
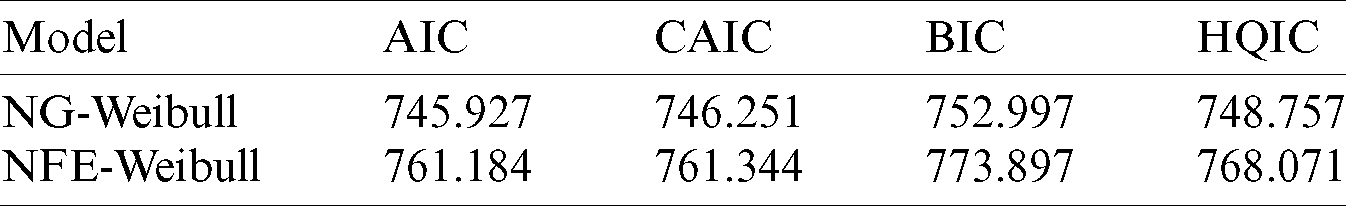
To know which distribution, provide the best fits to data, we consider specific discrimination measures such as Akaike information criterion (AIC), Corrected Akaike Information Criterion (CAIC), Bayesian information criterion (BIC), and Hannan-Quinn information criterion (HQIC). The maximum likelihood estimates of the model parameters for the Iranian COVID-19’s daily death data are provided in Tab. 1. The discrimination measures for the Iranian COVID-19’s daily death data are presented in Tab. 2. The maximum likelihood estimators of the model parameters for the Chinese COVID-19’s daily death data are provided in Tab. 3. The discrimination measures for the Chinese COVID-19’s daily death data are presented in Tab. 4. Based on the discrimination measures, we observed that the proposed model can be used quite effectively to provide the best description of the COVID-19 events.
Table 1: The estimates of the model parameters for the Iranian COVID-19’s daily death data
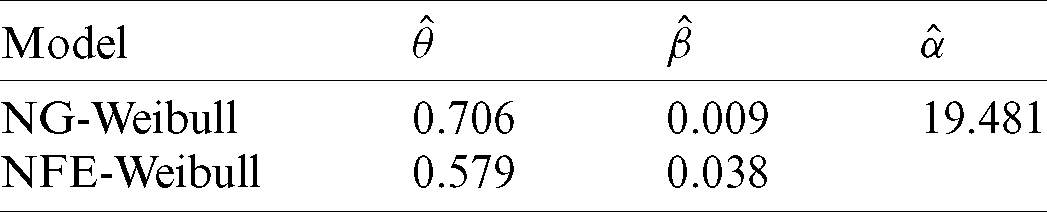
Table 2: The discrimination measures of the models for the Iranian COVID-19’s daily death data
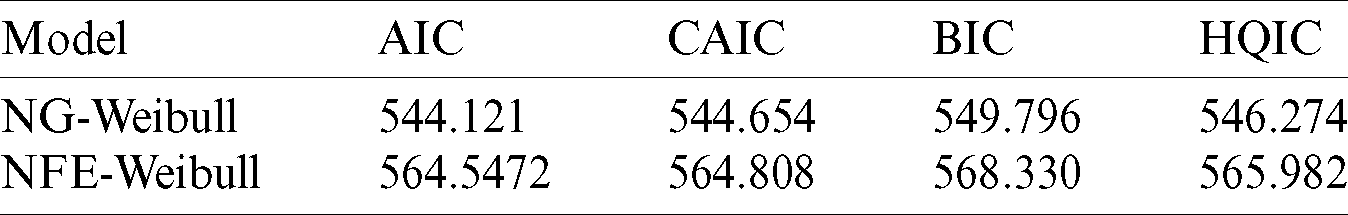
Table 3: The estimates of the model parameters for the Chinese COVID-19’s daily death data
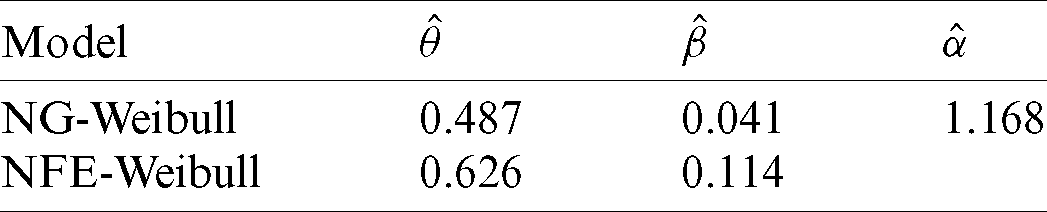
Table 4: The discrimination measures of the models for the Chinese COVID-19’s daily death data
To show how closely the proposed model fits the COVID-19 daily deaths data, we considered a well-known statistical tool called probability-probability (PP) plot. The PP plots of the NG-Weibull model for the COVID-19 daily deaths data in Iran and China are provided in Fig. 9. From Fig. 9, we can see that the proposed model provides a close fit to the COVID-19 daily deaths data.
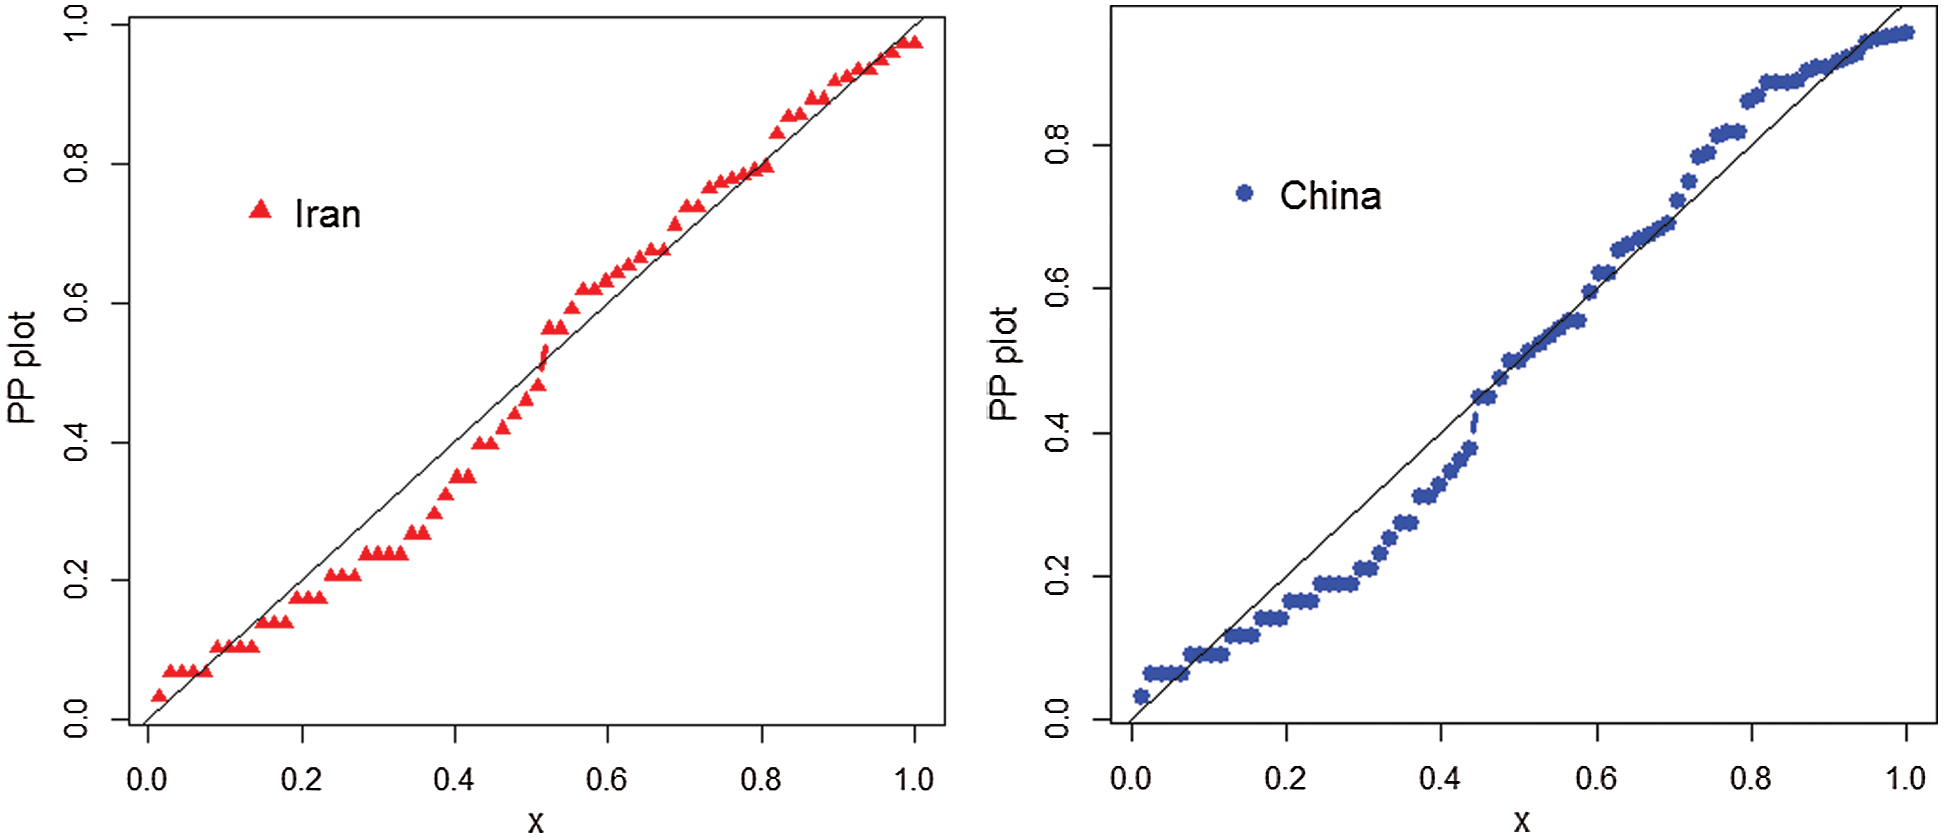
Figure 9: PP plots for the COVID-19 daily deaths data in Iran and China
REMARKS: In this paper, we have introduced a new class of statistical distributions that can be used to model the events that have taken place due to COVID-19 pandemic dynamics. We just provided a platform for the researchers to use our suggested model. We do expect that the new researchers will utilize our model to use it for such and other related purposes.
The situation with the coronavirus pandemic in Iran is very threatening. The proposed method of epidemic dynamics comparison can be used to evaluate the actual situation. Everyone can update the presented figures and check the development of Iran, China, and other neighboring countries. Furthermore, we introduced a new family of statistical models to provide the best description of the COVID-19 events. We applied the proposed method to the COVID-19 daily deaths data of Iran and China and observed that the proposed model fit the COVID-19 daily deaths data very closely.
Availability of Data and Materials: The data sets used in this paper are provided within the main body of the manuscript.
Funding Statement: This study is supported by the Department of Statistics, Yazd University, Iran.
Conflicts of Interest: The authors declare that they have no conflicts of interest to report regarding the present study.
1. V. M. Corman, O. Landt, M. Kaiser, R. Molenkamp, A. Meijer et al. (2020). , “Detection of 2019 novel coronavirus by real-time RT-PCR,” Eurosurveillance, vol. 25, pp. 1–18. [Google Scholar]
2. I. Nesteruk. (2020). “Comparison of the coronavirus epidemic dynamics in Italy and mainland China,” [Preprint] research gate, pp. 1–7. [Google Scholar]
3. I. Nesteruk. (2020). “Comparison of the coronavirus pandemic dynamics in Europe, USA and South Korea,” MedRxiv, vol. 2020, pp. 1–6, , 2020. [Google Scholar]
4. I. Nesteruk. (2020). “Coronavirus epidemic outbreak in Europe: Comparison with the dynamics in mainland China,” KPI Science News, vol. 1, pp. 15–17. [Google Scholar]
5. H. G. Hong and Y. Li. (2020). “Estimation of time-varying reproduction numbers underlying epidemiological processes: A new statistical tool for the COVID-19 pandemic,” PLoS One, vol. 15, pp. 1–18. [Google Scholar]
6. I. Nesteruk. (2020). “Simulations and predictions of COVID-19 pandemic with the use of SIR model,” Innovative Biosystems and Bioengineering, vol. 4, pp. 110–121. [Google Scholar]
7. I. Nesteruk. (2020). “Statistics-based predictions of coronavirus epidemic spreading in mainland China,” Innovative Biosystems and Bioengineering, vol. 4, pp. 3–18. [Google Scholar]
8. L. Ying, A. A. Gayle, A. Wilder-Smith and J. Rocklöv. (2020). “The reproductive number of COVID-19 is higher compared to SARS coronavirus,” Journal of Travel Medicine, vol. 27, pp. 1–16. [Google Scholar]
9. M. Zuo, S. K. Khosa, Z. Ahmad and Z. Almaspoor. (2020). “Comparison of COVID-19 pandemic dynamics in Asian countries with statistical modeling,” Computational and Mathematical Methods in Medicine, vol. 2020, pp. 1–16. [Google Scholar]
10. D. Langemann, I. Nesteruk and J. Prestin. (2016). “Comparison of mathematical models for the dynamics of the Chernivtsi children disease,” Mathematics and Computers in Simulation, vol. 23, pp. 68–79. [Google Scholar]
11. Y. Chen, J. Cheng, Y. Jiang and K. Liu. (2020). “A time delay dynamical model for outbreak of 2019-nCoV and the parameter identification,” Journal of Inverse and Ill-Posed Problems, vol. 28, no. 2, pp. 243–250. [Google Scholar]
12. B. F. Maier and D. Brockmann. (2020). “Effective containment explains sub exponential growth in recent confirmed COVID-19 cases in China,” Science, vol. 368, pp. 742–746. [Google Scholar]
13. S. A. Sarkodie and P. A. Owusu. (2020). “Investigating the cases of novel coronavirus disease in China using dynamic statistical techniques,” Heliyon, vol. 6, no. 4, pp. 1–5. [Google Scholar]
14. Z. Ahmad, E. Mahmoudi, G. G. Hamedani and O. Kharazmi. (2020). “New methods to define heavy-tailed distributions with applications to insurance data,” Journal of Taibah University for Science, vol. 14, pp. 359–382. [Google Scholar]
15. A. Alzaatreh, C. Lee and F. Famoye. (2013). “A new method for generating families of continuous distributions,” Metron, vol. 71, pp. 63–79. [Google Scholar]
16. Z. Ahmad, G. G. Hamedani and N. S. Butt. (2019). “Recent developments in distribution theory: A brief survey and some new generalized classes of distributions,” Pakistan Journal of Statistics and Operation Research, vol. 15, no. 1, pp. 87–110. [Google Scholar]
 | This work is licensed under a Creative Commons Attribution 4.0 International License, which permits unrestricted use, distribution, and reproduction in any medium, provided the original work is properly cited. |